

Summary
Parallel processing of laboratory tests across more than one instrument platform:
Permits dealing with increasing workloads
But broadens uncertainty of measurement
Minimising measurement uncertainty means keeping assay performances continuously aligned
Important questions are:
Why is there the need to demonstrate “acceptable alignment” between methods/instruments?
What methods/tools can be used to test method/instrument alignment and how adjustments can be made?
What is an "acceptable" alignment?
How often should alignments be checked and what is the reasoning for this?
Introduction
Increasing age of the population and strong population growth have combined to produce a significant increase in demand for pathology services. Along with these demographic trends, various economic factors have driven work-place amalgamations, downsizing of the pathology workforce and increased deployment of automation and platform consolidation. Consequently large scale pathology providers have emerged, handling very large and ever-increasing workloads. A common laboratory model is based on a network with a very large central laboratory which performs all the expanded testing needs of the network, and several satellite or regional laboratories which perform routine and stat testing.
With these increases in testing workloads, parallel processing of laboratory tests across one or more instrument platforms or testing modules has emerged as an essential coping strategy. However, along with parallel processing comes an inevitable broadening in the uncertainties of the measurements achieved. Assessing and keeping assay performances continuously and adequately aligned is a major challenge. The following questions are pertinent.
Question 1: Do we need to demonstrate “acceptable” alignment between methods/instruments?
If a pathology provider constitutes a group of laboratories (e.g. a Central Laboratory linked to a group of Regional Laboratories) then at some point the Regional Laboratories may send in their routine requests into the Central Laboratory to complete their testing. This may occur when requests arise out of hours for the Regional Laboratory, or when their analysers are out of action. Even within a single laboratory, workloads often now require the use of multiple instruments to guarantee throughput and resilience.
If the analysers/methodologies that are in place at the Regional Laboratories differ from those in use at the Central Laboratory then an “acceptable alignment” between the main laboratory results and those achieved at the Regional Laboratories is required.
Some argue that this is unnecessary if different methods have specific reference ranges that are appropriate to their method. But this viewpoint only holds when a patient is being screened for the presence of pathology or to make a diagnosis. For monitoring purposes “acceptable alignment of performances” between the Central Laboratory and Regional Laboratory assures that any apparent increase or decrease (outside of the Reference Change Value)1 reflects a change in the patient’s condition and/or response to therapy.
Question 2: What methods/tools can be used to demonstrate method/instrument alignment?
There are several tools that can be employed to demonstrate the alignment of performances between methods. These include:
Patient comparison studies
Comparison of internal quality control (QC) performances
Patient sample exchanges
External quality assessment (EQA) reports
Patient Comparison Studies
When methods/instruments are introduced into an organisation, laboratories generally undertake a “comparison of methods study”.2 This involves the analysis of patient samples on both the new analyser and the reference analyser (or the Central Laboratory analyser and the Regional Laboratory analyser). Ideally there should be an even distribution of results across the measuring range, and the number of samples measured should be sufficient to assure that descriptive statistics will be robust.
Analysis of the data by regression analysis (Least Squares, Deming or Passing-Bablok) generally produces a regression equation in the form of y = mx + c. From this equation an understanding of the alignment of the two methods can be gained.
If the demonstrated relationship between the two methods exceeds the boundaries defined as “acceptable alignment” (refer to Section on acceptable alignment) a corrective slope and/or offset can be derived and applied. For example, if for a particular analyte the relationship is: Regional Laboratory = 0.85 Central Laboratory + 21, then the following slope and intercept adjustments can be applied to the Regional Laboratory’s results to align them with the Central Laboratory:
Slope of 1/0.85 (1.18 )
Offset (or intercept) of −21/0.85 (−25)
Before such factors are applied however, it must be recognised that any single study itself may have errors associated with it possibly leading to further misalignment. Accordingly before a comparison of methods is conducted, both the Central Laboratory and Regional Laboratory need to have demonstrated that their performances were in control, say within 1 standard deviation (SD) of the mean for any internal QC or verifier that is normally used. Alternatively, repeating the studies on a separate day tests the reliability of the factors derived. It should be emphasised that all testing variables (e.g. reagents, calibrators, QC and instrument maintenance) should be optimised before the studies are conducted.
In addition handling of the samples should be optimised to rule out possible bias attributable to pre-analytical causes. If “sample splits” (i.e. sets of identical aliquots) are made, they can be run in “real time” using one set of aliquots at each site.
Internal QC Performance
Many pathology providers implement the same internal QC materials and lot numbers within their Regional Laboratories as in their Central Laboratories. This approach provides these laboratories with the important advantage of having a ready made “internal peer group” to compare performances against, as well as delivering the benefits of cost efficiencies.
Once methods between the Central Laboratory and the Regional Laboratories have been suitably aligned (e.g. by using the comparison of method studies), target values for internal QC can be assigned. For laboratories using the same instrument/method type – the same QC targets and limits can often be applied. However, for instruments and methods that differ, different targets and limits are often required. This is especially the case for ‘Type B analytes’, such as proteins and hormones, for which the QC material may not be commutable between methods.
Thereafter, the ongoing stability of the methods at each site or on each analyser can be assured by observing the recovery of the assigned QC values. Figure 1 highlights results from internal QC performances for parallel analysis of calcium across three Modular (Roche Diagnostics, Sydney, Australia) systems. Each Modular uses the same QC target and limit. This allows a quick and easy visual assessment of ongoing inter-instrument alignment.
Figure 1.
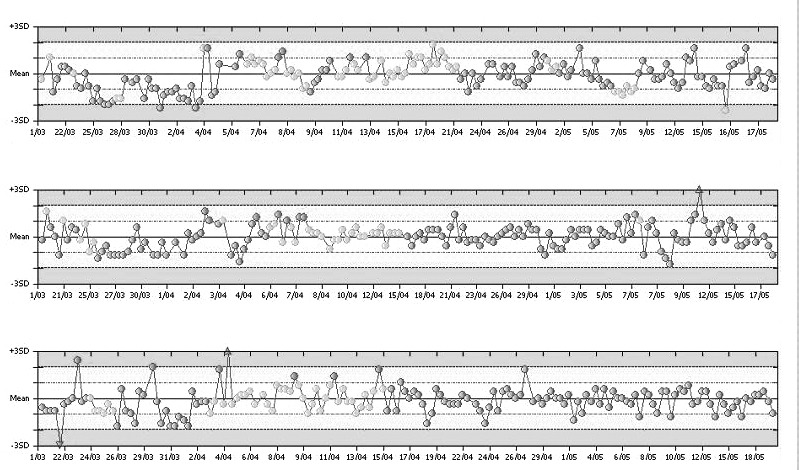
Parallel analysis of calcium across three Roche Modular Systems shown in Levey-Jennings plots. The same targets (fixed mean calcium: 2.09 mmol/L) and standard deviation limits (SD: 0.05 mmol/L) apply. The cumulative mean calcium varies between 2.05 and 2.06 mmol/L across the three analysers.
If values shift (e.g. following a reagent/calibrator lot change or re-standardisation) then a patient comparison study should be re-conducted to test the need to revise corrective factors and internal QC targets.
Internal Quality Assurance
Some laboratories, including the laboratory in which I work, conduct a periodic (e.g. monthly) “patient sample based” exchange program between the Central Laboratory and the Regional Laboratories. We call this our “Internal Quality Assessment” Program (IQAP). This allows the ongoing assessment of the Regional Laboratories’ alignments to the Central Laboratory.
There are different versions of how such a program can be run, namely:
Aliquots of uniquely prepared sample pools (or preferably single-patient specimens) are distributed from the Central Laboratory to each of the Regional Laboratories for analysis at a predetermined time, and results are compared.
Alternatively, the Regional Laboratories can send in a sample to the Central Laboratory for analysis within a reasonable time of arrival (i.e. same-day / next-day), and results are compared.
The former has the advantage of the same sample being run across the network. Thereby assessments about performance are being made at the same concentration levels. However, there is an overhead in the preparation and distribution of the pools and regulating the analysis time-frame to achieve comparable analyte stabilities. In contrast, the latter method places fewer demands on the Central Laboratory, and in the author’s experience achieves much the same inferences about performance even though different samples are used for different labs; it also has the advantage of greater variation of analyte concentrations.
In each case, the Central Laboratory issues a report indicating whether the Regional Laboratories’ recoveries are acceptable (Figure 2). In my own laboratory, we define an acceptable difference from the Central Laboratory as being within one Allowable Limit of Performance (ALP)3 for the relevant analyte as defined by the Royal College of Pathologists of Australasia Chemical Pathology Quality Assurance Programs Pty. Ltd. (RCPA QAP) assessment. However, other criteria could be used.
Figure 2.

A sample report from an Internal Quality Assessment Program. The performance of a Regional Laboratory (Roche Integra) is shown versus the Central Laboratory (Roche Modular analyser). All analyte deviations are normalised in terms of the RCPA QAP Allowable Limits of Performance (ALP’s) with acceptable performances being within ±1 ALP (eg. For chloride, 1 ALP = 3mmol/L and the Regional labs deviation from target is 4 mmol/L. This normalises to 4/3 = 1.33 ALP’s, and flags the analyte as being outlying). Note two outliers are highlighted: bicarbonate and chloride.
Laboratory performances on such programs are reviewed and monitored for trends. Random errors may be handled in much the same manner as outliers on any EQA scheme, i.e. checked for pre-analytical causes (transcription, sample degradation) as well as internal QC performances for the run. If the performances are consistently biased, an assessment is made as to whether such bias is common to other sites using the same equipment or is unique to the Regional Laboratory’s site.
If the bias is unique to the site, trouble-shooting is initiated.
If the bias is common to the instrument type, realignment studies are initiated for the instrument group.
From over a year’s experience in operating such a scheme on a fortnightly basis, our laboratory notes highly comparable alignments against the Central Laboratory for sites with common equipment. This is the case across the range of analytes that the Central and Regional Laboratories measure in common.
However, operating such a scheme can be a significant drain on resources. It is heavily reliant on the development of specialised computer programs/spreadsheets/data-bases. The software must allow the recording of data, the production of reports for individual sample distributions and the production of summary reports showing long-term performance both of individual labs (Figure 3) and of the group. For ease of use, the information should be graphically presented and incorporate the acceptable limits.
Figure 3.

Internal Quality Assessment Program and the long term performance at one Regional Laboratory for alkaline phosphatise. In the Levey Jennings type-plot, the Regional Lab’s ‘deviations from target’ for each sample have been normalised in terms of RCPA-QAP Allowable Limits of Performance (ALP). Acceptable performances are within ±1 ALP.
Other challenges include selecting suitable samples to achieve comparison across the measurement range, especially when Regional Laboratories select their own samples. Also, degradation of analyte (before analysis at the other site) is a particular problem for bicarbonate and bilirubin, as would be expected.
EQA Subgroup Reports
EQA schemes, such as the Australasian RCPA Chemical Pathology QAP, through their Subgroup Reports3 (Figure 4), can provide all of the necessary data-management for interlaboratory performance assessments. These programs can have:
Figure 4.
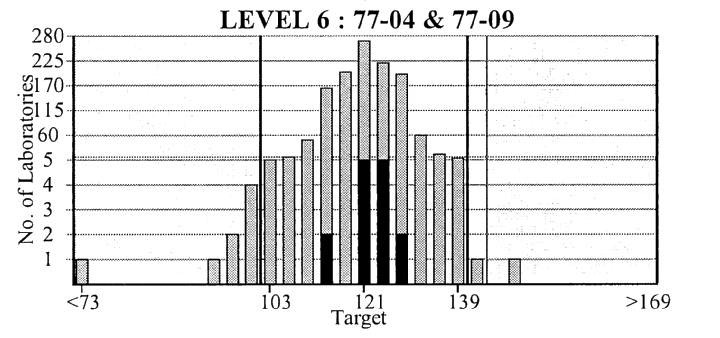
Royal College of Pathologists of Australasia Chemical Pathology Quality Assurance Programs Pty. Ltd. Subgroup report. Results for all the participating laboratories are plotted against sample concentration and Allowable Limits of Performance. Laboratories in the subgroup (your network of laboratories) are highlighted in bold.
Allowable limits of performance, giving an assessment of acceptable alignment.
Information grouped by instrument type - so that alignment of laboratories with a given instrument can be easily assessed.
Information graphically represented.
All that is required is review at the Central Laboratory of the Regional Laboratory group.
A problem with this approach is the potential for noncommutability of the EQA samples between methods - performance on a given EQA scheme doesn’t mean that patient samples will show the same behaviour. A comparison of methods is firstly needed to establish commutability. Only when this is found to be satisfactory can changes identified through an EQA program be taken as a true indicator of an alignment problem.
In addition, EQA Providers in effect distribute different lots of material on a periodic basis. The RCPA Chemical Pathology QAP materials are manufactured on an annual basis so that methods that aligned in one year’s distribution may no longer align in the subsequent year. This means that commutability of EQA materials should theoretically be established on a perlot basis. Accordingly the QAP Subgroup Reports can only be useful if the commutability of the material between methods has been previously demonstrated.
A further confounding issue is that many laboratories routinely remove correction factors from their EQA results before submission. This is a reasonable measure designed to allow them to more effectively assess their performances against their own instrument groupings. For example, this is especially relevant to Vitros (Ortho Clinical Diagnostics, Sydney, Australia) dry chemistry analyser users, who have slopes and offsets in place to align their routine performances to their Central Laboratory’s wet-chemistry analyser. However, when such laboratories remove these correction factors, their subsequent performances on the EQA Subgroup Report may give the impression that they do not align with their Central Laboratory’s EQA performances – so this issue must be considered when reviewing these reports.
Question 3: What is an acceptable alignment?
Opinion Based / Arbitrary
Whilst literature-based criteria for acceptable alignment of methods and analysers have emerged over the last 5–10 years, some laboratories use arbitrary or subjective expert opinion-based criteria for the assessment of “acceptable alignment”. Alternatively, an arbitrary percentage such as ±10% may be considered within tolerance.
These subjective techniques may be limited by a given individual’s level of experience and ignore any critical alignment required for individual analytes. These issues are especially important for those analytes involved in homeostasis, e.g. sodium and calcium, which by definition require tighter alignment between methods.
Alignment within Allowable Limits of Performance
The Australasian RCPA Chemical Pathology QAP is distinguished from many EQA schemes in that it provides its participants with clinically-based ALPs. These limits are published on the RCPA QAP website4 and on their reports. In addition, general concordance between these limits and limits based on biological variability has been found (K Sikaris, personal communication). It can be reasonably argued therefore, that if the performances of two different methods distribute within these allowable limits (i.e. incorporating elements of both inter-instrument alignment biases and relative instrument imprecisions), then the same medical usefulness may be obtained from the results of both methods.
Accordingly some laboratories may argue that it is appropriate to use the ALPs’ as a basis for defining acceptable deviations between methods and instruments.
Alignment based on Intra-Individual Biological Variation
Fraser gives the criterion for adequate alignment between two instruments reporting the same analyte as being one third of the intra-individual biological variability (CVi) for the given analyte (i.e. 0.33 CVi).1 This performance is attainable with current methods for many analytes that have a large CVi, e.g. urea with a CVi of 12.3%5,6 and an allowable bias between methods of up to 4.1%. However, there is difficulty in achieving this criterion for analytes such as sodium and calcium that have tight biological variation and a CVi of 0.7% and 1.9%, respectively.1
Figure 5a and 5b demonstrate an example of this principle, whereby a comparison of two Architect (Abbott Diagnostics, Sydney, Australia) analysers measuring luteinising hormone (LH) was undertaken using EQA materials. One method for estimating the percentage difference between the results of the two analysers is {[Average LH (Architect 1) – Average LH (Architect 2)] / (Average LH (Architect 1 + 2)} x 100. For the data shown in Figure 5a, this difference calculated as 0.73% and is less than the 0.33CVi criteria (ie 0.33 x 14.5 = 4.79%). Therefore, the methods could be assessed as being adequately aligned.
Figure 5.
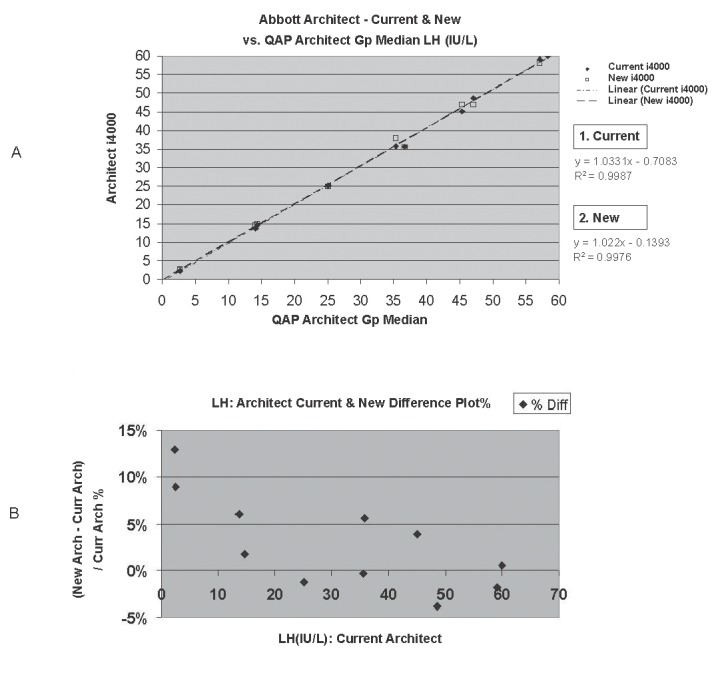
Assessment of the alignment of two Architect i4000 analysers measuring luteinising hormone using EQA material. A, Comparison of methods - Regression analysis. B, % Difference Plot, highlighting an average bias of ~ 2.9%.
However, it is also important to plot such studies as “%Difference Plots”. These plots highlight the relative between instrument percentage bias at each concentration level (Fig 5b). They are particularly useful in characterising the existence of significant bias at important clinical decision points. In the study discussed, a higher average bias of ~ +2.9% is noted, which is still acceptable – but at lower concentrations of <5 IU/L, the bias is significant (~ 11%).
Note, the author also acknowledges that Bland Altman Plots are generally preferred to %Difference Plots as they take into consideration the presence of error associated with each instruments’ respective measurements. However Bland Altman Plots effectively halve the between instrument bias and so may therefore mask the presence of significant bias between two instruments testing in parallel. Accordingly Difference Plots have an advantage in this particular application.
Question 4: How often should alignment be checked and why?
The monitoring of alignments should be conducted on an ongoing and regular basis because the testing environment is dynamic and variables within the process are constantly changing.
For instance, Roche Diagnostics’ C.f.a.s. calibrator lots for the Modular/Hitachi and Cobas Integra (Roche Diagnostics, Sydney, Australia) systems generally change on an annual basis. A change in lot may cause a shift in performance due to a wrong assignment or re-standardisation of values at this time.7 In many cases, several values are assigned for a given analyte (e.g. creatinine) for the respective Roche systems, each value with its own potential for error. Reagent lot associated shifts in performance may also arise from time to time. Therefore, the scope for misalignment can be significant each time a lot changes whether it is calibrator or reagent lots and it is evident that regular monitoring for correct alignment is required.
However, a dynamic testing environment does not imply that a full comparison of methods needs to be undertaken every change of calibrator or reagent lot. If adequate alignment by a comparison of methods study has been previously demonstrated, ongoing stability by achievement of internal QC targets or adequate alignment in an ongoing IQAP should suffice. It is only when deviations in alignment exceed defined acceptable limits that a full comparison study should be undertaken and bias reassessed. Correction of alignment factors follows where necessary.
Acknowledgments
The author wishes to acknowledge Dr Ken Sikaris for his assistance in the review of this article. Many thanks also to Dr Roger Johnson, and Dr David Bullock for their kind assistance with the editing of this article. Thanks also to Ms Janice Gill (Co-ordinator RCPA Chemical Pathology QAP Programs) for providing a sample EQA Sub-Group Report.
Footnotes
Competing Interests: None declared.
References
- 1.Fraser CG. Biological Variation: From Principles to Practice. Washington, DC, USA: AACC Press; 2001. [Google Scholar]
- 2.Koch DD, Peters T., Jr . Selection and evaluation of methods. In: Burtis CA, Ashwood EA, editors. Tietz Textbook of Clinical Chemistry. 2. Philadelphia, USA: WKB Saunders Co; 1994. pp. 523–4. [Google Scholar]
- 3.Royal College of Pathologists of Australasia Chemical Pathology Quality Assurance Programs Pty. Ltd. Programs, analytes and allowable limits of performance. Oct, 2001. Information Handbook. Version 2 Appendix A; pp. 27–30. [Google Scholar]
- 4.Royal College of Pathologists of Australasia Chemical Pathology Quality Assurance Programs Pty Ltd. [(Accessed June 3 2008)]. http://www.rcpaqap.com.au/chempath/
- 5.Westgard JO. Desirable specifications for total error, imprecision, and bias, derived from biologic variation, Annex 1, part 1. http://www.westgard.com/biodatabase1.htm.
- 6.Ricos C, Alvarez V, Cava F, Garcia-Lario JV, Hernandez A, Jimenez CV, et al. Current databases on biologic variation: pros, cons and progress. Scand J Clin Lab Invest. 1999;59:491–500. doi: 10.1080/00365519950185229. [DOI] [PubMed] [Google Scholar]
- 7.Bais R. What information should manufacturers provide on their procedures? Clin Chem. 2006;52:1624–5. doi: 10.1373/clinchem.2006.069773. [DOI] [PubMed] [Google Scholar]