SYNOPSIS
Objective
Research concerning school-based health center (SBHC) costs and revenues is limited. This article discusses Oregon's SBHC State Program Office methodology and findings regarding costs and revenues for planning and operating Oregon SBHCs.
Methods
A variety of data sources and case studies conducted in five Oregon SBHC systems were used to calculate startup and annual operations costs. All Oregon SBHCs completed a survey providing 2005–2006 revenue data. Revenue data were further linked to 2005–2006 client utilization data, such as the number and age of unduplicated clients, public and private insurance status, and medical sponsor type.
Results
Startup costs for Oregon SBHCs depended largely on the status of available space. Median, minimum, and maximum annual operations costs were calculated for core, intermediate, and expanded models of service delivery, and depended mostly on provider hours and types. Centers with federally qualified health center medical sponsors rely heavily on revenue from billing public insurance programs. Billing revenue depends on the percent of uninsured visits. School socioeconomic indicators such as the percent of students eligible for free and reduced lunch may be good indicators for the percent of student clients with public insurance.
Conclusions
The methodology employed may encourage other state SBHC agencies or organizations to adopt research designs to collect and analyze cost and revenue data. On a practical level, the findings provide state and local policy makers and communities planning SBHCs with preliminary estimates for the costs of startup and annual operations, and some understanding of income sources and billing revenue projections.
The school-based health center (SBHC) is a nationally recognized health-care delivery model that provides school-aged youth with comprehensive physical, mental, and preventive health services delivered by qualified medical providers in a school setting. SBHCs offer access to health care for students, many of whom are uninsured or have difficulty accessing traditional venues of health care.
Planning and sustaining SBHCs requires reliable cost and revenue estimates. The first SBHC opened in Oregon in 1986 as a public health demonstration project. There are currently 45 certified SBHCs in Oregon operating in more than half of all counties. Centers are typically public-private partnerships supported with limited state general fund dollars distributed through the local public health authority. Oregon's SBHC State Program Office (SPO) is preparing for an expansion during the 2007–2009 biennium, anticipating increasing the number of Oregon SBHCs by 30% to 40% by awarding 18 planning grants for new centers. Providing accurate financial information and technical assistance to prospective centers with respect to costs and revenues is necessary for the successful opening of new sites.
Research concerning SBHC costs and revenues is limited, whereas technical assistance needs are increasing.1 The National Assembly on School-Based Health Care (NASBHC) (Personal communication, Laura Brey, NASBHC, May 2007), state agencies, and organizations are all researching SBHC costs and revenues to help improve financial sustainability. In Connecticut, a recent state report provided SBHC cost estimates based on staffing patterns and services provided, and used the estimates to make SBHC funding policy recommendations.2 Research on SBHC revenue sources points to public health state and federal funding, grants, and billing revenue.1,3,4 A mix of federal, state, and local funding is necessary to support SBHCs, and government funding has traditionally been the main revenue source.3,5 The centers' ability to bill public insurance programs affects their financial sustainability.6,7 NASBHC and individual states have been working together to formulate financial policies that would ease the process of public insurance reimbursement to SBHCs5,8 and increase billing capacity and revenues, which would in turn increase financial sustainability.9,10
A first goal of this study was to contribute to SBHC cost research by developing a methodology to generate cost estimates for opening and sustaining SBHCs. Previous similar efforts, such as the recent Connecticut state report, are great first attempts to develop a range of cost estimates based on a number of important criteria, such as hours of operation and level of services provided. What is currently missing in the SBHC cost literature is an explicit and rigorous methodological approach for generating such estimates. Little information can be found in existing research that would guide other states, organizations, or prospective centers with respect to the development of cost estimates. This article is a first step in that direction.
A second goal of this study was to explore Oregon SBHC revenue sources and how the composition of revenues varies as a function of the center's type of medical sponsor. We compared revenues for centers whose sponsors have federally qualified health center (FQHC) status and benefit from cost-based reimbursement5 to revenue composition for centers without FQHC status. FQHC medical sponsors rely more on billing income and 330 Public Health Service Act federal dollars.1 Twenty-three of the 42 Oregon centers are under FQHC sponsorship and 19 are operated by non-FQHC sponsors. Examination of billing income suggests that billing may contribute to financial sustainability to a larger extent for Oregon centers with FQHC sponsors. This finding reinforces the importance of supportive policy changes such as extending cost-based reimbursement to non-FQHCs or carve-outs for services being supplied in SBHC settings.
METHODS
In 2006–2007, Oregon's SBHC SPO conducted a research project to analyze SBHC startup costs, annual operations costs, and revenues. The study was designed to be replicable and relied on a mix of three types of data.
First, for certain expenses, instead of collecting actual data from the centers, a number of alternative sources were used to estimate costs. This approach was preferred for estimating certain costs (i.e., startup and staffing) for a number of reasons. Information on certain costs—especially startup expenses—was difficult for centers to provide, due to the passage of time and the large amount of in-kind donations. Additionally, certain costs (i.e., staffing) could reliably be estimated using alternative data sources on wages and benefits for the types of staff that the centers reported. This substantially reduced the amount of information that the centers participating in the case studies had to research and provide.
Second, in 2007, case studies were conducted in five of Oregon's 20 SBHC systems to obtain actual cost data for expenses that could not be reliably estimated using alternative data sources. Five systems were selected because it was not feasible to conduct in-depth case studies in all 20 systems. Case study participants included representation from systems that were rural and urban, had different medical sponsors (e.g., FQHCs, non-FQHCs, local county health departments, hospitals, and clinics), and were located in elementary, middle, and high schools. These factors have a direct impact on the type of populations served, SBHC staffing patterns, and the type of services provided—all of which in turn affect costs.
Third, a short survey was used to collect information about revenue sources and billing revenue from all certified centers. Forty-two of the 43 Oregon centers provided revenue data from the most recent fiscal year (2005–2006). These data were further linked to selected 2005–2006 client information that the Oregon SBHC SPO collects annually from all the centers. The client information included the number of unduplicated clients, the number of visits for each client, and enrollment in public or private insurance programs, if any.
RESULTS
The discussion of analyses and results is organized in three parts: startup costs, annual operations costs, and revenues. One-time expenses incurred during planning are referred to as startup costs. Recurring yearly expenses are referred to as annual costs of operation.
Startup costs
The following costs were included in the estimation of startup expenses: salary and benefits for administrative staff during planning, space, furniture, electronic and office equipment, and medical equipment. Two space scenarios are typical in Oregon: (1) the school district donates space for SBHC use and this space is renovated or (2) the medical sponsor builds a modular unit on campus. Cost data for both scenarios were collected from SBHC systems that recently renovated a school space or built a modular unit.
For startup furniture costs, the SBHC SPO collected median, minimum, and maximum state contract discount prices, as well as regular prices from three office and furniture suppliers. Both types of pricing are relevant because some SBHCs purchase office supplies and furniture at discounted prices through their medical sponsor, while other centers may not enjoy similar discounts. For electronic and office supplies, minimum, median, and maximum prices were collected from three electronics and office suppliers. A price quote for midrange-priced items was requested from a supplier of medical equipment to obtain a cost estimate for medical equipment needed at startup.
Estimates provided by SBHC administrators indicated that an administrator would be needed for 10 hours a week during school months in the typical two years of startup planning. The Oregon Employment Division's 2006 Salary Survey data and the Employer Costs for Employee Compensation (ECEC) benefits data collected by the Bureau of Labor Statistics (BLS)11 were used to estimate the administrator's wages and benefits during startup.
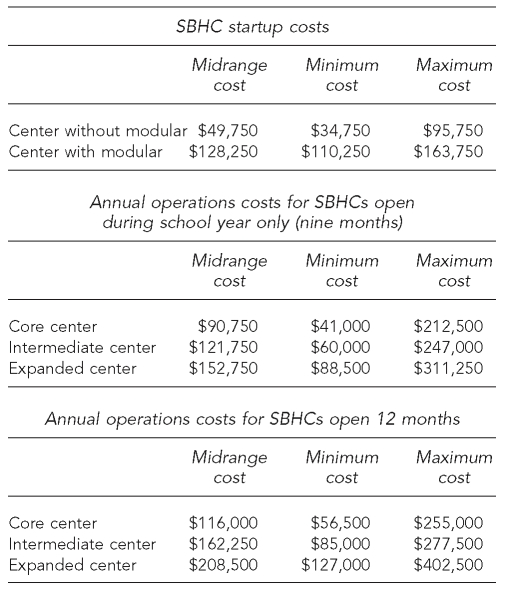
Table 1 presents cost estimates for SBHC startup, distinguishing between centers that renovate school space and those that build a modular unit on campus. Figures were rounded to the nearest amount using $250 increments. Unsurprisingly, the variation in costs for centers that build modular units on campus is a close function of the center's size.
Table 1. SBHC startup and annual operations costs.
SBHC = school-based health center
An additional potential startup expense is the development of a business plan including community engagement strategies, budgets, policies, procedures, and position descriptions. This cost was not included in the estimation of startup expenses because few centers commit to developing a business plan; thus, costs are not typical. However, one case study system pointed to an expense of $6,000 for consultants, while another system using a countywide comprehensive planning process to open multiple SBHCs had expenses of $35,000.
Annual operations costs
Annual operations costs differed substantially from center to center, depending mostly on hours and types of medical providers. Figure 1 provides an overview of the major categories of annual operations costs.
Figure 1. An overview of major categories of annual operations costs.
Alternative data sources were used to estimate staff salaries and benefits. Centers have several choices with respect to medical provider types. In general staffing terms, and in accordance with Oregon's SBHC Standards for Certification,12,13 a core center requires 10 hours of primary care provider, namely medical doctor (MD), doctor of osteopathy (DO), nurse practitioner (NP), or physician assistant (PA); 10 hours of registered nurse (RN) or qualified mental health provider (QMHP); and 15 hours of support staff (office assistant or medical secretary). A primary care provider may also assume any or all of the RN or QMHP time to meet the combined professional time requirement.
For an expanded center, certification requires 20 hours of primary care provider (MD, DO, PA, or NP), 20 hours of RN, 20 hours of QMHP, and 30 hours of support staff. An intermediate-level center (midway between core and expanded) was defined as having 15 hours of primary care provider (MD, DO, PA, or NP), 15 hours of RN, no hours of QMHP, and 22.5 hours of support staff. In addition, based on discussions with center administrators, a center needs approximately 10 weekly hours of administrator time. For expanded centers, a primary care provider may assume any or all of the RN (but not QMHP) time to meet the combined professional time requirement.
Based on 2005–2006 Oregon SBHC client utilization data, the typical center employed a combination of NP and RN hours. A small number of centers hired a PA. Thus, estimates for salary costs relied on possible combinations of NP, RN, PA, QMHP, office support, and administrator time that satisfied minimum certification requirements for each type of center.
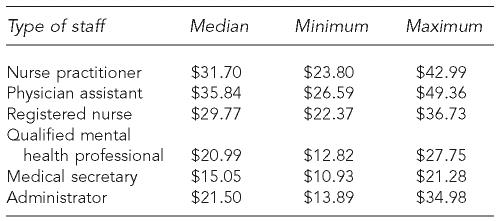
To estimate salaries, 2006 Oregon Employment Division Salary Survey data were used. In addition, because this survey does not collect NP salary data, salary data were collected from the 19 SBHC systems that employed NPs in 2005–2006. Table 2 presents median, minimum, and maximum hourly gross wages.
Table 2. Hourly gross wages (excluding benefits) by staff type.
To estimate benefits, BLS ECEC survey data were used, which provide the mean employer cost for benefits per employee hour worked. According to these data, state and local government employees in health care receive benefits that value about 52% of their wages and salaries. Private industry workers in health care receive benefits that value about 39% of their wages and salaries. Overall, civilian workers in health care receive benefits that value about 41% of their wages and salaries. Thus, it was estimated that the typical center would spend 41% of wages on employee benefits. The cost would be highest (maximum) when the medical sponsor is the local county health department (52%) and lowest (minimum) when the employer is a private institution (39%).
All other annual operations costs were computed using data obtained from the five case study systems. Table 1 presents annual operations costs for core, intermediate, and expanded centers open during the school year (nine months), as well as for 12 months.
Revenues
What are the major sources of revenue for Oregon SBHCs? What kind of insurance programs do centers bill? What is the composition of revenue from billing for centers where billing revenue is a major income source; namely, centers under FQHC sponsorship? What kind of dollar volumes does billing generate for FQHCs? Can billing revenue generate a large proportion of program income?
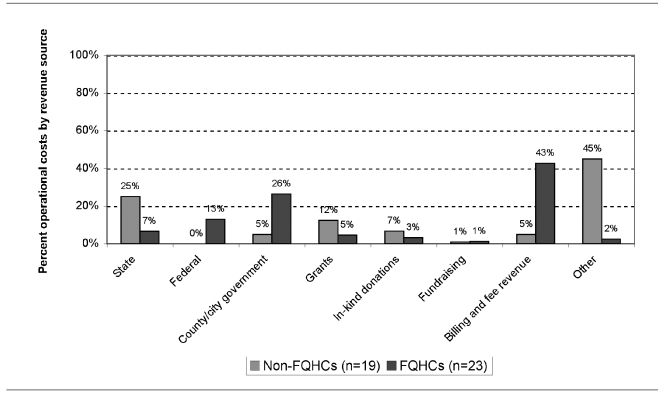
Figure 2 presents the percent of total operational costs by revenue source reported by SBHCs, by sponsor types. The largest revenue source reported by FQHCs was billing: 43% of total operational costs. For non-FQHCs, billing and fee revenue was only 5% of operational costs, federal dollars were absent, and state funding represented a larger share of program income.
Figure 2. Sources of revenue reported by Oregon SBHCs, by sponsor type (n=42).
SBHC = school-based health center
FQHC = federally qualified health center
Centers under FQHC sponsors were more likely to bill all types of insurance programs: 96% bill public insurance programs, 91% bill private insurance programs, and 70% bill the Family Planning Expansion Project (FPEP), a Medicaid demonstration project; for non-FQHCs, only 63% bill public and private insurance programs and only 16% bill FPEP.
FPEP billing was checked for a correlation between medical sponsorship and SBHC location; if most FQHCs were located in high schools, then higher levels of FPEP billing activity in FQHCs could be attributed to the school type (family planning services being more appropriate to high school students). However, of the 27 SBHCs located in high schools, 16 were actually under non-FQHC sponsors. The policy context for FPEP is important to Oregon SBHCs given that the state Medicaid waiver allows for adolescents to qualify based on their own income and is accompanied by an enhanced reimbursement rate. In addition, restrictions sometimes imposed by the school (nonmedical) partner may prohibit provision of some family planning services and, thus, potential revenue.
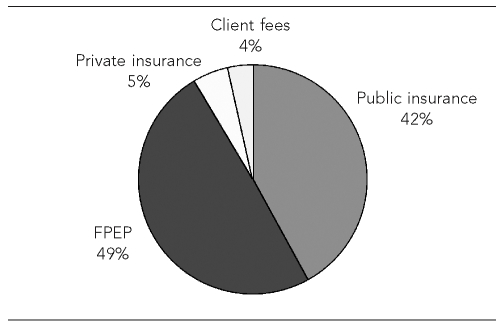
Figure 3 shows the composition of revenue from billing reported by FQHCs, by insurance type. Of the $2,372,000 in billings generated by centers under FQHC sponsors, 49% came from billing FPEP and 42% from billing public insurance programs. Private insurance billing income represented only 5% of billing revenues.
Figure 3. Sources of billing revenue for SBHCs under FQHC medical sponsors, by insurance type (n=23).
SBHC = school-based health center
FQHC = federally qualified health center
FPEP = Family Planning Expansion Project
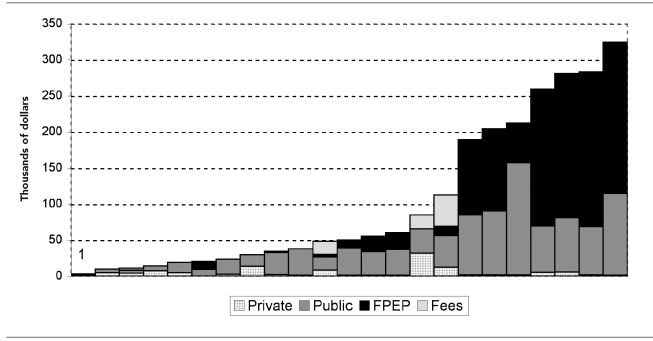
The median revenue from billing was $50,000, and the mean was $106,000. Depending on the centers' billing capacity, the percent of uninsured clients, total visits, and hours of operation, billing revenue ranged from $3,000 to $325,000. Figure 4 shows the distribution of billing revenue for each SBHC under FQHC sponsorship, by insurance type.
Figure 4. Revenue from insurance billing and fees for each center under FQHC sponsors, by type of insurance billed (each bar = 1 SBHC, n=23).
SBHC = school-based health center
FQHC = federally qualified health center
FPEP = Family Planning Expansion Project
SBHCs under FQHC sponsors that were successful at generating high program income from billing relied heavily on a combination of public and FPEP insurance billing. Few centers generated a substantial amount of their revenue from private insurance billing. The percent of total operational costs represented by billing revenue ranged from 3% to 83% for centers under FQHC sponsors. Seven of the 23 FQHCs covered more than 60% of their total program costs from billing revenue. Thus, billing revenue can generate a large proportion of program income.
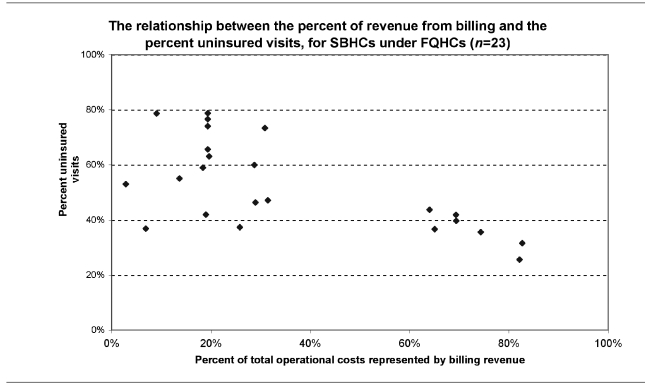
An important driver of billing revenues is the percent of insured client visits. The higher the percent of insured clients, the more opportunity exists for SBHCs to bill insurance programs and generate income. Analyses linking client insurance status to billing income are limited. When Oregon SBHCs collect insurance status data from clients, it is not always known if insurance programs are billed for services. Thus, in centers with high proportions of uninsured clients, billing revenue can be small if the center does not bill all insured clients. With this limitation in mind, Figure 5 shows the relationship between the percent of uninsured visits and the percent of total operational costs represented by billing revenue.
Figure 5. Percent total operational costs from billing revenue and the percent of uninsured visits.
SBHC = school-based health center
FQHC = federally qualified health center
As the percent of uninsured visits decreased, the percent of total operational costs from billing revenue increased. The graph shows differences between centers that are efficiently billing and those that could improve their billing capacity and revenues. For instance, a few centers had approximately 40% uninsured visits, yet they generated less than 30% of their income from billing (<$50,000). By comparison, the cluster of centers on the right side of the graph had similar levels of uninsured visits, yet 60% or more of their operational costs came from billing (billing revenues of $200,000 to $325,000).
Differences in billing capacity may be a result of a number of factors and vary by site. Barriers to billing often are a result of inadequate billing infrastructure (e.g., an FQHC as a medical sponsor where the business model is operationally focused on billing vs. public health departments, which may not typically be in the business of primary care and establishing billing systems). In addition, the proportion of nonbillable services in an SBHC, rates of reimbursement, provision of confidential or selected services, and eligibility of providers who may be excluded due to credentialing relationship or license (e.g., nurses) can all have an impact on potential revenue.
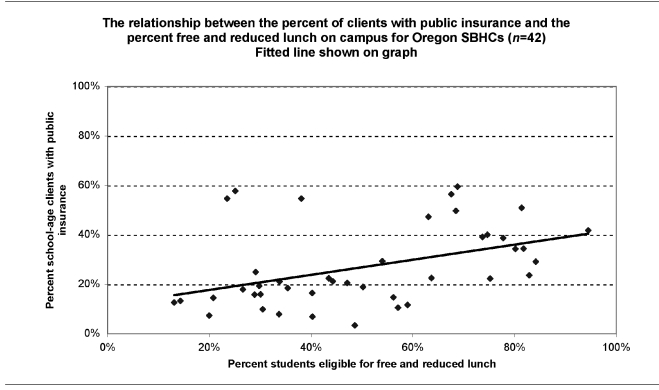
Because public insurance programs are the main generator of revenue from billing, how can prospective centers estimate the expected percent of publicly insured clients? In schools with a lower socioeconomic status for their student population, more students should be eligible for public insurance enrollment. For a potential measure of socioeconomic status, Oregon Department of Education 2005–2006 data on the percent of students eligible for free and reduced lunch were identified from all 42 schools with SBHCs.14 The percent of unduplicated school-age clients with public insurance was computed based on 2005–2006 client utilization data. Figure 6 shows how the percent of client students with public insurance increased as socioeconomic status decreased.
Figure 6. Percent school-age clients with public insurance and socioeconomic status.
A few other findings concerning factors that drive billing revenues are worth mentioning. Client utilization data from all 42 centers showed a median percent of uninsured visits of 45% (and a mean of 49%), with a range of 25% to 88%. Billing revenue estimates may also be affected by the likelihood that publicly insured clients may use SBHCs more frequently. Client utilization data revealed that the median number of visits for school-age clients with public insurance was 3.9, compared with a median number of visits for school-age clients with private insurance of 2.9. (The median is a better measure than the mean due to the presence of outliers in the distribution of the number of visits.)
DISCUSSION
The study found that the median startup costs for Oregon SBHCs ranged from $49,750 to $128,250, depending mostly on the status and renovation needs of the school space. Median annual operations costs ranged from $90,750 to $208,500, depending mostly on provider hours and types, but were as high as $402,500 for expanded centers operating year-round with full-time staffing and mental health services.
With respect to revenues, significant differences were identified between FQHCs and non-FQHCs. FQHCs relied significantly more on billing and federal dollars. Non-FQHCs relied more on state or other funding. Previous studies showed that even when insurance billing is successful, it only generates 5% to 15% of total operational costs3—at best, 25% of operational costs.15 However, this study found that Oregon FQHCs generated substantial revenue from billing insurance programs. The median percent of operational costs covered by billing revenue was 26%, and almost a third of FQHCs in Oregon covered between 64% and 83% of their costs with billing dollars.
Whereas technical assistance can help centers increase their billing capacity and income, public health funding remains an important revenue resource for sustainability, both for FQHCs and non-FQHCs.1,5 In particular for centers under non-FQHC sponsors, where billing income covered only 5% of total operational costs, government funding was essential.
Most billing revenue in Oregon FQHCs comes from billing public insurance programs. As expected, a strong relationship exists between billing revenues and the percent of uninsured visits: the more clients enrolled in public insurance, the more opportunity exists to bill and generate revenues. Data also showed that school socioeconomic indicators such as the percent of students eligible for free and reduced lunch might be good indicators of the percent of student clients with public insurance. However, there may be some limitations to this approach in areas where there are large numbers of undocumented immigrant populations who, if enrolled in school and meet family income definitions, may inflate free and reduced lunch rates. Being able to estimate the percent of school-age clients with public insurance based on student population characteristics may help SBHCs develop reliable billing revenue estimates.
We also found that public insurance students use the centers more frequently than students with private insurance. The median number of visits for school-age clients with public insurance was 3.9, as opposed to 2.9 visits for school-age clients with private insurance. These figures may help centers estimate the number of expected visits from each category of students with insurance to develop billing revenue projections.
The study found a large variability in the relationship between the proportion of students with free and reduced lunch and the number of unduplicated clients with public insurance. A potential explanation is that not all centers are equally efficient in enrolling students in public insurance. If this holds true, there is potential for technical assistance to help centers that have high levels of low socioeconomic status yet report low numbers of clients with public insurance to improve outreach and enrollment of students under public insurance plans. Limitations as to the impact of increased outreach and enrollment for centers with large numbers of undocumented immigrant populations should also be taken into consideration here.
This suggests that simply targeting centers in schools of low socioeconomic status does not preclude the need for effective outreach and enrollment in public insurance, nor does it guarantee that all eligible clients are seen. However, this finding may actually reinforce the mission of SBHCs as access models or safety nets to vulnerable students who are uninsured or who, when insured, have difficulty accessing traditional systems of care.
The findings also suggest some policy implications that would improve the SBHC system in Oregon. The ability to extend cost-based reimbursement to non-FQHCs would greatly improve financial sustainability. Policy supports or billing improvements are likely necessary to improve billing efficiency, assure reimbursement for services for students who have private insurance, or remove inadvertent billing barriers due to Medicaid managed care. And as evidenced by the state FPEP program, adolescent-friendly eligibility rules and enhanced preventive services bundling can greatly impact centers' service delivery and revenue potential.
Limitations
Several limitations to this study need to be recognized. External validity is limited by the fact that only 25% of Oregon SBHC systems were included in the case study. On the flip side, revenue information was obtained from more than 97% of Oregon centers. Whereas findings concerning Oregon SBHC cost and revenue estimates may not be representative for SBHCs nationwide, the methodology utilized to produce those figures may be used to obtain estimates that are valid for other states or even nationwide.
Other important limitations exist. There is no formal standardized financial reporting system for all SBHCs in Oregon due to the variability in sponsorship and the nature of their public-private partnerships. The accuracy of insurance status data reported by some SBHCs is questionable due to the inability to distinguish between “unknown” and “none” and to link insurance status and billing status. Case studies revealed medical sponsors and SBHCs have difficulty separating out SBHC-specific expenses when centers are part of larger health-care delivery systems. There is no detailed information on “other revenue” that was substantial for non-FQHCs.
We strongly caution the reader against the danger of considering the minimum annual operation cost estimates as feasible. Certain costs collected from the case studies may be underestimated because of in-kind donations not recorded in the budget; costs incurred by the medical sponsor without being specifically included in the SBHC budget; and expenses shared with and charged to other programs, especially when the sponsor is a county health department. The Oregon SBHC SPO was particularly careful to obtain, where feasible, accurate estimates of the value of in-kind donations and unrecorded expenses. Centers participating in the case studies were explicitly asked to state and estimate the value of in-kind donations and expenses that were incurred but not specified in the operating budget.
CONCLUSIONS
Despite limitations that are mainly linked to the external validity of the estimates outside Oregon's SBHC system, the methodology developed may be useful for other state programs and organizations that seek to collect and analyze cost and revenue data and provide technical assistance to developing and existing centers. This methodology may also help centers develop sustainable financial plans, which include cost and revenue projections based on information tailored to individual SBHCs.
REFERENCES
- 1.Washington MW, Brey LC. Funding, technical assistance, and other resources for school-based health centers. Nurs Clin North Am. 2005;40:619–36. doi: 10.1016/j.cnur.2005.07.009. [DOI] [PubMed] [Google Scholar]
- 2.Ad-Hoc Committee to Improve Health Care Access. Report to J. Robert Galvin on school-based health centers. 2006. Dec,
- 3.National Assembly on School-Based Health Care. Critical issues in school-based health care financing. 1999. Sep,
- 4.Swider SM, Valukas A. Options for sustaining school-based health centers. J Sch Health. 2004;74:115–8. doi: 10.1111/j.1746-1561.2004.tb06612.x. [DOI] [PubMed] [Google Scholar]
- 5.The Robert Wood Johnson Foundation. Making the grade: state and local partnerships to establish school-based health centers. 2003. Sep, [cited 2007 Jul 12]. Available from: URL: http://www.rwjf.org/reports/npreports/MakingGrade.htm.
- 6.Hacker K. Integrating school-based health centers into managed care in Massachusetts. J Sch Health. 1996;66:317–22. doi: 10.1111/j.1746-1561.1996.tb03408.x. [DOI] [PubMed] [Google Scholar]
- 7.Brindis CD, Sanghvi RV. School-based health clinics: remaining viable in a challenging health care delivery system. Annu Rev Public Health. 1997;18:567–87. doi: 10.1146/annurev.publhealth.18.1.567. [DOI] [PubMed] [Google Scholar]
- 8.National Assembly on School-Based Health Care. Partners in access: school-based health centers and Medicaid: policies and practices. 2001. Oct,
- 9.Koppelman J, Lear JG. The new child health insurance expansions: how will school-based health centers fit in? J Sch Health. 1998;68:441–6. doi: 10.1111/j.1746-1561.1998.tb06327.x. [DOI] [PubMed] [Google Scholar]
- 10.Harvey J, Vaquerano L, Nolan L, Sonosky C. School-based health centers and managed care arrangements: a review of state models and implementation issues. Washington: George Washington University Medical Center for Health Services Research and Policy; 2002. Jul, [Google Scholar]
- 11.Department of Labor, Bureau of Labor Statistics (US) National compensation survey. [cited 2007 Jul 12]. Available from: URL: http://www.bls.gov/ncs/ebs/home.htm#data.
- 12.State of Oregon Department of Human Services. Oregon school-based health center program: standards for certification, year 2000. [cited 2007 Jul 12]. Available from: URL: http://www.oregon.gov/DHS/ph/ah/sbhc/cert99x.pdf.
- 13.State of Oregon Department of Human Services. Approved certification standards revision. [cited 2007 Jul 12]. Available from: URL: http://www.oregon.gov/DHS/ph/ah/sbhc/certstandrev05.doc.
- 14.Oregon Department of Education. Students eligible for free/reduced lunch. [cited 2007 Jul 12]. Available from: URL: http://www.ode.state.or.us/sfda/reports/r0061Select2.asp.
- 15.National Assembly on School-Based Health Care. Medicaid reimbursement in school-based health centers: state association and provider perspectives. 2000. Jun,


