Abstract
We recently demonstrated the pivotal role of the transcription factor (TF) activating TF 3 (ATF3) in dampening inflammation. We demonstrate that ATF3 also ameliorates allergen-induced airway inflammation and hyperresponsiveness in a mouse model of human asthma. ATF3 expression was increased in the lungs of mice challenged with ovalbumin allergen, and this was associated with its recruitment to the promoters of genes encoding Th2-associated cytokines. ATF3-deficient mice developed significantly increased airway hyperresponsiveness, pulmonary eosinophilia, and enhanced chemokine and Th2 cytokine responses in lung tissue and in lung-derived CD4+ lymphocytes. Although several TFs have been associated with enhanced inflammatory responses in the lung, ATF3 attenuates the inflammatory responses associated with allergic airway disease.
Asthma is a complex inflammatory syndrome that affects >10% of the North American population. The worldwide prevalence, morbidity, and mortality of asthma have significantly increased over the last three decades (1). Asthma is a chronic inflammatory disease of the small airways that is characterized by mast cell, eosinophil, and mononuclear cell infiltration of the submucosa along with goblet cell hyperplasia. The inflammatory response in asthma is tightly associated with airway hyperresponsiveness to antigen-specific and nonspecific stimuli (2). In humans, and in a mouse model, CD4+ Th2 cells play a crucial role in orchestrating airway inflammation by producing IL4, IL5, and IL13 and by regulating the production of IgE and the growth and differentiation of mast cells and eosinophils (3, 4). Although the role of cytokines in the asthmatic response is relatively well understood, little is known about the transcriptional regulation of these mediators in asthma (5, 6).
The transcription factor (TF) NF-κB regulates many facets of the inflammatory response and also appears (7, 8) to have a role in the pathogenesis of asthma. For example, activated NF-κB has been identified in the airways of patients with asthma, and agents that exacerbate asthma such as allergens, ozone, and viral infections also stimulate NF-κB (9). Furthermore, corticosteroids, the first-line treatment for asthma, are potent inhibitors of NF-κB activation (10). Finally, mice that are null for the p50 or c-Rel subunits of NF-κB develop significantly less airway inflammation after allergen challenge (11). We recently identified activating TF 3 (ATF3) as a potent negative regulator of the inflammatory response in macrophages (12), where it antagonized NF-κB–induced responses. ATF3 is a member of the CREB family of BZip (basic leucine zipper) transcription factors (13). Its role in dampening inflammation and its capacity to antagonize NF-κB–induced responses prompted us to examine its role in a mouse model of human asthma (12).
RESULTS
ATF3 is induced in a mouse asthma model
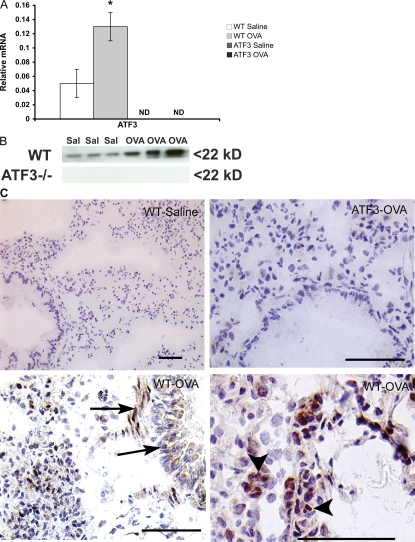
OVA sensitization and challenge led to a significant increase in ATF3 transcription in the lungs of WT mice (Fig. 1 A), and this was paralleled by increased expression of the protein (Fig. 1 B). Immunohistochemical localization showed weak ATF3 staining in the epithelium of saline-treated WT mice. Upon treatment with ovalbumin (OVA), increased levels of ATF3 were seen in the inflammatory cell infiltrate, smooth muscle layer, and around blood vessels. Interestingly, ATF3 staining of epithelium remained predominantly cytosolic, whereas inflammatory cells showed strong nuclear localization (Fig. 1 C). No ATF3 was detected in tissue from ATF3-null animals by PCR, Western blot, or immunostaining.
Figure 1.
Lung ATF3 expression in OVA-induced airway inflammation. (A) Quantitative real-time PCR analysis of ATF3 mRNA in lung tissue on day 29 after sensitization with OVA in WT and ATF3-null mice. (B) Western blot analysis for ATF3 protein in lung homogenates from individual animals used in A. (C) ATF3 expression in lung tissue of saline- or OVA-treated WT mice as determined by immunohistochemical staining with rabbit anti–mouse ATF3 antibody. Arrowheads, ATF3 staining of inflammatory cells; arrows, ATF3 staining of smooth muscle cells and epithelium. Real-time PCR results are expressed as mean ± SEM for six independent experiments. *, P < 0.05 by comparison to saline control. Bars, 25 μm.
Role of ATF3 in lung function and allergen-induced inflammatory responses
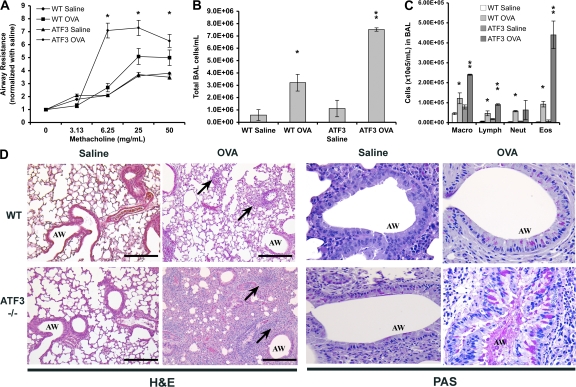
The role of ATF3 in regulating the asthmatic response was explored in OVA-sensitized and -challenged WT and ATF3-null mice. Lung resistance (RL), as a measure of airway hyperreactivity, was assessed using aerosolized methacholine and invasive plethysmography. Baseline airway resistance was not significantly different between WT and ATF3-null mice (WT-saline, 1.17 ± 0.05; WT-OVA, 1.36 ± 0.03; ATF3-saline, 1.00 ± 0.24; and ATF3-OVA, 1.19 ± 0.34). Airway resistance was significantly increased in the OVA-treated ATF3-null mice when compared with their WT counterparts (Fig. 2 A). The increased airway resistance in ATF3-null mice was accompanied by a fivefold increase in inflammatory cells in bronchoalveolar lavage (BAL) fluid (Fig. 2 B), whereas there was only a twofold increase in the cellular influx in WT BAL fluid (Fig. 2 B). Differential counts showed a significantly higher number of macrophages, lymphocytes, and eosinophils in the BAL fluid of ATF3-null mice (Fig. 2 C). Remarkably, there was a 4.7-fold increase in pulmonary eosinophils (Fig. 2 C). Histological analysis of lung tissue from OVA-treated WT mice showed an accumulation of eosinophils and mononuclear cells in the peribronchial and perivascular regions and edema of the airway interstitium compared with saline controls (Fig. 2 D). Each of these features was markedly increased in OVA-treated ATF3-null mice. Significantly, there was a dramatic increase in inflammatory cell infiltrate in the alveolar spaces of ATF3-null mice when compared with WT mice (Fig. 2 D). Airway mucus production, as determined by periodic acid-Schiff staining, was similar between WT and ATF3-null mice under baseline conditions. However, goblet cell hyperplasia and mucous hypersecretion were more pronounced in allergic ATF3-null mice (Fig. 2 D).
Figure 2.
Enhanced airway hyperresponsiveness and airway inflammation in ATF3-null mice. (A) Allergen-induced airway hyperresponsiveness was assessed in saline-treated and OVA-treated WT (Bl6) or ATF3-null mice by invasive plethysmography on day 29. Data represent the fold increase in airway resistance to aerosolized methacholine. Baseline airway resistance was not significantly different between WT and ATF3-null mice. (B) BAL fluid was obtained on day 29 from saline-treated and OVA-treated WT (Bl6) and ATF3-null mice, and the total number of cells was determined. (C) Cells were stained with Diff-Quik stain and differential counts were obtained. Macro, macrophage; lymph, lymphocyte; neut, neutrophil; eos, eosinophil. Error bars show mean ± SEM. (D) Lung sections of saline- and OVA-treated WT and ATF3-null mice were stained with hematoxylin and eosin (H&E) or periodic acid-Schiff staining (PAS). Arrows indicate inflammatory cells. AW, airways. Bars, 100 μm. Results are determined from groups of six mice *, P < 0.05 by comparison to saline; **, P < 0.05 by comparison to WT.
Effect of ATF3 deficiency on Th2 responses
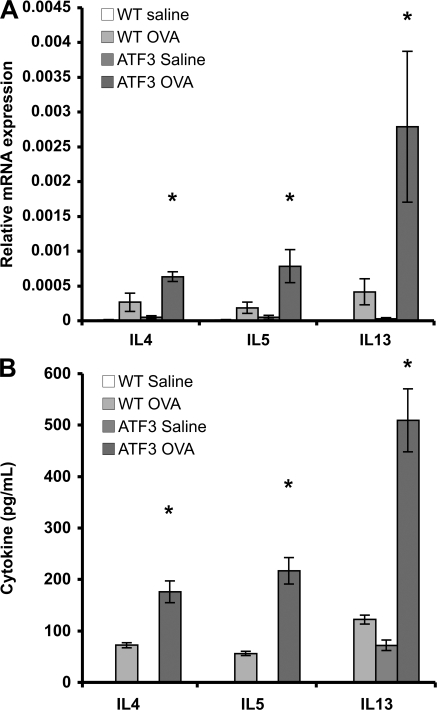
A hallmark of asthma is a skewed Th2-type immune response (4). Lungs from OVA-sensitized WT mice demonstrated significant increases in the Th2 cytokines IL4, IL5, and IL13 mRNA compared with saline-treated controls, and this response was markedly increased in OVA-treated ATF3-null mice (Fig. 3 A). Significant levels of secreted IL4, IL5, and IL13 were found in the BAL fluid of OVA-treated WT mice when compared with a saline control group, and these levels were significantly increased in the BAL fluid of OVA-treated ATF3-null mice (Fig. 3 B). No significant change in gene expression of the Th1 cytokine IFN-γ or the Th1-inducing cytokine IL12 was seen in either WT or ATF3-null mice after OVA treatment compared with saline controls (unpublished data).
Figure 3.
Enhanced Th2 cytokine production in ATF3-null mice. (A) IL4, IL5, and IL13 mRNAs were determined by real-time PCR in whole-lung tissue from saline- and OVA-treated WT and ATF3-null mice on day 29. Data are expressed as relative mRNA expression compared with EF1a. (B) IL4, IL5, and IL13 protein levels were determined in BAL fluid obtained on day 29 from saline- and OVA-treated WT and ATF3-null mice. *, P < 0.05 for saline versus OVA in WT and ATF3-null mice. Data represent mean ± SEM from six different animals.
Interestingly, there was no significant difference in the levels of OVA-specific IgE and IgG1 between WT and ATF3-null mice (Fig. 4, A and B). In contrast, the level of OVA-specific IgG2a, a serum Ig isoform typical of Th1 responses, was dramatically reduced in ATF3-null mice (Fig. 4 C).
Figure 4.
Humoral responses in ATF3-null mice. (A–C) Serum OVA-specific IgE, IgG1, and IgG2a were determined by specific ELISAs. *, P < 0.05 by comparison to saline; **, P < 0.05 by comparison to WT. Error bars show mean ± SEM.
ATF3 expression in T lymphocytes
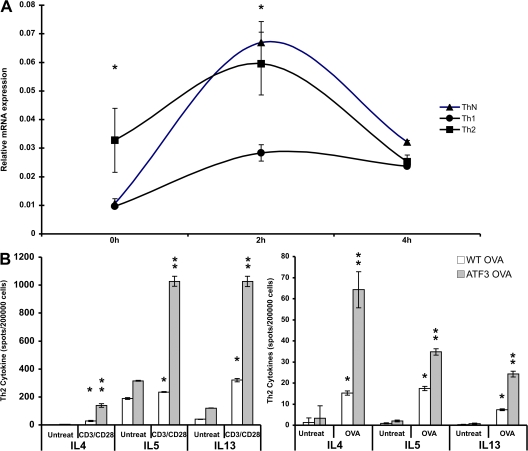
We determined ATF3 mRNA levels in CD4+ lymphocytes because these cells are the major source of IL4, IL5, and IL13 (6). Baseline transcription of ATF3 was significantly higher in splenic CD4+ T cells cultured under Th2 conditions. However, TCR ligation (anti-CD3/anti-CD28) dramatically increased ATF3 expression under Th0 conditions, whereas it was not increased under Th1 conditions (Fig. 5 A). Therefore, ATF3 expression in CD4+ lymphocytes is regulated both by the cytokine environment and by TCR ligation, and the effect is much more pronounced under Th2 conditions.
Figure 5.
ATF3 expression and Th2 Cytokine regulation in CD4+ T cells. (A) ATF3 mRNA expression in CD4+ lymphocyte cultured under Th1, Th2, or Th-neutral conditions. Splenic CD4+ cells were isolated and cultured in the presence of cytokines plus anti-CD3/anti-CD28 antibodies for 72 h and then restimulated with anti-CD3/anti-CD28 antibodies for the indicated times. RNA was isolated and ATF3 mRNA expression determined by real-time PCR. (B) IL4, IL5, and IL13 production in CD4+ lymphocytes from BAL fluid was determined by Elispot assay. BAL fluid cells from WT and ATF3-null mice treated with saline or OVA were incubated in the absence (untreated) or presence of anti-CD3/anti-CD28 antibodies or 500 μg/ml OVA peptide. *, P < 0.05 by comparison to saline; **, P < 0.05 by comparison to WT. Error bars show mean ± SEM.
ATF3 inhibits Th2 cytokine production in CD4+ T cells
OVA-sensitized CD4+ T cells from the BAL fluid of ATF3-null mice had increased capacity to produce IL4, IL5, and IL13 compared with their WT counterparts (Fig. 5 B). This was paralleled by increased cytokine production after OVA peptide stimulation (Fig. 5 C). IL4, IL5, and IL13 secretion was also increased as determined by ELISA (unpublished data).
ATF3 binds to the IL4, IL5, and IL13 promoters in Th2 lymphocytes
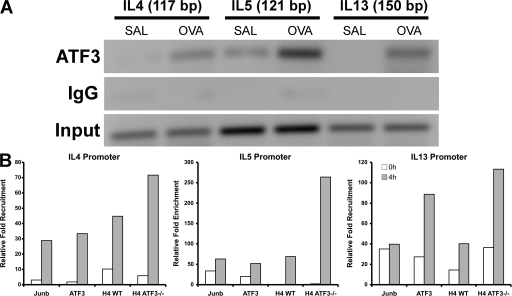
We used MotifMogul (12) to predict ATF3 binding sites in the IL4, IL5, and IL13 promoters and identified a single site with a high degree of confidence in each promoter. These predictions were validated by chromatin immunoprecipitation (ChIP; Fig. 6 A). Additional experiments demonstrated that treatment of mice with the OVA peptide further increased ATF3 binding to the IL4, IL5, and IL13 promoters in CD4+ lymphocytes (Fig. 6 A). These results indicate that IL4, IL5, and IL13 are direct binding targets of ATF3. Multiple AP1 and NFAT sites have been identified in the Th2 cytokine locus and these are thought to coordinate transcription. Our ChIP experiments demonstrated that Junb was recruited to a site in close apposition to the ATF3 binding site in the target promoters (Fig. 6 B), whereas c-Fos, Fos B, Fra-1, and Fra-2 were not (not depicted).
Figure 6.
In vivo ATF3 recruitment and histone acetylation in the Th2 cytokine locus. (A) ChIP analysis of ATF3 to predicted binding sites in the IL4, IL5, and IL13 promoters. CD4+ cells were isolated from BAL fluid of WT mice that had been treated with saline (Sal) or OVA. ChIP was performed, as outlined in Materials and methods, using rabbit anti-ATF3 antibody. DNA from input or immunoprecipitated (ATF3) fractions was measured by PCR amplification of specific promoter sequences. Results are pooled chromatin samples representative of three mice. (B) ChIP analysis assessing ATF3 binding, Junb binding, and histone H4 acetylation on the IL4, IL5, and IL13 promoters. CD4+ lymphocytes purified from spleens of WT and ATF3-null mice were differentiated for 72 h under Th2 conditions and then left unstimulated (0 h) or stimulated with anti-CD3/anti-CD28 antibodies for 4 h. ChIP was performed as outlined in Materials and methods, and quantitative PCR analysis was performed with promoter-specific primers as indicated above each graph. The y-axis of each graph represents the level of specific antibody precipitation relative to the total input control for each cell type.
ATF3 regulates histone acetylation at the IL4, IL5, and IL13 promoters
TF and cofactors act together to produce sustained gene transcription via modification to histone structure that enhances TF accessibility (14). ATF3 may also be involved in this process, as we have previously shown ATF3-related HDAC1 binding and associated histone deacetylation at H3 and H4 residues. Such modifications, in the main, are involved with transcriptional inhibition. We thus investigated histone acetylation in the IL4, IL5, and IL13 promoters in WT and ATF3-null CD4+ lymphocytes. In these studies, naive CD4 cells were cultured under Th2 conditions and then processed for ChIP. WT cells showed significant H4 acetylation at the IL4, IL5, and IL13 promoters, whereas cells from ATF3-null mice showed an increase in histone acetylation at the IL4, IL5, and IL13 promoters (Fig. 6 B).
Chemokine gene induction
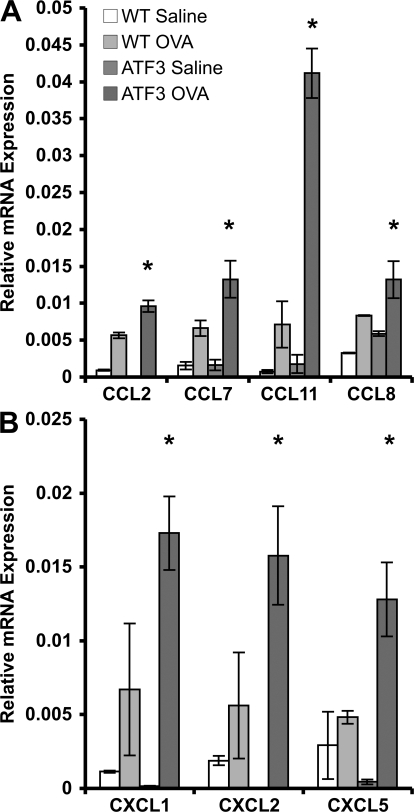
Previous studies identified chemokines as particularly important for cellular influx into the asthmatic lung (15, 16). Consistent with this observation, there was a dramatic increase in several CCL chemokines, CCL2, 7, 8, and 11, in the lungs of OVA-sensitized/challenged ATF3-null mice when compared with their WT counterparts (Fig. 7 A). CCL11 is the eosinophil-specific chemokine, eotaxin 1. In addition, other chemokines, including CXCL1, 2, and 5 are also highly up-regulated in the lungs of OVA-treated ATF3-null mice (Fig. 7 B).
Figure 7.
Enhanced chemokine expression in allergic airway hyperresponsiveness in ATF3-null mice. (A and B) CCL (A) and CXCL (B) mRNAs were determined by realtime PCR in whole-lung tissue from saline- and OVA-treated WT and ATF3-null mice on day 29. Results are expressed as relative mRNA compared with EF1a. *, P < 0.05 by comparison to WT. Error bars show mean ± SEM.
DISCUSSION
ATF3 is a member of the CREB/ATF family of BZip TFs that participate in a wide variety of biological phenomena including development, memory, and apoptosis (17). We recently demonstrated that ATF3 is a negative regulator of TLR4-induced inflammation (12), and we show in this paper that it significantly dampens the development of allergic airway inflammation. Our observations provide a clear link between severe asthmatic inflammation and airway disease with the defect in transcriptional control mediated by the TF ATF3.
ATF3 is activated in response to allergen challenge in the lungs of WT mice and contributes to the regulation of the Th2 cytokines IL4, IL5 and IL13, as well as many CCL chemokine genes that contribute significantly to immune cell influx into the lung (15). These increased cytokine levels can account for some of the key effects on the asthma phenotype seen in these mice. IL13 induces differentiation of goblet cells and secretion of mucin in the airways of mice after allergen challenge (18). IL4 induces typical Th2 responses, including airway goblet cell metaplasia in a mouse asthma model (19). IL5 promotes growth and maturation of eosinophil precursors and stimulates chemotaxis of mature eosinophils, prolonging their survival in allergic inflammatory tissue sites by inhibition of apoptosis (20).
Similar levels of OVA-specific IgE and IgG1 were induced in ATF3-null mice, indicating that they are competent in their ability to generate OVA-specific T cell responses and undergo Ig isotype switching, although this is not enhanced despite increased Th2 cytokine production. It has been previously shown that IL4, through the induction of the TF STAT6, directs the transactivation of the Cε and Cγ1 promoters (21). Thus, ATF3 is not absolutely required for IgE and IgG1 expression, nor does it appear to play a role in dampening IgE production. The diminished OVA-specific IgG2a in ATF3-null mice are interesting, as IFN-γ regulation of the transcription factor TBX21 (T-bet) in B-lymphocytes controls IgG class switching to IgG2a (22). As IFN-γ levels were undetectable in the BAL of ATF3-null mice (unpublished data), it is possible that the severe Th2 skewing in the ATF3-null animals accounts for this stark phenomenon. However, direct induction of T-bet transcription by ATF3 cannot be ruled out and will require further investigation.
We previously identified ATF3 as a component of NF-κB–containing transcriptional complexes in LPS-triggered macrophages. In this study, we show that ATF3 functions in AP-1–containing complexes in Th2-skewed CD4 lymphocytes and that ATF3 binds to the Th2 cytokine promoters in close proximity to the AP-1 family TF, Junb. Junb has previously been shown to be necessary for the induction of IL4, IL5, and IL13 (23, 24). Previous work indicates that ATF3 can physically interact with many AP-1 family members including Junb (25). Thus, in Th2-skewed CD4 lymphocytes, ATF3 and Junb function in a feed-forward loop.
The selective allergen-induced production of Th2 cytokines and chemokines in association with diminished IFN-γ production is a hallmark of the asthmatic response (26). Th2 skewing has been mechanistically linked to changes in chromatin structure (6). Our previous observations demonstrating changes in chromatin structure after regulated binding of ATF3 and HDAC1 (12) suggest a possible mechanism for Th2 cytokine regulation by this TF.
The promoters of IL4 and IL13 share similar cis-regulatory elements within 500 bp of the transcription start site (TSS) that bind multiple TFs, particularly NFAT and AP-1 (Junb), which strongly synergize to induce transcription (27). These NFAT/AP-1 regions are called P sites and act via cooperative binding to form a higher order transcriptional complex. We identified ATF3 recruitment to the essential P2 region of the IL4 promoter (28). Importantly, Type I HDAC (HDAC1, 2, or 3) activity has been identified in this region of the promoter (29). Therefore, ATF3-mediated HDAC1 recruitment and resulting effects on histone acetylation levels offer a mechanistic explanation for this observation. Significantly less is known about regulatory regions of the IL13 promoter, although the ATF3 binding site is also, amid P sites, closely opposed to the TSS (30). These similarities in promoter binding site architecture and histone regulation may lead to the shared expression kinetics of IL4 and IL13.
Transcriptional control of the IL5 promoter is less completely described. There are four cis elements necessary for full transcriptional activation (31). The first of these, termed IL5A, is found −940 bp from the TSS and is within ∼40 bp of the ATF3 binding site. This is the upstream enhancer region of IL5, and deletion of these sites inhibits transcription by ∼50% (31). As ATF3 can recruit HDAC activity to these sites, resulting in condensed chromatin and inhibited gene transcription, this may be a necessary regulatory switch in Th2 cytokine production.
A significant hallmark of asthma is accumulation of eosinophils, neutrophils, lymphocytes, and macrophages in the lung, a process which is highly dependent on chemokines. This cellular influx is directly proportional to disease severity. Many cell types contribute to chemokine mRNA profiles seen in asthmatic lung tissue (32). IL13 is known to induce chemokine expression, a mechanism that was only partly dependent on STAT6 expression (33, 34). Macrophages are significant producers of lung chemokines and can respond to IL13 through PPAR receptor signaling pathway, which may explain this phenomenon (35). Conversely, ATF3 may play a direct regulatory role in controlling chemokine expression, as has been previously shown for RANTES (36) and CCL4 (37). Like the Th2 cytokine locus, CCL and CXCL chemokines are also clustered on mouse chromosomes 11 and 5, respectively (38). Our data showing the enhanced up-regulation of these clustered CCL chemokines define a potential mechanism to explain the pronounced inflammatory cell infiltrate in ATF3-null mice leading to asthmatic exacerbation. Given the complex interplay between diverse cell types, signaling pathways, and cis-regulatory regions contributing to the exacerbated chemokine profiles seen in the lungs of ATF3-null mice, elucidation of this mechanism will require more in-depth and cell-specific examination.
In conclusion, ATF3-null mice generate a complete asthma-like phenotype, including airway inflammation, remodeling, and resulting hyperresponsiveness, and a lack of responsiveness from the ATF3 pathway confers susceptibility to severe allergic disease.
MATERIALS AND METHODS
Animals.
C57/Bl6 mice were purchased from Charles River Laboratories. ATF3−/− mice were a gift from T. Hai (Ohio State University, Columbus, OH). All animal use procedures were approved by the University of Washington Animal Care Committee (Seattle, WA).
Allergen sensitization and challenge.
Mice were sensitized and later challenged with OVA (Thermo Fisher Scientific) as previously described (39). All solutions, including OVA, were negative when tested for LPS contamination by the Limulus assay (sensitivity >0.01 ng/ml LPS; Sigma-Aldrich). Mice were immunized with 100 μg OVA complexed with aluminum hydroxide in a 0.2-ml volume, administered by i.p. injection on days 0 and 14. Mice were anesthetized i.p. with 130 mg/kg ketamine and 8.8 mg/kg xylazine in normal saline before receiving an intranasal dose of 100 μg OVA (0.05 ml of 2 mg/ml) on day 14 and 50 μg OVA (0.05 ml of 1 mg/ml) on days 26, 27, and 28. The control group received 0.2 ml of normal saline with alum i.p. on days 0 and 14 and 0.05 ml saline without alum intranasally on days 14, 26, 27, and 28.
Pulmonary function testing.
On day 29, invasive pulmonary mechanics were measured in mice in response to methacholine in the same manner as previously described (39). The mice, ventilated with a tidal volume of 200 μl and respiratory rate of 120 breaths per minute using a MiniVent ventilator for mice (Harvard Bioscience), received aerosolized solutions of methacholine (0, 3.125, 6.25, 12.5, 25, and 50 mg/ml in normal saline) via an AER 1021 nebulizer aerosol system (Buxco Research Systems) with 2.5–4-μm particle size generated by NEB0126 nebulizer head (Nektar). A commercial plethysmography system (PLY4111 plethysmograph, MAX II amplifier and pressure transducer system, and Biosystem XA software; Buxco Research Systems) was used to determine RL as calculated from measures of pressure and flow and expressed as cm H2O/ml/s).
BAL.
The right lung was isolated with a suture and lavaged with one wash of 1 ml of saline. The total number of leukocytes per 50-μl aliquot was determined after methylene blue staining. The remaining BAL fluid was centrifuged at 200 g for 5 min at 4°C, and supernatants were stored at −80°C until assay of cytokine protein levels. The remaining cells were cytospun onto glass slides. Cell differentials were determined by Diff-Quik staining (Siemens).
Lung histology.
The left lung tissue was fixed in 10% neutral buffered formalin at 20°C for 15 h. The tissues were embedded in paraffin and cut into 5-μm sections. A minimum of 10 fields was randomly examined by light microscopy by a blinded observer.
Assay of T lymphocytes.
Spleens were mechanically dissociated in cold PBS, followed by depletion of erythrocytes with lysis buffer containing NH4Cl. Naive CD4+ T cells were isolated (either from spleen cells or BAL fluid) by negative selection with (Miltenyi Biotec). Purity of CD4+ cell populations was >98% as determined by flow cytometry. Th cell cultures were established as previously described (40). In brief, CD4+ cells (106/well) were plated in RPMI 1640 (Invitrogen) containing 10% FCS, 2 mM L-glutamine, 100 U/ml penicillin, 100 μg/ml streptomycin, 10 mM Hepes (Invitrogen), and 20 μM 2-ME (Sigma-Aldrich) were incubated at 37°C in a 5% CO2 atmosphere and stimulated for 72 h in 10 μg/ml of anti–mouse CD3– and 10 μg/ml of anti–mouse CD28–coated 24-well plates (BD Biosciences). In addition, 10 ng/ml IL4 and 10 μg/ml of anti–IFN-γ antibody (Th2 conditions) or 5 ng/ml IL12 plus 10 μg/ml of anti-IL4 (Th1 conditions) or 20 μg/ml of anti-IL4, 20 μg/ml of anti-IL12, and 10 μg/ml of anti–IFN-γ (Th-neutral [Th0] conditions). After 6 d, T cells were washed in PBS and then reseeded on CD3/CD28-coated plates for the times indicated. For OVA-specific activation, CD4+ cells were incubated with 500 μg/ml OVA (Thermo Fisher Scientific) for 5 d. Cytokine analysis for IL4, IL5, and IL13 were performed by ELISPOT (BD Biosciences), according to the manufacturer's protocol.
Real-time PCR analysis.
Total RNA was prepared from lung homogenates using Trizol reagent (Invitrogen) according to the manufacturer's protocol. cDNA was produced with MMLV Reverse transcription (Promega), according to the manufacturer's recommendations, and primed with oligo d(T) (Promega). Quantitative real-time PCR was performed on an ABI 7700 (Applied Biosystems) using TaqMan Universal PCR Master Mix (Applied Biosystems). Commercially available primer/probe pairs (Applied Biosystems) were used at a final concentration of 0.9 mM. The PCR program was as follows: 50°C for 2 min and 95°C for 10 min (95°C for 15 s and 60°C for 1 min) for 40 cycles. All data were normalized to EF1-α expression in the same cDNA set.
Western blot.
Lung homogenates were dissociated in 500 μl RIPA buffer (PBS and 1% NP-40). 10 μg of protein from each sample was mixed with Laemmli loading buffer. Samples were separated on a 4–20% gradient SDS-PAGE gel and transferred onto a PVDF membrane (Bio-Rad Laboratories). The membrane was then incubated with primary antibodies for 1 h at room temperature. The secondary antibody, horseradish peroxidase–conjugated goat anti–rabbit IgG (1/5,000; AbD Serotec) was incubated for 1 h at room temperature. Labeling was detected by chemiluminescence by addition of SuperSignal substrate solution (Thermo Fisher Scientific).
ChIP.
After stimulation, lymphocytes were fixed in formaldehyde and ChIP assay was performed, as previously described, with rabbit anti-ATF3 antibody (C terminus; Santa Cruz Biotechnology, Inc.), Anti-Junb (Santa Cruz Biotechnology, Inc.), Anti-c-Fos (Pan; Santa Cruz Biotechnology, Inc.), and anti-acetylated histone-H4 (Millipore) (12). Quantitative real-time PCR was performed using primers specific for the predicted ATF3 binding region of IL4, IL5, and IL13 with TaqMan Universal PCR Master Mix (Applied Biosystems) and SYBR green detection. IL4 forward, 5′-GGTCTAGGATGCGAGAAGGT-3′; and reverse, 5′-GCCTAGCTGCTTCCTGCTAT-3′. IL5 forward, 5′-CGAACCTGCTGTGTGTGACA-3′; and reverse, 5′-TGCTTTGGTGGCTTGGCCTT-3′. IL13 forward, 5′-AGCGGCCACTGGATTTTCCA-3′; and reverse, 5′-CTTGTGGCCTTAGCCTGTTG-3′. Fold enrichment after real-time PCR was calculated as follows: 2^ – (CtEts1Ctinput)/2^ – (CtrbIg – Ctinput).
ELISA.
IL4, IL5, and IL13 levels were measured using specific commercially available ELISA assays according to the manufacturer's protocols (R&D Systems). OVA-specific IgE and IgG were determined in serum samples collected at the time of sacrifice. The OD was read on a microplate reader (EL 340; BioTek) at 450 nm.
Statistical analysis.
Data were analyzed using analysis of variance, followed by the Bonferroni test for comparisons. P-values <0.05 were considered significant. Differences in pulmonary function data were analyzed by linear regression followed by the Fisher's protected least-significant difference test.
Acknowledgments
This work was funded by grants from the National Institutes of Health (A. Aderem and W.R. Henderson). M. Gilchrist is a recipient of a Fellowship from the Alberta Heritage Foundation for Medical Research.
The authors have no conflicting financial interests.
Abbreviations used: ATF3, activating TF 3; BAL, bronchoalveolar lavage; ChIP, chromatin immunoprecipitation; OVA, ovalbumin; TF, transcription factor; TSS, transcription start site.
M. Gilchrist and W.R. Henderson Jr. contributed equally to this paper.
References
- 1.Eder, W., M.J. Ege, and E. von Mutius. 2006. The asthma epidemic. N. Engl. J. Med. 355:2226–2235. [DOI] [PubMed] [Google Scholar]
- 2.Busse, W.W., and R.F. Lemanske Jr. 2001. Asthma. N. Engl. J. Med. 344:350–362. [DOI] [PubMed] [Google Scholar]
- 3.Salvi, S.S., K.S. Babu, and S.T. Holgate. 2001. Is asthma really due to a polarized T cell response toward a helper T cell type 2 phenotype? Am. J. Respir. Crit. Care Med. 164:1343–1346. [DOI] [PubMed] [Google Scholar]
- 4.Herrick, C.A., and K. Bottomly. 2003. To respond or not to respond: T cells in allergic asthma. Nat. Rev. Immunol. 3:405–412. [DOI] [PubMed] [Google Scholar]
- 5.Barnes, P.J. 2006. Transcription factors in airway diseases. Lab. Invest. 86:867–872. [DOI] [PubMed] [Google Scholar]
- 6.Ansel, K.M., D.U. Lee, and A. Rao. 2003. An epigenetic view of helper T cell differentiation. Nat. Immunol. 4:616–623. [DOI] [PubMed] [Google Scholar]
- 7.Courtois, G., and T.D. Gilmore. 2006. Mutations in the NF-kappaB signaling pathway: implications for human disease. Oncogene. 25:6831–6843. [DOI] [PubMed] [Google Scholar]
- 8.Clohisy, J.C., B.C. Roy, C. Biondo, E. Frazier, D. Willis, S.L. Teitelbaum, and Y. Abu-Amer. 2003. Direct inhibition of NF-kappa B blocks bone erosion associated with inflammatory arthritis. J. Immunol. 171:5547–5553. [DOI] [PubMed] [Google Scholar]
- 9.Christman, J.W., R.T. Sadikot, and T.S. Blackwell. 2000. The role of nuclear factor-kappa B in pulmonary diseases. Chest. 117:1482–1487. [DOI] [PubMed] [Google Scholar]
- 10.Kagoshima, M., K. Ito, B. Cosio, and I.M. Adcock. 2003. Glucocorticoid suppression of nuclear factor-kappa B: a role for histone modifications. Biochem. Soc. Trans. 31:60–65. [DOI] [PubMed] [Google Scholar]
- 11.Yang, L., L. Cohn, D.H. Zhang, R. Homer, A. Ray, and P. Ray. 1998. Essential role of nuclear factor κB in the induction of eosinophilia in allergic airway inflammation. J. Exp. Med. 188:1739–1750. [DOI] [PMC free article] [PubMed] [Google Scholar]
- 12.Gilchrist, M., V. Thorsson, B. Li, A.G. Rust, M. Korb, K. Kennedy, T. Hai, H. Bolouri, and A. Aderem. 2006. Systems biology approaches identify ATF3 as a negative regulator of Toll-like receptor 4. Nature. 441:173–178. [DOI] [PubMed] [Google Scholar]
- 13.Hai, T., and M.G. Hartman. 2001. The molecular biology and nomenclature of the activating transcription factor/cAMP responsive element binding family of transcription factors: activating transcription factor proteins and homeostasis. Gene. 273:1–11. [DOI] [PubMed] [Google Scholar]
- 14.Ouyang, W., M. Lohning, Z. Gao, M. Assenmacher, S. Ranganath, A. Radbruch, and K.M. Murphy. 2000. Stat6-independent GATA-3 autoactivation directs IL-4-independent Th2 development and commitment. Immunity. 12:27–37. [DOI] [PubMed] [Google Scholar]
- 15.Fulkerson, P.C., N. Zimmermann, L.M. Hassman, F.D. Finkelman, and M.E. Rothenberg. 2004. Pulmonary chemokine expression is coordinately regulated by STAT1, STAT6, and IFN-gamma. J. Immunol. 173:7565–7574. [DOI] [PubMed] [Google Scholar]
- 16.Gonzalo, J.A., C.M. Lloyd, D. Wen, J.P. Albar, T.N. Wells, A. Proudfoot, A.C. Martinez, M. Dorf, T. Bjerke, A.J. Coyle, and J.C. Gutierrez-Ramos. 1998. The coordinated action of CC chemokines in the lung orchestrates allergic inflammation and airway hyperresponsiveness. J. Exp. Med. 188:157–167. [DOI] [PMC free article] [PubMed] [Google Scholar]
- 17.Mayr, B., and M. Montminy. 2001. Transcriptional regulation by the phosphorylation-dependent factor CREB. Nat. Rev. Mol. Cell Biol. 2:599–609. [DOI] [PubMed] [Google Scholar]
- 18.Tyner, J.W., E.Y. Kim, K. Ide, M.R. Pelletier, W.T. Roswit, J.D. Morton, J.T. Battaile, A.C. Patel, G.A. Patterson, M. Castro, et al. 2006. Blocking airway mucous cell metaplasia by inhibiting EGFR antiapoptosis and IL-13 transdifferentiation signals. J. Clin. Invest. 116:309–321. [DOI] [PMC free article] [PubMed] [Google Scholar]
- 19.Fallon, P.G., H.E. Jolin, P. Smith, C.L. Emson, M.J. Townsend, R. Fallon, P. Smith, and A.N. McKenzie. 2002. IL-4 induces characteristic Th2 responses even in the combined absence of IL-5, IL-9, and IL-13. Immunity. 17:7–17. [DOI] [PubMed] [Google Scholar]
- 20.Kay, A.B. 2001. Allergy and allergic diseases. First of two parts. N. Engl. J. Med. 344:30–37. [DOI] [PubMed] [Google Scholar]
- 21.Bacharier, L.B., and R.S. Geha. 2000. Molecular mechanisms of IgE regulation. J. Allergy Clin. Immunol. 105:S547–S558. [DOI] [PubMed] [Google Scholar]
- 22.Peng, S.L., S.J. Szabo, and L.H. Glimcher. 2002. T-bet regulates IgG class switching and pathogenic autoantibody production. Proc. Natl. Acad. Sci. USA. 99:5545–5550. [DOI] [PMC free article] [PubMed] [Google Scholar]
- 23.Li, B., C. Tournier, R.J. Davis, and R.A. Flavell. 1999. Regulation of IL-4 expression by the transcription factor JunB during T helper cell differentiation. EMBO J. 18:420–432. [DOI] [PMC free article] [PubMed] [Google Scholar]
- 24.Hartenstein, B., S. Teurich, J. Hess, J. Schenkel, M. Schorpp-Kistner, and P. Angel. 2002. Th2 cell-specific cytokine expression and allergen-induced airway inflammation depend on JunB. EMBO J. 21:6321–6329. [DOI] [PMC free article] [PubMed] [Google Scholar]
- 25.de Groot, R.P., O. Kranenburg, L. de Wit, J. van den Eijnden-van Raaij, C. Mummery, A.J. van der Eb, and A. Zantema. 1995. Adenovirus E1A antagonizes both negative and positive growth signals elicited by transforming growth factor beta 1. Cell Growth Differ. 6:531–540. [PubMed] [Google Scholar]
- 26.Ansel, K.M., I. Djuretic, B. Tanasa, and A. Rao. 2006. Regulation of Th2 differentiation and Il4 locus accessibility. Annu. Rev. Immunol. 24:607–656. [DOI] [PubMed] [Google Scholar]
- 27.Li-Weber, M., and P.H. Krammer. 2003. Regulation of IL4 gene expression by T cells and therapeutic perspectives. Nat. Rev. Immunol. 3:534–543. [DOI] [PubMed] [Google Scholar]
- 28.Takemoto, N., N. Koyano-Nakagawa, N. Arai, K. Arai, and T. Yokota. 1997. Four P-like elements are required for optimal transcription of the mouse IL-4 gene: involvement of a distinct set of nuclear factor of activated T cells and activator protein-1 family proteins. Int. Immunol. 9:1329–1338. [DOI] [PubMed] [Google Scholar]
- 29.Valapour, M., J. Guo, J.T. Schroeder, J. Keen, A. Cianferoni, V. Casolaro, and S.N. Georas. 2002. Histone deacetylation inhibits IL4 gene expression in T cells. J. Allergy Clin. Immunol. 109:238–245. [DOI] [PubMed] [Google Scholar]
- 30.Lavenu-Bombled, C., C.D. Trainor, I. Makeh, P.H. Romeo, and I. Max-Audit. 2002. Interleukin-13 gene expression is regulated by GATA-3 in T cells: role of a critical association of a GATA and two GATG motifs. J. Biol. Chem. 277:18313–18321. [DOI] [PubMed] [Google Scholar]
- 31.Lee, H.J., E.S. Masuda, N. Arai, K. Arai, and T. Yokota. 1995. Definition of cis-regulatory elements of the mouse interleukin-5 gene promoter. Involvement of nuclear factor of activated T cell-related factors in interleukin-5 expression. J. Biol. Chem. 270:17541–17550. [DOI] [PubMed] [Google Scholar]
- 32.Lukacs, N.W., S.H. Oliveira, and C.M. Hogaboam. 1999. Chemokines and asthma: redundancy of function or a coordinated effort? J. Clin. Invest. 104:995–999. [DOI] [PMC free article] [PubMed] [Google Scholar]
- 33.Zhu, Z., B. Ma, T. Zheng, R.J. Homer, C.G. Lee, I.F. Charo, P. Noble, and J.A. Elias. 2002. IL-13-induced chemokine responses in the lung: role of CCR2 in the pathogenesis of IL-13-induced inflammation and remodeling. J. Immunol. 168:2953–2962. [DOI] [PubMed] [Google Scholar]
- 34.Fulkerson, P.C., C.A. Fischetti, L.M. Hassman, N.M. Nikolaidis, and M.E. Rothenberg. 2006. Persistent effects induced by IL-13 in the lung. Am. J. Respir. Cell Mol. Biol. 35:337–346. [DOI] [PMC free article] [PubMed] [Google Scholar]
- 35.Coste, A., C. Lagane, C. Filipe, H. Authier, A. Gales, J. Bernad, V. Douin-Echinard, J.C. Lepert, P. Balard, M.D. Linas, et al. 2008. IL-13 Attenuates Gastrointestinal Candidiasis in Normal and Immunodeficient RAG-2−/− Mice via Peroxisome Proliferator-Activated Receptor-{gamma} Activation. J. Immunol. 180:4939–4947. [DOI] [PubMed] [Google Scholar]
- 36.Boehlk, S., S. Fessele, A. Mojaat, N.G. Miyamoto, T. Werner, E.L. Nelson, D. Schlondorff, and P.J. Nelson. 2000. ATF and Jun transcription factors, acting through an Ets/CRE promoter module, mediate lipopolysaccharide inducibility of the chemokine RANTES in monocytic Mono Mac 6 cells. Eur. J. Immunol. 30:1102–1112. [DOI] [PubMed] [Google Scholar]
- 37.Khuu, C.H., R.M. Barrozo, T. Hai, and S.L. Weinstein. 2007. Activating transcription factor 3 (ATF3) represses the expression of CCL4 in murine macrophages. Mol. Immunol. 44:1598–1605. [DOI] [PubMed] [Google Scholar]
- 38.Nomiyama, H., K. Egami, S. Tanase, R. Miura, H. Hirakawa, S. Kuhara, J. Ogasawara, S. Morishita, O. Yoshie, J. Kusuda, and K. Hashimoto. 2003. Comparative DNA sequence analysis of mouse and human CC chemokine gene clusters. J. Interferon Cytokine Res. 23:37–45. [DOI] [PubMed] [Google Scholar]
- 39.Henderson, W.R. Jr., E.Y. Chi, J.G. Bollinger, Y.T. Tien, X. Ye, L. Castelli, Y.P. Rubtsov, A.G. Singer, G.K. Chiang, T. Nevalainen, et al. 2007. Importance of group X–secreted phospholipase A2 in allergen-induced airway inflammation and remodeling in a mouse asthma model. J. Exp. Med. 204:865–877. [DOI] [PMC free article] [PubMed] [Google Scholar]
- 40.Avni, O., D. Lee, F. Macian, S.J. Szabo, L.H. Glimcher, and A. Rao. 2002. T(H) cell differentiation is accompanied by dynamic changes in histone acetylation of cytokine genes. Nat. Immunol. 3:643–651. [DOI] [PubMed] [Google Scholar]


