

Abstract
On- and off-center geniculate afferents form two major channels of visual processing that are thought to converge in the primary visual cortex. However, humans with severely reduced on-responses can have normal visual acuity when tested in a white background, which indicates that off-channels can function relatively independently of on-channels under certain conditions. Consistent with this functional independence of channels, here we demonstrate that on- and off-center geniculate afferents segregate in different domains of the cat primary visual cortex and that off-responses dominate the cortical representation of the area centralis. On average, 70% of the geniculate afferents converging at the same cortical domain had receptive fields of the same contrast polarity. Moreover, off-center afferents dominated the representation of the area centralis in the cortex but not in the thalamus, indicating that on- and off-center afferents are balanced in number but not in the amount of cortical territory that they cover.
Introduction
Visual information is transferred from the retina to the visual cortex through two major functional channels that process local increments (on channel) or decrements (off channel) in light with respect to a mean background. Although on and off visual channels were traditionally described as reversed versions of each other, increasing evidence indicate that they are very different. Even at the level of the retina, on- and off-center retinal ganglion cells can differ in receptive field size, response latency, amount of rectification in their synaptic inputs and their specific circuitry 1, 2. Differences between on- and off-retinal ganglion cells, either anatomical or physiological, have been reported in mice 2, rats 3, dogs 4 and humans 5. Moreover, at early stages of development in ferrets, off-center retinal ganglion cells have higher firing rates than their on-center counterparts 6, and dark rearing has very different effects on the development of on and off ganglion cells.
On and off channels are not only quantitatively different but they also segregate in different neuronal compartments both at the level of the retina and the Lateral Geniculate Nucleus (LGN). In the retina, on and off visual channels segregate in different sublayers 7, 8 and a similar sublayer segregation has been reported in the LGN of the macaque 9, cat 10, 11, ferret 12, tree shrew 13 and mink 14, with off-center afferents being found in layers/sublayers of LGN closer to the optic tract than on-center afferents.
On- and off-center neurons converge for first time at the level of the primary visual cortex to build cortical receptive fields 15–17. However, while the same cortical cell can receive input from on- and off-center geniculate afferents, the number of afferents is rarely balanced: most cortical cells are either off-dominated or on-dominated. Therefore, although on- and off-channels converge at the same cortical neuron, on-dominated and off-dominated cortical neurons could still segregate within the cortex. On- and off-center geniculate afferents have been found to cluster in the ferret 18 and the mink 19. Moreover, in the tree shrew, a species where ocular dominance segregates in layers and not columns 20, on- and off-center geniculate afferents were also found to segregate in layers 21.
While the clustering of on- and off-center geniculate afferents could be interpreted as a rare specialization of the visual pathway in some animals, several computational models 22–26 suggest that this type of segregation could be a general cortical feature that is closely related to the development of orientation columns. Paradoxically, while the main predictions from these models are based on data obtained from cat visual cortex, there is currently no evidence for clustering of on- and off-center geniculate afferents in the cat. Here, we provide evidence for such clustering and, by doing so, we support the notion that on- and off-channels segregation plays an important role in cortical architecture. Some of these results were previously published in abstract form (Gordon et al., 1993 and Jin et al., 2006 Society for Neuroscience abstracts).
Results
Evidence for segregation of on- and off-center geniculate afferents was obtained independently in two different laboratories and with two different techniques: by recording geniculate afferents from the muscimol silenced cortex and by recording the current sinks generated by single geniculate afferents in the active cortex. Both techniques demonstrate clustering of geniculate afferents with the same center sign (on-center or off-center) within the cat visual cortex. Moreover, recordings in the active cortex demonstrate that off-geniculate afferents dominate the cortical representation of the area centralis. These results are consistent with a segregation of on- and off-channels within the cat visual cortex and with some level of specialization of the off visual channel at the center of vision.
Geniculate recordings in muscimol-silenced cortex
A single electrode was introduced perpendicular to the cortex and carefully aligned within a single orientation column, as verified by recordings from multiunit activity at different cortical depths (Fig. 1a). After verifying the correct vertical alignment, the electrode was moved to the top of layer 4, and muscimol (50 mM) was infused in the cortical region surrounding the electrode to silence cortical activity (74 μl/hour). After approximately 2 hours of muscimol infusion, the electrode was systematically lowered in the brain to record from single geniculate afferents and classify their receptive fields as either on- or off-center. Figure 1b shows four examples of cortical penetrations, three in which most of the geniculate afferents were of the same type (A, B and D) and one in which the afferents were mixed (C). 182 afferents were mapped in 14 penetrations, each penetration containing 7–23 afferents. In 71% of the penetrations (10/14), more than 70% of the geniculate afferents had receptive field centers of the same sign (Fig. 1c; in two of these penetrations there was a clear switch point between off-dominated and on-dominated cortical regions) with only 4 penetrations showing a clear mixing of on- and off-center geniculate afferents.
Figure 1. Recording from geniculate afferents in the muscimol-silenced cortex.


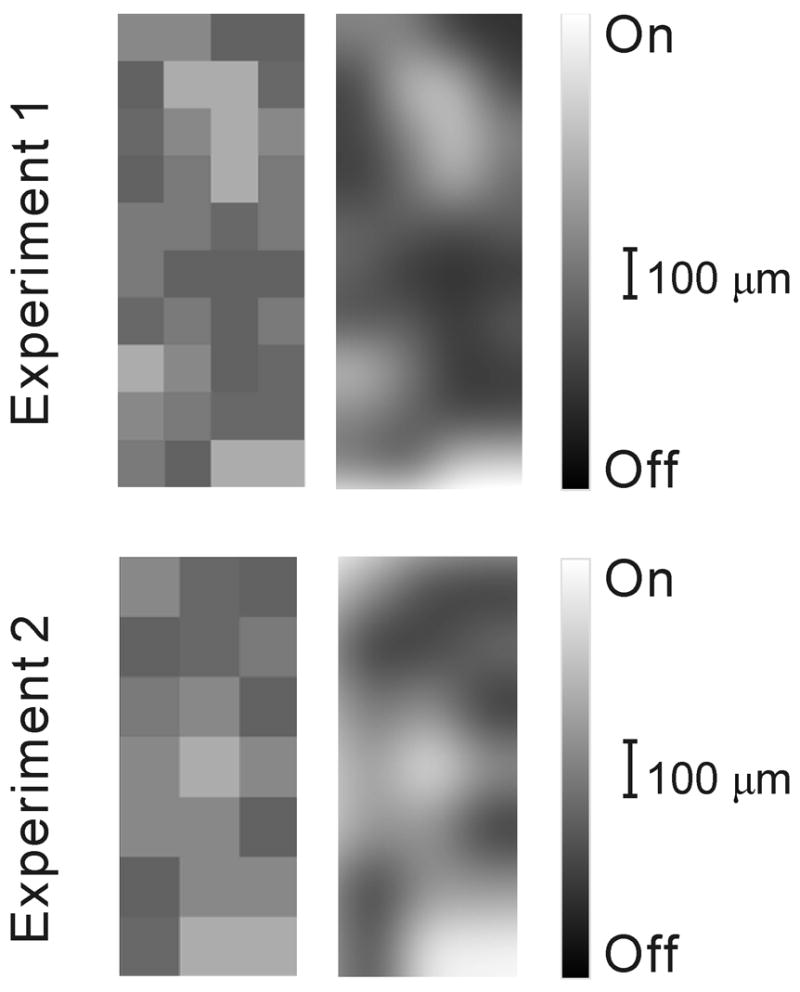
a. Cortical recordings showing a radial alignment of a single electrode penetration within a cortical orientation domain, determined before application of muscimol. Cortical layers reconstructed from histology are indicated by Roman numerals I-VI (WM: white matter). The preferred orientations of cortical neurons recorded along the course of the electrode penetration are indicated by lines. Muscimol was applied to the surface of the cortex to silence cortical activity, and after two hours, afferent receptive fields were plotted in layer IV between the two letter Ls, which show centers of lesions made at the end of the experiment. b. Four representative vertical penetrations through layer 4, two dominated by off-center afferents (A, B), one dominated by on-center afferents (D) and another one mixed (C). c. Table showing all electrode penetrations, the number of afferents recorded in each (left) and the category assigned to each penetration. d. Map showing the segregation of on- and off-center afferents obtained in two different experiments by making multiple single-electrode penetrations. Left, actual maps, luminance-coded by the fraction of off afferents. Right, identical maps smoothed by a 2-D Gaussian in order to highlight the clustering of penetrations of like type.
In two additional cats, careful mapping with multiple evenly spaced penetrations with a single microelectrode revealed cortical regions dominated by either on- or off-center geniculate afferents that were ~200–300 μm in width (Fig 1d). The arrangement of these afferents was compared with what would be expected from a random distribution using two different methods (see Methods). First, the distribution of penetrations classified by the fraction of afferents of a given center type was significantly different from a uniform distribution, by chi-squared test (P < 0.05). Second, a Monte Carlo analysis of 10,000 randomly-generated grids drawn from the experimentally-derived distribution of penetrations demonstrated that the clustering of like penetrations was significantly higher than expected for the larger grid (Experiment 1, Fig 1d, P < 0.001). Owing to its size, clustering in the smaller grid approached but did not reach significance (Experiment 2, Fig 1d, P = 0.16)
Recordings from geniculate afferents in active cortex
Recordings from geniculate afferents in the active cortex were obtained with spike-triggered current-source-density analysis (STCSD 27). Neuronal activity was simultaneously recorded with 16 vertically arranged electrodes in the primary visual cortex (Neuronexus technologies, MI) and 7 independently movable electrodes in the LGN (7-Channel Thomas Recording array, Germany), all in precise retinotopic alignment (Fig. 2a, left). Well-isolated spikes from each geniculate cell were used to trigger-average field potentials recorded at each of the 16 cortical sites, and the field potentials were then used to calculate the current sink generated by each geniculate afferent in the cortex (Fig. 2a, middle). The current sink generated by each single geniculate afferent was focused within layer 4 (and sometimes also in layer 6) and had a triphasic time-course that corresponded to the spike recorded from the geniculate axonal terminal within the cortex, a synaptic delay and a postsynaptic sink (Fig. 2a, right). The time-course and depth profile of these single-afferent current sinks were virtually identical to those previously described for thalamic afferents in the somatosensory cortex 27.
Figure 2. Recording from geniculate afferents in active cortex.

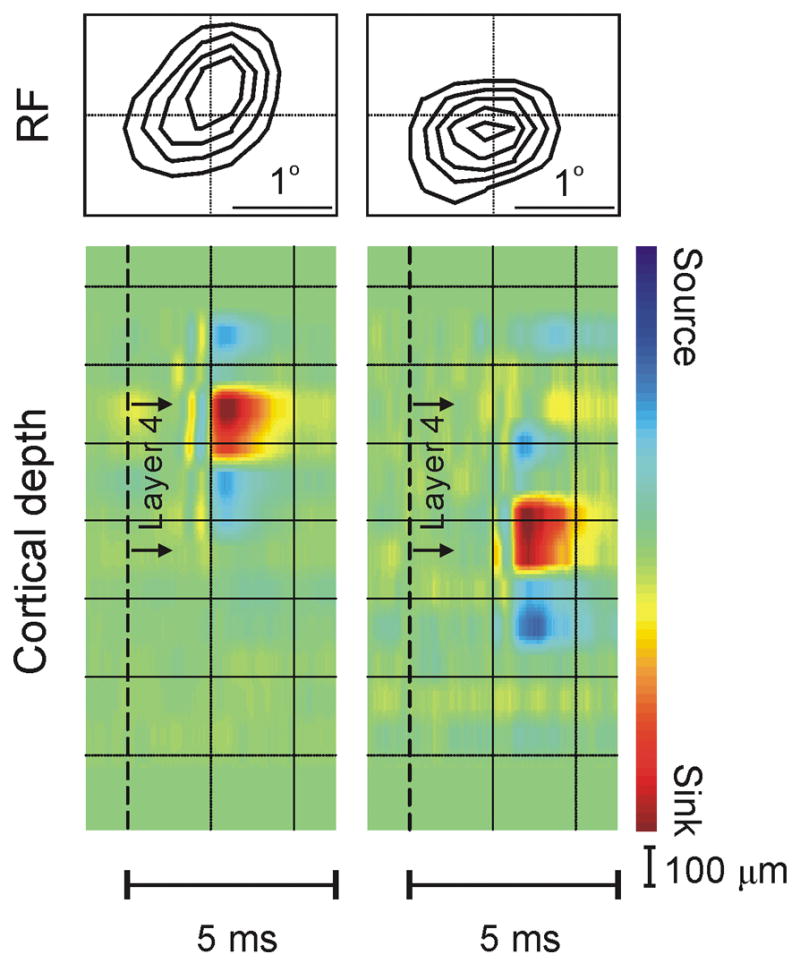

a. Simultaneous recordings from single cells in LGN and local field potentials in the visual cortex. Well-isolated spikes from a single geniculate cell were used as triggers to obtain spike-triggered field potentials for each cortical channel. The time of the geniculate spike is indicated by the vertical dashed lines in the depth profiles shown in (a) and (b). The second spatial derivative of these field potentials, which is directly proportional to the current density at a point, was estimated by current-source-density analysis. The result from this spike-triggered current-source-density (STCSD) analysis is shown through the depth of the cortex as individual traces and a colorized image. b. Example of two geniculate cells that generated current sinks at the same cortical domain and had overlapping receptive fields of the same sign. The cell on the left was of Y type and the one on the right of X type. As expected from previous anatomical studies 29, the Y cell had faster conduction velocity and projected higher within layer 4 than the X cell. c. 70% of the geniculate cell pairs converging at the same cortical domain had receptive fields of the same sign (n = 37, P = 0.014, Chi-square test). The frequency of cell pairs with receptive fields of the same sign is shown as a function of receptive field overlap for all cell pairs (left), cell pairs of the same type (right top), and cell pairs of different type (right bottom).
Since several geniculate cells were simultaneously recorded, it was possible to identify pairs of geniculate cells that generated significant current sinks at the same cortical domain (see methods for significance criteria). Figure 2b shows an example of one such pair of cells with off-center receptive fields that were classified as Y (left) and X (right) based on their linearity of spatial summation 28. Consistently with the anatomy 29–31, the current sink generated by the Y cell (left) displayed a shorter presynaptic conduction delay and was located more superficially within layer 4 than the current sink generated by the X cell (right). Like the cell pair illustrated in this example, 70% of the geniculate cell pairs converging at the same cortical domain had receptive fields of the same sign, either both off or both on (P = 0.014, n = 37, Chi-square test, Fig. 2c).
The results from Figures 1 and 2 lead us to conclude that on- and off-center geniculate afferents are not homogeneously distributed within the cat primary visual cortex. This conclusion is further supported by a surprising result from STCSD analysis: off-center geniculate afferents are over represented at the center of vision in the cortex. While in the visual periphery (> 5 degrees of eccentricity) the number of current sinks generated by on-center and off-center afferents was balanced, near the cortical representation of the area centralis (0 - 5 degrees of eccentricity), 74% of the measured current sinks were generated by off-center geniculate afferents (19/26, P = 0.018, Chi-square test, data obtained from 9 cats, Fig. 3a). This surprising off-dominance at the area centralis did not seem to be due to a larger number of off-center geniculate afferents. In fact, on-center afferents seemed slightly more numerous than off-center afferents in the thalamus, although the difference was not significant (60 versus 42, P = 0.07, Chi-square test, Fig. 3b).
Figure 3. Off-center geniculate cells dominate the representation of the area centralis in cat visual cortex.


a Near the cortical representation of the area centralis (< 5 degrees eccentricity), current sinks generated by off-center geniculate afferents were more frequently found than current sinks generated by on-center geniculate afferents (P = 0.02, Chi-square test, data obtained from 9 cats). This difference was not found outside of the area centralis. b. Recordings from LGN demonstrate that on- and off-center geniculate cells are balanced in number at two different eccentricity ranges. Significance was assessed with a Chi-square test (n.s.: not significant; *: P = 0.018).
Consistent with the off dominance revealed in the current sinks, cortical simple cells near the area centralis were more frequently off-dominated than on-dominated. Figure 4 illustrates the spatial receptive fields from pairs of neighboring cortical simple cells that were simultaneously recorded with the same electrode tip within ~5 degrees of the area centralis (using standard, sharp electrodes for extracellular recording). The spatial arrangement of neighboring receptive fields was very diverse (Fig. 4a): some cell pairs had their receptive fields in counterphase (in pairs 1 and 2, the off-subregion of one simple cell overlaps the on-subregion of the other cell) while others did not (in cell pairs 3 and 4, the off-subregions overlap). However, in contrast to their diversity in spatial phase 32, most simple receptive fields were similar in that they were off-dominated (Fig. 4b). Seven of the eight simple receptive fields shown in figure 4a had dominant off-subregions and, on average, pairs of off-dominated simple cell subregions were 6 times more frequent than pairs of simple cells with on-subregions (P = 0.004, Chi square test).
Figure 4. Most cortical simple cells are off-dominated within the cortical representation of the area centralis.


a Examples from four pairs of neighboring simple cells (each cell pair was recorded from the same electrode). Each column shows the receptive fields for each cell (top and middle panels) and the receptive field sum at the bottom. The top left corner of each panel provides a subregion-strength ratio calculated as sign*non-dominant response/dominant response, where the sign is −1 when the dominant subregion is off and 1 when the dominant subregion is on (notice that most cells in this example have negative ratios, which correspond to off-dominant subregions). The correlation index at the bottom of the column was calculated by cross-correlating the two spatial receptive fields. b. Top. Cell pairs with off-dominated receptive fields were more frequently found that cell pairs with on-dominated receptive fields (p = 0.004, Chi-square test). Bottom. Correlation indices from all pairs of simple cells studied.
How can there be more off-dominated simple cells within the area centralis (Fig. 4b) if the number of on- and off-center geniculate afferents is approximately the same (Fig. 3b)? To answer this question, we measured the horizontal extent of the postsynaptic current sinks generated by individual on- and off-center geniculate afferents within the primary visual cortex. First, we identified a single geniculate afferent that generated a significant current sink within a given cortical region and then we made multiple, closely spaced, electrode penetrations to estimate the horizontal dimension of the current sink (see methods for details). Although these experiments were technically demanding, we managed to obtain a sample large enough to make some relevant comparisons (n = 19 geniculate afferents). As it would be expected from the distribution of synaptic boutons from single geniculate afferents (Fig. 5a, b blue), our measurements show that the strength of the main single-afferent current sink is normally distributed (Fig. 5a, red) and that the current sinks generated by X geniculate afferents cover smaller horizontal distances than the current sinks generated by Y geniculate afferents (Fig. 5b, red). Furthermore, as it would be expected from the low density of the synaptic boutons at the periphery of the geniculate axonal arbor 29, 33, the horizontal distance covered by the single-afferent current sink was smaller than the average distance covered by the geniculate axonal arbors (Fig. 5a, b; the average difference in Fig. 5b could also reflect incomplete sampling of some single-afferent sinks, see methods).
Figure 5. Off-center geniculate afferents cover more cortical territory than on-center geniculate afferents.


a Cortical territory covered by a single X geniculate afferent estimated as the number of synapses [blue, taken from 29] and as the strength of the single-afferent current sink measured in multiple penetrations with a 16-channel silicon probe (red). The colorized inset shows the depth profile of the single-afferent current sink measured in one of the penetrations. b. Maximum distance covered by single X and Y geniculate afferents, estimated from the anatomical reconstruction of single afferents (blue, taken from 29) and from measurements of single-afferent current sinks (red). Error bars show one standard deviation. Notice that the average Y/X distance ratio obtained with the two measurements was similar (anatomy: 1.4, physiology: 1.6), however, the measurements of current sinks are more restricted in cortical distance probably because the density of synaptic boutons is very low at the periphery of the axonal arbors and because some current sinks may have been under sampled (due to the limited number of penetrations used to measure horizontal distance). c. The current sinks generated by off-center geniculate afferents can be recorded at larger cortical distances than the current sinks generated by on-center geniculate afferents (P = 0.03, Mann-Whitney test, n = 19). The sample contains 8 off-center geniculate afferents (3 X, 4 Y and 1 non-classified cell) and 11 on-center geniculate afferents (6 X, 4 Y and 1 non-classified cell).
Interestingly, when we compared the current sinks generated by on- and off-center geniculate afferents within 5 degrees of the area centralis (Fig. 5c), the horizontal distances of the current-sinks were, on average, 1.8 times larger for off-center than on-center geniculate afferents (675 μm versus 364 μm, P = 0.03, Mann-Whitney test; within each of these groups, there was a tendency for X afferents to cover smaller distances than Y afferents although the difference did not reach significance; Xon/Yon: 283/475 μm; Xoff/Yoff: 600/800 μm). Moreover, although the average strengths of off and on postsynaptic current sinks were not significantly different within the entire sample [off: 113 microV/mm2, on: 141 microV/mm2, n = 55, P = 0.425, Mann-Whitney test), we did find a significant correlation between the strength of the postsynaptic current sink and its horizontal distance (r = 0.503, P = 0.02), and 5 out of the 6 strongest afferents recorded within the area centralis (> 100 microV/mm2) were off-center. Therefore, these results indicate that, while on- and off-center geniculate afferents are balanced in number within the cortical representation of the area centralis, they are likely to differ in the neuronal territory that they cover and the strength of the connections that they make.
The experiments making multiple, closely-spaced penetrations with the 16-channel silicon probe were also used to estimate the size of geniculate-afferent clusters within visual cortex. To estimate the average cluster size, we assumed that the dominant receptive field sign of the multiunit cortical activity measured in contiguous cortical penetrations should reflect the cortical arrangement of geniculate afferents. For example, most cortical receptive fields measured within an off-cluster of geniculate afferents should be off-dominated. Since these measurements were indirect, we used the strictest criterion possible to identify a geniculate cluster: two or more contiguous cortical penetrations were considered to be within the same cluster if all the receptive fields obtained from multiunit cortical activity in the different recording sites of the silicon probe were dominated by the same sign. By using this criterion, we were able to measure 5 clusters (4 off, 1 one) with an average cluster width of 340 ± 89 microns. The average cluster-width obtained with measurements from cortical multiunit activity is a reasonable approximation of the 200–300 micron cluster-width estimated from afferent recordings in the muscimol silenced cortex (Fig. 1d).
Discussion
We have demonstrated that on- and off-center geniculate afferents are clustered within layer 4 of the cat visual cortex, as is also the case in the ferret, mink and tree shrew 18, 19, 21. The clusters are horizontally arranged (Fig. 1) and the probability to find two geniculate afferents with the same receptive field sign in a vertical electrode penetration is ~0.7 (Fig. 1c and 2c). We also demonstrate a dominance of off-center geniculate afferents at the cortical representation of the area centralis.
These results provide support for cortical models that predict a partial segregation of on-and off-center geniculate afferents within the cat visual cortex 22–26 and they support the interesting possibility that on/off segregation could be a general feature of cortical organization and orientation maps. While the segregation of on- and off-center geniculate afferents remains to be demonstrated in the primate, some indirect observations are consistent with a possible segregation. For example, there is evidence for clustering of spatial phase in primate area V1 34 and there is also evidence that blue-on and blue-off afferents are partially segregated at the top of layer 4 in primates 35. On the other hand, a recent study demonstrated a lack of clustering for on- and off-center geniculate afferents in the rabbit, an animal that has no cortical orientation columns (Stoelzel et al., 2006 Society for Neuroscience abstract). The precise relation between the on/off segregation and the organization of orientation maps predicted by some models 22–26 still needs to be demonstrated. However, to our surprise, we did find evidence for the off-dominance predicted by one of these models within the adult primary visual cortex 23.
The clustering of on- and off-center geniculate afferents could be explained by initial inhomegeneities in the cortical distribution of the two types of afferents that could be later accentuated by Hebbian mechanisms 22. Hebbian mechanisms could also explain the dominance of off-center geniculate afferents since these afferents have been shown to dominate retinal and cortical activity at early stages of development. In the ferret retina, off-center retinal ganglion cells fire more than on-center retinal ganglion cells during the second to third week of postnatal development 6. And in the kitten cortex, the majority of cortical neurons (76%) generate only off-responses early during the second postnatal week 36. The predominance of off-cortical responses at early stages of development could allow off-center geniculate afferents to have a competitive advantage and dominate a larger cortical territory than on-center geniculate afferents. Unfortunately, there is currently no anatomical data available that could be used to compare axonal arbor sizes for on- and off-center geniculate afferents within the area centralis 29. Differences in the extent of axonal arborizations have been reported for cells of different type in the cat [e.g. Y axonal arbors are twice as large as X arbors 29] and for cells that receive input from different eyes in the tree shrew [e.g. ipsilateral eye axons are on average 3 times larger than contralateral eye axons 37]. However, the intracellular filling of single geniculate afferents is a difficult technique that so far has provided cell samples that are too small to make relevant comparisons within specific eccentricity ranges 29–31. What the intracellular fillings clearly demonstrate is that single axonal arbors cover horizontal distances within the cat (700 to 1300 μm) that are much larger than the size of the axonal clusters described here (~300 μm). The difference is likely due to the density of synaptic boutons and axonal branches, which is highest at the very center of the axon terminal and it may be ‘undetectable’ beyond just a few hundred gm from the center 29, 33.
The surprising finding that the area centralis of cats is off-dominated, together with the pronounced on/off asymmetries demonstrated in human psychophysical studies 38–42, raise the interesting possibility that the primate fovea may also be off-dominated. Because the fovea is the area with highest spatial resolution in the retina, an off-dominated fovea would explain why visual acuity is preserved in the absence of on-visual responses in both human 38 and non-human primates 43 and would also explain why recordings from visually evoked potentials in humans demonstrate finer spatial resolution in off than on visual pathways 41. Intriguingly, studies measuring Landolt C resolution demonstrate finer visual acuity in dark backgrounds than light backgrounds 39, 40, perhaps because light scatter becomes an important factor in tasks that require the detection of small gaps between lines.
The demonstration that on and off geniculate afferents segregate in cat primary visual cortex has major implications for the understanding of cortical receptive field construction and topographic mapping. Models and circuitry mechanisms that are based on the assumption that each cortical position has a balanced representation of on and off visual responses will have to be revised. This assumption has been commonly used, for example, to estimate the number of thalamic afferents per cortical column 44, number of thalamic inputs per cortical cell 45 and to estimate the contribution of specific neuronal circuits to the summed population activity of cortical domains 46. The results reported here support the relevance of models of cortical development that predict segregation of thalamic afferents by center type 22–26, and suggest that such segregation is a key feature that should be evaluated in any future modeling efforts.
Methods
Recordings from muscimol-silenced cortex
Surgery and Electrophysiological Recordings
Extracellular recordings from single geniculocortical afferents were obtained from the muscimol-treated primary visual cortices of 12 adult cats. Cats were anesthetized with ketamine (20 mg/Kg) and acepromazine (0.2 mg/Kg) followed by thiopental sodium (25 mg/ml solution administered as indicated to maintain slow waves and spindles on EEG). Tracheotomy was performed and the animals were intubated and ventilated with 2:1 mixture of N2O:O2. The animal was then paralyzed with gallamine triethiodide (10 mg/Kg/hr through an intravenous femoral catheter I.V.). Temperature, electrocardiogram, and expired CO2 were monitored to ensure adequate anesthesia and ventilation. Pupils were dilated with 1% atropine sulfate and the nictitating membranes retracted with 2% neosynephrine. The eyes were refracted and fitted with contact lenses to focus on a tangent screen placed 125 cm in front of the animal. The skull and dura overlying area 17 were removed. These procedures were approved by the UCSF Animal Care and Use Committee.
In 10 of these animals, radial electrode penetrations were made with custom-fabricated, 1.5 to 2.0 MΩ resistance, resin-coated etched tungsten microelectrodes into area 17. This resistance range was found to be well-suited for recording of individual geniculocortical afferents as well as well-isolated individual cortical neurons. Signals were amplified and filtered, and a window-discriminator was used to characterize spikes from multiple neurons and/or single geniculocortical afferents. The principal difficulty in this experiment was the alignment of the microelectrode to pass exactly radially through area 17 near the curved crown of the lateral gyrus; 1–14 exploratory penetrations, differing in inclination in the coronal plane and in lateromedial position, were made at slightly different anteroposterior positions until perfect radial alignment was obtained, as judged by the constancy of orientation preference of the cortical cells encountered as the electrode was advanced throughout the depth of the cortex from layers 2 to 6 (Fig. 1a). The electrode was then withdrawn to the top of layer 4 where it remained in place while 50mM muscimol was perfused onto a layer of gelfoam set upon the pial surface and covered with agarose, as in 47. After 2 hours of perfusion at 74 μl/hr, the cortical cells were no longer active and the perfusion was stopped. Action potentials arising from geniculocortical afferents (as verified in pilot experiments by their ability to follow rapid geniculate stimulation) were recorded throughout the depth of layer IV, as verified later by histological examination. The receptive field and center-type of each afferent were determined by using stimuli presented by hand onto the tangent screen. In 4 of these animals, the process was then repeated in the opposite hemisphere; a total of 14 radial penetrations through area 17 were studied.
In two additional animals, muscimol was applied directly to the cortex without first recording from cortical cells. Subsequently, a series of near-radial penetrations spaced at 100 μm in a rectangular grid was made in the posterior part of area 17; the receptive fields and center types of the first four afferents encountered in each penetration were ascertained.
Data analysis
In order to determine the likelihood of obtaining these results by chance, a Monte Carlo analysis was conducted. Simulated experiments were constructed from the same number of penetrations, and the same number of afferents per penetration, as the actual experiments. They were thus identical except that afferents were drawn at random from a population of on- and off-center afferents in the proportions observed. A cluster index, (1 – (# switches in center type)/(# afferents – # penetrations))*100, that expresses the probability that two successive afferents were of the same center type was calculated for each simulated experiment and compared to the cluster index of the actual experiment. Fewer than one in 100,000 simulated experiments generated a cluster index higher than that obtained from the actual data.
Two types of analysis were used in order to determine the significance of the patchy appearance of the grids. First, the distribution of penetrations with given proportions of center-type or eye-specific afferents was compared with that expected from randomly distributed afferents. Grids from both differed significantly from the expected binomial distribution for both categories (chi-squared test, P < 0.05). Second, a Monte Carlo analysis generated 10,000 grids identical to the actual data except that the locations of the penetrations within the grid were randomized. A difference score was devised which would be at a minimum when all like penetrations were grouped together. The larger grid (Fig 1d, Experiment 1) proved to be significantly patchy (P < 0.01); a lower difference score was rarely generated. The smaller grid (Fig 1d, Experiment 2) was more clustered than 4/5 of those drawn from a random population, but this difference was not deemed to be significant (P ≈ 0.16).
Recordings from Active Cortex
Surgery and preparation
In the recordings from the active cortex, cats were initially anesthetized with ketamine (10 mg/kg, intramuscular) followed by thiopental sodium (induction: 20 mg/Kg, intravenous; maintenance: 1–2 mg/Kg/hr, intravenous; additional doses supplemented as needed). At the end of the surgery, animals were paralyzed with Norcuron (0.2 mg/kg/hr, IV) and respired through an endotracheal tube. Temperature, electrocardiogram, electroencephalogram, pulse oximetry, indirect arterial pressure and expired CO2 were monitored throughout the experiment. Pupils were dilated with 1% atropine sulfate and the nictitating membranes retracted with 2% neosynephrine. Eyes were refracted, fitted with contact lenses and focused on a tangent screen. All procedures were performed in accordance to the guidelines of the U.S. Department of Agriculture and approved by the Institutional Animal Care and Use Committee at the State University of New York, State College of Optometry.
Electrophysiological recordings and data acquisition
In the recordings from the active cortex, the recorded signals were amplified, filtered, and collected by a computer running Plexon (Plexon Inc, TX). The field potential recordings in visual cortex were filtered between 3 Hz and 2.2 kHz and sampled continuously at 5 kHz. The spike recordings in both cortex and LGN were filtered below 250 Hz and above 8 KHz and sampled at 40 KHz every time a spike crossed a threshold. The spike discrimination was performed online and more rigorously off-line. LGN recordings were performed with a matrix of 7 independently moveable electrodes made of quartz-insulated, platinum–tungsten filaments [80 μm fiber; 25 μm of metal core; 1 μm at tip; impedance values: 1.5–6 MΩ]. Cortical recordings were obtained with a Silicon probe (NeuroNexus Technologies, MI) with 16 different recording sites that were arranged vertically and separated by 100 μm from each other. Each recording site had an area of 703 μm2 (26.5 μm in diameter; impedance < 0.6 MΩ). The extracellular recordings from cortical simple cells illustrated in Figure 4 were obtained with standard sharp electrodes aimed at layer 4 (layer 4 was identified based on electrode depth and the strong multi-unit ‘hash’ generated by geniculate afferents).
Visual stimulation
In the recordings from the active cortex visual stimuli were shown on a 20-inch monitor (Nokia 445Xpro, Salo, Finland) and generated either with Visionworks (Vision Research Graphics, Durham, NH, frame rate: 120 Hz) or with an AT-vista graphics card (Truevision, Indianapolis, IN; frame rate: 128 Hz). We used white noise to map receptive fields by reverse correlation analysis. The white noise consisted of an m-sequence of checkerboards with 16×16 pixels (0.45–0.9 degrees), each checkerboard being presented for 15.5 ms. The linearity of spatial summation of the geniculate cells was measured with full-field, contrast reverse gratings. We used at least two different spatial frequencies higher than the optimal (usually 0.55 cycle/deg and 1.1 cycle/deg) and each spatial frequency was presented at eight different phases and repeated at least eight times per spatial phase at 0.4 Hz. Geniculate cells were classified in X or Y based on this linearity test 28. For a small number of cells, visual responses were strongly suppressed with full-field gratings (< 5 spikes/50 ms bin); these cells were labeled as ‘non-classified’.
Spike-triggered current-source-density (STCSD) analysis
The current sinks generated by individual geniculate afferents within the cortex were measured as follows. First, the spikes from well-isolated geniculate afferents were used as triggers to average the cortical field potentials simultaneously recorded at the 16 cortical sites (the spikes were obtained either under white noise stimulation or spontaneous activity). The second spatial derivative of these local field potentials is directly proportional to the current density at a point. Since the potential can only be sampled at finite intervals through the depth of the cortex, the second derivative is approximated by a finite-difference equation 48 :
where Φ is the field potential, z is the coordinate perpendicular to the layers, Δz is the sampling interval (100μm), and nΔz is the differentiation grid (n = 2). The differentiation grid 2 is equivalent to spatial smoothing and allows reduction of high spatial frequency noise. The results of this finite-difference equation, applied to each of the 16 field-potential recordings, are the current sinks and sources generated by a single geniculate afferent through the depths of the cortex, called here spike-triggered current-source-density analysis (STCSD).
Our estimates indicate that the spatial specificity of STCSD is < 150 μm. First, spike-triggered field-potentials recorded within the barrel cortex fall sharply (85% amplitude reduction), when measured in a neighboring barrel that is just 150 μm away (see Figs. 6 and 7 in 49; the barrel cortex is ideal for these measurements because most thalamic axons are completely restricted to one barrel). Second, theoretical measurements indicate that the amplitude of a current sink falls sharply within < 150 μm when measured laterally from its border (Fig. 3 in 50). [Note that < 150 μm is an overestimate because the theoretical measurements assume a flat distribution of currents while the distribution of synaptic boutons is approximately Gaussian; see Fig. 5 and 29]. Most importantly, experiments making multiple closely spaced penetrations within cat visual cortex indicate that STCSD does not overestimate the size of the geniculate arbors and it can reproduce quite closely the ratio of cortical distance covered by Y/X axonal arbors (1.4 according to Humphrey et al., 1986 versus 1.6 according to STCSD, Fig. 5).
The STCSD generated by a single geniculate afferent within the cortex had a fast axonal component (0.8–2.1 ms after the geniculate spike), followed by a synaptic delay (~ 0.5 ms) and a postsynaptic sink (defined here as the first 1 ms following the synaptic delay). A STCSD sink was considered significant if it met three criteria. First, the amplitudes of both the STCSD axonal component and postsynaptic sink were larger than 40 μV/mm2. Second, there was a gap (zero-crossing) between the axonal component and the postsynaptic sink. Third, the signal to noise ratio was greater than 5 (signal to noise ratio: postsynaptic sink/baseline; baseline: current sink amplitude 1 ms before the axonal component). These set of criteria proved to be highly reliable at identifying geniculate axons that were located within the immediate neighborhood of the electrode (in each of 37 cases in which an STCSD passed these criteria, cross-correlation analysis between the geniculate single unit and the cortical multiunit recorded with the silicon probe revealed a narrow peak displaced from zero, indicating the presence of the geniculate axon and/or monosynaptic connected cells within the immediate vicinity of the electrodes). It is important to emphasize that the STCSD generated by a single geniculate afferent is very different from the STCSD generated by pairs of neighboring afferents (multi-afferent STCSD). In the multi-afferent STCSD, the axonal component is wider, sometimes has multiple peaks and there is no gap between the axonal component and the postsynaptic sink (because neighboring afferents do not have identical axonal conduction times, spike waveforms and depth profiles). In that sense, the main criterion to identify a single-afferent STCSD (presence of a synaptic gap) is very similar to the criterion used to identify a well-isolated unit in an extracellular recording (presence of a refractory period). The fields generated by single thalamic afferents are not homogeneous in the horizontal dimension and, therefore, our measurements of current density violate the assumption of an “infinite, homogeneous volume conductor” 48. However, all studies that use current source density analysis violate this assumption to some extent or another, because (a) all brain regions are finite horizontally, and (b) stimuli do not generate uniform fields. With respect to the current investigation, an important question concerns how far the probe recording sites “see” horizontally relative to the horizontal extent of the currents that are generated. Geniculate arbors in the cat are generally 0.7 – 1.3 mm in horizontal extent and the distribution of synaptic boutons within the main arbor clump is roughly Gaussian 29; our procedures of retinotopic alignment strive to place the recording probe near the center of this arborization. Because a previous study in the barrel cortex showed a very steep drop in the strength of spike-triggered field potentials when recording from sites misaligned by a single barrel (150 μm)49, the distance that our probes “see” horizontally is likely to be small, relative to the extent of the geniculate arbor (see also Fig. 5a, b). Moreover, the main purpose of this study was not to make precise, absolute measures of synaptic (or axonal) currents, but identify axons projecting within the neighborhood of our probe. For these reasons, the violation of the homogeneity assumption is unlikely to have a significant influence in our results.
The laminar location of the current sinks generate by single geniculate afferents was estimated from the location of the current sink generated by full-field stimuli (white-black sequences presented at 0.5 Hz and repeated 100 times). In the cat, these stimuli generate strong current sinks in the cortical layers that receive the densest geniculate input (layers 4 and 6) and these sinks can be used as references to identify the laminar location of the recordings. The horizontal diameter of the current sink was measured as the maximum cortical distance between significant current sinks. These measurements were obtained after making multiple cortical penetrations (mean: 7; range: 4–10), separated by 100–200 μm from each other, along the anteroposterior axis of the lateral gyrus (each penetration was aimed at the very center of the gyrus). The strength of the current sink was measured at the peak of the sink, within 1 millisecond following the synaptic delay.
Acknowledgments
We are grateful to EY05253, MH-64024, EY02874, SUNY Res. Foundation for funding support.
References
- 1.Chichilnisky EJ, Kalmar RS. Functional asymmetries in ON and OFF ganglion cells of primate retina. J Neurosci. 2002;22:2737–2747. doi: 10.1523/JNEUROSCI.22-07-02737.2002. [DOI] [PMC free article] [PubMed] [Google Scholar]
- 2.Renteria RC, et al. J Neurosci. 2006;26:11857–11869. doi: 10.1523/JNEUROSCI.1718-06.2006. [DOI] [PMC free article] [PubMed] [Google Scholar]
- 3.Peichl L. Alpha and delta ganglion cells in the rat retina. J Comp Neurol. 1989;286:120–139. doi: 10.1002/cne.902860108. [DOI] [PubMed] [Google Scholar]
- 4.Peichl L, Ott H, Boycott BB. Alpha ganglion cells in mammalian retinae. Proc R Soc Lond B Biol Sci. 1987;231:169–197. doi: 10.1098/rspb.1987.0040. [DOI] [PubMed] [Google Scholar]
- 5.Dacey DM, Petersen MR. Dendritic field size and morphology of midget and parasol ganglion cells of the human retina. Proc Natl Acad Sci U S A. 1992;89:9666–9670. doi: 10.1073/pnas.89.20.9666. [DOI] [PMC free article] [PubMed] [Google Scholar]
- 6.Wong RO, Oakley DM. Changing patterns of spontaneous bursting activity of on and off retinal ganglion cells during development. Neuron. 1996;16:1087–1095. doi: 10.1016/s0896-6273(00)80135-x. [DOI] [PubMed] [Google Scholar]
- 7.Famiglietti EV, Jr, Kaneko A, Tachibana M. Neuronal architecture of on and off pathways to ganglion cells in carp retina. Science. 1977;198:1267–1269. doi: 10.1126/science.73223. [DOI] [PubMed] [Google Scholar]
- 8.Nelson R, Famiglietti EV, Jr, Kolb H. Intracellular staining reveals different levels of stratification for on- and off-center ganglion cells in cat retina. J Neurophysiol. 1978;41:472–483. doi: 10.1152/jn.1978.41.2.472. [DOI] [PubMed] [Google Scholar]
- 9.Schiller PH, Malpeli JG. Functional specificity of lateral geniculate nucleus laminae of the rhesus monkey. J Neurophysiol. 1978;41:788–797. doi: 10.1152/jn.1978.41.3.788. [DOI] [PubMed] [Google Scholar]
- 10.Bowling DB, Wieniawa-Narkiewicz E. The distribution of on- and off-centre X-and Y-like cells in the A layers of the cat’s lateral geniculate nucleus. J Physiol. 1986;375:561–572. doi: 10.1113/jphysiol.1986.sp016133. [DOI] [PMC free article] [PubMed] [Google Scholar]
- 11.Berman NE, Payne BR. Modular organization of ON and OFF responses in the cat lateral geniculate nucleus. Neuroscience. 1989;32:721–737. doi: 10.1016/0306-4522(89)90293-5. [DOI] [PubMed] [Google Scholar]
- 12.Stryker MP, Zahs KR. On and off sublaminae in the lateral geniculate nucleus of the ferret. J Neurosci. 1983;3:1943–1951. doi: 10.1523/JNEUROSCI.03-10-01943.1983. [DOI] [PMC free article] [PubMed] [Google Scholar]
- 13.Conway JL, Schiller PH. Laminar organization of tree shrew dorsal lateral geniculate nucleus. J Neurophysiol. 1983;50:1330–1342. doi: 10.1152/jn.1983.50.6.1330. [DOI] [PubMed] [Google Scholar]
- 14.LeVay S, McConnell SK. ON and OFF layers in the lateral geniculate nucleus of the mink. Nature. 1982;300:350–351. doi: 10.1038/300350a0. [DOI] [PubMed] [Google Scholar]
- 15.Hubel DH, Wiesel TN. Receptive fields, binocular interaction and functional architecture in the cat’s visual cortex. J Physiol. 1962;160:106–154. doi: 10.1113/jphysiol.1962.sp006837. [DOI] [PMC free article] [PubMed] [Google Scholar]
- 16.Reid RC, Alonso JM. Specificity of monosynaptic connections from thalamus to visual cortex. Nature. 1995;378:281–284. doi: 10.1038/378281a0. [DOI] [PubMed] [Google Scholar]
- 17.Tanaka K. Cross-correlation analysis of geniculostriate neuronal relationships in cats. J Neurophysiol. 1983;49:1303–1318. doi: 10.1152/jn.1983.49.6.1303. [DOI] [PubMed] [Google Scholar]
- 18.Zahs KR, Stryker MP. Segregation of ON and OFF afferents to ferret visual cortex. J Neurophysiol. 1988;59:1410–1429. doi: 10.1152/jn.1988.59.5.1410. [DOI] [PubMed] [Google Scholar]
- 19.McConnell SK, LeVay S. Segregation of on- and off-center afferents in mink visual cortex. Proc Natl Acad Sci U S A. 1984;81:1590–1593. doi: 10.1073/pnas.81.5.1590. [DOI] [PMC free article] [PubMed] [Google Scholar]
- 20.Conley M, Fitzpatrick D, Diamond IT. The laminar organization of the lateral geniculate body and the striate cortex in the tree shrew (Tupaia glis) J Neurosci. 1984;4:171–197. doi: 10.1523/JNEUROSCI.04-01-00171.1984. [DOI] [PMC free article] [PubMed] [Google Scholar]
- 21.Kretz R, Rager G, Norton TT. Laminar organization of ON and OFF regions and ocular dominance in the striate cortex of the tree shrew (Tupaia belangeri) J Comp Neurol. 1986;251:135–145. doi: 10.1002/cne.902510110. [DOI] [PubMed] [Google Scholar]
- 22.Ringach DL. Haphazard wiring of simple receptive fields and orientation columns in visual cortex. J Neurophysiol. 2004;92:468–476. doi: 10.1152/jn.01202.2003. [DOI] [PubMed] [Google Scholar]
- 23.Nakagama H, Saito T, Tanaka S. Effect of imbalance in activities between ON- and OFF-center LGN cells on orientation map formation. Biol Cybern. 2000;83:85–92. doi: 10.1007/s004220000148. [DOI] [PubMed] [Google Scholar]
- 24.Miller KD. Development of orientation columns via competition between ON-and OFF-center inputs. Neuroreport. 1992;3:73–76. doi: 10.1097/00001756-199201000-00019. [DOI] [PubMed] [Google Scholar]
- 25.Miller KD. A model for the development of simple cell receptive fields and the ordered arrangement of orientation columns through activity-dependent competition between ON- and OFF-center inputs. J Neurosci. 1994;14:409–441. doi: 10.1523/JNEUROSCI.14-01-00409.1994. [DOI] [PMC free article] [PubMed] [Google Scholar]
- 26.Ringach DL. On the origin of the functional architecture of the cortex. PLoS ONE. 2007;2:e251. doi: 10.1371/journal.pone.0000251. [DOI] [PMC free article] [PubMed] [Google Scholar]
- 27.Swadlow HA, Gusev AG, Bezdudnaya T. Activation of a cortical column by a thalamocortical impulse. J Neurosci. 2002;22:7766–7773. doi: 10.1523/JNEUROSCI.22-17-07766.2002. [DOI] [PMC free article] [PubMed] [Google Scholar]
- 28.Hochstein S, Shapley RM. Quantitative analysis of retinal ganglion cell classifications. J Physiol. 1976;262:237–264. doi: 10.1113/jphysiol.1976.sp011594. [DOI] [PMC free article] [PubMed] [Google Scholar]
- 29.Humphrey AL, Sur M, Uhlrich DJ, Sherman SM. Projection patterns of individual X- and Y-cell axons from the lateral geniculate nucleus to cortical area 17 in the cat. J Comp Neurol. 1985;233:159–189. doi: 10.1002/cne.902330203. [DOI] [PubMed] [Google Scholar]
- 30.Freund TF, Martin KA, Whitteridge D. Innervation of cat visual areas 17 and 18 by physiologically identified X- and Y- type thalamic afferents. I. Arborization patterns and quantitative distribution of postsynaptic elements. J Comp Neurol. 1985;242:263–274. doi: 10.1002/cne.902420208. [DOI] [PubMed] [Google Scholar]
- 31.Gilbert CD, Wiesel TN. Morphology and intracortical projections of functionally characterised neurones in the cat visual cortex. Nature. 1979;280:120–125. doi: 10.1038/280120a0. [DOI] [PubMed] [Google Scholar]
- 32.DeAngelis GC, Ghose GM, Ohzawa I, Freeman RD. Functional micro-organization of primary visual cortex: receptive field analysis of nearby neurons. J Neurosci. 1999;19:4046–4064. doi: 10.1523/JNEUROSCI.19-10-04046.1999. [DOI] [PMC free article] [PubMed] [Google Scholar]
- 33.Gheorghita F, Kraftsik R, Dubois R, Welker E. Structural basis for map formation in the thalamocortical pathway of the barrelless mouse. J Neurosci. 2006;26:10057–10067. doi: 10.1523/JNEUROSCI.1263-06.2006. [DOI] [PMC free article] [PubMed] [Google Scholar]
- 34.Aronov D, Reich DS, Mechler F, Victor JD. Neural coding of spatial phase in V1 of the macaque monkey. J Neurophysiol. 2003;89:3304–3327. doi: 10.1152/jn.00826.2002. [DOI] [PubMed] [Google Scholar]
- 35.Chatterjee S, Callaway EM. Parallel colour-opponent pathways to primary visual cortex. Nature. 2003;426:668–671. doi: 10.1038/nature02167. [DOI] [PubMed] [Google Scholar]
- 36.Albus K, Wolf W. Early post-natal development of neuronal function in the kitten’s visual cortex: a laminar analysis. J Physiol. 1984;348:153–185. doi: 10.1113/jphysiol.1984.sp015104. [DOI] [PMC free article] [PubMed] [Google Scholar]
- 37.Raczkowski D, Fitzpatrick D. Terminal arbors of individual, physiologically identified geniculocortical axons in the tree shrew’s striate cortex. J Comp Neurol. 1990;302:500–514. doi: 10.1002/cne.903020307. [DOI] [PubMed] [Google Scholar]
- 38.Dryja TP, et al. Night blindness and abnormal cone electroretinogram ON responses in patients with mutations in the GRM6 gene encoding mGluR6. Proc Natl Acad Sci U S A. 2005;102:4884–4889. doi: 10.1073/pnas.0501233102. [DOI] [PMC free article] [PubMed] [Google Scholar]
- 39.Westheimer G. Visual acuity with reversed-contrast charts: I. Theoretical and psychophysical investigations. Optom Vis Sci. 2003;80:745–748. doi: 10.1097/00006324-200311000-00010. [DOI] [PubMed] [Google Scholar]
- 40.Westheimer G, Chu P, Huang W, Tran T, Dister R. Visual acuity with reversed-contrast charts: II. Clinical investigation. Optom Vis Sci. 2003;80:749–752. doi: 10.1097/00006324-200311000-00011. [DOI] [PubMed] [Google Scholar]
- 41.Zemon V, Gordon J, Welch J. Asymmetries in ON and OFF visual pathways of humans revealed using contrast-evoked cortical potentials. Vis Neurosci. 1988;1:145–150. doi: 10.1017/s0952523800001085. [DOI] [PubMed] [Google Scholar]
- 42.Wehrhahn C, Rapf D. ON- and OFF-pathways form separate neural substrates for motion perception: psychophysical evidence. J Neurosci. 1992;12:2247–2250. doi: 10.1523/JNEUROSCI.12-06-02247.1992. [DOI] [PMC free article] [PubMed] [Google Scholar]
- 43.Schiller PH, Sandell JH, Maunsell JH. Functions of the ON and OFF channels of the visual system. Nature. 1986;322:824–825. doi: 10.1038/322824a0. [DOI] [PubMed] [Google Scholar]
- 44.Peters A, Payne BR. Numerical relationships between geniculocortical afferents and pyramidal cell modules in cat primary visual cortex. Cereb Cortex. 1993;3:69–78. doi: 10.1093/cercor/3.1.69. [DOI] [PubMed] [Google Scholar]
- 45.Alonso JM, Usrey WM, Reid RC. Rules of connectivity between geniculate cells and simple cells in cat primary visual cortex. J Neurosci. 2001;21:4002–4015. doi: 10.1523/JNEUROSCI.21-11-04002.2001. [DOI] [PMC free article] [PubMed] [Google Scholar]
- 46.Benucci A, Frazor RA, Carandini M. Standing waves and traveling waves distinguish two circuits in visual cortex. Neuron. 2007;55:103–117. doi: 10.1016/j.neuron.2007.06.017. [DOI] [PMC free article] [PubMed] [Google Scholar]
- 47.Chapman B, Zahs KR, Stryker MP. Relation of cortical cell orientation selectivity to alignment of receptive fields of the geniculocortical afferents that arborize within a single orientation column in ferret visual cortex. J Neurosci. 1991;11:1347–1358. doi: 10.1523/JNEUROSCI.11-05-01347.1991. [DOI] [PMC free article] [PubMed] [Google Scholar]
- 48.Nicholson C, Freeman JA. Theory of current source-density analysis and determination of conductivity tensor for anuran cerebellum. J Neurophysiol. 1975;38:356–368. doi: 10.1152/jn.1975.38.2.356. [DOI] [PubMed] [Google Scholar]
- 49.Swadlow HA, Gusev AG. The influence of single VB thalamocortical impulses on barrel columns of rabbit somatosensory cortex. J Neurophysiol. 2000;83:2802–2813. doi: 10.1152/jn.2000.83.5.2802. [DOI] [PubMed] [Google Scholar]
- 50.Pettersen KH, Devor A, Ulbert I, Dale AM, Einevoll GT. Current-source density estimation based on inversion of electrostatic forward solution: Effects of finite extent of neuronal activity and conductivity discontinuities. J Neurosci Methods. 2006;154:116–133. doi: 10.1016/j.jneumeth.2005.12.005. [DOI] [PubMed] [Google Scholar]