Abstract
The internal dynamics of triosephosphate isomerase have been investigated with elastic networks, with and without a substrate bound. The slowest modes of motion involve large domain motions but also a loop motion that conforms to the changes observed between the crystal structures 8TIM and 1TPH. Our computations confirm that the different motions of this loop are important in several of the computed slowest modes. We have shown that elastic network computations on this protein system can combine atoms for the functional parts of the structure with coarse-grained (cg) representations of the remainder of the structure in several different ways. Similar loop motions are seen with elastic network models for atomistic and mixed cg models. The loop motions are reproduced with an overlap of 0.75–0.79 by combining the four slowest modes of motion for the free and complex forms of the enzyme.
Protein conformational changes and dynamics are critical for their biological function, such as the catalytic activity of enzymes. Many substrates bind to enzymes leading to an open to closed transformation. Elucidating the relationship between the conformational changes of an enzyme and the ligand-enzyme binding mechanisms at the molecular level has become a central issue in experimental and computational studies (1–3). Some aspects of the process are not readily monitored experimentally, and computations can in principle supply the missing details. The conformational dynamics of proteins can be studied at the atomistic level by using classical normal-mode analysis (NMA)1 or molecular dynamics (MD) to understand details of structure-function relationships (4–6). However, these techniques become computationally inefficient for large systems, thus favoring computationally more efficient methodologies. In this respect, coarse-grained (cg) NMA using elastic network models, specifically Gaussian network models and anisotropic network models (ANMs), has been successfully applied as an efficient approach for analyzing the collective motions of large proteins around their native conformations (7–13). In elastic network models, the α-carbon atoms of the residues are generally taken as the cg nodes, with the close-neighboring nodes interconnected by harmonic springs (8). In the ANM, fluctuations of the residues can be anisotropic; i.e., the three-dimensional character of the motion is taken into account, and directions of motion are obtained. A mixed cg approach (14), recently introduced to ANM, enables the modeling of fluctuations of a protein about the native conformation as a network with different regions of high and low resolution. In this methodology, the functionally interesting parts such as the active sites of enzymes can be kept at high resolution, whereas the remaining parts of the structure are described at low resolution. The aim here is to describe the collective dynamics of a large system effectively at atomistic detail with high computational efficiency. In a recent study (15), a first attempt has been made at developing mixed cg models to provide atomistic detail around the active site for the enzyme triosephosphate isomerase (TIM). In this study, we will provide a more detailed account of the applicability of such mixed cg models using TIM as our model system. One lesson that we have learned from many applications of these elastic network models is that proteins behave as extremely cohesive materials whose dominant motions involve large domains moving as rigid bodies, except that some surface loops may move together with the domains in a more flexible fashion, but nonetheless controlled by the domain motions. Because of the overwhelming control manifested by the large domains, it is possible to take the point of view that surface atoms and loops are merely decorations on the surfaces of domains and that their motions are determined essentially by the ways in which the domains move, providing a plausible reason for the conservation of protein size and shape. This point of view leads to the use of mixed cg models (14, 15). In the present work, we will investigate the motions of TIM with such models.
TIM is an important enzyme in glycolysis, catalyzing the interconversion between dihydroxyacetone phosphate (DHAP) and D-glyceraldehyde 3-phosphate (GAP). TIM is active as a dimer, with each identical monomer of 248 residues forming a TIM barrel. There are three important residues for the catalytic reaction located in the middle of each TIM barrel: Glu165 and His95 participate in proton transfer, and Lys13 hydrogen bonds weakly with the bridging oxygen of the ligand (16). There is a functionally important flexible loop (loop 6, residues 166–176), which holds the ligand in a planar conformation for the interaction with the active-site residues (17) and protects the ligand from the solvent, inhibiting the formation of a potentially toxic byproduct (18) by remaining closed during the reaction. However, the particular function of loop 6, i.e., providing a specific geometry in the active site for efficient catalysis, is not supported by a recent quantum mechanics/molecular mechanics calculations (19). When the open and closed structures are compared, this loop 6 moves about 7 Å and closes over the bound ligand (20). However, the loop also opens and closes as a natural motion of the enzyme in the absence of the substrate (21, 22), as can be observed between the various crystal structures.
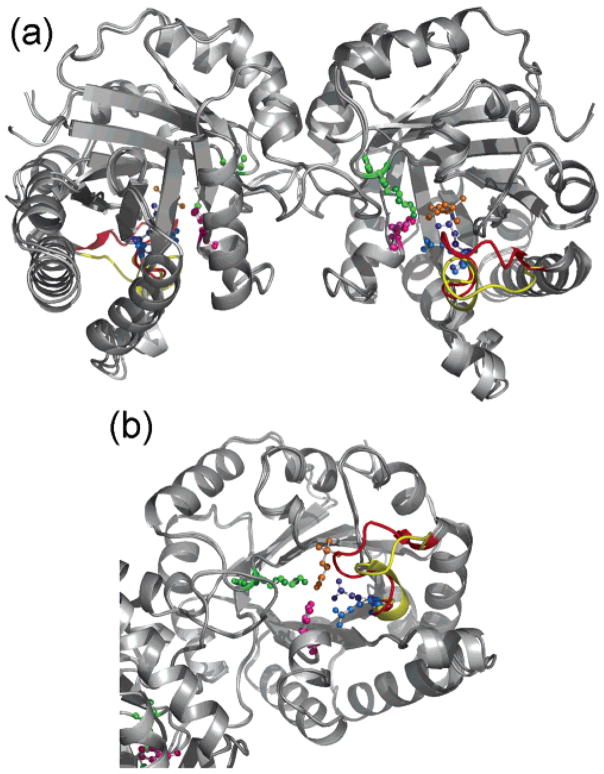
In the present work, both a free (8TIM, 2.58 Å resolution) and complexed (1TPH, 1.8 Å resolution) form of TIM are analyzed to explore the vibrational dynamics of this flexible loop and the active-site residues (see Figure 1). The ligand in the complex form (16) is the phosphoglycolohydroxamate (PGH), an intermediate analogue with the same structure and orientation with the substrate DHAP in the crystal structures. These are only two among the many structures of this enzyme present in the Protein Data Bank (PDB) (23). In this study, we will explore the mechanics of TIM from the perspective of mechanistic models by including partial atomistic details. Collective motions of the enzyme will provide a clear picture of the loop motions for a direct comparison with the experimental structures.
Figure 1.
TIM catalyses the interconversion between DHAP and GAP in the glycolytic pathway of the cell. When the ligand reaches the active site situated in the middle of the TIM barrel, the flexible loop (loop 6) closes and holds the ligand in a planar form for the enzymatic reaction. (a) Free (light colors) and complex (darker colors) forms of TIM are superimposed to show the opening/closing motion of the flexible loop. (b) In the middle of the TIM barrel, the active-site residues Glu165 (blue), His95 (magenta), and Lys13 (green), the flexible loop (red, complex; yellow, free), and the inhibitor PGH (orange) are shown.
MATERIALS AND METHODS
Elastic Network Models with Residue-Based Uniform cg
In elastic network models, folded protein structures are cg at the one-site-per-residue level, with the α-carbon atoms typically selected as the nodes of the network; these are referred to as residue-based uniform cg models in this work. Harmonic springs link the pair of nodes that fall within a cutoff distance (rcut). Consequently, the total potential energy (V) for a system of N residues is the summation over all harmonic interactions of close neighboring (i, j) pairs, with all deviations away from the base structure penalized energetically in the following way
| (1) |
Here, h(x) is the Heaviside step function [h(x) = 1 if x ≥ 0 and 0 otherwise], Ri and ΔRi are the position and fluctuation vectors for node i (1 ≤ i ≤ N), respectively, and Rij is the distance between sites i and j. The only adjustable parameter is the force constant γ. After Tirion’s formulation (24), a universal force constant is used for all of the interactions among close-neighboring bonded and nonbonded pairs, but as we will see later, this is modified when levels of cg are mixed.
The potential energy of this network can also be expressed as
| (2) |
where H is the (3N × 3N) Hessian matrix, ΔR is a 3N-dimensional vector of fluctuations, and ΔRT is its transpose.
The normal modes of the elastic network are found by an orthogonal transformation of the real symmetric Hessian matrix
| (3) |
Here, Λ is a (3N × 3N) diagonal matrix with diagonal elements corresponding to the eigenvalues or squared normal-mode frequencies; S is a (3N × 3N) orthogonal matrix with STS = I (I being the identity matrix); and the columns of S are the normalized eigenvectors giving the normal-mode directions of motion. As a result, the overall motion can be expressed as a sum over the (3N – 6) individual internal fluctuation modes. The collective motions related to biological function of proteins can usually be found among the low-frequency normal modes. Details of this ANM can be found in various references (8).
Atom-Based Elastic Network Models
Atomic details in this context refer to an elastic network model comprised of all heavy atoms with harmonic interactions only, which will be referred to as an atom-based ANM here and resembles Tirion’s NMA (24). Two different cutoff values (6 and 9 Å) are used for a comparison with residue-based and mixed cg models.
Mixed cg Elastic Network Models
In our previous work, the mixed cg methodology developed for elastic networks has been described in detail (14). In that work, the high-resolution regions are cg at the residue level (n = 1) or higher, whereas the low-resolution regions are represented at higher cg levels (2 ≤ n ≤ 40), with n representing the number of sequential residues included as a cg node. The cutoff distance that specifies the range of interactions between nodes is scaled on the basis of the radius of gyration of n residues, and the corresponding spring constant was determined to match the theoretical and experimental B factors, i.e., mean-square fluctuations of the residues.
In this work, the aim is to devise a method for analyzing the motions of the important, interesting regions of TIM, i.e., the active site, the flexible loop (residues 166–176), and the inhibitor, at atomistic detail, while representing the rest of the system at a lower resolution (one-node-per-residue, n = 1) for computational efficiency. For this reason, appropriate cutoff distances and spring constants should also be assigned for the interactions among nodes belonging to different resolution regions, as shown in Figure 2. Atomistic detail refers to an elastic network model, including all heavy atoms having harmonic interactions only (24).
Figure 2.
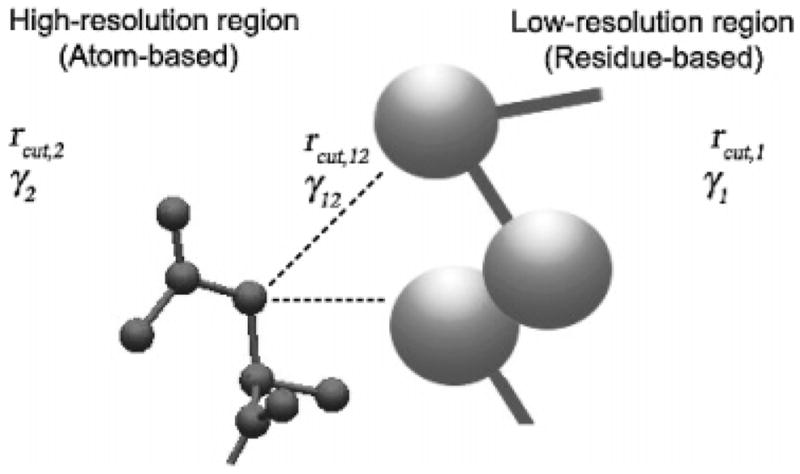
In the mixed cg elastic network model, the interesting regions, such as the active site of an enzyme, are kept at high resolution, including all heavy atoms, whereas the rest of the protein structure is at low resolution, considering only the α-carbon atoms of the residues. Mixed cg specific parameters, namely, the cutoff distance (rcut) and the force constant (γ), must be defined separately for each region and across the interface.
In our previous procedure (14), a cutoff distance of 13 Å was used for the high-resolution regions (n = 1) of β-galactosidase (4092 residues) and hemagglutinin (1509 residues). This same cutoff of 13 Å is used here for the sites in the low-resolution area (n = 1), and an appropriate cutoff distance is determined for the atomistic high-resolution region, as described in the Results. Similarly, force constants are determined for the mixed cg network prior to normal-mode calculations.
RESULTS
In elastic network models, the crystal structure is taken to be the minimum energy conformation and usually proteins are cg at the one-site-per-residue level, with the α-carbon atoms typically selected as the nodes of the network; these will be referred to as residue-based uniform cg TIM models in this work. We will also apply the recently introduced mixed cg elastic network models to TIM, comprising residue-based (low-resolution) and atom-based (high-resolution) regions to investigate the collective motions (see Figure 2). To provide a complete account, fully atomistic models of TIM will also be explored by using either only harmonic interactions between heavy atoms or the classical CHARMM force field.
Determination of Mixed cg Model Parameters
In the mixed cg elastic network, the range of interactions, i.e., the cutoff distances, should be separately defined for the low-and high-resolution regions and the interface (Figure 2). In previous studies (8, 14), a cutoff of 13 Å was found suitable to describe the low-resolution network in the residue-based ANM (where α carbons are taken as nodes). In the following, we will describe how the cutoff values and corresponding force constants are determined for the atomistic high-resolution region in mixed cg models.
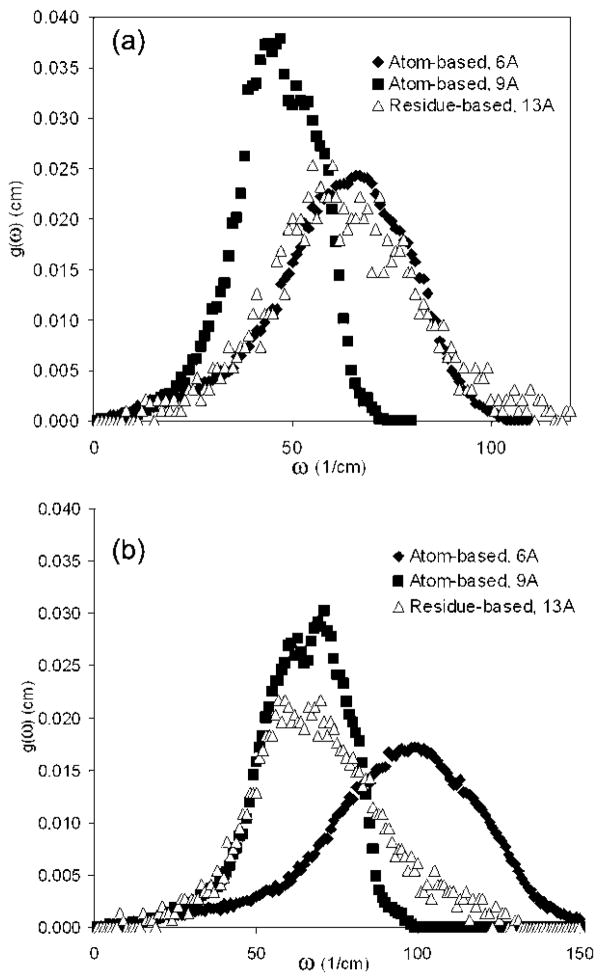
Motions of several proteins of relatively small sizes (total number of residues ranging between 78 and 238), namely, glutaredoxin, HIV-1 protease, Che Y protein, dehydrofolate reductase (DHFR), and LAO-binding protein, have been explored with the atom-based ANM, where each heavy atom is taken as a node through the use of two cutoff distances of either 6 or 9 Å. Their normalized frequency distributions are compared with the results of residue-based ANM with a cutoff of 13 Å (only Cα atoms taken as the nodes). The normalized density of vibrational normal modes g(ω) (number of modes within a frequency range divided by the total number of modes) (25) is shown in Figure 3a for DHFR obtained with atom-based ANM at cutoff distances of 6 or 9 Å. Over the whole spectra, the results for 6 Å (atom-based ANM) agree best with the results for the cg calculation with a cutoff of 13 Å (residue-based ANM) for DHFR and for all of the proteins named above (not shown). In Figure 3b, g(ω) is shown for TIM, where the atom-based result with rcut = 9 Å agrees better with the cg results; thus, rcut = 9 Å may be more appropriate for this larger system. However, at low frequencies, both atom-based cases at 6 and 9 Å are in agreement with the uniform cg results for 13 Å.
Figure 3.
Several proteins have been explored with the atom-based ANM (where each heavy atom is taken as a node) to determine a suitable cutoff distance for the high-resolution region in the mixed cg. The normalized density of vibrational normal modes, g(ω), for (a) DHFR and (b) free TIM are shown using atom-based models (rcut = 6 and 9 Å) and a residue-based uniform cg model (rcut = 13 Å). The low-frequency end of the spectrum is similar; therefore, either value of the cutoff distances (6 or 9 Å) may be applicable for the high-resolution region in the mixed cg.
In summary, for the two different node sizes, the cutoff distances are as follows: node 1 (low resolution) with rcut,1 = 13 Å and node 2 (high resolution) for which two choices of rcut,2 = 6 or 9 Å will be considered here. The cutoff distance between low- and high-resolution regions, rcut,1,2, is determined as we have previously found to be satisfactory (14) by
| (4) |
premised on the masses of the nodes being proportional to the volumes of spherical residues. In this study, the cutoff distance for the interaction between nodes with different sizes, rcut,1,2, would thus be either 10.6 or 11.35 Å, depending upon whether the cutoff for the high-resolution atomic part is chosen as 6 or 9 Å.
Once the cutoff is set for a uniform cg model, the force constant γ is fixed as an appropriate scale factor between the computed and experimental B factors. Therefore, a cutoff of 6 or 9 Å for the high-resolution region corresponds to respective force constants γ2 = 0.64 or 1.45 kcal/(mol Å2), similarly for the low-resolution case with a 13 Å cutoff, γ1 = 3.1 kcal/(mol Å2). The force constant (γ1,2) between nodes 1 and 2 at rcut,1,2 is found by linear interpolation between (rcut,1, γ1) and (rcut,2, γ2) pairs. Table 1 summarizes the cutoff and force-constant values for all of these model systems.
Table 1.
ANM Parameters for the Systems and Overlap Values
| low resolution
|
high resolution
|
high/low resolution interface
|
|||||
|---|---|---|---|---|---|---|---|
| cg system | rcut,1 (Å) | γ1 [kcal/(mol Å2)] | rcut,2 (Å) | γ2 [kcal/(mol Å2)] | rcut,1,2 (Å) | γ1,2 [kcal/(mol Å2)] | average overlapa |
| residue based | 13 | 3.1 | 0.93b | ||||
| atom based I | 6 | 0.64 | 0.87 | ||||
| atom based II | 9 | 1.45 | 0.97 | ||||
| mixed case I | 13 | 3.1 | 6 | 0.64 | 10.64 | 2.27 | 0.85 |
| mixed case II | 13 | 3.1 | 9 | 1.45 | 11.35 | 1.88 | 0.80 |
| mixed case III | 13 | 3.1 | 9 | 0.64 | 11.35 | 2.08 | 0.89 |
Overlap (eq 5) is based on only Cα values in both structures. The overlap values are calculated between the first 10 eigenvectors obtained for the different cg models of the TIM-PGH complex and the residue-based complex.
This entry is a comparison between the residue-based open and closed structures.
Residue-Based Uniform cg of TIM
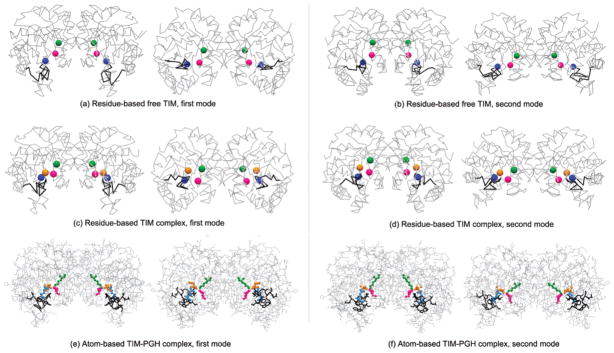
ANM is performed with residue-based uniform cg models of TIM (free and complex forms) with rcut = 13 Å, considering only Cα atoms as nodes to extract the slowest modes. When the slowest mode shapes of the free and complex structures are compared, quite similar collective motions are obtained (parts a–d of Figure 4). However, the opening/closing motion of the flexible loop is relatively more hindered in the complex form, regardless of whether an additional node for PGH is added.
Figure 4.
Collective motions at low frequencies are obtained using residue-based ANM (where each α carbon is taken as a node) and atom-based ANM (where each heavy atom is taken as a node) for TIM (free and complex forms) with rcut = 13 and 6 Å, respectively. Alternative pairs of conformations are given in the first (left panel) and second (right panel) modes of (a and b) free and (c and d) complex forms of the residue-based model and (e and f) the atom-based complex form by indicating active-site residues Lys13 (green), His95 (magenta), Glu165 (blue), loop 6 (black), and PGH (orange).
The eigenvectors specify the direction of motion for each structural element for the specific mode. To estimate the similarity between the modes of motion for two different systems, the average overlap value or the root-mean-square inner product between two sets of k normalized eigenvectors, (v1, ..., vk) and (w1, ..., wk), belonging to two superimposed structures can be determined by (26)
| (5) |
Table 1 lists the average overlap values given by the above equation for the eigenvector sets of different systems as compared to the eigenvector set of the uniform residue-based complex structure. The average overlap is calculated for the slowest 10 modes (k = 10). An overlap of 0.93 between the free and complex structures indicates high overlap between both slow modes of the structures.
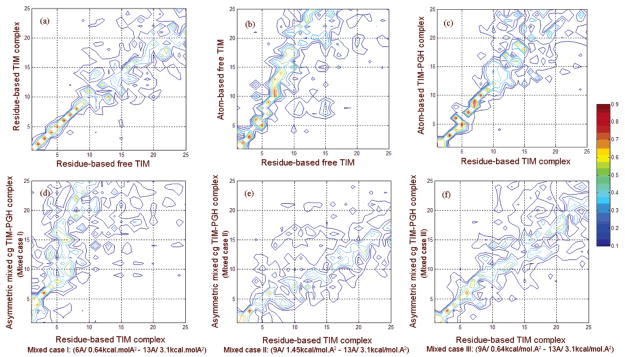
The individual elements of overlap, i.e., absolute value of (viwj), can be considered in the form of an overlap matrix for all (i, j) pairs. The overlap matrix for the first 25 eigenvectors of free and complex models of TIM is plotted in Figure 5a. Especially in the low-frequency range, the correlation of the directions of residues for two structures is high, consistent with a high overlap. These show the general characteristic that we have frequently observed; the slowest modes are the most robust because they depend mainly on the shape of the structure, and this also indicates, as we will see further, that results computed for partial structures are completely inappropriate.
Figure 5.
Correlations are shown between the directions of collective deformations for modes of different model pairs derived by calculating the overlap values between individual slow modes. Overlap matrixes are shown for (a) the residue-based model of TIM in free compared to complex forms, (b) the residue-based compared to atom-based (rcut = 9 Å) models of TIM in the ligand-free form, (c) the residue-based versus atom-based (rcut = 9 Å) models of the TIM complex form, and the residue-based versus asymmetric mixed systems of the TIM complex form with (d) case-I parameter set, (e) case-II parameter set, and (f) case-III parameter set. Especially in the low-frequency range, high overlap is observed for all cases.
Atom-Based Model of TIM
Moreover, free and complex structures of TIM are analyzed with the full atom-based elastic network models, where all heavy atoms, including the two substrate-like PGHs, are taken as nodes and cutoff distances of 6 or 9 Å are used. First and second mode behaviors for the TIM-PGH complex are given in parts e and f of Figure 4. It should be noted that the slowest modes of the atomistic models could be obtained successfully with an overlap value of 0.87 for 6 Å and 0.97 for 9 Å, considering the first 10 slowest modes according to eq 5 (see Table 1). The overlap matrixes for the free and complex forms of the atomistic model are given in parts b and c of Figure 5, respectively, as compared to the uniform cg models.
Mixed cg Models of TIM
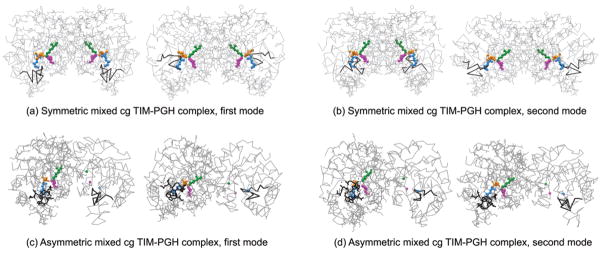
Two alternative mixed cg models have been applied to the TIM-PGH complex, which will be designated as asymmetric and symmetric mixed cg TIM models in the following. In the asymmetric mixed cg TIM, the active site, the flexible loop, and one inhibitor PGH on only one monomer of TIM constitute the high-resolution atomic region. In the symmetric mixed cg TIM, both active sites and the two inhibitors constitute the high-resolution region. In both of these models, the remaining low-resolution parts of TIM are modeled at the one-node-per-residue level or residue-based cg.
Table 1 lists the average overlap values for the slowest 10 modes of the mixed cg structures with different choices of rcut and γ, with the residue-based uniform cg of the complex taken as the reference structure. When the mixed cg system (case I) [rcut,2 = 6 Å, γ2 = 0.64 kcal/(mol Å2)] is compared to the residue-based model (parts c and d of Figure 4), the first two modes of the mixed cg system shift and spread out (Figure 5d) but the overlap values remain quite satisfactory, and functionally, important motions of the enzyme at the active site are retained. On the other hand, for the mixed cg system (case II) [rcut,2 = 9 Å, γ2 = 1.45 kcal/(mol Å2)], the overlap between the eigenvector sets decreases slightly (Figure 5e). Finally, when the force constant for the high-resolution region is decreased to 0.64 kcal/(mol Å2) at 9 Å cutoff (case III), the most satisfactory overlap (Figure 5f and Table 1) is obtained and the structure has a relatively high cutoff corresponding to interactions of more sites and an effective force constant not so restrictive for the flexibility of the interface and atomic nodes. To summarize, a cutoff of 6 or 9 Å with a force constant of 0.64 kcal/(mol Å2) for the high-resolution region yields satisfactory collective dynamics of the enzyme complex. However, there is a closer one-to-one correspondence between the slowest modes for the 9 Å case. The first and second mode shapes for symmetric and asymmetric cg models of the complex are given in parts a-d of Figure 6 and represent similar collective motions as for the uniform cg systems shown in Figure 4.
Figure 6.
Collective motions of TIM are explored by the mixed cg models, analyzing the internal motions of the important functionally interesting regions at the atomistic level while keeping the remainder of the structure present in less detail. Alternative conformations in the first (left panel) and second (right panel) modes of mixed cg TIM (a and b) symmetric and (c and d) asymmetric models of the TIM-PGH complex are shown. Lys13 (green), His95 (magenta), Glu165 (blue), and loop 6 (black) are indicated.
The fact that high overlap values are generally observed for the first 10 modes (Figure 5) is significant because the cumulative contribution of the first 10 slowest modes to the total motion is around 15% for the residue-based cg free and complex forms of TIM. Moreover, our results indicate that the low-frequency motions contribute significantly to the collective motion of the protein regardless of the level of cg.
Loop Motions
Experimental findings based on various X-ray structures exhibit the following common features: (i) The amide group of Gly171, located at the loop, makes a hydrogen bond with the phosphate group of the ligand, when the loop is closed. (ii) The displacement of the tip of the loop (indexed by the α carbon of Thr172) is more than 7 Å between open and closed conformations. (iii) During the opening/closing motion of TIM, the catalytic base Glu165 moves about 2 Å to force the ligand into optimal orientation for catalysis, which is observed for various substrate-enzyme complexes including PGH (16). (iv) The Trp168 indole ring rotates about 50° upon binding. The dynamics of this loop motion has also been monitored by fluorescence and T-jump relaxation spectroscopy (18, 27).
Table 2 compares the directions of the loop motions between the two X-ray structures (free and complex) with the eigenvector directions of specific modes from the uniform and mixed cg models, specifically for the segment of the loop comprising residues 169–173. Specifically, the first and fourth modes of all cg models strongly overlap the direction of the loop motion in terms of residue displacements, and combining the four slowest modes, as described by Kundu and Jernigan (28), results in overlap values of 0.75–0.79 for the cg structures. Even though the opening/closing movement of the flexible loop is observed in the slowest modes for both free and complex structures, the relative displacement of the tip of the flexible loop (α carbon of Thr172) in free TIM is found to be 1.5–2 times higher than that of the bound system. This result suggests that the local packing plays an important role in determining the ease of the opening/closing motion of the loop at the active site, as was mentioned in a recent computational study predicting the loop conformations in both structures (29).
Table 2.
Overlap Values between Loop Displacement (Including Residues 169–173) Observed in Specific Modes and the Displacement between Open and Closed X-ray Conformations
| cg system | mode indices (slowest = 1) | overlap value |
|---|---|---|
| residue-based cg (complex form) | 1 | 0.65 |
| 2 | 0.39 | |
| 3 | 0.14 | |
| 4 | 0.84 | |
| residue-based cg (free form) | 1 | 0.58 |
| 2 | 0.24 | |
| 3 | 0.16 | |
| 4 | 0.65 | |
| asymmetric mixed cg, case III parameters (complex form) | 1 | 0.55 |
| 2 | 0.68 | |
| 3 | 0.29 | |
| 4 | 0.81 | |
| symmetric mixed cg, case I parameters (complex form) | 1 | 0.66 |
| 2 | 0.12 | |
| 3 | 0.16 | |
| 4 | 0.82 |
To prove the validity of the mixed cg model further, the collective motions of the active-site residues, the flexible loop, and the inhibitor are analyzed and compared with the experimental findings. Because the slow mode characteristics in all uniform cg and mixed structures are similar, we will look at the active-site details of the asymmetric model for the complex next, where the eigenvectors of residues in all slowest modes are multiplied with the same scaling factor, to enhance and better visualize the internal motions. The alternative conformations are superimposed on the basis of all residues in the structure, and only one of the PGH molecules is shown for clarity.
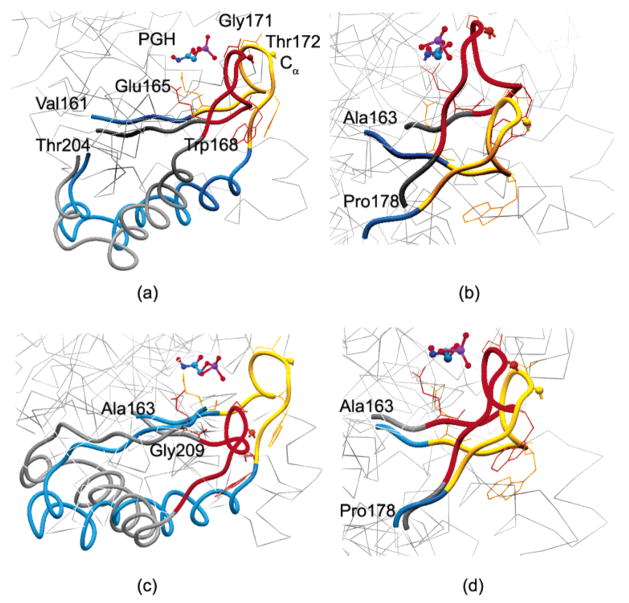
Figure 7a shows the active-site region for the first mode of the asymmetric mixed cg model (case III) of the complex. The opening/closing of the flexible loop (loop 6) over the active site is observed clearly. When the tip of the loop (i.e., Cα of Thr172) moves about 7 Å, the catalytic base Glu165 shifts about 4–4.5 Å and the indole ring of Trp168 rotates about 50°. Even though these deformation values represent the scaled changes between two alternative conformations in the first mode, they agree remarkably well with the experimental findings summarized above (16, 27). Similarly, the distance between the amide group of Gly171 and the phosphate group of PGH that are known to make a hydrogen bond in the complex varies between 4.40 Å (yellow loop) and 2.09 Å (red loop) in the two alternative conformations in the first mode (Figure 7a). The control of the protein to affect this motion is rather remarkable.
Figure 7.
Alternative conformations of the loop region in the (a) first, (b) second, (c) third, and (d) fourth modes for the asymmetric mixed cg TIM-PGH complex are displayed. The loop region (166–176) in red/yellow, one PGH molecule, and the neighboring segments of the loop region (blue/gray) are indicated. The important residues and side chains are also indicated. Other residues are shown as light gray lines in the background to indicate the perspective. In general, mixed cg calculations agree with the experimental findings, indicating that the tip of the loop 6 (α carbon of Thr172) is displaced more than 7 Å between the open and closed conformations, the catalytic base Glu165 moves about 2 Å to force the ligand in a planar conformation for catalysis, the amide group of Gly171 makes a hydrogen bond with the phosphate group of the ligand in the closed conformation, and the indole ring of Trp168 rotates about 50° upon binding.
Parts b and c of Figure 7 represent the active-site region in the second and third modes of the asymmetric mixed cg model, respectively. The indole ring of Trp168 rotates by about 50° and 25°, and the distance between the amide group of Gly171 and the phosphate group of PGH ranges from 6.77 Å (yellow loop) to 2.42 Å (red loop) and from 5.09 Å (yellow loop) to 2.84 Å (red loop) in the second and third modes, respectively. The tip of the loop moves by about 9.84 and 11 Å, relatively larger compared to the first mode. In these modes, although it is not evident from the point of view in the figure, the loop movement is more along the horizontal direction in contrast to the vertical displacement of the loop observed among the X-ray structures.
The active-site region for the fourth mode is shown in Figure 7d. The opening/closing motion of the loop 6 in this mode resembles that in the first mode (Figure 7a). When the tip of the loop moves about 4 Å, Glu165 shifts 1.5 Å and the indole ring of Trp168 rotates slightly. The distance between the amide group of Gly171 and the phosphate group of PGH varies between 4.18 Å (yellow loop) and 2.18 Å (red loop).
In summary, the first and fourth modes clearly relate more closely to the catalytic activity of the enzyme, whereas the second and third modes also involve loop motion but in other directions as compared to that observed in the X-ray structures. In all of these four slowest modes, the flexible loop moves nearly as a rigid body: the root-mean-square deviation (rmsd) between the alternative conformations of loop 6 in a specific mode (as shown in Figure 7) is below 0.4 Å.
The N and C termini of the 11-residue loop were reported by Joseph, Petsko, and Karplus (30) to act as hinges during its rigid-body displacement between the open and closed X-ray conformations. The mutation of these end residues to glycine resulted in reduced catalytic activity (31). However, we observe that the ends of the loop are relatively mobile in the slowest modes and that there are other inner residues that may act as hinges (normally sites of small displacement), some of which are labeled in Figure 7. The mean-square fluctuations of residues in the first mode are shown in Figure 8a for one of the identical monomers (the area under the curve is normalized to 1). The residues with fluctuations below 0.0006 are shown in Figure 8b as black spheres. These relatively immobile hinge-like residues are located around the active site in the middle of the TIM barrel and may act as hinges. Large deformations occur at the outer sites of the TIM barrel, leading to loop opening and closure.
Figure 8.
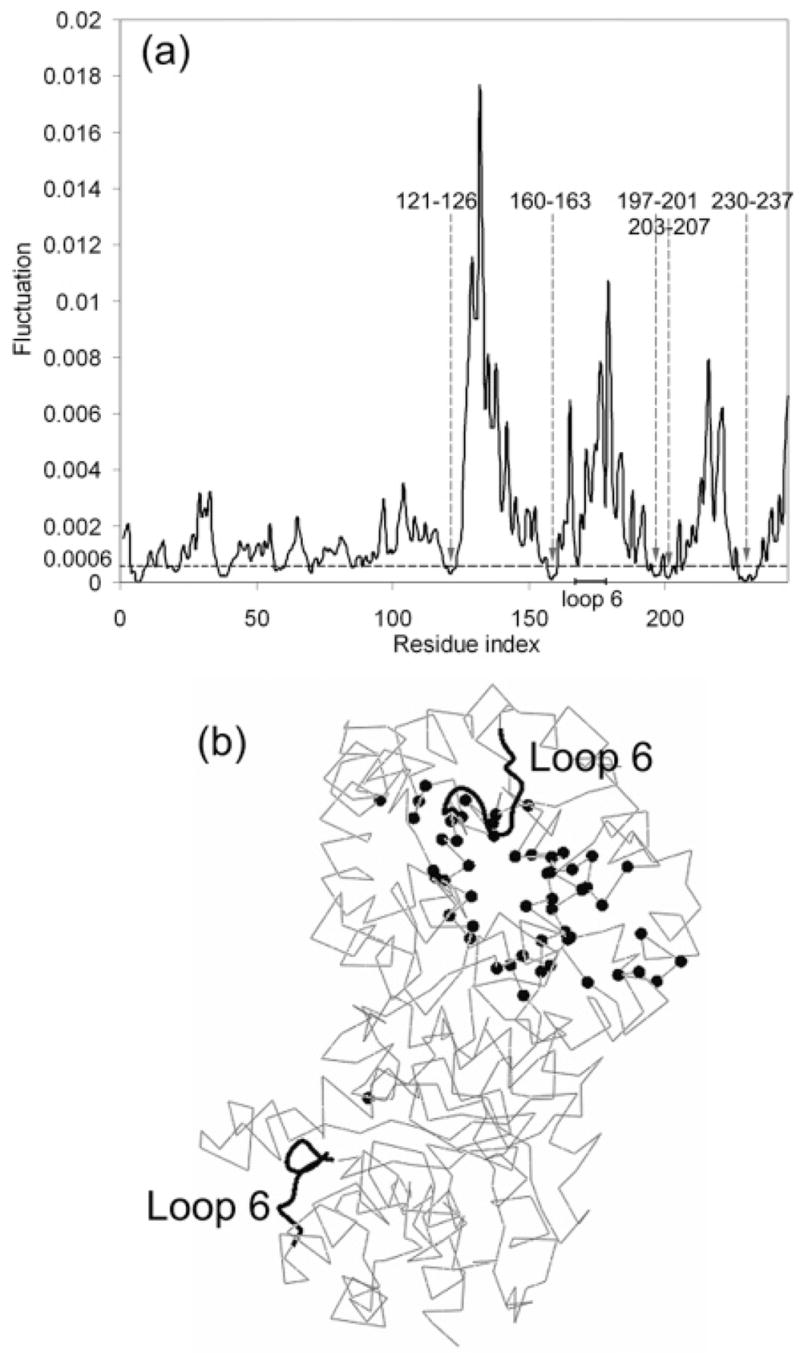
(a) First mode shape for the uniform cg TIM-PGH complex (area under the curve normalized to 1). (b) Relatively immobile residues (fluctuation < 0.0006, indicated by the dotted horizontal line on the top panel) that may act as hinges are shown as black spheres on one of the monomers that are located around the middle of the TIM barrel.
When various X-ray structures of TIM with or without a ligand (such as structures with PDB names 1M6J, 1TRE, 1TIM, 1WYI, and 1NF0) are superimposed, one end of the loop (amino acid 176) seems to be relatively more mobile [with an rmsd of about 2 Å among different structures] compared to the other end (amino acid 166). This resembles our finding in the slowest four modes: we observe a hinge close to one end (around residues 160–163 in the first, third, and fourth modes) but not close to the other end (only observed in the fourth mode around residue 178).
Classical NMA
To further confirm the reliability of the slow modes obtained by ANM, we have performed a vibrational analysis of the complex structure with NMA using a fully atomistic empirical energy function with the software CHARMM (version 30b2) (32). The enzyme complex structure, without PGH, is modeled with the standard PARAM19 force field, considering all atoms including hydrogens. The cutoff for nonbonded interactions is set at 13 Å, with respective spline and buffer widths of 4 and 1 Å and a simulation temperature of 300 K. The energy minimizers used for the calculations are the steepest descent (1100 steps) and the adapted basis Newton-Raphson (109 steps) methods. After energy minimization, the normal-mode vectors are obtained and compared with the findings with uniform cg ANM. The average overlap including the first 10 eigenvectors is 0.79 (with dot products of the first and second mode eigenvectors being 0.75 and 0.67), where only the α carbons are considered. Similar motions of the loop and the active-site residues are obtained in the first mode. Specifically, the range for the 10 slowest frequencies is calculated as 2.0–5.3 cm−1 with CHARMM, which is somewhat below that of the atom-based model (7.9–21.8 cm−1). This difference is due to the fact that the parameters of ANM, i.e., the force constant and the cutoff distance, have not been adjusted to fit the corresponding frequency ranges; however, this could readily be modified if desired.
DISCUSSION
Importance of Retaining the Low-Resolution Region
In previous mixed cg calculations, the fluctuation dynamics of the interesting regions at high resolution have been captured successfully even when the remaining elements of the structure are kept at low resolution. In this study, we also considered a “high-resolution-only” model, which retains only the atomistic region of the asymmetric mixed cg model and omits the low-resolution region. When we compare the first mode deformations of the mixed model with the corresponding second mode of the high-resolution-only model, although the flexible loop makes a similar opening/closing movement in both models, the overall collective motions of the systems are quite different (see Table 3). This points out the importance of including the entire structure, even if cg.
Table 3.
Correlation Coefficients with the Atom-Based Elastic Network Model Taken as the Reference
| correlation coefficientsa | asymmetric mixed cg versus atom-based model | high-resolution region only versus atom-based model |
|---|---|---|
| first four cumulative modes | 0.95 | 0.25 |
| B factors | 0.99 | 0.40 |
All heavy atoms in the corresponding atomistic regions are considered.
Moreover, considering the high-resolution region alone in ANM calculations results in low correlation coefficients for atomic fluctuations in the slowest modes and of the B factors with the atomistic model. In contrast, the correlation values for the asymmetric mixed cg structure are extremely satisfactory, being at least 0.95, as given in Table 3. In addition, the correlation coefficients for the first four cumulative modes are lower than those for the B factors for the case of “the high-resolution-only region”.
Mixed cg techniques have been incorporated into the elastic network models for monitoring the collective motions of supramolecular systems (14, 15), as a result of which important interesting regions such as the active sites of enzymes can be modeled at high resolution with the rest of the system kept at a poorer resolution for computational efficiency. In this study, a procedure is given for determining the adjustable parameters of the mixed cg model, which are the cutoffs and force constants for the high-resolution region in atomic detail and the residue-based, low-resolution region. This procedure can be summarized as follows: (i) set the cutoff value for the low-resolution region (rcut,1), (ii) perform uniform residue-based calculations and determine the force constant (γ1) by a comparison of the experimental and theoretical B factors and the low-frequency motions, (iii) perform mixed cg calculations with different cutoff (rcut,2) and force constant (γ2) values for the atomistic region, using the parameters in this study as guidelines, and determine the low-frequency motions, and then (iv) determine the overlap matrixes between uniform and mixed cg results to choose the optimum parameters for the specific system at hand.
In this work, the collective motions because of binding of a well-known enzyme, TIM, are studied and the results are compared with experimental data. The opening/closing “rigid lid” motion of the flexible loop and the conformational change of the active-site residues during catalysis are obtained successfully with the mixed cg. ANM results indicate that the loop opening/closure is driven by the inherent collective motions of the enzyme in the absence of a ligand. This is consistent with NMR results, showing that the loop motion is not ligand-gated (21). Previous MD simulations (22, 30) could not reach this conclusion, because only the loop region residues have been allowed to move in those limited simulations. One added potential for these models is their potential for investigating the coupling between the protein domain motions and the motions of the atoms in the active site. Such an investigation might be highly informative about enzyme mechanics, because the enzyme sites must provide a highly controlled environment for the specific chemical reaction.
A NMA using full atom empirical potentials is performed to have a better understanding of the conformational changes in the active-site region at the atomistic level, and the slow mode deformations show remarkable agreement with the mixed and uniform cg findings. The mixed cg model provides a detailed conformational analysis of the interesting regions of the protein at the atomic level, while the residue-based model would be inadequate for this purpose. At the same time, the mixed cg model reduces the computational time considerably compared to the atom-based model. Specifically, the asymmetric mixed cg model for TIM is 6 times faster than the atom-based model, where the number of high-resolution nodes/total nodes ratio of the protein is 1290:1619 for this case. However, for a larger system such as the ribosome, the computational efficiency would be significantly better because the ratio of the high-resolution size to the total size of the supramolecule would be much lower. In summary, the mixed cg elastic network enables us to view the large-scale motions for specific regions of large biological systems in atomic detail, where a fully atomistic approach would remain computationally inefficient.
Acknowledgments
O. K. specially thanks Anil Korkut for helpful discussions on classical NMA.
Footnotes
R.L.J. gratefully acknowledges the support from a NIH Grant R01 GM072014. P.D. acknowledges partial support by the Bogazici University B.A.P. (Projects 03A501-D and 03R104), DPT Project (03K120250), TUBITAK Project (104M247), and the Turkish Academy of Sciences in the framework of the Young Scientist Award Program (PD-TUBA-GEBIP/2002-1-9).
Abbreviations: ANM, anisotropic network model; cg, coarse graining or coarse grained; DHAP, dihydroxyacetone phosphate; DHFR, dehydrofolate reductase; GAP, D-glyceraldehyde 3-phosphate; MD, molecular dynamics; NMA, normal-mode analysis; PDB, Protein Data Bank; PGH, phosphoglycolohydroxamate; rmsd, root-mean-square deviation; TIM, triosephosphate isomerase.
References
- 1.Wang W, Donini O, Reyes CM, Kollman PA. Biomolecular simulations: Recent developments in force fields, simulations of enzyme catalysis, protein-ligand, protein-protein, and protein-nucleic acid noncovalent interactions. Annu Rev Biophys Biomol Struct. 2001;30:211–243. doi: 10.1146/annurev.biophys.30.1.211. [DOI] [PubMed] [Google Scholar]
- 2.Daniel RM, Dunn RV, Finney JL, Smith JC. The role of dynamics in enzyme activity. Annu Rev Biophys Biomol Struct. 2003;32:69–92. doi: 10.1146/annurev.biophys.32.110601.142445. [DOI] [PubMed] [Google Scholar]
- 3.Benkovic SJ, Hammes-Schiffer S. A perspective on enzyme catalysis. Science. 2003;301:1196–1202. doi: 10.1126/science.1085515. [DOI] [PubMed] [Google Scholar]
- 4.McCammon A, Harvey SC. Dynamics of Proteins and Nucleic Acids. Cambridge University Press; Cambridge, U.K.: 1987. [Google Scholar]
- 5.Kitao A, Go N. Investigating protein dynamics in collective coordinate space. Curr Opin Struct Biol. 1999;9:164–169. doi: 10.1016/S0959-440X(99)80023-2. [DOI] [PubMed] [Google Scholar]
- 6.Berendsen HJC, Hayward S. Collective dynamics in relation to function. Curr Opin Struct Biol. 2000;10:165–169. doi: 10.1016/s0959-440x(00)00061-0. [DOI] [PubMed] [Google Scholar]
- 7.Bahar I, Atilgan AR, Erman B. Direct evaluation of thermal fluctuations in proteins using a single parameter harmonic potential. Fold Des. 1997;2:173–181. doi: 10.1016/S1359-0278(97)00024-2. [DOI] [PubMed] [Google Scholar]
- 8.Atilgan AR, Durell SR, Jernigan RL, Demirel MC, Keskin O, Bahar I. Anisotropy of fluctuation dynamics of proteins with an elastic network model. Biophys J. 2001;80:505–515. doi: 10.1016/S0006-3495(01)76033-X. [DOI] [PMC free article] [PubMed] [Google Scholar]
- 9.Bahar I, Jernigan RL. Vibrational dynamics of transfer RNAs: Comparison of the free and synthease bound forms. J Mol Biol. 1998;281:871–884. doi: 10.1006/jmbi.1998.1978. [DOI] [PubMed] [Google Scholar]
- 10.Isin B, Doruker P, Bahar I. Functional motions of influenza virus hemagglutinin: A structure-based analytical approach. Biophys J. 2002;82:569–581. doi: 10.1016/S0006-3495(02)75422-2. [DOI] [PMC free article] [PubMed] [Google Scholar]
- 11.Wang Y, Rader AJ, Bahar I, Jernigan RL. Global ribosome motions revealed with elastic network model. J Struct Biol. 2004;147:302–314. doi: 10.1016/j.jsb.2004.01.005. [DOI] [PubMed] [Google Scholar]
- 12.Hinsen K. Analysis of domain motions by approximate normal mode calculations. Proteins. 1998;33:417–429. doi: 10.1002/(sici)1097-0134(19981115)33:3<417::aid-prot10>3.0.co;2-8. [DOI] [PubMed] [Google Scholar]
- 13.Tama F, Gadea FX, Marques O, Sanejouand YH. Building block approach for determining low-frequency normal modes of macromolecules. Proteins. 2000;41:1–7. doi: 10.1002/1097-0134(20001001)41:1<1::aid-prot10>3.0.co;2-p. [DOI] [PubMed] [Google Scholar]
- 14.Kurkcuoglu O, Jernigan RL, Doruker P. Mixed levels of coarse-graining of large proteins using elastic network model succeeds in extracting the slowest motions. Polymer. 2004;45:649–657. [Google Scholar]
- 15.Kurkcuoglu O, Jernigan RL, Doruker P. Collective dynamics of large proteins from mixed coarse-grained elastic network model. QSAR Comb Sci. 2005;24:443–448. [Google Scholar]
- 16.Zhang Z, Sugio S, Komives EA, Liu KD, Knowles JR, Petsko GA, Ringe D. Crystal structure of recombinant chicken Triosephosphate isomerase-phosphogly-colohydroxamate complex at 1.8 Å resolution. Biochemistry. 1994;33:2830–2837. doi: 10.1021/bi00176a012. [DOI] [PubMed] [Google Scholar]
- 17.Knowles JR. Enzyme catalysis–Not different, just better. Nature. 1991;350:121–124. doi: 10.1038/350121a0. [DOI] [PubMed] [Google Scholar]
- 18.Sampson NS, Knowles JR. Segmental movement: Definition of the structural requirements for loop closure in catalysis by triosephosphate isomerase. Biochemistry. 1992;31:8482–8487. doi: 10.1021/bi00151a014. [DOI] [PubMed] [Google Scholar]
- 19.Zhang X, Harrison DHT, Cui Q. Functional specificities of methylglyoxal synthase and triosephosphate isomerase: A combined QM/MM analysis. J Am Chem Soc. 2002;124:14871–14878. doi: 10.1021/ja027063x. [DOI] [PubMed] [Google Scholar]
- 20.Banner DW, Bloomer AC, Petsko GA, Phillips DC, Pogson CI, Wilson IA, Corran PH, Furth AJ, Milman JD, Offord RE, Priddle JD, Waley SG. Structure of chicken muscle triosephosphate isomerase determined crystallographically at 2.5 Å resolution using amino sequence data. Nature. 1975;255:609–614. doi: 10.1038/255609a0. [DOI] [PubMed] [Google Scholar]
- 21.Williams JC, McDermott AE. Dynamics of the flexible loop of triosephoshate isomerase: The loop motion is not ligand gated. Biochemistry. 1995;34:8309–8319. doi: 10.1021/bi00026a012. [DOI] [PubMed] [Google Scholar]
- 22.Derreumaux P, Schlick T. The loop opening/closing motion of the enzyme triosephosphate isomerase. Biophys J. 1998;74:72–81. doi: 10.1016/S0006-3495(98)77768-9. [DOI] [PMC free article] [PubMed] [Google Scholar]
- 23.Berman HM, Westbrook J, Feng Z, Gilliland G, Bhat TN, Weissig H, Shindyalov IN, Bourne PE. The Protein Data Bank. Nucleic Acids Res. 2000;28:235–242. doi: 10.1093/nar/28.1.235. [DOI] [PMC free article] [PubMed] [Google Scholar]
- 24.Tirion MM. Large amplitude elastic motions in proteins from a single parameter, atomic analysis. Phys Rev Lett. 1996;77:1905–1908. doi: 10.1103/PhysRevLett.77.1905. [DOI] [PubMed] [Google Scholar]
- 25.Ben-Avraham D. Vibrational normal-mode spectrum of globular proteins. Phys Rev B. 1992;47:14559–14560. doi: 10.1103/physrevb.47.14559. [DOI] [PubMed] [Google Scholar]
- 26.Amadei A, Ceruso MA, Nola AD. On the convergence of the conformational coordinates basis set obtained by the essential dynamics analysis of proteins’ molecular dynamics simulations. Proteins: Struct Funct, Genet. 1999;36:419–424. [PubMed] [Google Scholar]
- 27.Desamero R, Rozovsky S, Zhadin N, McDermott A, Callender R. Active site loop motion in triosephosphate isomerase: T-jump relaxation spectroscopy of thermal activation. Biochemistry. 2003;42:2941–2951. doi: 10.1021/bi026994i. [DOI] [PubMed] [Google Scholar]
- 28.Kundu S, Jernigan RL. Molecular mechanism of domain swapping in proteins: An analysis of slower motions. Biophys J. 2004;86:3846–3854. doi: 10.1529/biophysj.103.034736. [DOI] [PMC free article] [PubMed] [Google Scholar]
- 29.Guallar V, Jacobson M, McDermott A, Friesner RA. Computational modeling of the catalytic reacion in triosephosphate isomerase. J Mol Biol. 2004;337:227–239. doi: 10.1016/j.jmb.2003.11.016. [DOI] [PubMed] [Google Scholar]
- 30.Joseph D, Petsko GA, Karplus M. Anatomy of a conformational change: Hinged lid motion of the triosephosphate isomerase loop. Science. 1990;249:1425–1428. doi: 10.1126/science.2402636. [DOI] [PubMed] [Google Scholar]
- 31.Xiang J, Jung J, Sampson NS. Entropy effects on protein hinges: The reaction catalyzed by triosephosphate isomerase. Biochemistry. 2004;43:11436–11445. doi: 10.1021/bi049208d. [DOI] [PubMed] [Google Scholar]
- 32.Brooks BR, Bruccoleri RE, Olafson BD, States DJ, Swaminathan S, Karplus M. CHARMM. J Comput Chem. 1983;4:187–217. BI0518085. [Google Scholar]


