

Abstract
The objective performance evaluation metrics, termed Generalized Modulation Transfer Function (GMTF), Generalized Noise Power Spectrum (GNPS), Generalized Noise Equivalent Quanta (GNEQ), and Generalized Detective Quantum Efficiency (GDQE), have been developed to assess total imaging-system performance by including the effects of geometric unsharpness due to the finite size of the focal spot and scattered radiation in addition to the detector properties. These metrics were used to evaluate the performance of the HSMAF, a custom-built, high-resolution, real-time-acquisition detector with 35-μm pixels, in simulated neurovascular angiographic conditions using a uniform head-equivalent phantom. The HSMAF consists of a 300-μm-thick CsI(Tl) scintillator coupled to a 4 cm diameter, variable-gain, Gen2 light image intensifier with dual-stage microchannel plate, followed by direct fiber-optic coupling to a 30-fps CCD camera, and is capable of both fluoroscopy and angiography. Effects of focal-spot size, geometric magnification, irradiation field-of-view, and air-gap between the phantom and the detector were evaluated. The resulting plots of GMTF and GDQE showed that geometric blurring is the more dominant image degradation factor at high spatial frequencies, whereas scatter dominates at low spatial frequencies. For the standard image-geometry and scatter conditions used here, the HSMAF maintains substantial system imaging capabilities (GDQE>5%) at frequencies above 4 cycles/mm where conventional detectors cannot operate. The loss in image SNR due to scatter or focal-spot unsharpness could be compensated by increasing the exposure by a factor of 2 to 3. This generalized evaluation method may be used to more realistically evaluate and compare total system performance leading to improved system designs.
Keywords: system-evaluation, detectors, high-resolution, HSMAF, GMTF, GDQE, fluoroscopy, micro-angiography
1. INTRODUCTION
The intrinsic resolution, noise, and signal-to-noise transfer characteristics of digital imaging detectors are the most commonly used performance descriptors. Modulation Transfer Function (MTF) and Noise Power Spectrum (NPS) are used as objective metrics to characterize the intrinsic resolution and noise transfer properties. These two quantities, together with air-kerma measurements at the image receptor input surface and an x-ray spectral model, are used to compute the frequency dependent Noise Equivalent Quanta (NEQ) and Detective Quantum Efficiency (DQE). The NEQ is an objective representation of signal-to-noise transfer characteristics, whereas the DQE represents the output signal-to-noise of the detector system normalized to the input air-kerma at the receptor.
The standard performance assessment metrics of MTF, NPS, NEQ and DQE, when used to describe intrinsic detector performance, remain insufficient for realistic objective evaluation of imaging systems used in the clinical environment for patient studies. In this context, the standard parameters do not account for the effect of the clinical environment during patient procedures where scatter due to the patient and geometric unsharpness due to the finite size of the focal spot play a significant role in determining the image quality. The generalized methodology of detector evaluation was developed by including the clinically relevant factors affecting the image quality during patient studies. The properties of the detector, x-ray tube, and the patient were combined together to define a total x-ray imaging system for the generalization of performance evaluation parameters.
The generalized imaging system evaluation parameters, termed Generalized Modulation Transfer Function (GMTF), Generalized Normalized Noise Power Spectrum (GNNPS), Generalized Noise Equivalent Quanta (GNEQ) and Generalized Detective Quantum Efficiency (GDQE) include the effect of both the magnitude and spatial distribution of scattered radiation due to the patient and the focal spot blurring referenced to the object plane. The effect of focal spot blurring, magnification and scatter on the MTF has already been investigated by many authors.1,2,3,4 Kyprianou et. al.5,6,7 developed a theoretical formulation of the generalized performance evaluation parameters, and experimentally verified them for a specific high-resolution, region-of-interest, microangiographic prototype detector developed by our group.8,9,10 The first clinical implementation of this new generalized total-system evaluation methodology was demonstrated in our previously published results11, where the effect of focal spot blur and scatter were investigated for a commercial x-ray image intensifier (XII) in simulated neurovascular imaging conditions and compared with a region-of-interest (ROI) microangiographic system. The total-system evaluation approach incorporates the properties of the patient as well as the geometry of the system, both affecting the final image quality.
In this study, we present a detailed generalized performance assessment of a recently developed High-Sensitivity Microangiographic Fluoroscopic (HSMAF) Detector in simulated neurovascular angiographic conditions. The HSMAF detector is a high-resolution, ROI detector that has demonstrated capability to perform at low dose fluoroscopic exposures without being limited by system noise sources. The detailed description of the detector design will be presented in the following section. The spatial frequency dependent generalized system evaluation parameters, GMTF, GNPS, GNEQ and GDQE, were analyzed to study the impact of clinical environment factors, such as air-gap, irradiation field area, magnification, and focal-spot size, on the final image quality in neurovascular imaging conditions.
2. MATERIALS AND METHODS
2.1 The Generalized System Evaluation Parameters
The generalized system parameters are defined by considering the focal spot blurring and the image degradation due to scatter as parallel processes12 at the detector entrance followed by the detector degradation as the cascade in the imaging chain. The detector MTF (MTFD), the Focal Spot MTF (MTFF) and the Scatter MTF (MTFS) along with the scatter fraction (ρ) are combined together to define the Generalized Modulation Transfer Function5,6,7
| (1) |
where m is magnification factor and f represents the object spatial frequency in mm−1.
The scatter fraction is defined as ρ = S/(S + P), where S and P are the scatter and primary components detected by the image receptor, respectively. The magnification factor as used here is defined with reference to the objects of interest within the patient or phantom, e.g., blood vessels or stents within the skull. The factor (1 − ρ) in the first term is the primary fraction and ensures that only the primary component contributes to focal spot blurring in the formulation. The factor (m −1)/m in the focal spot MTF term rescales the spatial frequency into the object plane from the physical focal spot in the x-ray tube. The second term has only the scatter contribution and spatial frequency is rescaled to the object plane from the image plane using a factor of 1/m times the spatial frequency.4 The detector MTF is used as a multiplicative term assuring the cascade process, and again the spatial frequency is rescaled to the object plane from the detector plane. Thus, the total system Generalized Modulation Transfer Function (GMTF) is defined at the object plane in contrast to the intrinsic detector MTF which is defined at the detector plane.
The Generalized Normalized Noise Power Spectrum (GNNPS) in the object plane is defined as
| (2) |
where NPSD (f, X) is the detector Noise Power Spectrum and d(X) is the detector output signal measured as the average pixel value of the flat-field image, provided that the detector is linear or linearized. There is no distinction between primary and scattered photons in terms of the normalized-noise contribution; therefore there is no scatter term in this equation. A division by a factor of m2 is used to project the effective pixel area from the image plane to the object plane.
The Generalized Noise Equivalent Quanta (GNEQ) from the total imaging system point of view is defined by using the GMTF and GNNPS as follows
| (3) |
The Generalized Detective Quantum Efficiency (GDQE) for the total system is defined by normalizing the absolute image quality with the effective photon fluence at the object plane
| (4) |
where Φin (X, m) represents the number of quanta per unit area at the detector entrance. The denominator m2Φin (X, m) is the number of incident quanta per unit area referenced to the object plane using the inverse square in increase of the number of quanta measured at the detector entrance. The number of quanta per unit area at the detector entrance is determined by using the normalized x-ray spectrum as a function of energy13,14,15 and the measured detector entrance exposure.
The scatter fraction and magnification can be expressed in terms of geometry dependent explicit parameters such as air-gap and radiation field size for a given source to image distance and depth of the object within the phantom.
2.2. X-ray imaging system and experimental set-up
The total imaging system consists of an x-ray tube, a uniform head-equivalent phantom, a patient table, and the HSMAF detector mounted on a C-arm (Infinix, Model RTP12303J-G9E, Toshiba Medical Systems Corporation) using a custom mounting system. A brief description of the HSMAF detector is presented below:
2.2.1. The High Sensitivity Microangiographic Fluoroscopic (HSMAF) Detector
Previous investigations have demonstrated that high image quality and high resolution are not necessarily required throughout the field of view (FOV), but that it is important to have high image quality within an ROI, where the interventional procedure, such as endovascular device placement, is being carried out.16,17 In the periphery of the ROI, a relatively low quality and low resolution image might be clinically acceptable because control of interventional devices is often not required outside the ROI and this area may be needed only for reference. It has been demonstrated that ROI imaging has the advantage of improved radiographic contrast (because of reduced scatter and glare within the ROI) and overall dose reduction to the patient.16 This led to the development of the ROI imaging detectors for neuro-interventional applications.8,9,10,18 The main purpose of the new HSMAF detector is to implement high-resolution fluoroscopy and angiography in neuro-interventional procedures, where most of the procedure is carried out in low-dose fluoroscopic image guidance with sequences of high-quality angiographic images for decision making and archival purposes. The HSMAF detector satisfies the requirements for practical feasibility of a detector to be used in neuro-interventional applications, such as high-sensitivity, high-resolution over an identified ROI, large dynamic range, and practical compatibility for mounting with a commercial C-arm gantry.
The HSMAF detector consists of a 300 μm thick structured CsI(Tl) scintillator (Hamamatsu Corp., Bridgewater, NJ) coupled to a 40 mm diameter variable-gain, dual MCP, Gen2 light image intensifier (Model PP0410K, DEP Inc., Dwazziewegen 2, NL-9300 AB Roden, The Netherlands). The amplified output is directly coupled to a custom-bonded fiber-optic window on the CCD chip of a 12-bit, 1024×1024, 30 fps, frame transfer CCD camera (Model Pantera TF-1M30, Dalsa Corp., Waterloo, ON, Canada) via a 2.88:1 minifying fiber-optic taper. An optical coupling gel (Fused Silica Matching Liquid, Code 06350, Cat 19571, Cargille Laboratories, Inc., Cedar Grove, NJ) was used to couple the fiber-optic interfaces in the imaging chain. Because of the direct fiber-optic coupling between the amplifying stage and the CCD chip, the HSMAF has a wide range of gain settings available through the light image intensifier (LII), which allows its use in high sensitivity imaging applications. It has an effective image pixel size of 35 μm (referenced to the detector input) in its highest resolution mode (1024×1024), and has the capablilty for pixel binning for higher sensitivity applications. Figure 1(a) shows the schematic diagram of the HSMAF, and figure 1(b) shows a picture of the operational detector.
Figure 1.


Figure 1(a). The schematic diagram of the high-sensitivity micro-angiographic fluoroscopic (HSMAF) detector which includes three fiber-optic plates (FOP), a fier-optic taper (FOT) and a multi-channel plate light image intensifier (MCP LII).
Figure 1(b). A photograph of the assembled HSMAF detector with cover removed. The input phosphor is on the right.
2.2.2. The imaging set-up
An average human head-equivalent uniform phantom was created using 15 cm thick PMMA and 3.2 mm thick aluminum19. A fixed source to image distance (SID) of 75 cm was used, and two different focal spots (0.6 mm and 0.3 mm, nominal) were selected for comparison. The effect of scatter was studied by varying the irradiation field-of-view (FOV) as well as the air-gap between the phantom and the detector. The effect of geometric-unsharpness on the image quality was studied in terms of focal-spot size, geometric-magnification due to change in air-gap, and location of the object of interest inside the phantom. The object location in the imaging set-up, in combination with the focal spot size and SID, determine the geometric unsharpness contribution to the GMTF and GDQE. Unless specified otherwise, the default depth of the object was taken as 5 cm from the top of the phantom on the image receptor side. This depth is somewhat realistic for neurovascular angiography of cerebral aneurysms in the human-head. The detector entrance exposure was measured by replacing the image detector with an ionization chamber (Model 35050A dosimeter with model 96035B ionization chamber, Keithley Instruments Inc., Cleveland, OH). Figure 2 shows the typical system geometry in neurovascular procedures with the HSMAF detector in place. The detector can be removed from the field of view by rotating a retractable arm holding the detector, and the image intensifier can easily be moved down to the required position when needed.
Figure 2.

Schematic diagram showing the neurovascular interventional imaging set-up using the HSMAF detector.
2.3 Image acquisition and intrinsic detector performance parameters
The generalization from intrinsic detector performance evaluation to total-system evaluation requires the measurements of MTF for the focal spot, scatter, and the detector. It also requires the scatter fraction and the NNPS for the detector. A brief description of the measurement of these components is presented in the following sub-sections.
2.3.1 Modulation Transfer Function (MTF)
The presampled MTF for the HSMAF was measured using the standard slanted-edge technique. A standard RQA 5 spectrum with 72 kVp x-ray beam was used, and the sharp edge device was placed at the detector input with a slight angle (about 2 degrees) with respect to the pixel matrix. Sixty edge images were acquired and averaged after the correction for offset and gain. The presampled MTF was calculated using the algorithm described by Samei et al.20 Figure 3 shows the measured MTF for the HSMAF detector in angiographic mode. At a spatial frequency of 10 cycles/mm the MTF was found to be about 2%, which indicates the ability of this detector to resolve closely spaced objects.
Figure 3.

Measured intrinsic detector MTF of the HSMAF detector.
2.3.2 Focal Spot MTF
The finite size of the x-ray focal spot is a well-known source of geometric blur. The spatial distribution of the focal spot blur was obtained by imaging a slit camera placed midway between the source and image plane.21,22 An average of 60 images was used to calculate the focal spot MTF for the 0.6 mm and 0.3 mm focal spots. The pixel size was much smaller than the geometric blur and was neglected in this determination. Assuming that the negative part of the optical transfer function (representing spatial phase shift) is anomalous resolution and unusable, a Gaussian tail extrapolation was used from the first minima to the Nyquist frequency of the detector in calculating the focal spot MTF in the plane of the focal spot. The Gaussian fitting was performed using the last 10 data points before the first minima. Figure 4 shows the typical low-frequency behavior of the focal spot MTF (MTFF) for the 0.6 mm focal spot. The focal spot MTF shown corresponds to the signal transfer for an object magnification factor of two where the spatial frequencies are referenced to the image receptor plane.
Figure 4.

The spatial frequency behavior of the focal spot MTF (MTFF) referenced to the focal spot plane. The focal spot MTF was measured by imaging a slit camera using the nominal 0.6 mm focal spot with magnification factor of 2.
2.3.3 Scatter Fraction
The standard lead-disk-stop technique23,24 was employed to determine the scatter fraction in the “with-scatter” geometry where the head-equivalent phantom was close to the detector. In order to associate the scatter fraction with the magnification and effect of irradiation field sizes, sets of images were acquired as a function of air-gap and irradiation field area. The resulting scatter fractions were fit to a surface following the empirical relation6,11 between the scatter fraction (ρ), air-gap (AG), and the radiation field area (α),
| (5) |
where ai, j are constants to be determined from the fit. This surface fit allows us to evaluate the scatter fractions at any intermediate air-gap and irradiation field area.
2.3.4 Scatter MTF
A difference edge-spread function technique was employed to calculate the spatial distribution of scatter for the uniform human head equivalent phantom.25 The spatial distribution of scatter is noticeable only at very low spatial frequencies. Because we need the scatter MTF all the way up to the Nyquist frequency of the detector for further calculations of generalized system parameters, we used an exponential tail extrapolation up to the Nyquist frequency of the detector. Figure 5 shows the low spatial frequency behavior of the scatter MTF (MTFS). The spatial frequencies in this plot represent the image plane frequency.
Figure 5.

Typical scatter MTF (MTFS) for a uniform head-equivalent phantom. The spatial frequencies in this plot represent the image plane frequencies.
2.3.5 Normalized Noise Power Spectrum (NNPS)
The detector noise power spectrum is defined as the squared modulus of the Fourier transformation of the fluctuations about the mean of a flat-field image, multiplied by the pixel area with units of mm2. For the measurement of NNPS, 60 flat-field images were acquired using the standard RQA 5 spectrum with a 72 kVp x-ray beam. The two dimensional normalized noise power spectra were obtained by the standard Fourier Transformation method.26 In this method, a central region of each corrected image was divided into 256 pixel × 256 pixel ROIs with half-overlap in horizontal and vertical directions. The mean pixel gray value in each ROI was subtracted from each pixel value, and the result was Fourier transformed to obtain the noise power spectrum (NPS). The NPS from each ROI were then averaged and normalized using the square of the average pixel value to determine the NNPS.
Figure 6(a) shows the two dimensional NNPS of the HSMAF detector, which shows that the noise power of this detector is symmetric in the Fourier domain. The one dimensional NNPS was calculated by radial averaging in the four quadrants of the two dimensional NNPS. Figure 6(b) shows the plot of one-dimensional NNPS vs. spatial frequency extracted from the two dimensional NNPS.
Figure 6.
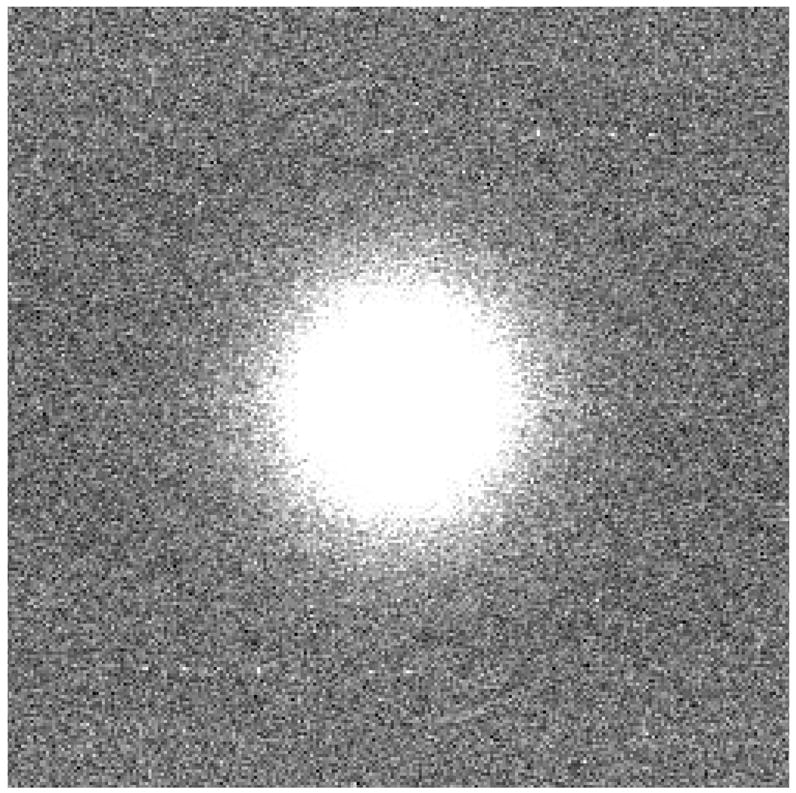

Figure 6(a). Two-dimensional NNPS of the HSMAF detector.
Figure 6(b). Radial averaged one-dimensional NNPS of the HSMAF detector.
3. RESULTS AND DISCUSSION
Figure 7 shows a plot of GMTF as a function of spatial frequency at two different air-gaps (2.5 cm and 7.5 cm), using full irradiation FOV (4 cm diameter) and 0.3 mm focal-spot at 74 kVp.
Figure 7.

GMTF of the HSMAF for a 0.3 mm focal spot with varying air-gaps and fixed irradiation FOV of 4 cm diameter
It is to be noted that the detector MTF (no scatter, no geometric blurring) over-estimates the actual resolution compared to the total-system resolution measured in terms of the GMTF. The effect of increasing air-gap has in turn two factors that contribute to the GMTF simultaneously: scattered radiation- dominant at low spatial frequencies, and focal spot blurring- dominant at higher spatial frequencies. At the smaller air-gap, increased scatter degraded the GMTF at low spatial frequencies, whereas the small air gap resulted in reduced geometric magnification and improved resolution at the higher frequencies. For both cases shown, even with the focal spot blur and scatter, the GMTF for the HSMAF remains high at spatial frequencies above 4 cycles/mm, where conventional detectors are generally not useful.
Figure 8 shows a similar set of plots as shown in figure 7, but with a 0.6 mm focal spot. In this case, the low frequency degradation in the GMTF due to scatter at air-gaps of 2.5 cm and 7.5 cm were similar to the case of the 0.3 mm focal spot, but there was further degradation in the GMTF at higher spatial frequencies because of the use of the relatively larger focal-spot (0.6 mm). For example, the GMTF corresponding to 6 cycles/mm at an air-gap of 7.5 cm was about 48% lower than that at 2.5 cm air-gap when 0.6 mm focal-spot was used, whereas the corresponding GMTF degradation using 0.3 mm focal-spot was only about 9%. Thus by comparing the GMTF corresponding to 2.5 cm and 7.5 cm air-gaps at higher spatial frequencies, it was observed that the use of a smaller air-gap is beneficial when the relatively larger focal spot was used.
Figure 8.

GMTF of the HSMAF for a 0.6 mm focal spot with varying air-gaps and fixed irradiation FOV of 4 cm diameter.
Figure 9 shows the GMTF vs. spatial frequency at a fixed air-gap of 2.5 cm, and varying irradiation FOV (2 cm and 4 cm) with the 0.3 mm focal spot. Decreased FOV resulted in decreased scatter, and therefore better GMTF at low spatial frequencies even for these small FOVs. In this case, use of small focal spot and small air-gap preserves the system resolution at higher spatial frequencies, as required in neurovascular imaging applications. By increasing the air-gap we can reduce the scatter, but at the expense of degradation in high frequency components of the GMTF. Similarly, use of the large focal spot at the same air-gap would tend to degrade the high frequency components of the GMTF.
Figure 9.

GMTF of the HSMAF for a 0.3 mm focal spot with varying irradiation FOV and fixed air-gap of 2.5 cm.
Figure 10 shows a set of plots for GMTF vs. spatial frequency at a fixed air-gap of 2.5 cm and 4 cm diameter FOV with 0.3 mm focal spot. In this case, position of the object of interest inside the phantom was changed to vary the magnification. This configuration simulates the conditions where the object of interest may be buried deep inside the patient. In these plots, scatter remained the same, and hence low frequency degradation of the GMTF was similar for magnifications 1.1 and 1.2. However, use of the small focal-spot resulted in almost negligible degradation in the GMTF at higher frequencies even with an increase in geometric magnification. Similarly, an increase in air-gap would lead to an additional increase in geometric magnification but reduced scatter, and hence further blurring in high frequency components. A large focal spot in the same configuration would tend to degrade the GMTF at higher frequencies.
Figure 10.

Effect of geometric magnification, where location of the object of interest was varied inside the phantom, and HSMAF was operated at its optimal imaging configuration (0.3 mm focal spot, 2.5 cm air-gap, and 4 cm FOV).
Figure 11 shows the GNNPS vs. spatial frequency at two different air-gaps (2.5 cm and 7.5 cm) and 4 cm diameter FOV, and compared to the intrinsic detector NNPS. Because of the rescaling of effective pixel size to the object plane, the GNNPS decreases with increasing magnification. The magnification could be the result of either increase in air-gap or depth of the object inside the phantom (patient). The results in this set of plots correspond to the increase in air-gap, while the object of interest was fixed 5 cm below the top of the phantom. It is to be noted that this formalism does not distinguish between scatter photons and primary photons while estimating the noise power spectrum.
Figure 11.

GNNPS of the HSMAF for a 0.3 mm focal spot with varying air-gap and fixed irradiation FOV of 4.0 cm diameter, and keeping the exposure factors (tube output) constant.
Figure 12 is a set of plots for GNEQ in the same configuration as shown in figure 11. GNEQ represents the effective number of quanta at the object plane that contribute to the image formation in each of the cases.
Figure 12.

GNEQ of the HSMAF for a 0.3 mm focal spot with varying air-gap and fixed irradiation FOV of 4.0 cm diameter, and keeping the exposure factors (tube output) constant.
Figure 13 shows a set of plots for GDQE vs. spatial frequency at air-gaps of 2.5 cm and 7.5 cm and a 4 cm diameter FOV with 0.3 mm focal spot, and compared to the intrinsic detector DQE. In this case, increased air-gap resulted in reduced scatter, and hence relatively better GDQE at lower spatial frequencies compared to that at a smaller air-gap. It can be seen that in either case the total-system DQE (GDQE) is much lower than the intrinsic detector DQE, indicating that the primary information transfer efficiency of the system is highly dependent on imaging set-up configuration. The effect of increasing geometric magnification and focal-spot size follows similar behavior as discussed in the case of GMTF.
Figure 13.

GDQE of the HSMAF for a 0.3 mm focal spot with varying air-gap and fixed irradiation FOV of 4.0 cm diameter.
Figure 14 shows another set of plots for GDQE at a fixed air-gap of 2.5 cm, and varying irradiation FOV (1 cm and 2 cm diameter). An increase in FOV results in increased scatter and, therefore, degradation in the GDQE at lower spatial frequencies is more prominent compared to the degradation at higher frequencies which is mainly affected by geometric unsharpness blur and remains constant in this case (object location and air-gap are fixed). GDQE compared to DQE performance at higher frequencies is better appreciated from figure 15 and figure 16.
Figure 14.

GDQE of the HSMAF for a 0.3 mm focal spot with varying irradiation FOV and fixed air-gap of 2.5 cm.
Figure 15.

DQE/GDQE of the HSMAF for a 0.3 mm focal spot with varying irradiation FOV and fixed air-gap of 2.5 cm.
Figure 16.

DQE/GDQE of the HSMAF for a 0.6 mm focal spot with varying irradiation FOV and fixed air-gap of 2.5 cm.
Figure 15 shows the ratio of detector DQE and the total-system GDQE vs. spatial frequency with varying air-gaps (2.5 cm, 5.0 cm, and 7.5 cm) at 4 cm diameter FOV and 0.3 mm focal spot. The ratio of DQE and GDQE essentially represents the factor by which the dose could be increased at a given spatial frequency to compensate completely for the effect of image-degrading system parameters (scatter and focal spot size), and achieve the maximum signal-to-noise ratio (SNR) that could be obtained from the DQE of the detector alone. The plots suggest that increasing air-gaps require relatively higher dose at higher frequencies to achieve complete compensation. From the results shown in figure 15, for the practical needs of neurovascular image guided interventional procedures using a 0.3 mm focal-spot and 2.5 cm air-gap imaging 4 to 6 cycles/mm resolution would require a 2.3x to 2.7x increase in dose to achieve the ideal SNR available with the HSMAF; however, the high-sensitivity feature (large dynamic gain range due to the LII) of the HSMAF enables imaging at a lower dose if the resultant SNR were acceptable at the high frequencies.
Figure 16 shows a similar set of plots as shown in figure 15, but with 0.6 mm focal spot. In this case, similar air-gaps require higher doses compared to the case of the 0.3 mm focal spot to achieve full compensation at higher frequencies. In this case, at a 2.5 cm air-gap imaging 4 to 6 cycles/mm resolution would require a 2.7x to 3.9x increase in dose.
Thus, the comparison of relative degradation in the system GDQE at high spatial frequencies, with respect to the corresponding detector DQE demonstrated that the use of the 0.3 mm focal-spot over the 0.6 mm focal-spot would allow a substantial dose saving. A comparison of figure 15 and figure 16 suggests that for high spatial frequencies exceeding 6 cycles/mm, the HSMAF may be practical only when used with the smaller focal spot since the compensation factor for the larger focal spot shows a sharp increase in slope.
4. SUMMARY AND CONCLUSION
The total-system generalized performance assessment of a new high-sensitivity microangiographic fluoroscopic system under simulated neurovascular angiographic conditions was presented. The detailed performance analysis in terms of GMTF, GNNPS, GNEQ and GDQE, tailored to high-resolution imaging applications, was discussed in regard to the focal spot blurring and scatter due to the patient combined with the intrinsic detector characteristics. The effects of varying irradiation field area, air-gap, and geometric magnification blur on the generalized objective total-system evaluation parameters were analyzed. A comparison of total system GDQE and the detector DQE at various spatial frequencies strongly supports the use of the HSMAF detector with a 0.3-mm focal-spot for improved image quality. The high sensitivity due to large dynamic gain range in the HSMAF detector facilitates the operation of this system with the smaller focal spot without exceeding tube-loading limits. The overall results of the generalized performance assessment demonstrated the potential usefulness of this detector in high-resolution imaging as required in neuro-interventional applications. This generalized, total-system-based analysis can provide realistic evaluation leading to improved system designs tailored to the imaging task.
Acknowledgments
This work was supported by NIH Grants: R01-NS38746, R01-NS43924, R01-EB002873, and equipment from Toshiba Medical Systems Corp.
References
- 1.Muntz EP. Analysis of the significance of scattered radiation in reduced dose mammography, including magnification effects, scatter suppression, and focal spot and detector blurring. Med Phys. 1979;6(2):110–117. doi: 10.1118/1.594540. [DOI] [PubMed] [Google Scholar]
- 2.Krol JA, Bassano DA, Chamberlain CC, Prasad SC. Scatter reduction in mammography with air gap. Med Phys. 1996;23(7):1263–1270. doi: 10.1118/1.597869. [DOI] [PubMed] [Google Scholar]
- 3.Doi K, Rossman K. The effect of radiographic magnification on blood vessel imaging with various screen-film systems. Med Phys. 1974;1(5):257–261. doi: 10.1118/1.1637304. [DOI] [PubMed] [Google Scholar]
- 4.Shaw CC, Liu X, Lemacks M, Rong JX, Whitman GJ. Optimization of MTF and DQE in magnification radiography- a theoretical analysis. Proc SPIE. 2000;3977:466–475. [Google Scholar]
- 5.Kyprianou IS, Rudin S, Bednarek DR, Hoffmann KR. Study of Generalized MTF and DQE for a new Microangiographic System. Proc SPIE. 2004;5368:349–360. doi: 10.1117/12.533512. [DOI] [PMC free article] [PubMed] [Google Scholar]
- 6.Kyprianou I. PhD Thesis. Department of Physics; SUNY at Buffalo, NY: 2004. A Method for Total x-ray Imaging System Evaluation: Application to a Microangiographic Detector for Neurovascular Procedures. [Google Scholar]
- 7.Kyprianou IS, Rudin S, Bednarek DR, Hoffmann KR. Generalizing the MTF and DQE to include x-ray scatter and focal spot unsharpness: Application to a new micro-angiographic system for clinical use. Med Phys. 2005;32(2):613–626. doi: 10.1118/1.1844151. [DOI] [PubMed] [Google Scholar]
- 8.Ganguly A, Rudin S, Bednarek DR, Hoffmann KR, Kyprianou IS. Microangiographic Detector for Neuro-vascular Imaging, Part 1: Experimental measurements and feasibility. Med Phys. 2003;30(11):3018–3028. doi: 10.1118/1.1617549. [DOI] [PubMed] [Google Scholar]
- 9.Ganguly A, Rudin S, Bednarek DR, Hoffmann KR, Kyprianou IS. Microangiography for neuro-vascular Imaging, part II: Cascade Model Analysis. Med Phys. 2003;30(11):3029–3039. doi: 10.1118/1.1617550. [DOI] [PubMed] [Google Scholar]
- 10.Rudin S, Wu Y, Kyprianou IS, Ionita CN, Wang Z, Ganguly A, Bednarek DR. Micro-angiographic detector with fluoroscopic capability. Proc SPIE. 2002;4682:344–354. [Google Scholar]
- 11.Yadava GK, Kyprianou IS, Rudin S, Bednarek DR, Hoffmann KR. Generalized Performance Evaluation of X-ray Image Intensifier Compared with a Micro-angiographic Detector. Proc SPIE. 2005;5745:419–429. doi: 10.1117/12.594593. [DOI] [PMC free article] [PubMed] [Google Scholar]
- 12.Cunningham IA. Handbook of Medical Imaging. I. SPIE Press; Bellingham, WA: 2000. pp. 79–162. [Google Scholar]
- 13.Boone JM. Handbook of Medical imaging. I. SPIE Press; Bellington, WA: 2000. pp. 3–77. [Google Scholar]
- 14.Boone JM, Seibert JA. An accurate method for computer-generating tungsten anode x-ray spectra from 30 to 140 kV. Med Phys. 1997;24(11):1661–1670. doi: 10.1118/1.597953. [DOI] [PubMed] [Google Scholar]
- 15.Catalogue of diagnostic x-ray spectra and other data. Inst Phys and Eng in Med. 1997 Report No. 78. [Google Scholar]
- 16.Rudin S, Bednarek DR. Region of Interest Fluoroscopy. Med Phys. 1992;19:1183–1189. doi: 10.1118/1.596792. [DOI] [PubMed] [Google Scholar]
- 17.Rudin S, Bednarek DR, Kezerashvili M, Granger WE, Serghany JE, Guterman LR, Hopkins LN, Szymanski B, Loftus RJ. Clinical application of region-of-interest techniques to radiologic imaging. Radiographics. 1996;16:895–902. doi: 10.1148/radiographics.16.4.8835978. [DOI] [PubMed] [Google Scholar]
- 18.Wu Y, Rudin S, Bednarek DR. A prototype micro-angiographic fluoroscope and its application in animal studies. Proc SPIE. 2005;5745:1066–1077. doi: 10.1117/12.589232. [DOI] [PMC free article] [PubMed] [Google Scholar]
- 19.AAPM Report No. 60, “Instrumentation requirements of diagnostic radiological physicists (Generic Listing),” Report of Task Group 4, Diagnostic x-ray imaging committee, (1998).
- 20.Samei E, Flynn MJ, Reimann DA. A method for measuring the presampled MTF of digital radiographic systems using an edge test device. Med Phys. 1998;25:102–113. doi: 10.1118/1.598165. [DOI] [PubMed] [Google Scholar]
- 21.Lubberts G, Rossmann K. Modulation Transfer Function Associated with Geometrical Unsharpness in Medical Radiography. Phys Med Biol. 1967;12(1):65–77. doi: 10.1088/0031-9155/12/1/307. [DOI] [PubMed] [Google Scholar]
- 22.Doi K, Fromes B, Rossmann K. New device for accurate measurement of the x-ray intensity distribution of x-ray tube focal spots. Med Phys. 1975;2(5):268–273. doi: 10.1118/1.594190. [DOI] [PubMed] [Google Scholar]
- 23.Brezovich IA, Barnes GT. A new type of grid. Med Phys. 1977;4(5):451–453. doi: 10.1118/1.594315. [DOI] [PubMed] [Google Scholar]
- 24.Bednarek DR, Rudin S, Wong R, Kaczmarek R. Effect of a multiple-scanning beam device and trough filter on scatter in chest radiography. Proc SPIE. 1985;555:13–18. [Google Scholar]
- 25.Cooper V, Boone JM, Seibert JA, Pellot-Barakat C. An edge spread technique for measurement of the scatter-to-primary ratio in mammography. Med Phys. 2000;27(5):845–853. doi: 10.1118/1.598950. [DOI] [PubMed] [Google Scholar]
- 26.Dobbins JT, III, Ergun DL, Rutz L, Hinshaw DA, Blume H, Clark DC. DQE (f) of four generations of computed radiography acquisition devices. Med Phys. 1995;22(10):1581–1593. doi: 10.1118/1.597627. [DOI] [PubMed] [Google Scholar]