Abstract
We report on the technology of imaging corrections for a new solid state x-ray image intensifier (SSXII) with enhanced resolution and fluoroscopic imaging capabilities, made of a mosaic of modules (tiled-array) each consisting of CsI(Tl) phosphor coupled using a fiber-optic taper or minifier to an electron multiplier charge coupled device (EMCCD). Generating high quality images using this EMCCD tiled-array system requires the determination and correction of the individual EMCCD sub-images with respect to relative rotations and translations as well as optical distortions due to the fiber optic tapers. The image corrections procedure is based on comparison of resulting (distorted) images with the known square pattern of a wire mesh phantom. The mesh crossing point positions in each sub-image are automatically identified. With the crossing points identified, the mapping between distorted and an undistorted array is determined. For each pixel in a distorted sub-image, the corresponding location in the corrected sub-image is calculated using bilinear interpolation. For the rotation corrections between sub-images, the orientation of the vectors between respective mesh crossing points in the various sub-images are determined and each sub-image is appropriately rotated with the pixel values again determined using bilinear interpolation. Image translation corrections are performed using reference structures at known locations. According to our estimations, the distortion corrections are accurate to within 1%; the rotations are determined to within 0.1 degree, and translation corrections are accurate to well within 1 pixel. This technology will provide the basis for generating single composite images from tiled-image configurations of the SSXII regardless of how many modules are used to form the images.
Keywords: Detector Imaging, Imaging correction algorithms, Digital X-ray imaging, Radiography, Fluoroscopy, Angiography
1. INTRODUCTION
Endovascular image guided intervention is being increasingly relied upon as an essential tool for aiding the diagnosis and treatment of some of the most life threatening diseases that challenge medical professionals and researchers in this age. This increased reliance has placed the medical field in constant anticipation for more enhanced imaging devices with higher image definition capabilities and better overall versatility. Fulfilling the demands for next generation endovascular imaging devices practically means that the industry has to develop detectors capable of providing high spatial resolution, high sensitivity, low noise, wide dynamic range, negligible lag and high frame rates. To date, detectors, even most of the CCD-based designs, have not fulfilled all these requirements.
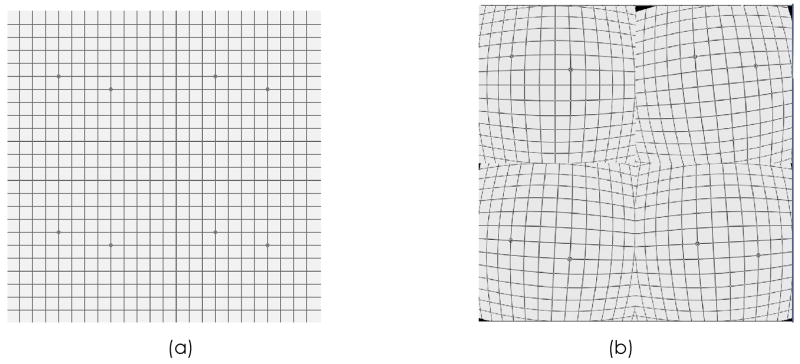
To provide high resolution and fluoroscopic imaging capabilities, we are developing a new detector design made of modules each consisting of CsI(Tl) phosphor coupled using a fiber optic taper (FOT) or minifier to an electron multiplier charge coupled device (EMCCD). The new electron multiplying charge coupled devices (EMCCDs) detectors combine the superior spatial resolution and low noise of a conventional CCD with the internal avalanche-like gain1. The recently developed Flat Panel Detectors (FPD) are currently limited to ~150 μm pixel size and still exhibit limitations in terms of noise levels at fluoroscopic exposures. In contrast, the new EMCCD detector overcomes these issues by having a charge multiplication register on the chip consisting of 400 multiplication elements prior to A/D converter that provides the required system gain (up to 2000×) prior to digitization that is sufficient for even low fluoroscopic exposures. In addition, unlike FDPs, EMCCDs have no lag or ghosting. For FPDs, lack of signal amplification at each pixel combined with the noise associated with pixel readout currently prevents FPD pixel sizes smaller than 150–200 μm. However, the EMCCD’s gain factor which effectively offsets read noise, thereby improving the output signal-to-noise ratio (SNR), allows smaller pixel sizes even under conditions of high frame readout at 30 fps. Unfortunately, at present, EMCCDs come in relatively small chip sizes (1002×1000 pixels, 8-μm pixels for a typical commercially available chip). Thus, to cover large fields of view (FOV), we are designing a system with multiple EMCCD detector modules placed in a two-dimensional mosaic array in a tiled configuration2 (see Figure 1b).
Figure 1.
(a) The original simulated wire mesh image that was used in the simulations (prior to tiling). (b) Image after each of the sub-images artificially distorted, rotated and translated.
As mentioned above, the new detector design is composed of modules, each consisting of CsI(Tl) phosphor coupled using a fiber optic taper (FOT) or minifier to an EMCCD. For this design, to generate high quality images, image distortion somewhat reminiscent of the distortion characteristic of older x-ray image intensifiers must be determined and corrected when attempting to use the individual EMCCD-FOT modules3. The distortion in this case is a barrel distortion due primarily to the FOTs. In addition, because of the tiled configuration, the rotations and translations relating the individual EMCCD modules must be determined and corrected as well. In this study, we report on the techniques for corrections for the individual EMCCD images in the tiled CCD/EMCCD configurations.
2. METHODS
In this study, we developed and evaluated our imaging correction techniques for array of EMCCD devices using simulated images of a wire mesh phantom. Each image was divided up into four sub-images each with different distortions, and both rotations and translations were independently applied to each of these sub-images. This procedure allows a demonstration of imaging corrections for a 2×2 array of devices. The crossing points in the sub-images were determined. The distortion within a sub-image and rotations and translations between images were determined. The methods were evaluated using a number of images and sub-images with various distortions, rotations, and translations within different noise levels in the images.
2.1 Simulated images
Simulated images (1K×1K pixels) were generated of a wire mesh phantom. Figure (1a) shows the original wire mesh image. The wires were separated a distance of 50 pixels. The background was set to be 1000. The contrast of the wires was tiered in pixel value steps of 100 to simulate a round wire. The wire mesh phantom was “placed” having an arbitrary rotation and translation relative to the image coordinate system. To facilitate the translation corrections, spherical markers (contrast = 400) were placed at specific crossing point locations in each sub-image.
To simulate the effects that would be seen with an EMCCD array, the image was divided into four quadrants. We are using a fiber optic taper (FOT) to couple the EMCCD to phosphor (scintillator) which results in a barrel distortion; therefore, we are using a radial distortion function that has only a radial dependence4. The distortion was simulated using a third order polynomial, O(5 pixels at the periphery). Barrel distortions, rotations (O(1 degree)) and translations (O(3pixels)) were applied independently to the image data in each sub-image (see Figure 1b).
For the analysis, the image intensity values are flipped so that objects (wires) in the image have higher pixel values than the background. The non-uniform background in the images is determined using an averaging filter with a mask size of 11×11 and is subtracted from the image.
2.2 Crossing-point array
For each sub-image, the user indicates the crossing point closest to the center of the image, “center point”, along with two other crossing points closest to the center point lying near x and y axis in the image. The vector from the center point to these crossing points is used to generate first guesses for subsequent crossing points. Near each guess, a local search is performed to identify the nearest crossing point. The center of mass of that crossing point is then obtained and its coordinates are stored. As the crossing points are determined, the vectors between neighboring crossing points are calculated. These local vectors are then used to estimate subsequent crossing points (Figure 2).
Figure 2.
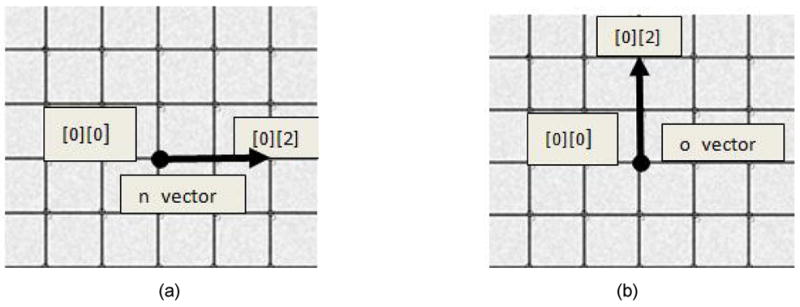
An illustration of the n(l,m,2,0) and o (l,m,0,2) vectors.
| (1) |
| (2) |
This “local vector approach” allows a more restricted search for subsequent crossing points and gives greater accuracy and speed. The “estimate-search-refine” procedure continues outward from the sub-image center point until all crossing points are determined.
| (3) |
| (4) |
This approach yields an array of crossing points positions, xCPA(l, m, n, o) where l, m are the “sub-image” indices (e.g., (0,0) represents first sub-image, (0,1) represents second sub-image, etc.), (n, o) are the indices of the crossing points within a sub-image (n corresponds to “x_axis” (horizontal), and o corresponds to “y_axis” (vertical)). The center point in each sub-image (l, m) corresponds to xCPA(l, m, 0, 0).
2.3 Distortion corrections
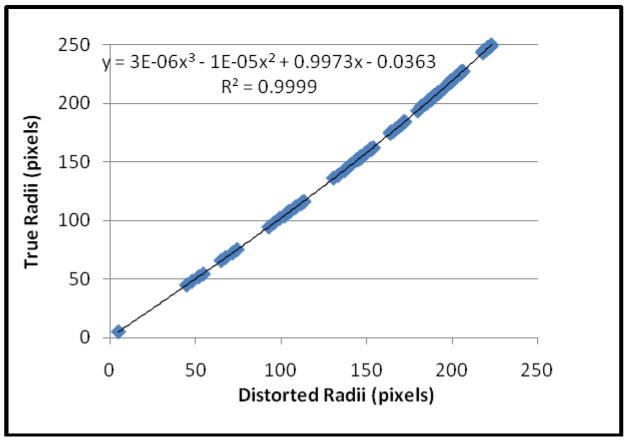
With the crossing points determined, the mapping between the distorted array (xCPA_D(l, m, n, o)) of crossing points and the original undistorted array (xCPA_U(l, m, n, o)) can be determined. We determine the radius of each point in xCPA_D from the center of the image and plot it as a function of the radius of the corresponding point in xCPA_U.
| (5) |
| (6) |
where (xCPA_D)x and (xCPA_D)y are respectively the x and y coordinate of the point with indices (l, m, n, o). xc and yc are respectively the x and y coordinates of the center of the image. The radial distance is calculated as
| (7) |
where rD represents the distorted radius. The radial distance of the undistorted image is obtained by
| (8) |
| (9) |
and
| (10) |
For equations 8 and 9, we have assumed that the central region of the image has negligible distortion. The function relating rD and rU is then determined using a 3rd order polynomial fit expressed by
| (11) |
which is used to generate the corrected CPA data, xCPA_U. Note, one could use the transformation in eq. 11 to determine the locations (x, y) in the undistorted image which correspond to pixel (i, j) in the distorted image. However, (x, y) will in general not have integer values and so an algorithm for distribution of the pixel value has to be used. Instead, we determine the location (x, y) in the distorted image which corresponds to pixels (i, j) in the undistorted image. For each pixel in the undistorted image (i, j), its vector, v(i, j), starting from the center of the image is calculated as follows.
| (12) |
| (13) |
where v(i, j)x and v(i, j)y are the x and y components of the v(i, j). We assume that the center of the image is the center of distortion. The magnitude of v(i, j) is the radius rU of that point from the center of the image. The corresponding point in the distorted image is then determined as
| (14) |
where rD is determined as
| (15) |
Bilinear interpolation is used to calculate the pixel value at xD.
2.4 Rotation corrections
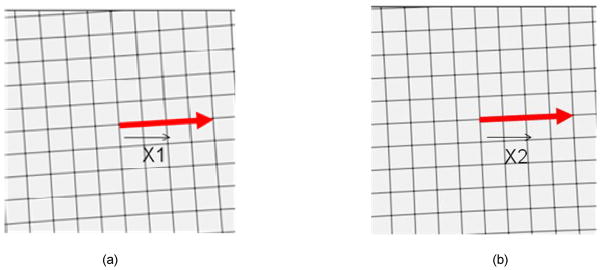
To determine the relative rotations relating the sub-images, we make use of the fact that the wires are straight lines. For each crossing point in each sub-image, we determine the vector between that point and the center point in that image (see Figure 3).
Figure 3.
Illustration of the vectors w in the sub-images. (a) Sub-image (0,0) with the vector w(0,0,4,0) (b) Sub-image (0,1) with the vector w(0,1,4,0).
| (16) |
Note that if the wires are properly aligned, then w(l, m, n, 0) will be parallel to w(0, 0, n, 0). We use the cross product to determine the angle between these sets of vectors (a dot product would have a sign ambiguity).
| (17) |
and sum over all the crossing points in the respective sub-images:
| (18) |
where there are NO crossing points in the summation. The rotation corrected CPA array is obtained as
| (19) |
where R(Θ) is the two-dimensional rotation matrix corresponding to the angle Θ, and vc is the vector corresponding to the center of the image, i.e., vc = (xc, yc). We have assumed that the center of rotation coincides with the center of the image. The image is likewise corrected. For each pixel (i, j) in the rotation-corrected image, the location in the rotated image is determined as
| (20) |
The pixel value at x is determined using bilinear interpolation and is stored in the pixel location (i, j).
2.5 Translation corrections
For the translation corrections, each spherical marker, i, in each sub-image (l, m) is indicated by the user, then the center of mass, xm(l, m, i), of each indicated marker is determined. The vectors relating the various markers are then calculated as
| (21) |
In these simulations, the true marker positions are known, xm_true(l, m, i). The vectors relating the true marker can be expressed as
| (22) |
Differences dm(l, m, i, j) between the vectors vm(l, m, i, j) and vectors true vm_true(l, m, i, j) reflect errors introduced due to relative translations (assuming that the distortion and rotation corrections are accurate). To improve accuracy, we sum over all vectors d(l, m, i, j) within a sub-image to determine the translation relating sub-image (l, m) and sub-image (0,0), i.e.,
| (23) |
where there are IJ marker vectors. The xcpa_UR(l, m, n, o) are then appropriately corrected. The image data are then corrected in a manner similar to that used for the other previously discussed corrections, i.e., pixels (i, j) in the corrected image are selected, the corresponding locations (x, y) are determined in the distortion-corrected, rotation-corrected image, and pixel values are determined using bilinear interpolation.
2.6 Evaluation of Image Corrections
The evaluations of the imaging corrections were performed qualitatively, i.e., through visual inspection, and quantitatively, by repeating the correction analysis on the corrected images. In addition, we added various levels of the noise to the images to observe the effect of noise on the quality of the developed correction procedures.
3. RESULTS
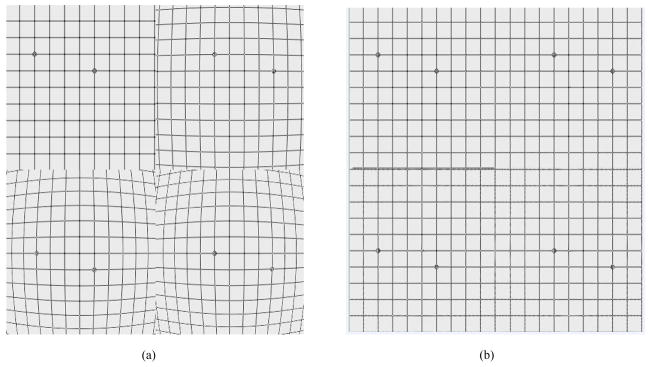
The distortions were determined as described above. We found that the data demonstrated barrel distortions and were fit well by 3rd order polynomials (See Figure 5). In Figure 6, we see that the distortions in the various sub-images (Figure 6a) are corrected (Figure 6b), i.e., the wires appear straight in the corrected sub-images.
Figure 5.
A plot of the true radial distances plotted as a function of the radial distances measured in the image. A third-order polynomial fit to the data gives a very good r2.
Figure 6.
The image (a) before and (b) after distortion corrections in the sub-images.
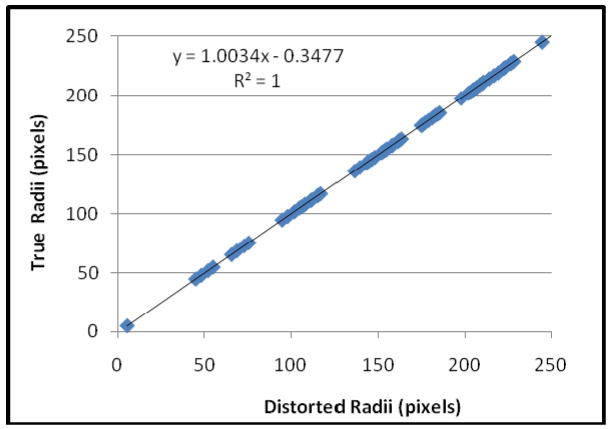
To evaluate the quality of the distortion correction quantitatively, we applied the correction technique twice, i.e., the steps of determination of the crossing points and fitting the radii were performed on the corrected image; any residual distortion in the corrected image would yield a non-linear relationship between the true and the corrected data, whereas a straight line would indicate no distortion. The results of the fits on the corrected images consistently yielded linear fits with r2 greater than 0.99, an example is of the radii data are shown in Figure 7. Application of the distortion correction to noisy images showed results comparable to those seen here, with no apparent dependence on the noise. This is probably due to the large number of crossing points used and the center of mass refinement which should have at best a weak dependence on image noise.
Figure 7.
A plot of the true radii vs the “distorted” radii in the distortion-corrected image. The data demonstrate a linear relationship indicating that the distortion correction has indeed created a distortion-free image.
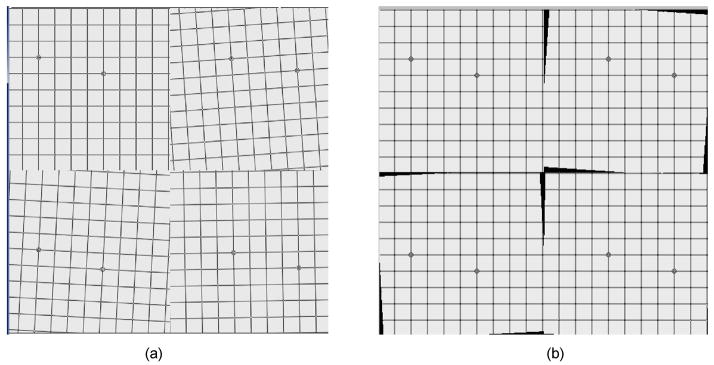
Application of the rotation-correction technique (Figure 8) dramatically improves the continuity of the wires across the sub-image boundaries; the errors in the calculated rotation angles were less than 0.01 degree. The gaps that open up are due to lack of acquired data in those areas due to the rotation. In this simulation, we have assumed that the fiber optic taper output is the same size as the EMCCD. For the actual system, however, the fiber optic taper output will be smaller than the sensitive area of the EMCCD ensuring that all the data is acquired and eliminating the gaps. Application of the rotation corrections to the corrected image yielded calculated rotation angles of less than 0.01 degree even for images with noise levels of 75 (SNR ~ 6).
Figure 8.
Images (a) before and (b) after rotation correction. The wires in the corrected image appear continuous across the sub-image boundaries.
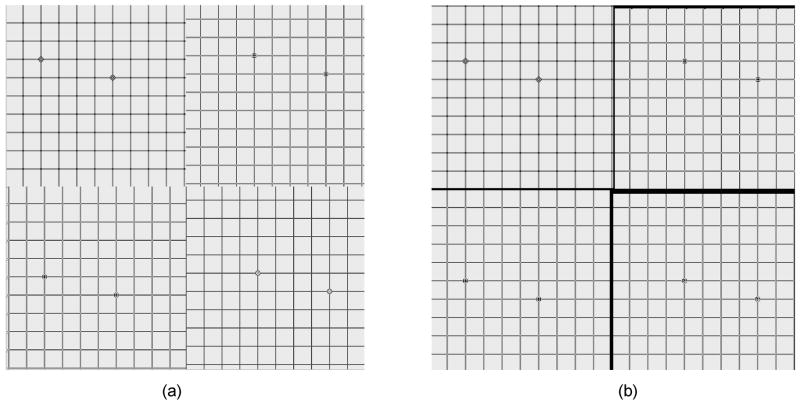
Figure 9 shows the results of the translation-correction procedure. After translation corrections, the wires appear continuous across the boundaries. The error in the calculated translations was below 0.1 pixels, even for noise levels of up to 75 pixel values (SNR ~ 6). Again, the gaps that open up are due to lack of data in those regions of the original images. We expect that careful machining and alignment of the fiber optic tapers and having the fiber optic taper output smaller than the sensitive area of the EMCCD will virtually eliminate any gaps due to translations.
Figure 9.
Images (a) before and (b) after translation corrections. The gaps (black regions) that appear in translation-corrected image correspond to regions outside the original image.
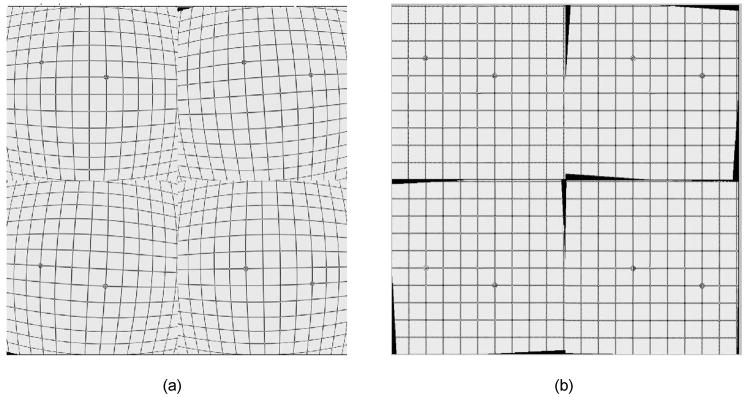
Finally, we present results (Figure 10) of the above correction algorithms after application to a tiled image that consists of four different sub-images which each has its own distorted, rotated, and translated simulation. The distorted-rotated-translated images are analyzed and corrected within a few seconds with a standard PC.
Figure 10.
Image (a) before and (b) after distortion, rotation, and translation correction.
4. CONCLUSIONS
Correction of distortions, relative rotations, and translations is critical for use of tiled arrays of detectors. We have developed a new, simple, and rapid methodology for determining and implementing these corrections. Distortion corrections were found to be accurate to within 1%, rotations are determined to within 0.1 degree, and translation corrections are accurate to well within 1 pixel. This approach will provide the basis for generating single images from tiled-image configurations. As a result, small detector advanced CCD modules (e.g., EMCCD-based) can be used in the new SSXII detector, providing higher resolution and lower instrumentation noise than are currently possible with flat panel detectors.
Figure 4.
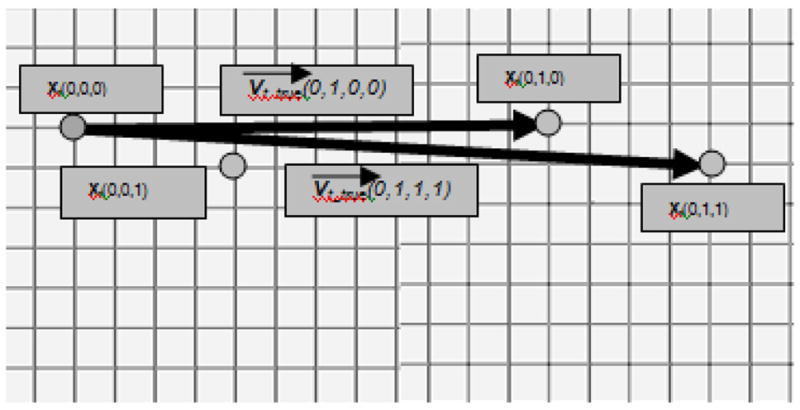
Illustration of the vectors relating the markers in each of sub-images (0,0) and (0,1).
References
- 1.Kuhls Andrew T, Yadava Girijesh, Patel Vikas, Bednarek Daniel R, Rudin Stephen. Progress in electron-multiplying CCD (EMCCD) based, high resolution, high-sensitivity x-ray detector for fluoroscopy and radiography. Proc of SPIE. 2007;6510:1–11. doi: 10.1117/12.713140. [DOI] [PMC free article] [PubMed] [Google Scholar]
- 2.Rudin Stephen, Bednarek Daniel R, Hoffmann Kenneth R. Endovascular image-guided interventions (EIGIs) Medical Phys. 2008;35(1):301–309. doi: 10.1118/1.2821702. [DOI] [PMC free article] [PubMed] [Google Scholar]
- 3.Liu R, Rudin S, Bednarek DR. Super-global model for image intensifier distortion. Med Phys. 1999;26(9):1802–1810. doi: 10.1118/1.598684. [DOI] [PubMed] [Google Scholar]
- 4.Haneishi Hideaki, Yagihashi Yutaka, Miyake Yoichi. A new method for distortion correction of electronic endoscope images. IEEE Transactions on Medical Imaging. 1995;14(3):548–555. doi: 10.1109/42.414620. [DOI] [PubMed] [Google Scholar]


