Oesophageal cancer is the eighth most common cancer in the world, with striking geographical variations in incidence (Parkin, 2001). It accounts for approximately 1 in 40 of all cancers among adults in England and Wales, with an average of some 6000 new cases a year, of which some 60% occur in men (Quinn et al, 2001). Incidence has increased steadily in both sexes since the 1970s. Lifetime risks up to the age of 74 years are currently approximately 1% in men and 0.4% in women (Parkin et al, 2002). Trends in mortality are similar to those for incidence, because survival has been poor for many years. The incidence of adenocarcinoma of the lower third of the oesophagus and the gastric cardia has been increasing for 20 years in England (Powell and McConkey, 1990; Newnham et al, 2003) and in other countries (Bollschweiler et al, 2001). More than 90% of squamous cell carcinomas can be attributed to alcohol and tobacco in Europe and North America, whereas the main risk factor for adenocarcinoma is Barrett's oesophagus. Oesophageal cancer has an extremely poor prognosis: the average 5-year relative survival rate among adults diagnosed in 22 European countries during the early 1990s was approximately 10% (Sant et al, 2003).
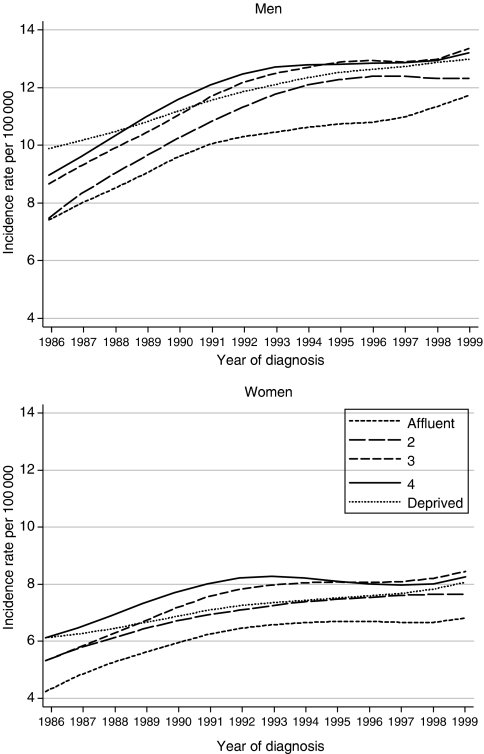
We analysed data for 65 591 patients diagnosed with oesophageal cancer in England and Wales during the period 1986–1999, approximately 84% of those eligible, with follow-up to the end of 2001. Exclusions from analysis were mainly of patients whose recorded survival was zero (10.8%) or whose cancer of the oesophagus was not their first primary malignancy (3.6%). A third (34%) of tumours were squamous carcinomas, but the proportion classified as adenocarcinoma rose from 32 to 44% during the 1990s, continuing a steady increase from 15% in the early 1970s (Coleman et al, 1999). Annual incidence rates increased by about one-third in men and women during the period 1986–1999. Trends were similar for all deprivation groups in both sexes, and incidence was lowest in the most affluent groups throughout (Figure 1).
Figure 1.
Trends in the age-standardised incidence of oesophageal cancer in adults aged 15–99 years, by sex and deprivation group: England and Wales, 1986–1999.
Survival trends
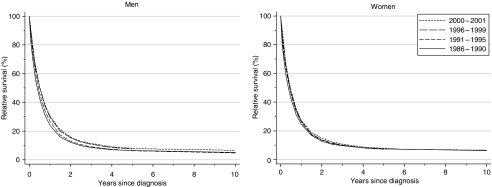
Relative survival at 1 year increased significantly from the late 1980s to the late 1990s in both sexes, from 23.8 to 29.6% in men (fitted, deprivation-adjusted average increase 3.7% every 5 years) and from 24.4 to 26.8% in women (+1.4% every 5 years) (Table 1, Figure 2). Five-year survival increased from 6.3 to 7.6% in men over the same period (average increase +1.7% every 5 years), but there was no change in 5-year survival for women: 7.4% for those diagnosed during 1986–1990 and 7.2% for those diagnosed during 1996–1999. Short-term predictions of survival for patients diagnosed during 2000–2001, using hybrid analysis (Brenner and Rachet, 2004), suggest a small continuing increase in survival at 1, 5 and 10 years after diagnosis (Table 1).
Table 1. Trends in relative survival (%) by sex, time since diagnosis and calendar period of diagnosis: England and Wales, adults (15–99 years) diagnosed during 1986–1999 and followed up to 2001.
|
Calendar period of diagnosisa
|
Average change (%) | Predictionc for patients | |||||||||
|---|---|---|---|---|---|---|---|---|---|---|---|
|
1986–1990
|
1991–1995
|
1996–1999
|
every 5 yearsb
|
diagnosed during 2000–2001
|
|||||||
| Time since diagnosis | Survival (%) | 95% CI | Survival (%) | 95% CI | Survival (%) | 95% CI | Survival (%) | 95% CI | Survival (%) | 95% CI | |
| 1 year | Men | 23.8 | (23.1, 24.6) | 26.7 | (26.0, 27.5) | 29.6 | (28.7, 30.4) | 3.7** | (2.1, 5.3) | 30.6 | (29.4, 31.7) |
| Women | 24.4 | (23.4, 25.4) | 25.9 | (25.0, 26.8) | 26.8 | (25.8, 27.8) | 1.3 | (−0.6, 3.3) | 27.2 | (25.8, 28.6) | |
| 5 years | Men | 6.3 | (5.9, 6.9) | 6.3 | (5.8, 6.7) | 7.6 | (7.0, 8.2) | 1.7** | (0.6, 2.8) | 8.0 | (7.2, 8.7) |
| Women | 7.4 | (6.8, 8.1) | 7.4 | (6.9, 8.0) | 7.2 | (6.5, 8.0) | −0.3 | (−1.7, 1.0) | 7.8 | (6.9, 8.8) | |
| 10 years | Men | 5.1 | (4.6, 5.6) | 4.8 | (4.3, 5.2) | 2.0* | (0.2, 3.7) | 6.5 | (5.7, 7.3) | ||
| Women | 6.2 | (5.6, 6.8) | 6.3 | (5.7, 6.9) | 0.7 | (−1.7, 3.1) | 6.5 | (5.6, 7.5) | |||
CI=confidence interval.
Survival estimated with cohort or complete approach (see Rachet et al, 2008).
Mean absolute change (%) in survival every 5 years, adjusted for deprivation (see Rachet et al, 2008).
Survival estimated with hybrid approach (see Rachet et al, 2008).
*P<0.05; **P<0.01.
Figure 2.
Relative survival (%) up to 10 years after diagnosis by sex and calendar period of diagnosis: England and Wales, adults (15–99 years) diagnosed during 1986–1999 and followed up to 2001. Survival estimated with cohort or complete approach (1986–1990, 1991–1995, 1996–1999) or hybrid approach (2000–2001) (see Rachet et al, 2008).
Deprivation
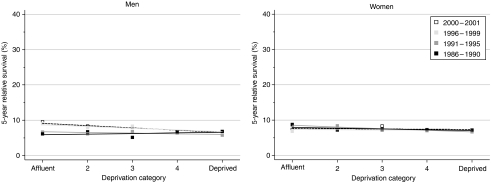
The deprivation gap was more marked in men (Table 2, Figure 3). For 1-year survival, the deprivation gap remained unchanged at approximately −5% (lower for the most deprived group than for the most affluent), but for survival at 5 and 10 years, the deprivation gap widened significantly every 5 years by −1.4% for 5-year survival and by −2.7% for 10-year survival. For women, the deprivation gap in survival was less marked, and did not change significantly over time.
Table 2. Trends in the deprivation gap in relative survival (%) by sex, time since diagnosis and calendar period of diagnosis: England and Wales, adults (15–99 years) diagnosed during 1986–1999 and followed up to 2001.
|
Calendar period of diagnosisa
|
Average change (%) | Predictionc for patients | |||||||||
|---|---|---|---|---|---|---|---|---|---|---|---|
|
1986–1990
|
1991–1995
|
1996–1999
|
every 5 yearsb
|
diagnosed during 2000–2001
|
|||||||
| Time since diagnosis | Deprivation gap (%) | 95% CI | Deprivation gap (%) | 95% CI | Deprivation gap (%) | 95% CI | Deprivation gap (%) | 95% CI | Deprivation gap (%) | 95% CI | |
| 1 year | Men | −3.3** | (−5.6, −1.0) | −5.2** | (−7.3, −3.0) | −4.8** | (−7.2, −2.4) | −0.8 | (−2.6, 0.9) | −5.0** | (−8.4, −1.6) |
| Women | −2.0 | (−4.8, 0.9) | −4.1** | (−6.8, −1.4) | −2.1 | (−5.0, 0.9) | −0.1 | (−2.3, 2.0) | −3.9 | (−8.0, 0.2) | |
| 5 years | Men | 0.7 | (−0.7, 2.1) | −0.8 | (−2.0, 0.5) | −1.9* | (−3.8, −0.1) | −1.4* | (−2.6, −0.1) | −2.6* | (−4.8, −0.4) |
| Women | −0.9 | (−2.8, 1.0) | −1.8* | (−3.5, −0.1) | −0.2 | (−2.4, 2.0) | 0.3 | (−1.2, 1.8) | −0.3 | (−2.9, 2.3) | |
| 10 years | Men | 1.5* | (0.1, 2.9) | −1.2 | (−2.5, 0.2) | −2.7** | (−4.6, −0.7) | −2.3* | (−4.6, 0.0) | ||
| Women | −0.2 | (−2.1, 1.7) | −1.0 | (−2.8, 0.9) | −0.7 | (−3.4, 1.9) | 0.1 | (−2.5, 2.7) | |||
CI=confidence interval.
Survival estimated with cohort or complete approach (see Rachet et al, 2008).
Mean absolute change (%) in the deprivation gap in survival every 5 years, adjusted for the underlying trend in survival (see Rachet et al, 2008).
Survival estimated with hybrid approach (see Rachet et al, 2008).
*P<0.05; **P<0.01.
Figure 3.
Trends in the deprivation gap in 5-year relative survival (%) by sex and calendar period of diagnosis: England and Wales, adults (15–99 years) diagnosed during 1986–1999 and followed up to 2001.
Comment
Survival from oesophageal cancer in England and Wales remains very poor, with 5-year relative survival approximately 7.5%, and no major improvement for patients diagnosed between 1986 and 1999. Five-year survival was already 6–7% for patients diagnosed in 1971–1975 (Coleman et al, 1999). This suggests a lack of substantial progress in diagnostic or therapeutic management over the last 30 years. However, the slight improvement in 1-year survival for both sexes suggests a decrease in postoperative mortality (Faivre et al, 1998). There was a trend towards higher 5-year survival for men, accompanied by a significant increase in the deprivation gap; this was not seen for women. As stage at diagnosis is the main prognostic factor for oesophageal cancer, and incidence trends were similar in all deprivation groups, these trends in 5-year survival may suggest a trend towards earlier stage at diagnosis for men in the more affluent groups, with a higher proportion being referred for potentially curative resection.
References
- Bollschweiler E, Wolfgarten E, Gutschow C, Holscher AH (2001) Demographic variations in the rising incidence of esophageal adenocarcinoma in white males. Cancer 92: 549–555 [DOI] [PubMed] [Google Scholar]
- Brenner H, Rachet B (2004) Hybrid analysis for up-to-date long-term survival rates in cancer registries with delayed recording of incident cases. Eur J Cancer 40: 2494–2501 [DOI] [PubMed] [Google Scholar]
- Coleman MP, Babb P, Damiecki P, Grosclaude PC, Honjo S, Jones J, Knerer G, Pitard A, Quinn MJ, Sloggett A, De Stavola BL (1999) Cancer Survival Trends in England and Wales 1971–1995: Deprivation and NHS Region. Studies on Medical and Population Subjects No. 61. The Stationery Office: London [Google Scholar]
- Faivre J, Forman D, Estève J, Gatta G, EUROCARE Working Group (1998) Survival of patients with oesophageal and gastric cancers in Europe. Eur J Cancer 34: 2167–2175 [DOI] [PubMed] [Google Scholar]
- Newnham A, Quinn MJ, Babb P, Kang YJ, Majeed A (2003) Trends in the subsite and morphology of oesophageal and gastric cancer in England and Wales 1971–1998. Alim Pharmacol Ther 17: 665–676 [DOI] [PubMed] [Google Scholar]
- Parkin DM (2001) Global cancer statistics in the year 2000. Lancet Oncol 2: 533–543 [DOI] [PubMed] [Google Scholar]
- Parkin DM, Whelan SL, Ferlay J, Teppo L, Thomas DB (eds) (2002) Cancer Incidence in Five continents, Volume VIII (IARC Scientific Publications No. 155). International Agency for Research on Cancer: Lyon [Google Scholar]
- Powell J, McConkey CC (1990) Increasing incidence of adenocarcinoma of the gastric cardia and adjacent sites. Br J Cancer 62: 440–443 [DOI] [PMC free article] [PubMed] [Google Scholar]
- Quinn MJ, Babb P, Brock A, Kirby L, Jones J (2001) Cancer Trends in England and Wales 1950–1999. Studies on Medical and Population Subjects No. 66. Office for National Statistics: London [Google Scholar]
- Rachet B, Woods LM, Mitry E, Riga M, Cooper N, Quinn MJ, Steward J, Brenner H, Estève J, Sullivan R, Coleman MP (2008) Cancer survival in England and Wales at the end of the 20th century. Br J Cancer 99(Suppl 1): S2–S10 [DOI] [PMC free article] [PubMed] [Google Scholar]
- Sant M, Aareleid T, Berrino F, Bielska Lasota M, Carli P-M, Faivre J, Grosclaude PC, Hédelin G, Matsuda T, Møller H, Moller T, Verdecchia A, Capocaccia R, Gatta G, Micheli A, Santaquilani M, Roazzi P, Lisi D, EUROCARE Working Group (2003) EUROCARE-3: survival of cancer patients diagnosed 1990–94 – results and commentary. Ann Oncol 14(Suppl 5): 61–118 [DOI] [PubMed] [Google Scholar]


