Breast cancer is the most common cancer in women worldwide (Parkin, 2001). In England and Wales at the end of the 1990s, approximately 36 000 new cases were diagnosed each year, representing 30% of the annual total of 120 000 cases. The number of cases exceeds the combined total for the second and third most common cancers in women, those of the large bowel (14 700 cases, 12%) and lung (12 600 cases, 10%). Breast cancer in men is comparatively uncommon, and is not considered further here.
During the 1970s and 1980s, age-standardised incidence increased on average by approximately 2% each year (Quinn et al, 2001). The NHS breast-screening programme began in 1988, covering women aged 50–64 years and using single mediolateral oblique view mammography and a 3-year interval between screens. During the prolonged prevalence round, overall breast cancer incidence increased by approximately 20%; it subsequently declined, but then rose again, and by the late 1990s, incidence was some 7% higher than at the peak in the early 1990s (Office for National Statistics, 2003). Part of the increase, possibly as much as 20% in post-menopausal women, may have resulted from the increasing use of hormone replacement therapy (HRT) in the 1990s (Beral et al, 1997).
After the exclusion of in situ tumours, we analysed the data for 382 277 women diagnosed with a first, primary, malignant neoplasm of the breast in England and Wales during the 14-year period 1986–1999 and followed up to 31 December 2001, some 89% of those eligible for analysis. Approximately 6.1% of women who were otherwise eligible were excluded with zero recorded survival (date of diagnosis same as date of death): most of these women will have been registered from a death certificate only (DCO), and their duration of survival is unknown, but they could not be reliably distinguished in these data from women with true zero survival. The proportion of women excluded from analysis as DCO records was very similar in all socioeconomic groups. A further 2.4% of women were excluded because it was not their first primary cancer: for one-third of these women, the previous cancer was also a breast cancer, diagnosed before 1986.
Major shifts in the morphological distribution of breast cancers have occurred over the last 30 years. The proportion described as an adenocarcinoma has been falling steadily, from 36% in the early 1970s (Coleman et al, 1999) to 6% in these data by the late 1990s. In the early 1970s, ductal, lobular and medullary tumours comprised less than 10% of all breast cancers, but by the late 1990s this figure had reached 75%, ductal carcinomas alone comprising 60% of all breast cancers. The proportion of tumours with unspecified morphology has continued to fall, from 47% in 1971–1975 to 30% in 1986–1990 and less than 5% in 1996–1999. Even this massive improvement in data quality cannot account for the overall increase in ductal, lobular and medullary tumours.
Survival trends
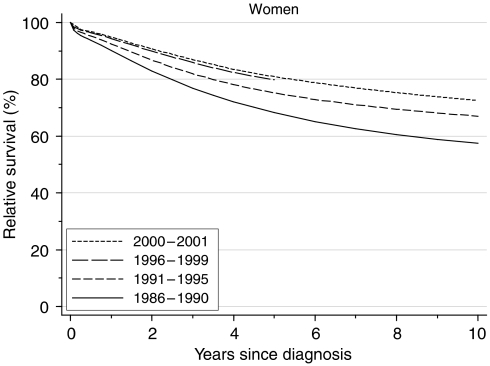
For women diagnosed in the late 1990s, relative survival 1 year after diagnosis had reached 94%, a deprivation-adjusted average increase of 2.0% every 5 years since 1986–1990 (Table 1, Figure 1). Five-year survival had reached 80%, an average increase of 6.2% every 5 years over the same period. Ten-year survival rose even more markedly, by almost 10%, from 58% for women diagnosed during 1986–1990 to 67% for women diagnosed during 1991–1995, just 5 years later.
Table 1. Trends in relative survival (%) by time since diagnosis and calendar period of diagnosis: England and Wales, adults (15–99 years) diagnosed during 1986–1999 and followed up to 2001.
|
Calendar period of diagnosis
a
|
|||||||||||
|---|---|---|---|---|---|---|---|---|---|---|---|
|
1986–1990
|
1991–1995
|
1996–1999
|
Average change (%) every 5 years
b
|
Predictionc
for patients diagnosed during 2000–2001 |
|||||||
| Time since diagnosis | Survival (%) | 95% CI | Survival (%) | 95% CI | Survival (%) | 95% CI | Survival (%) | 95% CI | Survival (%) | 95% CI | |
| 1 year | Women | 90.2 | (90.0, 90.4) | 92.5 | (92.3, 92.6) | 94.4 | (94.2, 94.5) | 2.0** | (1.7, 2.3) | 94.9 | (94.7, 95.1) |
| 5 years | Women | 68.3 | (68.0, 68.6) | 75.2 | (74.9, 75.4) | 79.8 | (79.5, 80.1) | 6.1** | (5.5, 6.7) | 80.9 | (80.5, 81.3) |
| 10 years | Women | 57.5 | (57.1, 57.8) | 67.0 | (66.7, 67.4) | 9.6** | (8.4, 10.9) | 72.5 | (72.1, 73.0) | ||
CI=confidence interval.
Survival estimated with cohort or complete approach (see Rachet et al, 2008).
Mean absolute change (%) in survival every 5 years, adjusted for deprivation (see Rachet et al, 2008).
Survival estimated with hybrid approach (see Rachet et al, 2008).
**P<0.01.
Figure 1.
Relative survival (%) up to 10 years after diagnosis by calendar period of diagnosis: England and Wales, adults (15–99 years) diagnosed during 1986–1999 and followed up to 2001. Survival estimated with cohort or complete approach (1986–1990, 1991–1995, 1996–1999) or hybrid approach (2000–2001) (see Rachet et al, 2008).
This trend is confirmed by hybrid analysis of the survival probabilities observed during 2000–2001 (Brenner and Rachet, 2004), with a predicted 10-year survival of 73% for women diagnosed at about that time.
Deprivation
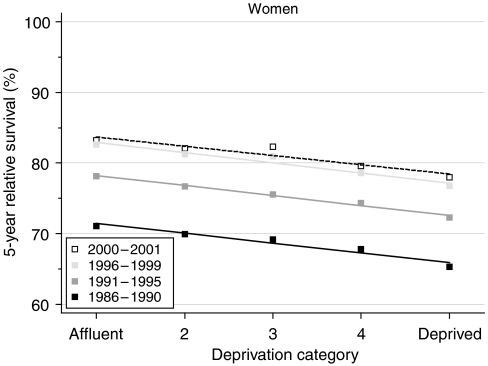
The deprivation gap in 5-year and 10-year survival for women diagnosed during 1986–1990 was close to 6% (Table 2). The gap in 1-year survival was smaller, at approximately 3%. Survival has increased in all groups of the population, but the difference between rich and poor has not changed at all (Figure 2).
Table 2. Trends in the deprivation gap in relative survival (%) by time since diagnosis and calendar period of diagnosis: England and Wales, adults (15–99 years) diagnosed during 1986–1999 and followed up to 2001.
|
Calendar period of diagnosisa
|
|||||||||||
|---|---|---|---|---|---|---|---|---|---|---|---|
|
1986–1990
|
1991–1995
|
1996–1999
|
Average change (%) every 5 yearsb
|
Predictionc for patients diagnosed during 2000–2001
|
|||||||
| Time since diagnosis | Deprivation gap (%) | 95% CI | Deprivation gap (%) | 95% CI | Deprivation gap (%) | 95% CI | Deprivation gap (%) | 95% CI | Deprivation gap (%) | 95% CI | |
| 1 year | Women | −3.1** | (−3.6, −2.5) | −2.9** | (−3.4, −2.5) | −2.6** | (−3.1, −2.2) | 0.2 | (−0.1, 0.6) | −2.7** | (−3.2, −2.1) |
| 5 years | Women | −5.6** | (−6.5, −4.7) | −5.6** | (−6.4, −4.9) | −5.8** | (−6.7, −4.8) | −0.1 | (−0.8, 0.6) | −5.2** | (−6.3, −4.1) |
| 10 years | Women | −5.6** | (−6.6, −4.6) | −5.9** | (−6.9, −4.9) | −0.3 | (−1.7, 1.2) | −6.1** | (−7.5, −4.8) | ||
CI=confidence interval.
Survival estimated with cohort or complete approach (see Rachet et al, 2008).
Mean absolute change (%) in the deprivation gap in survival every 5 years, adjusted for the underlying trend in survival (see Rachet et al, 2008).
Survival estimated with hybrid approach (see Rachet et al, 2008).
**P<0.01.
Figure 2.
Trends in the deprivation gap in 5-year relative survival (%) by calendar period of diagnosis: England and Wales, adults (15–99 years) diagnosed during 1986–1999 and followed up to 2001.
Short-term predictions of survival by socioeconomic group, again using hybrid analysis of the probabilities of survival observed during 2000–2001, do not suggest any imminent change in the significant deprivation gap in survival between affluent and deprived women.
Comment
Breast cancer survival rose rapidly and significantly during the 1990s, and although the difference in survival between affluent and deprived women did not improve, at least it did not widen, in contrast to the widening deprivation gap in survival seen for most other malignancies (Coleman et al, 2004).
The trends in breast cancer survival among women diagnosed up to 1999 extend the continuing increase seen since the 1970s and 1980s, when 1-year survival rose from 84 to 90% and 5-year survival from 54 to 68% (Coleman et al, 1999). Women aged 50–64 years were invited for mammographic screening from 1988, and 5-year survival for women in the age range 50–69 years rose by 7–10% between 1986 and 1993, much more than for either older women (less than 2%) or younger women (less than 4%) (Coleman et al, 2000a, 2000b). By the late 1990s, however, this difference in age-specific trends had vanished (Rachet et al, 2005). Earlier diagnosis following mammography will increase survival time even if death is not delayed by treatment (lead-time bias), but the age-specific survival trends suggest that lead-time bias is unlikely to be the sole explanation for the overall increase in survival.
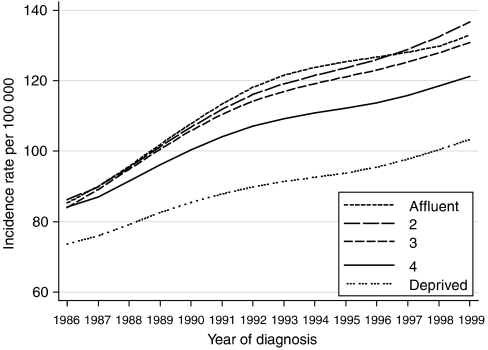
Further analysis of our data shows that the incidence of breast cancer rose more rapidly among affluent women than among deprived women between 1986 and 1999 (Figure 3). If the more marked increase in incidence among affluent women were solely attributable to higher compliance with screening, and if we accept the impact of screening on survival, then the deprivation gap in relative survival would also have been expected to increase, and it did not (Figure 2). The incidence trends may therefore also reflect deprivation-specific trends in risk factors, including reproductive history and the use of HRT.
Figure 3.
Trends in the age-standardised incidence of breast cancer in women aged 15–99 years, by deprivation group: England and Wales, 1986–1999.
Despite the increase in breast cancer incidence during the 1990s, mortality has fallen in all age groups (Quinn et al, 2001). The larger falls in mortality in the screened age groups indicate that by the late 1990s, approximately one-third of the 20% overall reduction in breast cancer mortality was directly attributable to screening, although most of the fall in mortality was attributable to a combination of earlier diagnosis outside the screening programme, increasingly widespread use of tamoxifen since the 1980s and other, more recent improvements in chemotherapy, and more indirect effects of the screening programme, such as improvement in the organisation and delivery of services to symptomatically detected cases as well as screen-detected cases (Blanks et al, 2000).
We have recently predicted that long-term survival up to 20 years after diagnosis is likely to continue improving. The largest predicted increase also affects women aged 50–69 years at diagnosis (Woods et al, 2007).
For more than 30 years, breast cancer survival in England and Wales has been consistently lower in women from deprived areas, even after adjustment for higher background mortality in the more deprived areas. In the 1970s and early 1980s, the deprivation gap in 5-year survival was approximately 10%. The gap fell to 6% for women diagnosed during 1986–1990, but it has not changed any further since that time. This is remarkable because, for most cancers for which 5-year survival has improved as rapidly as it has done for breast cancer (approximately 6% every 5 years), the deprivation gap in survival has also widened considerably (Coleman et al, 2004). The deprivation gap in relative survival is adjusted for the wide socioeconomic differences in background mortality, and for changes over time in those differentials. Differences in crude survival (unadjusted for background mortality; data not shown) are actually wider than those for relative survival. The lack of improvement in the deprivation gap in relative survival is therefore not an artefact of failure to adjust for changes in background mortality among women with breast cancer.
References
- Beral V, Banks E, Reeves GK, Wallis M (1997) Hormone replacement therapy and high incidence of breast cancer between mammographic screens. Lancet 349: 1103–1104 [DOI] [PubMed] [Google Scholar]
- Blanks RG, Moss SM, McGahan CE, Quinn MJ, Babb P (2000) Effect of NHS Breast Screening Programme on mortality from breast cancer in England and Wales, 1990–1998: comparison of observed with predicted mortality. Br Med J 321: 665–669 [DOI] [PMC free article] [PubMed] [Google Scholar]
- Brenner H, Rachet B (2004) Hybrid analysis for up-to-date long-term survival rates in cancer registries with delayed recording of incident cases. Eur J Cancer 40: 2494–2501 [DOI] [PubMed] [Google Scholar]
- Coleman MP, Babb P, Damiecki P, Grosclaude PC, Honjo S, Jones J, Knerer G, Pitard A, Quinn MJ, Sloggett A, De Stavola BL (1999) Cancer Survival Trends in England and Wales 1971–1995: Deprivation and NHS Region. Studies on Medical and Population Subjects No. 61. The Stationery Office: London [Google Scholar]
- Coleman MP, Babb P, Harris S, Quinn MJ, Sloggett A, De Stavola BL (2000a) Cancer survival in England and Wales, 1991–1998. Health Stat Q 6: 71–80 [Google Scholar]
- Coleman MP, Babb P, Stockton DL, Møller H, Forman D (2000b) Breast cancer incidence, survival and mortality trends in England and Wales [Erratum in Lancet 2000; 356: 774]. Lancet 356: 590–59110950250 [Google Scholar]
- Coleman MP, Rachet B, Woods LM, Mitry E, Riga M, Cooper N, Quinn MJ, Brenner H, Estève J (2004) Trends and socio-economic inequalities in cancer survival in England and Wales up to 2001. Br J Cancer 90: 1367–1373 [DOI] [PMC free article] [PubMed] [Google Scholar]
- Office for National Statistics (2003) Cancer statistics: registrations of cancer diagnosed in 2000, England. Series MB1 no. 31. The Stationery Office: London [Google Scholar]
- Parkin DM (2001) Global cancer statistics in the year 2000. Lancet Oncol 2: 533–543 [DOI] [PubMed] [Google Scholar]
- Quinn MJ, Babb P, Brock A, Kirby L, Jones J (2001) Cancer Trends in England and Wales 1950–1999. Studies on Medical and Population Subjects No. 66. Office for National Statistics: London [Google Scholar]
- Rachet B, Coleman MP, Cooper N, Quinn MJ (2005) Cancer survival: England and Wales, 1991–2001, twenty major cancers by age group. Office for National Statistics. http://www.statistics.gov.uk/statbase/ssdataset.asp?vlnk=7899
- Rachet B, Woods LM, Mitry E, Riga M, Cooper N, Quinn MJ, Steward J, Brenner H, Estève J, Sullivan R, Coleman MP (2008) Cancer survival in England and Wales at the end of the 20th century. Br J Cancer 99(Suppl 1): S2–S10 [DOI] [PMC free article] [PubMed] [Google Scholar]
- Woods LM, Rachet B, Cooper N, Coleman MP (2007) Predicted trends in long-term breast cancer survival in England and Wales. Br J Cancer 96: 1135–1138 [DOI] [PMC free article] [PubMed] [Google Scholar]


