Abstract
Insulin can regulate the abundance and organization of filamentous actin within cells in culture. Early studies using cell lines that overexpress the insulin receptor demonstrated that insulin caused a rapid reversible disassembly of actin filaments that coincided with the rapid tyrosine dephosphorylation of focal adhesion kinase. We have extended these studies by demonstrating that paxillin, another focal adhesion protein, and Src undergo tyrosine dephosphorylation in response to insulin in Chinese hamster ovary (CHO) and rat hepatoma (HTC) cells that overexpress the insulin receptor. This contrasted with the effect of insulin in parental CHO and HTC cells in which focal adhesion proteins were not dephosphorylated in response to the hormone. In addition, insulin caused a dispersion of focal adhesion proteins and disruption of actin filament bundles only in cells that overexpressed the insulin receptor. Moreover, in 3T3-L1 adipocytes, which are considered prototypic insulin-responsive cells, actin filament assembly was stimulated, and focal adhesion protein tyrosine phosphorylation was not altered. 3T3-L1 cells have more insulin receptors than either parental CHO or HTC cells but have fivefold less insulin receptors than the overexpressing cell lines. We hypothesize that a threshold may exist in which the overexpression of insulin receptors determines how insulin signaling pathways regulate the actin cytoskeleton.
INTRODUCTION
Insulin activates the tyrosine kinase activity of the insulin receptor, leading to rapid tyrosine phosphorylation of insulin receptor substrates (IRSs) 1–3 and the protein Shc (Pronk et al., 1993; Cheatham and Kahn, 1995; Lavan et al., 1997; White, 1997). Many of the phosphorylated tyrosine residues on IRS proteins engage the Src homology 2 (SH2) domains of signaling molecules (White and Kahn, 1994; White, 1997). These signals ultimately lead to the control of glucose and fat metabolism, protein synthesis, and cell division and differentiation. In addition to these responses, insulin also elicits changes in the cytoskeleton, as visualized in diverse cells in culture. These changes are generally manifested as membrane ruffles resulting from actin filament rearrangements (Ridley and Hall, 1992; Tsakiridis et al., 1994; Nobes et al., 1995; Berfield et al., 1996). Insulin-regulated effects on the cytoskeleton may play important roles in cellular functions such as chemotaxis, vesicle secretion, and endocytosis (Trifaro and Vitale, 1993; Downey, 1994; Vitale et al., 1995; Molitoris, 1997). The underside of the cell surface is associated with the cytoskeleton at focal adhesions, dynamic regions of the cell where the actin cytoskeleton terminates in bundles at the plasma membrane and where signals from the extracellular matrix are translated into intracellular signals (Burridge et al., 1988; Hitt and Luna, 1994; Clark and Brugge, 1995). Several proteins present in focal adhesion contacts, such as focal adhesion kinase (FAK) and paxillin, have been shown to undergo rapid tyrosine phosphorylation in response to a diverse array of extracellular signals such as mitogenic neuropeptides, growth factors, and extracellular matrix proteins (Brown and Cooper, 1996; Otey, 1996), and these phosphorylations are accompanied by profound alterations in the organization of the actin cytoskeleton and the enhanced assembly of focal adhesion points. FAK tyrosine autophosphorylation regulates its association with the tyrosine kinases Src and Fyn (Schaller et al., 1994; Eide et al., 1995; Schlaepfer and Hunter, 1997). Together, the activities of Src and FAK are required for the tyrosine phosphorylation of other focal adhesion proteins such as paxillin, and this may be important for the assembly of additional proteins to the adhesion sites through phosphotyrosine–SH2 domain interaction (Parsons, 1996; Burridge et al., 1997).
Activation of the platelet-derived growth factor (PDGF) receptor tyrosine kinase induces tyrosine phosphorylation of FAK and paxillin and actin stress fiber assembly (Rankin and Rozengurt, 1994). However, this applies only for lower concentrations of PDGF, whereas higher concentrations of PDGF stimulate disassembly of actin filaments and dephosphorylation of the focal adhesion proteins FAK and paxillin (Rankin and Rozengurt, 1994). Recent studies have shown that insulin induces dephosphorylation of these adhesion proteins and reduces actin filament content in Chinese hamster ovary (CHO) cells overexpressing the insulin receptor (Knight et al., 1995; Pillay et al., 1995). However, in 3T3-L1 adipocytes, widely used to study insulin responses, insulin increases the content of actin filaments, causing membrane ruffles (Martin et al., 1996; Vollenweider et al., 1997; Wang et al., 1998). These differences prompted us to analyze whether the number of insulin receptors expressed within a defined cell can determine the type of response of the cytoskeleton to insulin, in analogy to the biphasic response to PDGF concentrations. We have therefore compared the action of insulin on the actin cytoskeleton and focal adhesion proteins in parental and insulin receptor–overexpressing CHO cells and rat hepatoma (HTC) cells. A marked difference in the insulin regulation of the actin cytoskeleton and focal adhesion proteins was observed in conjunction with insulin receptor overexpression.
MATERIALS AND METHODS
Materials
α-MEM, FBS, and other tissue culture reagents were purchased from Life Technologies (Burlington, Ontario, Canada). Human insulin was obtained from Eli Lilly Canada (Toronto, Ontario, Canada). Polyclonal antibodies to FAK, IRS-1, and monoclonal anti-phosphotyrosine anti-PY antibody conjugated to agarose beads were purchased from Upstate Biotechnology (Lake Placid, NY). Rabbit polyclonal antibody to c-Src was purchased from Santa Cruz Biotechnology (Santa Cruz, CA). Monoclonal antibodies to vinculin and paxillin were purchased from Chemicon (Temecula, CA) and Zymed (San Francisco, CA), respectively. Rhodamine-labeled phalloidin was purchased from Molecular Probes (Eugene, OR). All electrophoresis and immunoblotting reagents were obtained from Bio-Rad (Mississauga, Ontario, Canada). Cytochalasin D, paraformaldehyde, polyacrylamide, and all other reagents were obtained from Sigma (Oakville, Ontario, Canada).
Cell Culture
3T3-L1 fibroblasts were grown and differentiated into 3T3-L1 adipocytes as previously described (Volchuk et al., 1995). CHO and HTC cells overexpressing the human insulin receptor (CHO-IR and HTC-IR) were the kind gift of Dr. Cecil Yip (University of Toronto, Toronto, Ontario, Canada). These cells as well as the parental, wild-type lines (CHO-WT and HTC-WT) were maintained in α-MEM supplemented with 10% FBS in a humidified atmosphere containing 5% CO2 and 95% air at 37°C. Cells used for immunoprecipitation experiments were grown in 10-cm2 dishes, and those used for immunocytochemistry were grown on glass coverslips. The cells were cultured in serum-free medium for 3 h before the addition of insulin.
Immunoprecipitation
Confluent cultures of cells were treated with insulin (100 nM) for the times indicated and then lysed at 4°C in lysis buffer containing 10 mM Tris-HCl (pH 7.6), 5 mM EDTA, 50 mM NaCl, 30 mM sodium pyrophosphate, 50 mM NaF, 1 mM Na3VO4, 1 mM phenylmethylsulfonyl fluoride, and 1% Triton X-100. The lysates were clarified by centrifugation at 10,000 × g for 10 min, and proteins were immunoprecipitated for 2 h at 4°C with anti-PY antibody covalently coupled to agarose, anti-FAK, or anti-paxillin antibodies, as indicated. FAK or paxillin immunocomplexes were brought down with protein A-Sepharose and protein G-Sepharose beads (30 μl of a 1:1 slurry in PBS) for 1 h at 4°C, respectively. Immunoprecipitates were washed three times with lysis buffer and extracted in SDS-PAGE sample buffer (200 mM Tris-HCl, 6% SDS, 2 mM EDTA, 4% 2-mercaptoethanol, and 10% glycerol, pH 6.8) and boiled for 5 min.
Immunoblotting
After SDS-PAGE on 8% polyacrylamide gels, the proteins were transferred to polyvinylidene difluoride membranes. Membranes were blocked using Tris-buffered saline (TBS; 3% BSA in 50 mM Tris-HCl and 100 mM NaCl, pH 7.6) and incubated overnight with either anti-PY antibody (1:1000), anti-FAK (1:1000), or anti-paxillin (1:1000) and anti-Src (1:500), as indicated, in TBS containing 0.05% Tween 20 and 1% BSA. Washes were performed with TBS plus 0.05% Tween 20. Immunoreactive bands were visualized using either HRP-conjugated sheep anti-mouse IgG for monoclonal antibodies or HRP-conjugated goat anti-rabbit IgG for polyclonal antibodies and enhanced chemiluminescence (ECL). Images were quantitated by scanning densitometry.
Immunofluorescence Microscopy
Confluent cell cultures were incubated with insulin at 37°C for the time indicated. To stain filamentous actin, cells were washed once with PBS, fixed in 4% paraformaldehyde in PBS for 20 min at room temperature, and then permeabilized with PBS containing 0.2% Triton X-100 for 20 min. Cells were incubated with 5% goat serum in PBS for 20 min and then with rhodamine-conjugated phalloidin (4 U/ml) in PBS for 30 min. The same fixation and permeabilization procedure was used with anti-FAK (1:500), anti-paxillin (1:500), anti-Src (1:500), anti-vinculin (1:200), or anti-PY (1:1000). Goat anti-rabbit and goat anti-mouse secondary antibodies conjugated to fluorescein isothiocyanate were used as directed by the supplier (Jackson ImmunoResearch Laboratories, West Grove, PA). Samples were viewed by fluorescence microscopy using an inverted Leica (Northvale, NJ) DM IRB microscope.
RESULTS
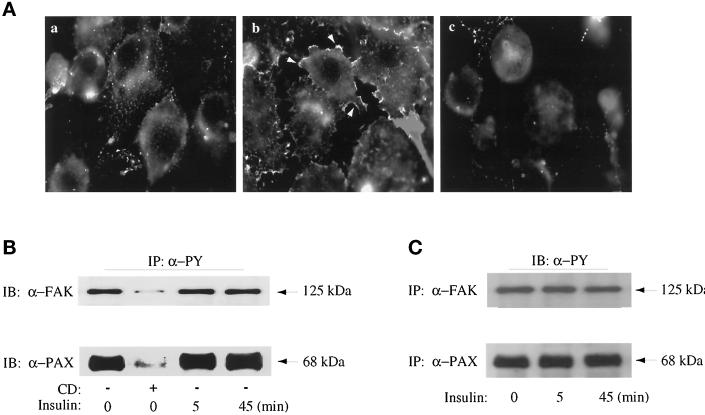
Filamentous actin was labeled with rhodamine-phalloidin in 3T3-L1 adipocytes and visualized by fluorescence microscopy. Actin filaments were detected in the periphery of unstimulated cells (Figure 1A, left). Insulin treatment for 5 min significantly increased the presence of actin bundles at the cell periphery (Figure 1A, middle). Treatment of adipocytes with 2 μM cytochalasin D for 3 h had profound effects on the rearrangement of actin structures, often causing the actin fibers to appear as punctate bundles throughout the cell (Figure 1A, right). Thus, insulin caused actin filament assembly in 3T3-L1 adipocytes, confirming earlier reports (Martin et al., 1996; Vollenweider et al., 1997; Wang et al., 1998).
Figure 1.
Effect of insulin and cytochalasin D on the actin cytoskeleton and tyrosine phosphorylation of FAK and paxillin in 3T3-L1 adipocytes. (A) 3T3-L1 adipocytes were grown and differentiated on glass coverslips. The cells were serum deprived for 3 h with no other additions (a), with insulin treatment for the last 5 min (b), or with treatment with 2 μM cytochalasin D during the entire 3 h (c). All cells were fixed and detergent permeabilized, and the actin filaments were stained with rhodamine-conjugated phalloidin, as indicated in MATERIALS AND METHODS. (B) 3T3-L1 adipocytes grown in 10-cm dishes were serum deprived for 3 h in the absence (−) or presence (+) of cytochalasin D. Insulin treatments (100 nM) were for the times indicated and were timed so that their total serum deprivation time ended at 3 h. Cell lysates were prepared and immunoprecipitated with anti-PY conjugated to agarose beads (IP, α-PY), as indicated in MATERIALS AND METHODS. Samples were immunoblotted (IB) anti-FAK (α-FAK) and anti-paxillin (α-PAX) as indicated. (C) 3T3-L1 adipocytes were treated with insulin (100 nM) for the times indicated. Cell lysates were prepared and immunoprecipitated with α-FAK or α-PAX antibodies as described in MATERIALS AND METHODS and then immunoblotted with α-PY as indicated. Shown is one experiment representative of two.
We next analyzed the effects of insulin on the focal adhesion proteins FAK and paxillin, because their state of tyrosine phosphorylation is often linked to changes in cytoskeleton-dependent changes in cell morphology (Burridge et al., 1997). FAK and paxillin were found to be phosphorylated on tyrosine residues in unstimulated 3T3-L1 adipocytes. Insulin stimulation of adipocytes for 5 or 45 min did not significantly alter the tyrosine phosphorylation of these proteins. This was concluded from the levels of immunodetected FAK or paxillin in immunoprecipitates of phosphotyrosine-containing proteins (Figure 1B) as well as from the levels of immunodetected phosphotyrosine-containing proteins in immunoprecipitates of FAK or paxillin (Figure 1C). Disassembly of actin filaments as a result of cytochalasin D treatment coincided with near elimination of the tyrosine phosphorylation of the two proteins (Figure 1B, second lanes). The net levels of either FAK (Figure 1B) or paxillin (our unpublished results) proteins were not affected by this cytochalasin D treatment. Thus, enhanced actin filament assembly in 3T3-L1 adipocytes had no effect on the tyrosine phosphorylation status of focal adhesion proteins. Intriguingly, these observations were basically opposite to those made for the action of insulin in CHO cells overexpressing the insulin receptor (CHO-IR) (Knight et al., 1995; Pillay et al., 1995).
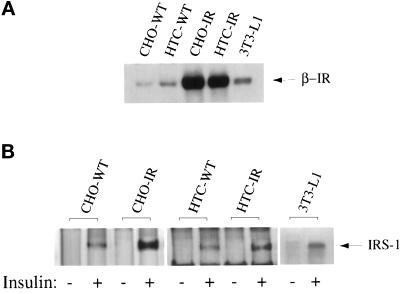
The amount of immunoreactive insulin receptors was compared in total membrane preparations from 3T3-L1 adipocytes and those from the other cell types used in this study, using an antibody directed against the β-subunit of the insulin receptor. Figure 2A illustrates that the insulin receptor–overexpressing cell lines have considerably higher insulin receptor levels than their parental cell counterparts or the 3T3-L1 adipocytes. Quantitation of two separate experiments indicated that the insulin receptor per milligram of membrane protein in the insulin receptor-overexpressing HTC-IR and CHO-IR cell lines was ∼10- or 20-fold greater than the levels in the parental cells, respectively, and fivefold greater compared with the 3T3-L1 adipocytes (Table 1).
Figure 2.
Insulin receptor levels and insulin-stimulated IRS tyrosine phosphorylation in each of the cell lines. (A) Confluent cultures of CHO-WT, CHO-IR, HTC-WT, HTC-IR, and 3T3-L1 cells were serum deprived for 3 h and treated without or with 100 nM insulin (as indicated) for 5 min before preparation of total membranes, as outlined in MATERIALS AND METHODS. Equal amounts of total membrane protein were analyzed by immunoblotting with an anti-β-subunit insulin receptor antibody. Shown is one experiment representative of three. (B) Confluent cultures of CHO-WT, CHO-IR, HTC-WT, HTC-IR, and 3T3-L1 cells were serum deprived for 3 h and treated without or with 100 nM insulin (as indicated) for 5 min before preparation of whole cell lysates, as outlined in MATERIALS AND METHODS. Equal amounts of protein from untreated and insulin-stimulated lysates were immunoprecipitated with anti-PY and analyzed by immunoblotting with anti-PY antibody. The bands at a molecular weight of 185,000 represented the tyrosine phosphorylation of the IRS proteins.
Table 1.
Levels of insulin receptor and tyrosine-phosphorylated IRS-1 in each cell line
| Cell type | IR (relative units) | PY IRS-1 (insulin/control) |
|---|---|---|
| 3T3-L1 adipocytes | 1.0a | 3.1 ± 0.50b |
| CHO-WT | 0.33 ± 0.02 | 2.2 ± 0.01 |
| CHO-IR | 5.6 ± 0.15 | 8.7 ± 0.73 |
| HTC-WT | 0.45 ± 0.06 | 2.4 ± 0.23 |
| HTC-IR | 5.0 ± 0.26 | 7.3 ± 0.84 |
Confluent cultures were serum deprived for 3 h and stimulated with 100 nM insulin for 5 min. Cell lysates were prepared and either directly analyzed by SDS-PAGE and immunoblotting of the β-subunit of the insulin receptor (IR) or immunoprecipitated with anti-PY antibody (α-PY) and immunoblotted anti-PY antibody (α-PY) as outlined in MATERIALS AND METHODS. The insulin receptor β-subunit (95 kDa) band and the IRS-1 protein band (180 kDa) were prominently detected. Results were quantitated using scanning densitometry and are the average of two (insulin receptor) or three (anti-phosphotyrosine) independent experiments.
Data are presented relative to the insulin receptor level in the 3T3-L1 adipocytes, which was ascribed a value of 1.0.
Data are presented as the ratio of the tyrosine-phosphorylated IRS-1 protein band detected in insulin-stimulated cells compared with untreated cells.
As an indicator of how insulin receptor number may influence insulin action, we determined the degree to which insulin could stimulate IRS-1 tyrosine phosphorylation in response to an acute exposure to insulin (5 min, 100 nM insulin) in each cell type. The parental CHO-WT and HTC-WT cells showed a modest (twofold) elevation of tyrosine-phosphorylated levels of IRS-1 (Figure 2B and Table 1), whereas the insulin receptor-overexpressing cells, as predicted from the number of insulin receptors, had significantly higher insulin-stimulated elevations (of approximately seven- to ninefold) in IRS-1 tyrosine phosphorylation. In 3T3-L1 cells, insulin stimulated IRS-1 tyrosine phosphorylation by approximately threefold (Figure 2B and Table 1). These data suggested that a difference in insulin receptor number and an increased insulin signaling potential may reconcile the differences between cells that overexpress the insulin receptor (Knight et al., 1995; Pillay et al., 1995) and 3T3-L1 adipocytes.
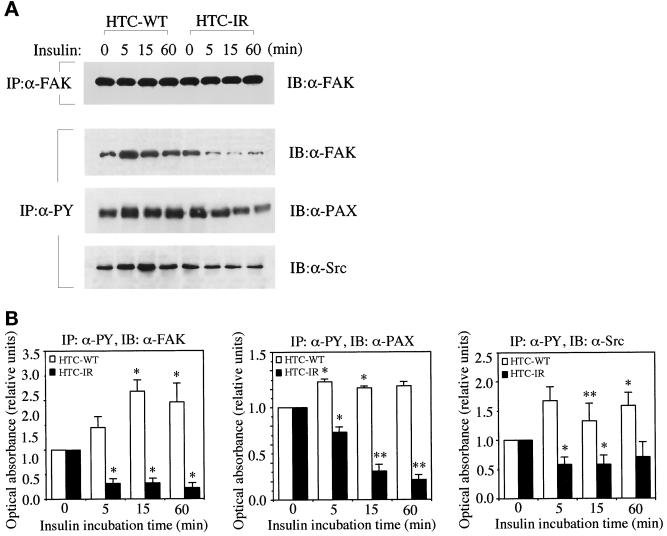
We then measured the effects of insulin on the actin cytoskeleton and tyrosine phosphorylation of focal adhesion proteins. Consistent with the published studies (Knight et al., 1995; Pillay et al., 1995), we observed that insulin stimulation initiated a time-dependent decrease in the amount of tyrosine-phosphorylated FAK and paxillin that could be immunoprecipitated by anti-PY antibodies in CHO-IR cells (Figure 3A). In addition, the level of tyrosine-phosphorylated Src was also diminished in CHO-IR cells during the course of insulin treatment (Figure 3A). Insulin stimulation did not alter the total protein levels of FAK immunoprecipitated from CHO-IR (Figure 3A) or the levels of paxillin and Src (our unpublished results), so degradation of proteins could not explain the decreased levels of tyrosine-phosphorylated focal adhesion proteins in CHO-IR cells. In contrast, the parental CHO-WT cells responded to insulin in an opposite manner. Tyrosine phosphorylation of FAK and paxillin showed a tendency to rise at 5 and 15 min after exposure to insulin (Figure 3A). Several experiments were quantitated, and the results are shown in Figure 3B. Complementary experiments were performed by immunoprecipitating with anti-FAK, anti-paxillin or anti-Src antibodies, followed by immunoblotting with anti-PY antibodies. A representative gel of these results is illustrated in Figure 3C, and the scanned values are given in the figure legend. The pattern of immunoblotting was almost identical to that obtained by immunoprecipitating with anti-PY antibodies and blotting with anti-FAK, anti-paxillin, or anti-Src antibodies. These results suggest that it is indeed the phosphorylation of these proteins that is being assessed, rather than their association with tyrosine-phosphorylated proteins. In both cases, the results strongly reveal that tyrosine dephosphorylation of FAK and paxillin in response to insulin occurs only in CHO-IR cells and not in CHO-WT cells.
Figure 3.
Effect of insulin on tyrosine phosphorylation of FAK, paxillin, and Src in CHO cells. (A) Confluent CHO-WT and CHO-IR cells were serum starved for 3 h and treated without or with insulin (100 nM) for times indicated to coincide with a total serum starvation time of 3 h. Cell lysates were prepared and immunoprecipitated (IP) with anti-FAK (α-FAK) and immunoblotted (IB) with α-FAK. Alternatively, cell lysates were immunoprecipitated with anti-PY antibody (α-PY) and immunoblotted with anti-FAK (α-FAK), anti-paxillin (α-PAX), or anti-Src (α-Src), as outlined in MATERIALS AND METHODS. Shown is one experiment representative of four. (B) The ECL-developed films were quantitated by scanning densitometry, and the optical absorbance was plotted in arbitrary units relative to untreated samples, which were ascribed a value of 1.0. (C) Cell lysates were immunoprecipitated with α-FAK, α-PAX, or α-Src and immunoblotted with α-PY, as outlined in MATERIALS AND METHODS. Shown is one experiment representative of two. In this experiment, the densitometric readings of the bands, in arbitrary units relative to unstimulated cells, were as follows: FAK IP: 1.0, 1.7, 1.4, 2.0 for CHO-WT cells and 1.0, 0.8, 0.09, 0.3 for CHO-IR cells; paxillin IP: 1.0, 1.2, 1.6, 1.5 for CHO-WT cells and 1.0, 0.7, 0.09, 0.6 for CHO-IR cells.
To further examine the effect of receptor overexpression, we performed similar experiments in HTC-WT and HTC-IR cells. As in the CHO-IR cells, insulin induced the time-dependent decrease in the tyrosine phosphorylation of FAK, paxillin, and Src in HTC-IR cells (Figure 4, A and B). In contrast, the hormone produced detectable increases in the tyrosine phosphorylation status of these proteins in the HTC-WT cells (Figure 4, A and B).
Figure 4.
Effect of insulin on tyrosine phosphorylation of FAK, paxillin, and Src in HTC cells. (A) Confluent HTC-WT and HTC-IR cells were serum starved for 3 h and treated without or with insulin (100 nM) for times indicated to coincide with a total serum starvation time of 3 h. Cell lysates were prepared and immunoprecipitated (IP) with anti-FAK (α-FAK) and immunoblotted (IB) with α-FAK. Alternatively, cell lysates were immunoprecipitated with anti-PY antibody (α-PY) and immunoblotted with anti-FAK (α-FAK), anti-paxillin (α-PAX), or anti-Src (α-Src), as outlined in MATERIALS AND METHODS. (B) The ECL-developed films were quantitated by scanning densitometry, and the optical absorbance is reported relative to that in untreated samples. Shown is one experiment representative of three.
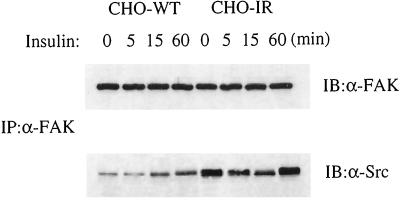
Differences between the parental cells and those overexpressing the insulin receptor were also manifest in the association of FAK with Src after insulin stimulation. During the first 15 min of insulin stimulation, the association of Src with FAK increased in the CHO-WT cells but decreased in the CHO-IR cells (Figure 5). Sixty minutes after insulin addition, the association between the two proteins was elevated in both cell types.
Figure 5.
Effect of insulin on association of FAK and Src in CHO cells. Cell lysates prepared from CHO-WT and CHO-IR cells as described in Figure 3A were immunoprecipitated (IP) with anti-FAK (α-FAK) and immunoblotted (IB) with anti-FAK (α-FAK) or anti-Src (α-Src), as indicated. Shown is one experiment representative of three.
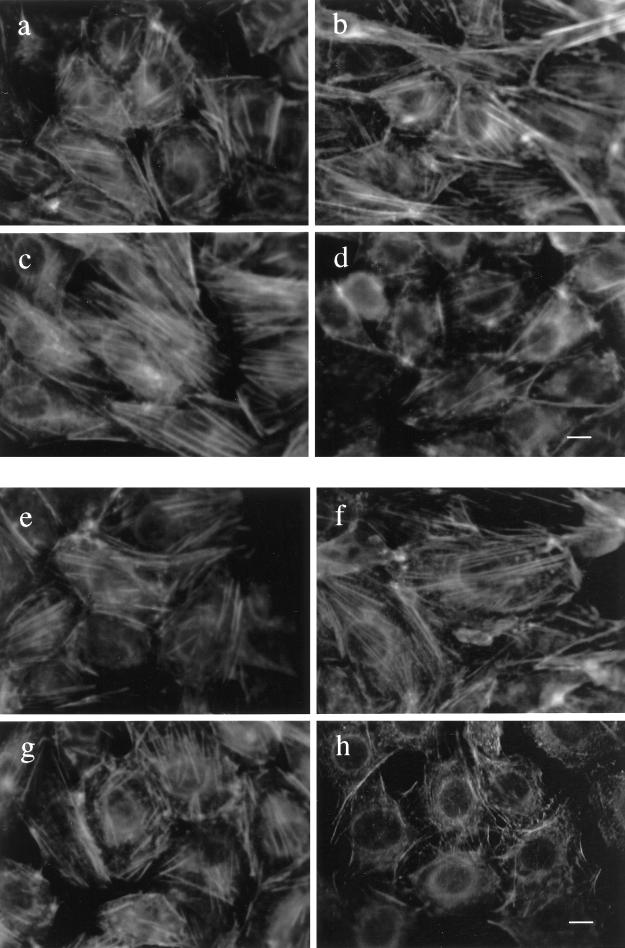
In addition to the differential effects of insulin on tyrosine phosphorylation of IRS-1 and focal adhesion proteins in cells overexpressing the insulin receptor relative to wild-type cells, differences were evident in actin filament assembly and in the subcellular distribution of focal adhesion proteins. At least 100 cells were evaluated, and the results shown are of representative fields for each cell population. In unstimulated cells, actin filaments were readily detected in all cell types (Figure 6, a, c, e, and g). Insulin treatment of CHO-WT and HTC-WT cells had a tendency to increase actin filament content (Figure 6, compare a and b with e and f). In contrast, insulin led to a marked depolymerization of actin filaments in CHO-IR and HTC-IR cells (Figure 6, compare c and d with g and h).
Figure 6.
Subcellular organization of actin fibers in CHO and HTC cells. Confluent cultures of CHO-WT (a and b) and CHO-IR (c and d) cells were serum deprived for 3 h and treated without (a or c) or with 100 nM insulin (b and d) for 15 min. The cells were fixed with 4% paraformaldehyde in PBS for 20 min at room temperature and then permeabilized with 0.2% Triton X-100 in PBS for 20 min. The cells were incubated with rhodamine-conjugated phalloidin (4 U/ml) in PBS for 30 min. The stained actin filaments were examined by fluorescence microscopy. HTC-WT (e and f) and HTC-IR cells (g and h) were treated without (e and g) or with 100 nM insulin (f and h) for 15 min at the end of 3 h of serum starvation and then processed as above. Shown is one experiment representative of three. Bar, 10 μm.
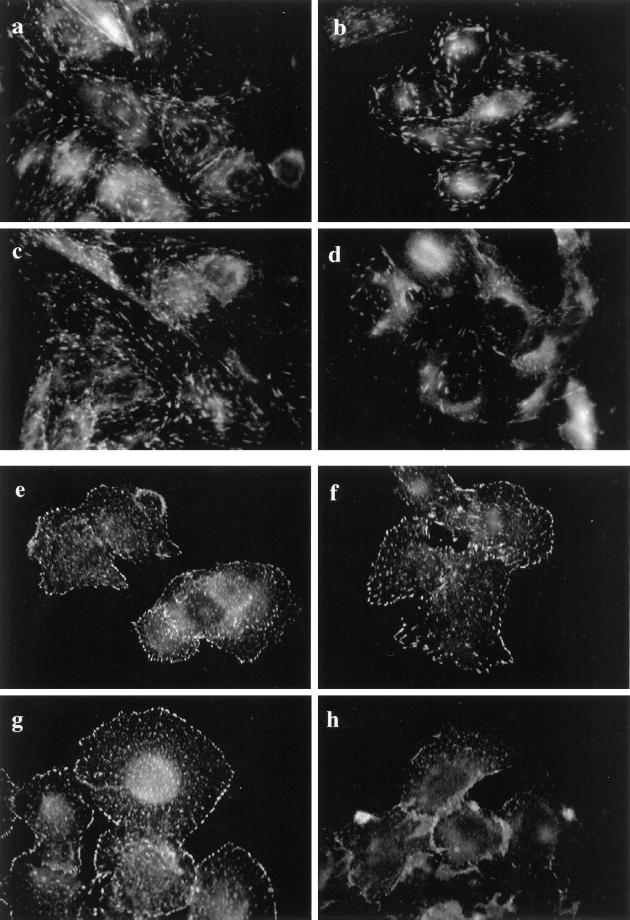
Indirect immunofluorescence for FAK in CHO-WT and CHO-IR cells demonstrated that the distribution of protein was punctate but also had a streaming appearance as if the various concentrated regions of FAK were aligned (Figure 7, a and c). On the other hand, immunostaining of FAK in HTC-WT and HTC-IR cells had a more punctate appearance that was distributed in a random manner around the cell with especially more intense staining at the perimeter of the cells (Figure 7, e and g). Insulin stimulation caused a disorganization in the distribution of FAK only in CHO-IR and HTC-IR cells (Figure 7, d and h) compared with the parental cells (Figure 7, b and f), which did not show any reorganization of FAK in response to insulin.
Figure 7.
Subcellular distribution of FAK in CHO and HTC cells. Confluent cultures of CHO-WT (a and b) and CHO-IR (c and d) cells were serum deprived for 3 h and treated without (a and c) or with 100 nM insulin (b and d) for 15 min. The cells were fixed, permeabilized, and blocked with 5% goat serum in PBS as outlined in MATERIALS AND METHODS. The cells were then incubated with anti-FAK in goat serum-PBS for 60 min. Primary antibody binding was detected with goat anti-rabbit antibody conjugated to fluorescein and then examined using fluorescence microscopy. HTC-WT (e and f) and HTC-IR cells (g and h) were treated without (e and g) or with 100 nM insulin (f and h) for 15 min at the end of 3 h of serum starvation and then processed as above. Shown is one experiment representative of three.
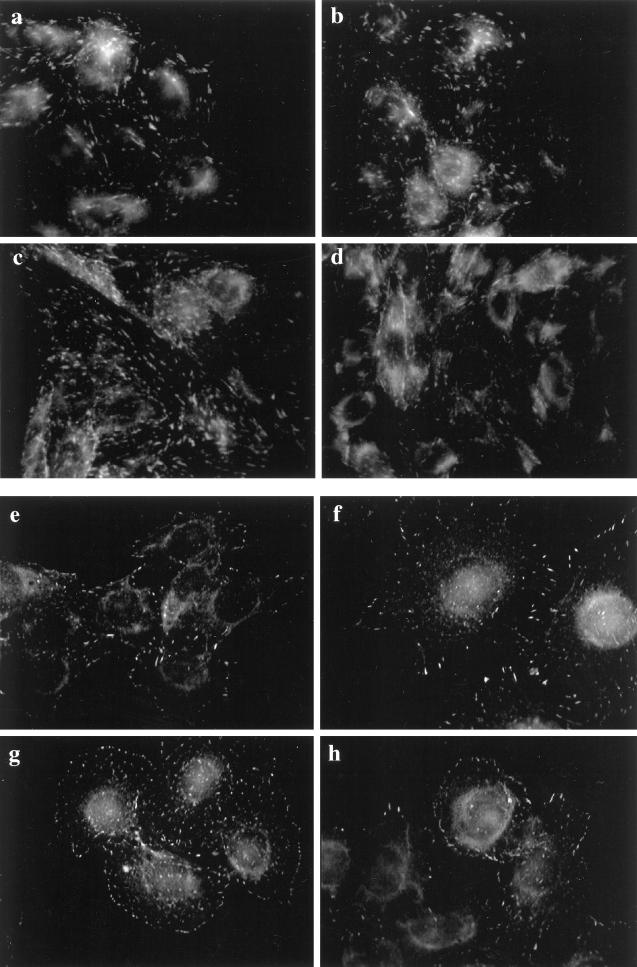
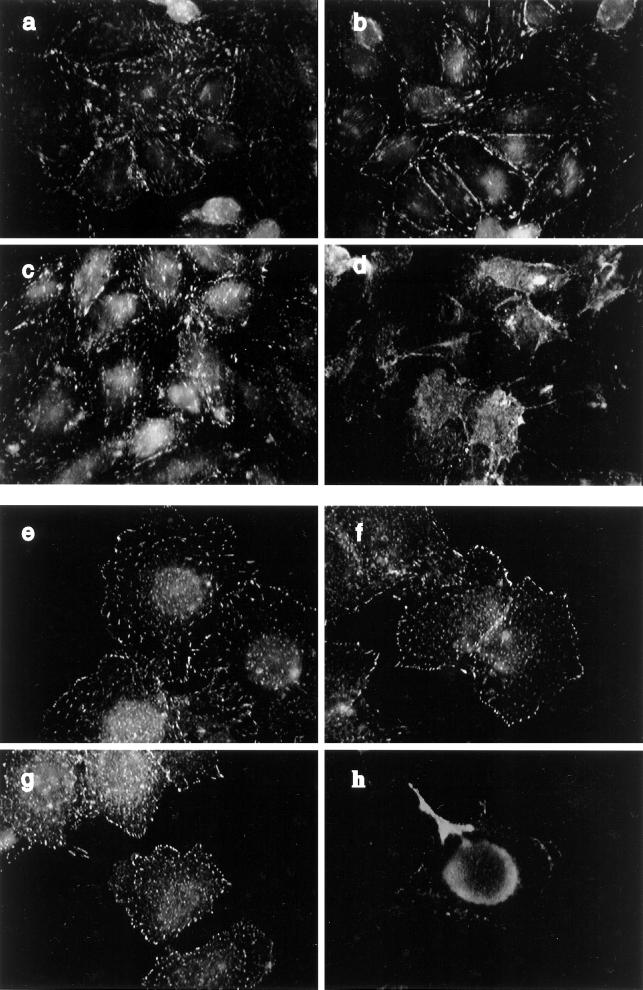
The distribution of paxillin immunofluorescence matched the distribution of FAK within each respective cell type. That is, the punctate immunostaining of paxillin in the CHO cells was aligned or streaming (Figure 8, a and c), but it was punctate and random in the HTC cells (Figure 8, e and g). Paxillin appeared to be less abundant at the cell perimeter in the HTC cell compared with FAK. Insulin stimulation of HTC-WT cells but not CHO-WT cells caused a slight increase in the paxillin located near the cell perimeter. However, insulin stimulation of CHO-IR or HTC-IR cells provoked a considerable dispersion of paxillin in these cells (see Figure 8, d and h), an effect that was not reproduced in the parental cell lines (Figure 8, b and f). Also, insulin increased the localization of vinculin in focal adhesion sites in HTC-WT cells, whereas this association was decreased in HTC-IR cells (our unpublished results). Focal adhesions are concentrated sites of tyrosine phosphorylation. Indirect immunofluorescence demonstrated that abundant tyrosine-phosphorylated proteins had a distribution remarkably similar to that of FAK and paxillin in CHO cells (Figure 9, a and c) or HTC cells (Figure 9, e and g). In addition, there was an intense immunostaining for tyrosine-phosphorylated proteins around the perimeter of each cell type. Consistent with the dephosphorylation of focal adhesion proteins observed in CHO-IR and HTC-IR cells in response to insulin, the amount of immunoreactive tyrosine phosphorylation at focal adhesion sites was markedly diminished throughout these cells (Figure 9, d and h), whereas the corresponding wild-type cells displayed modest increases in phosphotyrosine proteins at the cell surface after insulin treatment (Figure 9, b and f).
Figure 8.
Subcellular distribution of paxillin in CHO and HTC cells. Confluent cultures of CHO-WT (a and b) and CHO-IR (c and d) cells were serum deprived for 3 h and treated without (a and c) or with 100 nM insulin (b and d) for 15 min. The cells were fixed, permeabilized, and blocked as described in Figure 6. The cells were then incubated with anti-paxillin (1:500) in goat serum-PBS for 60 min. Primary antibody binding was detected with goat anti-mouse antibody conjugated to fluorescein and then examined using fluorescence microscopy. HTC-WT (e and f) and HTC-IR cells (g and h) were treated without (e and g) or with 100 nM insulin (f and h) for 15 min at the end of 3 h of serum starvation and then processed as above. Shown is one experiment representative of three.
Figure 9.
Subcellular distribution of phosphotyrosine proteins in CHO and HTC cells. Confluent cultures of CHO-WT (a and b) and CHO-IR (c and d) cells were serum deprived for 3 h and treated without (a and c) or with 100 nM insulin (b and d) for 15 min. The cells were fixed, permeabilized, and blocked as described in Figure 6. The cells were then incubated with anti-PY antibody (1:1000) in goat serum-PBS for 60 min. Primary antibody binding was detected with goat anti-mouse antibody conjugated to fluorescein and then examined by fluorescence microscopy. HTC-WT (e and f) and HTC-IR cells (g and h) were treated without (e and g) or with 100 nM insulin (f and h) for 15 min at the end of a 3-h period of serum starvation and then processed as above. Shown is one experiment representative of three.
DISCUSSION
Insulin treatment of CHO-IR and HTC-IR cells stimulated and maintained a time-dependent tyrosine dephosphorylation of FAK, paxillin, and Src. Insulin also caused the depolymerization of stress fibers in these cells and released organizational constraints on phosphotyrosine proteins and the focal adhesion proteins FAK, paxillin, and vinculin, allowing them to become more dispersed throughout the cell. In contrast, insulin treatment of CHO-WT and HTC-WT cells caused small increases in the tyrosine phosphorylation of FAK, paxillin, and Src, increased the abundance of tyrosine phosphorylated proteins at the cell perimeter, caused a slight increase in actin stress fiber content, but had little effect on the subcellular organization of the focal adhesion proteins.
The contrasting effects of insulin on these parameters in cells overexpressing the insulin receptor compared with the parental cell lines suggest that receptor overexpression itself may alter the manner by which insulin affects the cytoskeleton and the focal adhesion molecules. Immunoblotting of total membranes for insulin receptor demonstrated that our CHO-IR cells expressed 16 times more insulin receptors than CHO-WT cells and our HTC-IR cells expressed 11 times more insulin receptors than HTC-WT cells. These differences in the expression of insulin receptors compare favorably with similar cells described in earlier reports: 105 receptors per cell in the overexpressing cell lines versus 5 × 10³ receptors per cell in the parental line (Hawley et al., 1989; Konstantopoulos and Clark, 1996). In addition, these cells express insulin-like growth factor I (IGF-I) receptors, and in the parental cells IGF-I receptors may outnumber the insulin receptor density by a factor of 10. For example, there are ∼4 × 10⁴ IGF-I receptors per cell in CHO-WT cells (Konstantopoulos and Clark, 1996).
The concentration of insulin used in our studies could have cross-reacted with the IGF-I receptor (which binds insulin with a Kd of 10 nM), and it is conceivable that the effects of insulin would be mediated in part through the IGF-I receptors in the parental cell lines. This raises the possibility that IGF-I and insulin signaling pathways could have different actions on focal adhesion assembly, because the insulin response observed in the parental cells could potentially be ascribed to actions via only the IGF-I receptor, whereas the response in the insulin receptor–overexpressing cells would be mediated via the insulin receptor. Alternatively, the differential responses may depend on the total number of insulin and IGF-I receptors present in a cell. In support of this view, 3T3-L1 adipocytes, which have abundant numbers of insulin and IGF-I receptors but are considered highly sensitive to insulin and, thus, insulin-responsive cells (Lane et al., 1981; Grako et al., 1994), have an insulin response with regard to actin fiber assembly and tyrosine phosphorylation of focal adhesion proteins that resembles CHO-WT and HTC-WT cells. In our hands, the 3T3-L1 cells have an insulin receptor number that was intermediate between the CHO-WT or HTC-WT cells and CHO-IR or HTC-IR cells. Our data suggest that the number of insulin (and IGF-I) receptors in 3T3-L1 adipocytes may not approach the threshold at which the switch in the action of insulin on the cytoskeleton occurs. This switch, however, may occur in cells with very high insulin (and perhaps IGF-I) receptor expression. This is not an unprecedented suggestion, because PDGF can have a dual action similar to the phenomenon described for insulin here. At low concentrations, PDGF can stimulate increased actin fiber formation and FAK tyrosine phosphorylation in platelets, but at higher concentrations (and thus a greater number of PDGF activated receptors), PDGF causes actin fiber disorganization and a decrease in FAK tyrosine phosphorylation in the same cells (Rankin and Rozengurt, 1994).
It is noteworthy that the cytoskeleton of 3T3-L1 cells is important for maintaining FAK tyrosine phosphorylation status, because cytochalasin D disruption of the actin cytoskeleton markedly decreased FAK tyrosine phosphorylation in otherwise untreated 3T3-L1 adipocytes.
An important question remaining is how very high numbers of insulin receptors induce focal adhesion protein tyrosine dephosphorylation and actin stress fiber disassembly. One possible explanation may be related to the observation that the insulin-stimulated tyrosine phosphorylation level of IRS-1 is markedly higher in the insulin receptor–overexpressing cell lines compared with the parental cell lines (Konstantopoulos and Clark, 1996; present study). Recently, it was shown that the SH2 domain of C-terminal Src kinase (Csk) associates with phosphorylated tyrosine residues on IRS-1 (Tobe et al., 1996). Csk can inhibit Src activity by directly phosphorylating tyrosine residues on the C-terminal region of Src. Overexpression of Csk in CHO cells increases the amount of Csk associated with IRS-1, decreases the basal levels of tyrosine-phosphorylated FAK, and enhances the ability of insulin to stimulate the tyrosine dephosphorylation of FAK (Tobe et al., 1996). We speculate that a greater association between Csk and IRS-1 in CHO-IR cells occurs upon exposure to insulin, because of the supraphysiologically elevated number of insulin receptors. The heightened activation of Csk may be responsible for significant down-regulation of Src activity to a level that is no longer able to maintain the tyrosine-phosphorylated state of FAK and paxillin. Indeed, there is precedence in the literature for alterations in insulin signal transduction by selective overexpression of the insulin receptor and IRS-1 in CHO cells (Yamauchi and Pessin, 1994). In those studies, IRS-1 acts as a “sink” for Grb2 to such a degree that the insulin-stimulated interaction of Shc–Grb2 and the signaling by this complex is significantly impaired (Yamauchi and Pessin, 1994). Thus, it is plausible that markedly increased levels of tyrosine-phosphorylated IRS-1 act as an “inhibitor” of Src by elevating the amount of activated Csk in CHO-IR cells above the normal levels. This hypothesis could also explain our observation that the association of Src and FAK is reduced upon insulin stimulation of cells that overexpress the insulin receptor. Alternatively, a tyrosine phosphatase that acts on FAK may be activated by the high levels of insulin receptor and IRS-1 (Pillay et al., 1995). Clearly, additional studies may be required to understand how insulin receptor overexpression leads to signaling mechanisms that do not normally participate in the same cells expressing physiological numbers of insulin receptors.
The present observations describe the effects of insulin on the cytoskeleton and focal adhesions in 3T3-L1, an accepted model of insulin-responsive cells. They also suggest that when studying the many signaling pathways that insulin engages, caution is needed when using heterologous overexpression of the insulin receptor (or perhaps other insulin signaling molecules) in various cultured cell systems.
ACKNOWLEDGMENTS
We thank Dr. A. Hinek for advice with the fluorescence microscopy and Drs. M. Moule and C.C. Yip for providing the HTC and CHO cell lines (overexpressing the insulin receptor). This work was supported by grant MT-7307 from the Medical Research Council of Canada (to A.K.). Q.W. was supported by fellowships from the Hospital for Sick Children Research Training Center and from the Eli Lilly Banting & Best Diabetes Research Personnel Award Program.
REFERENCES
- Berfield AK, Raugi GJ, Abrass CK. Insulin induces rapid and specific rearrangement of the cytoskeleton of rat mesangial cells in vitro. J Histochem Cytochem. 1996;44:91–101. doi: 10.1177/44.2.8609378. [DOI] [PubMed] [Google Scholar]
- Brown MT, Cooper JA. Regulation, substrates and functions of src. Biochim Biophys Acta. 1996;1287:121–149. doi: 10.1016/0304-419x(96)00003-0. [DOI] [PubMed] [Google Scholar]
- Burridge K, Chrzanowska-Wodnicka M, Zhong C. Focal adhesion assembly. Trends Cell Biol. 1997;7:342–347. doi: 10.1016/S0962-8924(97)01127-6. [DOI] [PubMed] [Google Scholar]
- Burridge K, Fath K, Kelly T, Nuckolls G, Turner C. Focal adhesions: transmembrane junctions between the extracellular matrix and the cytoskeleton. Annu Rev Cell Biol. 1988;4:487–525. doi: 10.1146/annurev.cb.04.110188.002415. [DOI] [PubMed] [Google Scholar]
- Cheatham B, Kahn CR. Insulin action and the insulin signaling network. Endocr Rev. 1995;16:117–142. doi: 10.1210/edrv-16-2-117. [DOI] [PubMed] [Google Scholar]
- Clark EA, Brugge JS. Integrins and signal transduction pathways: the road taken. Science. 1995;268:233–239. doi: 10.1126/science.7716514. [DOI] [PubMed] [Google Scholar]
- Downey GP. Mechanisms of leukocyte motility and chemotaxis. Curr Opin Immunol. 1994;6:113–124. doi: 10.1016/0952-7915(94)90042-6. [DOI] [PubMed] [Google Scholar]
- Eide BL, Turck CW, Escobedo JA. Identification of Tyr-397 as the primary site of tyrosine phosphorylation and Pp 60src association in the focal adhesion kinase, pp125FAK. Mol Cell Biol. 1995;15:2819–2827. doi: 10.1128/mcb.15.5.2819. [DOI] [PMC free article] [PubMed] [Google Scholar]
- Grako KA, McClain DA, Olefsky JM. Hybrid formation between endogenous mouse and transfected human tyrosine kinase-deficient (A/K1018) insulin receptors leads to decreased insulin sensitivity in 3T3–L2 adipocytes. Mol Endocrinol. 1994;8:682–692. doi: 10.1210/mend.8.6.7935484. [DOI] [PubMed] [Google Scholar]
- Hawley DM, Maddux BA, Patel RG, Wong KY, Mamula PW, Firestone GL, Brunetti A, Verspohl E, Goldfine ID. Insulin receptor monoclonal antibodies that mimic insulin action without activating tyrosine kinase. J Biol Chem. 1989;264:2438–2444. [PubMed] [Google Scholar]
- Hitt AL, Luna EJ. Membrane interactions with the actin cytoskeleton. Curr Opin Cell Biol. 1994;6:120–130. doi: 10.1016/0955-0674(94)90125-2. [DOI] [PubMed] [Google Scholar]
- Knight JB, Yamauchi K, Pessin JE. Divergent insulin and platelet-derived growth factor regulation of focal adhesion kinase (pp125FAK) tyrosine phosphorylation, and rearrangement of actin stress fibers. J Biol Chem. 1995;270:10199–10203. doi: 10.1074/jbc.270.17.10199. [DOI] [PubMed] [Google Scholar]
- Konstantopoulos N, Clark S. Insulin and insulin-like growth factor-1 stimulate dephosphorylation of paxillin in parallel with focal adhesion kinase. Biochem J. 1996;314:387–390. doi: 10.1042/bj3140387. [DOI] [PMC free article] [PubMed] [Google Scholar]
- Lane MD, Reed RC, Clements PR. Insulin receptor synthesis and turnover in differentiating 3T3–L1 preadipocytes. Prog Clin Biol Res. 1981;66:523–542. [PubMed] [Google Scholar]
- Lavan BE, Lane WS, Lienhard GE. The 60-kDa phosphotyrosine protein in insulin-treated adipocytes is a new member of the insulin receptor substrate family. J Biol Chem. 1997;272:11439–11443. doi: 10.1074/jbc.272.17.11439. [DOI] [PubMed] [Google Scholar]
- Martin SS, Haruta T, Morris AJ, Klippel A, Williams LT, Olefsky JM. Activated phosphatidylinositol 3-kinase is sufficient to mediate actin rearrangement and GLUT4 translocation in 3T3–L1 adipocytes. J Biol Chem. 1996;271:17605–17608. doi: 10.1074/jbc.271.30.17605. [DOI] [PubMed] [Google Scholar]
- Molitoris BA. Putting the actin cytoskeleton into perspective: pathophysiology of ischemic alterations. Am J Physiol. 1997;272:F430–F433. doi: 10.1152/ajprenal.1997.272.4.F430. [DOI] [PubMed] [Google Scholar]
- Nobes CD, Hawkins P, Stephens L, Hall A. Activation of the small GTP-binding protein rho and rac by growth factor receptors. J Cell Sci. 1995;108:225–233. doi: 10.1242/jcs.108.1.225. [DOI] [PubMed] [Google Scholar]
- Otey CA. Pp 125FAK in the focal adhesion. Int Rev Cytol. 1996;167:161–183. doi: 10.1016/s0074-7696(08)61347-9. [DOI] [PubMed] [Google Scholar]
- Parsons JT. Integrin-mediated signaling: regulation by protein tyrosine kinases and small GTP-binding proteins. Curr Opin Cell Biol. 1996;8:146–152. doi: 10.1016/s0955-0674(96)80059-7. [DOI] [PubMed] [Google Scholar]
- Pillay TS, Sasaoka T, Olefsky JM. Insulin stimulates the tyrosine dephosphorylation of pp125 Focal adhesion kinase. J Biol Chem. 1995;270:991–994. doi: 10.1074/jbc.270.3.991. [DOI] [PubMed] [Google Scholar]
- Pronk GJ, McGlade J, Pelicci G, Pawson T, Bos JL. Insulin-induced phosphorylation of the 46- and 52-KDa Shc proteins. J Biol Chem. 1993;268:5748–5753. [PubMed] [Google Scholar]
- Rankin S, Rozengurt E. Platelet-derived growth factor modulation of focal adhesion kinase (P125FAK) and paxillin tyrosine phosphorylation in Swiss 3T3 cells. J Biol Chem. 1994;269:704–710. [PubMed] [Google Scholar]
- Ridley AJ, Hall A. The small GTP-binding protein rho regulates assembly of focal adhesions and actin stress fibers in response to growth factors. Cell. 1992;70:389–399. doi: 10.1016/0092-8674(92)90163-7. [DOI] [PubMed] [Google Scholar]
- Schaller MD, Hildebrand JD, Shannon JD, Fox JW, Vines RR, Parsons JT. Autophosphorylation of the focal adhesion kinase pp 125FAK, directs SH2-dependent binding of pp60src. Mol Cell Biol. 1994;14:1680–1688. doi: 10.1128/mcb.14.3.1680. [DOI] [PMC free article] [PubMed] [Google Scholar]
- Schlaepfer DD, Hunter T. Focal adhesion kinase overexpression enhances Ras-dependent intregin signaling to ERK2/mitogen-activated protein kinase through interactions with and activation of c-Src. J Biol Chem. 1997;272:13189–13195. doi: 10.1074/jbc.272.20.13189. [DOI] [PubMed] [Google Scholar]
- Tobe K, et al. Csk enhances insulin-stimulated dephosphorylation of focal adhesion proteins. Mol Cell Biol. 1996;16:4765–4772. doi: 10.1128/mcb.16.9.4765. [DOI] [PMC free article] [PubMed] [Google Scholar]
- Trifaro JM, Vitale ML. Cytoskeleton dynamics during neurotransmitter release. Trends Neurosci. 1993;16:466–472. doi: 10.1016/0166-2236(93)90079-2. [DOI] [PubMed] [Google Scholar]
- Tsakiridis T, Vranic M, Klip A. Disassembly of the actin network inhibits insulin-dependent stimulation of glucose transport and prevents recruitment of glucose transporters to the plasma membrane. J Biol Chem. 1994;269:29934–29942. [PubMed] [Google Scholar]
- Vitale ML, Seward EP, Trifaro JM. Chromaffin cell cortical actin network dynamics control the size of the release-ready vesicle pool and the initial rate of exocytosis. Neuron. 1995;14:353–363. doi: 10.1016/0896-6273(95)90291-0. [DOI] [PubMed] [Google Scholar]
- Volchuk A, Sargeant R, Sumitani S, Liu Z, He L, Klip A. Cellubrevin is a resident protein of insulin-sensitive GLUT4 glucose transporter vesicles in 3T3–L1 adipocytes. J Biol Chem. 1995;270:8233–8240. doi: 10.1074/jbc.270.14.8233. [DOI] [PubMed] [Google Scholar]
- Vollenweider P, Martin SS, Haruta T, Morris AJ, Nelson JG, Cormont N, Le Marchand-Brustel Y, Rose DW, Olefsky JM. The small guanosine triphosphate-binding protein Rab4 is involved in insulin-induced GLUT4 translocation and actin filament rearrangement in 3T3–L1 cells. Endocrinology. 1997;138:4941–4949. doi: 10.1210/endo.138.11.5493. [DOI] [PubMed] [Google Scholar]
- Wang Q, Bilan PJ, Tsakiridis T, Hinek A, Klip A. Actin filaments participate in the relocalization of phosphatidylinositol 3-kinase to glucose transporter-containing compartments and in the stimulation of glucose uptake in 3T3–L1 adipocytes. Biochem J. 1998;331:917–928. doi: 10.1042/bj3310917. [DOI] [PMC free article] [PubMed] [Google Scholar]
- White MF. The insulin signaling system and the IRS proteins. Diabetologia. 1997;40:S2–S17. doi: 10.1007/s001250051387. [DOI] [PubMed] [Google Scholar]
- White MF, Kahn CR. The insulin signaling system. J Biol Chem. 1994;269:1–4. [PubMed] [Google Scholar]
- Yamauchi K, Pessin JE. Insulin receptor substrate-1 (IRS) and Shc compete for a limited pool of Grb2 in mediating insulin downstream signaling. J Biol Chem. 1994;269:31107–31114. [PubMed] [Google Scholar]


