

Abstract
We have performed molecular dynamics simulations of 0% and 90%-acetylated G5 PAMAM dendrimers in water and methanol and obtained radii of gyration of 2.51~2.57nm and 2.11~2.33nm, respectively, similar to those measured experimentally in methanol by Prosa et al. (J. Polymer. Sci. 35, 2913–2924) and in water by Choi et al. (Nano Letters, 4, 391–397). Calculation of the moments of inertia and the relative shape anisotropy show that both 0% and 90%-acetylated G5 are modestly ellipsoidal. The distribution of branch points relative to the center of the dendrimer and penetration of solvent show that the core and surface of the dendrimer are more exposed to water than is the region between core and surface due to the interactions between monomers, including hydrogen bonds that rapidly break and reform as solvent molecules compete for hydrogen bonding sites on the monomers. The water and methanol solvents seem to produce similar numbers of hydrogen bond interactions between monomers.
INTRODUCTION
Polyamidoamine (PAMAM) dendrimers, which contain a central core, regularly branched monomeric building blocks, and many surface terminal groups, are among the best candidate nanoparticles for use as anti-tumor therapeutics to detect and target tumor cells due to their controlled mass, surface valency, and surface functionality.1,2 Therefore, such dendrimers are under development as delivery systems for gene or drug delivery,3,4 and it is important to understand their structure and dynamics in detail. To this end, radii of gyration (Rg) of PAMAM dendrimers of generation G5 through G10 have been estimated from electron densities derived from small-angle x-ray scattering (SAXS).5 The sizes and shapes of these PAMAM dendrimers have also been characterized by transmission electron microscopy (TEM) using biological staining techniques.6 The effect of solvent quality has been analyzed by measuring Rg using small-angle neutron scattering (SANS) at different solvent ratios of methyl alcohol to acetone and at different temperatures.7
While SAXS, SANS, and TEM and other experimental probes provide vital information on the structure of PAMAM dendrimers, results from these are not always easy to interpret at the atomic level. In particular, G5 or smaller generations of dendrimers have not been characterized well because of the limited resolution of those experimental techniques. On the other hand, molecular-level phenomena can be visualized in detail by molecular dynamics simulations, which offer insights into structure and dynamics, assuming that these simulations can be validated by successful comparisons to available experimental results.
Molecular dynamics simulations have been performed in vacuum by Lee et al.8 on generations 2 through 6 PAMAM dendrimers with the different extents of amine protonation that are expected at various pH values. These simulations suggest that the extent of protonation plays an important role in the structure of PAMAM dendrimers. The simulations of Mecke et al.9 show that PAMAM dendrimers flatten when they come into contact with a negatively charged surface. Maiti et al.10 simulated generations 1 through 11 PAMAM dendrimers, and found that the predicted Rg for generation G9 or higher matches those from the experiments. Although these simulations have provided important information, none of them have yielded a value of Rg for a G5 dendrimer that agrees with the experimental result, presumably because to save computer time the simulations were carried out either in vacuum or in a dielectric medium rather than in explicit water. The Goddard group has performed molecular dynamics simulations of dendrimers in water solvent. For example, Maiti et al.11 carried out simulations in water of G4~G6 PAMAM dendrimers. While these simulations provide valuable insights, the simulation time was only 400ps, which does not yield an equilibrated system or adequate sampling. Similarly, Lin et al.12 showed that the thermodynamic and dynamic properties of water near G5 PAMAM dendrimers are different from those of bulk water. However, the simulations did not determine the conformation and interactions of the equilibrated dendrimer in water, presumably because of insufficient run times. Recently, Han et al.13 simulated G1 through G7 PAMAM dendrimers in explicit water for 4.5~15 ns, and showed that there are significant structural differences between results using implicit vs. explicit solvent. However, they did not compare the Rg values from their simulated dendrimers with the experimental values, because in their simulations the amines were unprotonated, rather than being protonated as is the case at the physiological and experimental pH of 7. More importantly, their simulations were performed in water rather than in methanol, which was used in the experiments of Prosa’s et al.5 Therefore, to date, simulations have not yet yielded Rg values that can realistically be compared to the experimental values. In addition, interactions between branches of a dendrimer in different solvents have not yet been analyzed and understood at the atomic level, especially for the G5 PAMAM dendrimer, which has been widely studied for gene or drug delivery applications. While the surface-amines of unmodified G5 PAMAM dendrimers are protonated at pH 7, these amines are often 80~90%-acetylated to prevent nonspecific interactions of the dendrimers with cells.14,15 Therefore, acetylated G5 dendrimers have been widely used for nanoparticle targeting of anticancer drug and self-assembly of dendrimers using complementary single-stranded oligonucleotides.4,16,17 Here, we perform 4.5~6.4ns-long molecular dynamics simulations of the structure of 0% and 90%-acetylated G5 PAMAM dendrimers with protonated surface-amines in explicit water and methanol to investigate atomic-scale interactions of the dendrimer with solvent as well as dendrimer shape and size, which we compare with experimental findings.
METHODS
Initial atomic coordinates for 0% and 90%-acetylated G5 PAMAM dendrimers (EDA core) were generated using the Insight II software package (Accelrys Inc., San Diego, CA), followed by several steps of energy minimization. Characteristics of 0% and 90%-acetylated G5 dendrimers are listed in Table 1. All simulations were performed usin g the AMBER8 simulation package with the general AMBER force field (GAFF)18,19 and the TIP3PBOX water model20, and all analyses were performed by using AMBER8 and GROMACS simulation package tools.21 Our simulations were carried out in a truncated octahedral box, whose faces consist of 8 hexagons and 6 squares, with water molecules packed around a single dendrimer molecule placed at the center of the box, with at least 8 Å between any atom of the dendrimer and the edge of the box. Periodic boundary conditions were used. We included 27,085 and 19,345 water molecules respectively for the 0% and 90%-acetylated dendrimers. As counterions, 128 Cl− and 12 Cl− ions, respectively, were also added to the boxes containing 0% and 90%-acetylated dendrimers to make the corresponding systems neutral. A total of 86,059 and 63,187 atoms, respectively, were therefore used for the 0% and 90%-acetylated dendrimers. For the systems with the methanol solvent, the same procedures were performed with different numbers of solvent molecules.
Table 1.
List of simulations. G5 and G5M indicate 0%-acetylated G5 PAMAM dendrimers (EDA core) with protonated surface residues, in water and methanol, respectively. “G5-Ac90” and “G5M-Ac90” are 90%-acetylated G5 PAMAM dendrimers, in water and methanol, respectively
| Dendrimer type | Generation | Number of surface groups
|
Total charge | Number of atoms in dendrimer | Solvent | Simulation time (ns) | |
|---|---|---|---|---|---|---|---|
| NH3+ | Acetylation(NHCOCH3) | ||||||
| G5 | 5 | 128 | - | 128 | 4,676 | Water | 4.9 |
| G5M | 5 | 128 | - | 128 | 4,676 | Methanol | 4.5 |
| G5-Ac90 | 5 | 12 | 116 | 12 | 5,140 | Water | 6.4 |
| G5M-Ac90 | 5 | 12 | 116 | 12 | 5,140 | Methanol | 5.0 |
The temperature was maintained at 298 K by applying Langevin dynamics,22 and an NPT ensemble was used. A cut-off of 9Å was used for van der Waals interactions and Particle Mesh Ewald summation (PME) for electrostatic interactions.23 SHAKE constraints were applied to all bonds involving hydrogen atoms.24 After energy minimizations with and without restraints on the dendrimer molecules, equilibration runs were performed for 4.5–6.4 nanoseconds with a time step of 2 femtoseconds. Radii of gyration and principal moments of inertia of the dendrimers in our simulations do not change after 2.5~4ns. In addition, the autocorrelation functions of radius of gyration yield a relaxation time below 1.5ns, which is consistent with that found by Han et al.13 Also, radii of gyration and principal moments of inertia obtained from the last 500ps show very small errors estimated by using block averaging, suggesting that the systems are equilibrated well. The coordinates were saved every picosecond for analysis.
RESULTS AND DISCUSSION
We performed molecular dynamics simulations of 0% and 90%-acetylated G5 PAMAM dendrimers in explicit water and methanol. Here, these dendrimers are named “G5”, “G5M”, “G5-Ac90”, and “G5M-Ac90”, and details describing them are given in Table 1. Figure 1 shows snapshots from the beginning (top image) and end (bottom image) of the simulations. Final conformations show that all the dendrimers shrink and form ellipsoidal spheroids, with G5-Ac90 and G5M-Ac90 becoming more compact than G5 and G5M. In order to investigate the size and shape, water distribution, and hydrogen bond interactions, the average properties were analyzed over the last 500ps, when the system is in its most equilibrated state.
Figure 1.

Snapshots at the beginning (0ns, top images) and end (4.5ns for G5, 4ns for G5M, 6ns for G5-Ac90, and 4.5ns for G5M-Ac90, bottom images) of (a) G5, (b) G5M, (c) G5-Ac90, and (d) G5M-Ac90 simulations. Protonated surface residues (NH3+) are shown as blue dots. The explicit water molecules and counterions are omitted for clarity. The images ware created using VMD.25
Size and shape of dendrimers
To analyze the size of the dendrimers quantitatively, the radii of gyration Rg were calculated and compared with values from experiments and from other simulations. Rg has been measured using electron densities obtained from SAXS by Prosa et al.,5 and thus we modified the normal equation for Rg by using electron numbers instead of mass. (Here , where ei is the electron numbers and ri is the position of atom i with respect to the center of mass of the molecule).
Figure 2(a) shows that Rg values for G5, G5M, G5-Ac90, and G5M-Ac90 drastically decrease as functions of time at the beginning of the simulations, and then reach apparent steady state values of 2.5nm, 2.6nm, 2.1nm, and 2.3nm at around 2.5ns, 3.5ns, 4ns, and 4ns, respectively. In figure 2(b), autocorrelation functions, CRg (t), for Rg yield relaxation times, defined as the time at which CRg (t) = 1/e, and these are below 1.5 ns, suggesting that dendrimers are equilibrated within the simulated time scales. Han et al. also found Rg for their dendrimers in explicit water stabilized within 1.5ns.13 Table 2 shows that the values of Rg from our simulations compare favorably with those from experiments. Prosa et al.5 used SAXS to measure a value of 2.41nm for the radius of gyration of dilute G5 in methanol, while Choi et al.26 used size-exclusion chromatography to measure values of 2.5nm and 2.35nm for G5 and G5-Ac90 in a mixture of water and citric acid. We note that G5 dendrimers are too small for these methods to be expected to give exact radii of gyration; however, our simulations seem to confirm that these measurements are in fact reasonably accurate.
Figure 2.
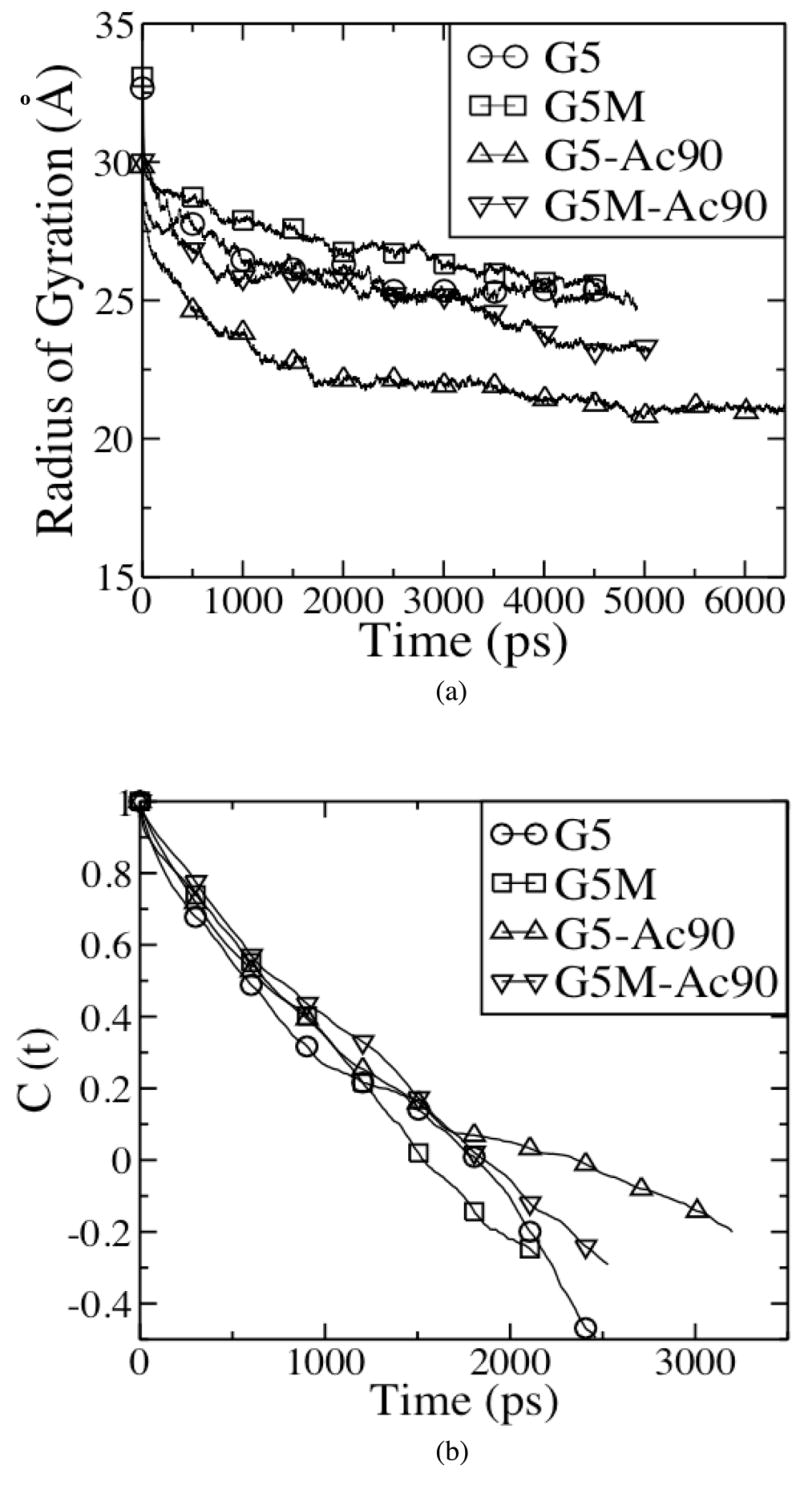
(a) Radii of Gyration (Rg) and (b) autocorrelation function (C (t)) of Rg of G5, G5M, G5-Ac90, and G5M-Ac90 as functions of time.
Table 2.
Average values of radius of gyration (Rg) of G5, G5M, G5-Ac90, and G5M-Ac90 over the last 500ps of the simulations. These values are compared with experiments and other simulations
| Radius of Gyration (nm)
|
||||||
|---|---|---|---|---|---|---|
| Experiment
|
Simulation
|
|||||
| Prosa et al.5 | Choi et al.26 | This work | Maiti et al.11 | Lee et al.8* | Maiti et al.10* | |
| G5 | - | 2.50 | 2.51 ± 0.01 | 2.22 ± 0.01 | 3.28 | 1.83 |
| G5M | 2.41 | - | 2.57 ± 0.01 | - | - | - |
| G5-Ac90 | - | 2.35 | 2.11 ± 0.01 | - | - | - |
| G5M-Ac90 | - | - | 2.33 ± 0.01 | - | - | - |
These simulations were performed without explicit water.
On the other hand, simulations in vacuum by Lee et al.8 and Maiti et al.10 yielded radii of gyration of 3.28nm and 1.83nm, respectively for these dendrimers, which do not agree with the experimental values. Han et al. simulated a G5 dendrimer in explicit water, but the dendrimer was unprotonated, and the value of Rg they obtained was 1.7nm, which also disagrees with the experimental result. Maiti et al.11 determined a radius of gyration of 2.22nm in explicit water, which is smaller than the value from our simulations and the experimental result. The difference in the value of Rg between our work and theirs might be due to the use of different forcefields, their use of mass instead of electron number to calculate Rg and the short run time in Maiti et al. Our results both in water and in methanol agree with the experimental values, and indicate that acetylation makes dendrimers more compact, apparently by reducing the number of repulsive charged surface groups. Although in methanol dendrimers are slightly less compact than in water, the difference in Rg values between the two solvents is small.
In addition to determining the sizes of the dendrimers, we computed their aspect ratios, Iz/Ix and Iz/Iy, where Iz, Iy, Ix are principal moments of inertia, ordered such that Iz > Iy > Ix, and obtained the relative shape anisotropy, κ2 (κ2 = 1 − 3I2/I12, where I1 and I2 are the first and second invariants of the radius of gyration tensor (I1= Ix+Iy +Iz, I2=Ix Iy +Iy Iz+Ix Iz)). A linear array of skeletal atoms is characterized by κ2 = 1, while a molecule with tetrahedral or higher symmetry is characterized by κ2 = 0.27 Table 3 shows average values of the principal moments of inertia, aspect ratio, and relative shape anisotropy of dendrimers averaged over the last 500ps of the simulations. The aspect ratios, Iz/Iy and Iz/Ix, are 1.19~1.43 and 1.24~1.72, respectively, showing that both acetylated and un-acetylated dendrimers have modestly ellipsoidal shapes. The values of the relative shape anisotropies are 0.01~0.03, showing them to be roughly spherical, suggesting that acetylation and change in solvent from water to methanol do not significantly affect the shape of the dendrimers.
Table 3.
Average values of the principal moments of inertia, aspect ratio, and relative shape anisotropy of G5, G5M, G5-Ac90, and G5M-Ac90 over the last 500ps of the simulations
| Iz [nm2] | Iy [nm2] | Ix [nm2] | Iz/Iy | Iz/Ix | Relative shape anisotropy | |
|---|---|---|---|---|---|---|
| G5 | 146,071 ± 617 | 117,285 ± 485 | 100,815 ± 2,629 | 1.25 | 1.45 | 0.01 |
| G5M | 143,862 ± 1,626 | 120,815 ± 1,703 | 115,610 ± 436 | 1.19 | 1.24 | 0.01 |
| G5-Ac90 | 131,178 ± 251 | 91,931 ± 548 | 76,454 ± 215 | 1.43 | 1.72 | 0.03 |
| G5M-Ac90 | 76,752 ± 878 | 64,286 ± 914 | 56,690 ± 333 | 1.19 | 1.35 | 0.01 |
Distributions of branch points and solvents
We analyzed the distribution of branch points to understand the conformation of dendrimers. Figures 3(a) and (b) show the average distance between the nitrogen atoms positioned at the terminals of each generation (G0 through G5 indicate N atoms positioned at the terminals of generations 0 through 5) and the core of the dendrimer, which is defined as the center of mass of all atoms in generation 0. The acetylated and unacetylated dendrimers have similar distances between the N atoms of G0 and the core of the dendrimer; however, unacetylated dendrimers have larger distances between G1 through G5 N atoms and the core than do acetylated dendrimers, which is consistent with the observation that acetylation reduces Rg. As the generation of the branch point increases, we find that the average distance between the N atoms of the branch points and the core linearly increases from G0 to G4, which is not seen in the work of Maiti et al.11 Maiti et al. find that in their simulations the branch point of G2 resides much farther from the core than does the branch point of G1, and is even farther from the core than that of G3. This highly nonlinear trend observed by Maiti et al. might result from their small simulation timescale. In figure 3, note that the positions of the N atoms in G4 and G5 overlap, whereas those in G0~G3 do not, suggesting that the monomers in G5 strongly interact with those in G4, which was also observed in Maiti et al’s work.11
Figure 3.

The average distance between N atoms of branch points and center of mass of G0 in (a) water and (b) methanol over the last 500ps of simulations. G0 through G5 represents N atoms positioned in the terminals of generations 0 to 5 of the dendrimer.
In addition to the distribution of branch points, we analyzed the distribution of solvent molecules, either water or methanol, inside the dendrimer. Maiti et al.11 found that there are four water molecules per tertiary amine in G5 dendrimer at neutral pH; however the distribution of water molecules near amines for different generation branch points were not computed. Table 4 shows the numbers of O atoms of water and methanol per branch point within 5Å of the nitrogen atoms at the branch points, averaged over all branch points in a given generation. In figure 4, G1 through G4 have fewer solvent molecules within 5Å of the branch-point N atoms than do G0 and G5, suggesting that the core and surface of a denrdrimer are more exposed to water, than is the region between the core and surface, which is denser in dendrimer mass due to the interactions between dendrimer branches. Especially, G2 and G3 have many fewer nearby solvent molecules, suggesting greater dendrimer density there.
Table 4.
Numbers of O atoms of solvents per branch point (water for G5 and G5-Ac, methanol for G5M and G5M-Ac90) within 5Å of branch-point N atoms, averaged over all branch points in a given generation. G0 through G5 represents N atoms positioned at the terminals of the 0th to 5th generations of the dendrimer
| Average number of O atoms of solvents
|
||||||
|---|---|---|---|---|---|---|
| G0 | G1 | G2 | G3 | G4 | G5 | |
| G5 | 4.52 ± 0.12 | 3.56 ± 0.11 | 2.75 ± 0.03 | 2.21 ± 0.05 | 3.51 ± 0.07 | 8.95 ± 0.13 |
| G5M | 4.17 ± 0.09 | 2.81 ± 0.05 | 2.63 ± 0.10 | 2.53 ± 0.03 | 2.95 ± 0.03 | 5.38 ± 0.08 |
| G5-Ac90 | 2.21 ± 0.13 | 1.37 ± 0.06 | 1.04 ± 0.04 | 1.18 ± 0.03 | 1.68 ± 0.04 | 2.94 ± 0.04 |
| G5M-Ac90 | 2.27 ± 0.07 | 1.89 ± 0.14 | 2.00 ± 0.13 | 1.75 ± 0.02 | 2.19 ± 0.02 | 3.30 ± 0.01 |
Figure 4.

Average number of O atoms of solvents within 5Å of branch points, N atoms, as a function of branch point location.
In addition, branch points in the acetylated dendrimers G5-Ac90 and G5M-Ac90 have many fewer nearby solvent molecules than do G5 and G5M, apparently due to greater compactness of acetylated dendrimers, observed in the lower value of Rg. These results suggest that interactions between branches in a dendrimer and the interactions between branches and solvent may play an important role in the final conformation of the dendrimer. To understand these interactions more thoroughly, we next analyze the formation of hydrogen bonds.
Hydrogen bonding interactions
While the dendrimers consist of uncharged hydrophobic monomers, each monomer has one CO and one NH group, each of which can form hydrogen bonds with other monomers. Our criterion for the existence of a hydrogen bond is that the hydrogen-acceptor distance is less than 0.25nm and the angle of the donor-hydrogen-acceptor triplet is more than 120°.28
There are 636 donors and 758 acceptors in G5 and G5M, and there are 404 donors and 874 acceptors in G5-Ac90 and G5M-Ac90, which can form hydrogen bond interactions. Hydrogen bond existence maps show that each hydrogen bonding site exchanges partners 30~50 times during the roughly 5ns simulation with different water or methanol molecules competing for bonding sites with the dendrimer. We analyzed quantitatively the average lifetime of the hydrogen bonds from the integral over the autocorrelation function of the hydrogen bonding existence functions (either 0 or 1) averaged over all hydrogen bonds.21 Average hydrogen bond lifetimes were measured over the last 500ps of the simulations, showing that lifetimes of hydrogen bonds either between dendrimer monomers and solvent or between dendrimer monomers are almost equally short, in the range of 0.5 ~ 0.57ps, suggesting that the competition between the dendrimer and solvent for the same binding sites leads to the fast formation and breaking of the hydrogen bonds.
Figure 5 shows the total number of hydrogen bonds formed either between a dendrimer monomer and a solvent molecule, or between two dendrimer monomers, averaged over the last 500ps of the simulations. While each dendrimer forms 395~552 hydrogen bonds with water molecules, each dendrimer forms only 26~52 hydrogen bonds with methanol molecules. Although water molecules have more hydrogen bond interactions with dendrimers than do methanol molecules, a total of only around 3~5 hydrogen bonds form between two different dendrimer monomers when the dendrimer is in either water or methanol, suggesting that the water and methanol produce similar numbers of intra-dendrimer hydrogen bonds. Figure 6 shows a snapshot of the hydrogen bond interaction between CO of G4 and NH groups of G5 in G5-Ac90, showing that the hydrogen bonds between these two groups bring them closer together, making the dendrimer more compact.
Figure 5.

Sum of all hydrogen bonds formed either between monomers of the dendrimer and solvent (◆), or between different monomers of the dendrimer (■), averaged over the last 500ps of the simulation.
Figure 6.
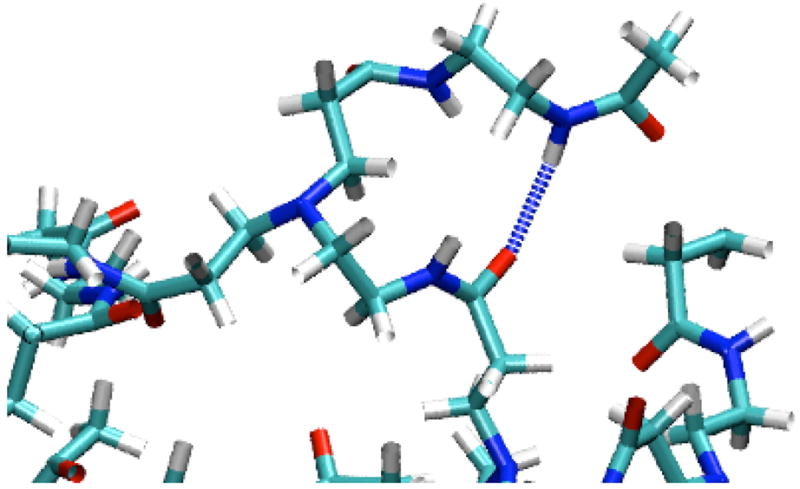
Snapshot of the hydrogen bond interaction between an O atom of G4 and an NH atom of G5 in G5-Ac90. Light blue regions represent C atoms, dark blue represent N atoms, red regions represent O atoms, white regions represent H atoms, and a dotted line represents a hydrogen bond. The water molecules are omitted for clarity.
CONCLUSIONS
We performed molecular dynamics simulations of 0% and 90%-acetylated G5 PAMAM dendrimers in explicit water and explicit methanol for 4.5–6.4ns and found that their radii of gyration Rg are 2.51~2.57 nm and 2.11~2.33 for 0% and 90%-aceylated G5 dendrimers, respectively, which correspond closely to the experimental results for both water and methanol. The radii of gyration and moments of inertia show that both acetylated and un-acetylated dendrimers have modestly ellipsoidal shapes. Distributions of branch points of dendrimers and O atoms of solvents show that the core and surface of the denrdrimer are more exposed to water, whereas the intermediate region is denser without much penetration of solvent. In addition, hydrogen bonds between monomers of the dendrimers, form, break, and re-form, competing with solvent for hydrogen-bonding sites, yielding an average of 3~5 hydrogen bonds between the monomers of a single dendrimer. Differences between water and methanol do not significantly affect the size and shape of the dendrimers and the properties of the hydrogen bonding interactions between monomers.
Acknowledgments
We gratefully acknowledge the help of Bernell Williams and Youngseon Choi in the laboratory of James Baker with the use of INSIGHTII software. Partial research support was provided by the National Cancer Institute, National Institutes of Health, under contract no. N01-CO-97111.
References
- 1.Baker JR, Quintana A, Piehler LT, Holl MMB, Tomalia DA, Raczka E. Biomed Microdevices. 2001;3:61–69. [Google Scholar]
- 2.Tomalia DA, Naylor AM, Goddard WA. Angew Chem, Int Ed Engl. 1990;29:138–175. [Google Scholar]
- 3.Malik N, Evagorou EG, Duncan R. Anti-Cancer Drugs. 1999;10:767–776. [PubMed] [Google Scholar]
- 4.Choi Y, Thomas T, Kotlyar A, Islam MT, Baker JR. Chemistry & Biology. 2005;12:35–43. doi: 10.1016/j.chembiol.2004.10.016. [DOI] [PubMed] [Google Scholar]
- 5.Prosa TJ, Bauer BJ, Amis EJ, Tomalia DA, Scherrenberg R. J Polymer Sci. 1997;35:2913–2924. [Google Scholar]
- 6.Jackson CL, Chanzy HD, Booy FP, Drake BJ, Tomalia DA, Bauer BJ, Amis EJ. Macromolecules. 1998;31:6259–6265. [Google Scholar]
- 7.Topp A, Bauer BJ, Tomalia DA, Amis EJ. Macromolecules. 1999;32:7232–7237. [Google Scholar]
- 8.Lee I, Athey BD, Wetzel AW, Meixner W, Baker JR. Macromolecules. 2002;35:4510–4520. [Google Scholar]
- 9.Mecke A, Lee I, Baker JR, Banaszak Holl MM, Orr BG. Eur Phys J E. 2004;14:7–16. doi: 10.1140/epje/i2003-10087-5. [DOI] [PubMed] [Google Scholar]
- 10.Maiti PK, Cagin T, Wang G, Goddard WA. Macromolecules. 2004;37:6236–6254. [Google Scholar]
- 11.Maiti PK, Cagin T, Lin ST, Goddard WA. Macromolecules. 2005;38:979–991. [Google Scholar]
- 12.Lin S, Maiti PK, Goddard WA. J Phys Chem. 2005;109:8663–8672. doi: 10.1021/jp0471958. [DOI] [PubMed] [Google Scholar]
- 13.Han M, Chen P, Yang X. Polymer. 2005;46:3481–3488. [Google Scholar]
- 14.Majoros IJ, Keszler B, Woehler S, Bull T, Baker JR. Macromolecules. 2003;36:5526–5529. [Google Scholar]
- 15.Quintana A, Raczka E, Piehler L, Lee I, Myc A, Majoros I, Patri AK, Thomas T, Mule J, Baker JR. Pharm Res. 2002;19:1310–1316. doi: 10.1023/a:1020398624602. [DOI] [PubMed] [Google Scholar]
- 16.Kukowska-Latallo JF, Candido KA, Cao ZY, Nigavekar SS, Majoros IJ, Thomas TP, Balogh LP, Khan MK, Baker JR. Cancer research. 2005;65:5317–5324. doi: 10.1158/0008-5472.CAN-04-3921. [DOI] [PubMed] [Google Scholar]
- 17.Islam MT, Majoros IJ, Baker JR. J Chromatography B. 2005;822:21–26. doi: 10.1016/j.jchromb.2005.05.001. [DOI] [PubMed] [Google Scholar]
- 18.Case DA, Darden TA, Cheatham TE, Simmering CL, Wang J, Duke RE, Luo R, Merz KM, Wang B, Pearlman DA, Crowley M, Brozell S, Tsui V, Gohlke H, Mongan J, Hornak V, Cui G, Beroza P, Schafmeister C, Caldwell JW, Ross WS, Kollman PA. AMBER8. 2004 [Google Scholar]
- 19.Wang J, Wolf RM, Caldwell JW, Kollman PA, Case DA. J Comput Chem. 2004;25:1157–1174. doi: 10.1002/jcc.20035. [DOI] [PubMed] [Google Scholar]
- 20.Jorgensen WL. J Am Chem Soc. 1981;103:335–340. [Google Scholar]
- 21.Lindahl E, Hess B, van der Spoel D. J Mol Mod. 2001;7:306–317. [Google Scholar]
- 22.Pastor RW, Brooks BR, Szabo A. Mol Phys. 1988;65:1409–1419. [Google Scholar]
- 23.Essmann UL, Perera L, Berkowitz ML, Darden T, Lee H, Pedersen LG. J Chem Phys. 1995;103:8577–8592. [Google Scholar]
- 24.Ryckaert JP, Ciccotti G, Berendsen HJC. J Comput Phys. 1977;23:327–336. [Google Scholar]
- 25.Humphrey W, Dalke A, Schulten K. J Molec Graphics. 1996;14:33–38. doi: 10.1016/0263-7855(96)00018-5. [DOI] [PubMed] [Google Scholar]
- 26.Choi Y, Mecke A, Orr BG, Banaszak Holl MM, Baker JR. Nano Letters. 2004;4:391–397. [Google Scholar]
- 27.Theodorou DN, Suter UW. Macromolecules. 1985;18:1206–1214. [Google Scholar]
- 28.Jeffrey GA, Saenger W. Springer-Verlag; 1991. [Google Scholar]