

Abstract
The Azaspiracids are a group of marine toxins recently described that currently includes twenty analogues. Not much is known about their mechanism of action, although effects on some cellular functions have been found in vitro. We used the reported effects on cell viability, actin cytoskeleton and caspase activation to study the structure-activity relationship of AZA-1 and AZA-2 and the role of the carboxylic acid moiety in toxicity. AZA-1, AZA-2 and the synthetic AZA-2-methyl ester (AZA-2-ME), where the C1 carboxylic acid moiety of AZA-2 was esterified to the corresponding methyl ester moiety, induced a reduction of cell viability in neuroblastoma and hepatocyte cell lines with similar potency and kinetics. Interestingly, the mast cell line HMC-1 was resistant to AZA-induced cytotoxicity. Actin cytoskeleton alterations and caspase activation appeared after treatment with AZA-1, AZA-2, AZA-2-ME and biotin-AZA-2 (AZA-2 labelled with biotin at C1) in neuroblastoma cells with similar qualitative, quantitative and kinetics characteristics. Irreversibility of AZA effects on actin cytoskeleton and cell morphology after short incubations with the toxin was common to AZA-1, AZA-2 and AZA-2-ME, however 10 fold higher concentrations of biotin-AZA-2 were needed for irreversible effects. AZA-2-ME was rapidly metabolized in the cell to AZA-2, while transformation of biotin-AZA-2 into AZA-2 was less efficient, which explains the different potency in short exposure times. The moiety present at C1 is related to AZA toxicity in vitro. However the presence of a methyl moiety at C8 is irrelevant to AZA toxicity since AZA-1 and AZA-2 were equipotent regardless the readout effect.
Keywords: azaspiracid, structure-activity relationship, cytoskeleton, caspase, cytotoxicity
Introduction
The azaspiracids1 (AZAs) are a group of phycotoxins that were discovered after they originated a toxic episode in humans in 1995 (1). The symptoms of azaspiracid poisoning (AZP) in humans include diarrhea, headache, nausea, vomiting, and stomach cramps. The chemical structure of the first compound of this class of toxins was elucidated in 1998 by Satake et al. (2), although subsequent synthetic and degradative studies by Nicolaou et al. (3-12) demonstrated that the originally proposed structure was incorrect and was therefore revised (Figure 1). More than 20 different azaspiracids have been described so far (2, 13-16). Although there is no information about toxicity of these analogues to humans, AZA-1 has been proved to be toxic to mice by p.o. administration at a minimum lethal dose of 0.25 mg/Kg (17). AZA-1, AZA-2, AZA-3, AZA-4 and AZA-5 are also toxic to mice by i.p. administration, with lethal doses of 0.2 mg/Kg, 0.11 mg/Kg, 0.14 mg/Kg, 0.47 mg/Kg and 1.0 mg/Kg respectively (2, 14, 15, 17, 18). No toxicology data are available regarding the other compounds due to the scarce amount obtained after isolation.
Figure 1.

Chemical structure of AZA-1, AZA-2, AZA-2-ME and biotin-AZA-2.
The mechanism by which AZAs induce their toxic effects and their biological target/s is still unknown. However, several effects on in vitro cell cultures have been described for AZA-1 including morphological and cytoskeletal alterations, caspase activation, cytotoxicity, cytosolic calcium and cAMP levels modulation and alteration of E-cadherin pool and neuronal network bioelectrical activity (19-26). Other studies showed effects on intracellular calcium, pH and cAMP by AZA-2 to -5 (24, 27, 28). Recent studies on structure-activity relationship, where several modifications and fragments of AZA-1 molecule were compared for in vitro toxicity, demonstrated that the whole molecule of AZA-1 was necessary for induction of cytotoxicity, cytoskeleton alterations and caspase activation (19, 20, 26). The integrity of the E ring and/or the position of the double bond in the A ring also seemed to be relevant to in vitro toxicity (19). On the contrary the stereochemistry of the ABCD rings is not related to AZA-1 activity. Although the toxicity of AZA-1 to -5 in mice could be used to establish a structure-activity relationship in the search for AZA targets, there might be pharmacokinetic issues that masked the differences or similarities among analogues. Therefore an in vitro comparison of the toxic potencies of AZA analogues within the same study would be necessary to establish a closer correlation between toxicity and binding to a cellular target.
One of the moieties of the AZA molecule that would be expected to be more reactive is the carboxylic acid moiety, which is located at C1 in all 11 analogues. In the case of okadaic acid, another phycotoxin, the carboxylic acid moiety of the molecule has a crucial role in the inhibition of two okadaic acid targets, PP2A and PP1, with an important reduction in potency (more than 5000 fold) when the okadaic molecule lacks the carboxylic acid moiety (29, 30). Our hypothesis was that the AZA carboxylic acid moiety was also required for AZA toxicity. In order to test this hypothesis the AZA-2 molecule was modified by substitution of the carboxylic acid moiety with a methyl ester moiety (AZA-2-ME, figure 1) or a biotinylated amide moiety (biotin-AZA-2, figure 1). AZA-2 and its synthetic modifications were tested for cytotoxicity, cytoskeletal alterations and caspase activation. Moreover we compared the effects and potencies of AZA-1 and AZA-2 toxicity in vitro.
Methods and Materials
Reagents
Eagle's Minimum Essential Medium (EMEM), Ham's F12, glutamine, non-essential amino acids, gentamycin, amphotericine B and penicillin/streptomycin were purchased from Biochrom AG (Berlin, Germany). Oregon Green® 514 Phalloidin and Alexa Fluor 546 goat anti-mouse antibody were obtained from Molecular Probes (Eugene, Oregon, USA). Fetal bovine serum (FBS), Ham F-12 Kaighn's modification medium, L-glutamine, NaHCO3, penicillin-G potassium salt, streptomycin sulfate salt paraformaldehyde, Triton X-100, DMSO, β-mercaptoethanol, anti-β-actin, anti-β-tubulin and glycerol were obtained from Sigma (St. Louis, MO, USA). Iscove's modified Dulbecco's medium was from Gibco (Carlsbad, CA, USA). Anti-cleaved PARP antibody was from BD Biosciences (Erembodegem, Belgium). Alamar Blue was from Biosource International (Camarillo, CA, USA). SeeBlue® pre-stained standard, Novex 10% Tris-Glycine gels and Tris-Glycine SDS-sample buffer were purchased from Invitrogen (Carlsbad, CA, USA). Nitrocellulose membrane was from Whatman (Dassel, Germany). BSA was obtained from ICN Biomedicals (Aurora, OH, USA). PBS was 137 mM NaCl, 8.2 mM Na2HPO4, 3.2 mM KCl and 1.5 mM KH2PO4, pH 7.4. Solvents used for LC-MS analysis were of HPLC or analytical grade quality. Methanol and acetonitrile were from Panreac (Spain), formic acid was from Merck (Spain) and ammonium formate was from Fluka (Switzerland).
AZA-1, AZA-2, AZA-2-ME and biotin-AZA-2 synthesis
AZA-1, AZA-2 and AZA-2-ME were synthesized as previously described by Nicolaou and co-workers (3-10). Biotin-AZA-2 was synthesized in a fashion similar to that used by Cai and co-workers (31).
Cell line culture
Human neuroblastoma BE(2)-M17 cell line (European Collection of Cell Cultures) was cultured in EMEM:Ham's F12 (1:1) supplemented with 2 mM glutamine, 1% non-essential amino acids, 10% FBS, 50 mg/L gentamycin and 50 μg/L amphotericine B. For imaging assays, neuroblastoma cells were grown on glass coverslips at a density of 2.5–5 × 10⁴ cells/well and used after 5–7 days. Clone-9 rat hepatocyte cell line was cultured in Ham F-12 Kaighn's modification supplemented with L-glutamine, NaHCO3, penicillin-G potassium salt, streptomycin sulfate salt and 10% fetal bovine serum (Gibco). HMC-1 cells were provided by Dr. J. Butterfield (Mayo Clinic, Rochester, MN) and cultured in Iscove's modified Dulbecco's medium (IMDM) supplemented with 10% fetal bovine serum (FBS), 100 IU/ml penicillin and 100 mg/ml streptomycin. Cell cultures were kept at 37 °C in 5 % CO2 and expanded weekly.
Metabolic activity assay
Cytotoxicity of AZA-1, AZA-2 and AZA-2-ME was assessed as inhibition of cell metabolism in the cell culture using the fluorescent probe Alamar blue. This redox indicator is a widely used non-toxic reagent that is added to the culture medium and changes due to cell metabolism from a non-fluorescent blue colour to a reduced pink fluorescent form (32, 33), with no washing step being required. Confluent neuroblastoma and clone 9 hepatocyte cells were detached by using trypsin and, after washing, resuspended in fresh culture medium. 5 × 10³ cells per well were seeded on 96 well plates (Nunclon) and cultured for 24 h in order to allow them to attach to the bottom of the microplate. In the case of HMC-1 (non-adherent cells), 2 × 10³ cells were added to each well. Serial dilutions of the AZAs were freshly prepared in medium and added to the wells. Vehicle (DMSO, 0.05%) controls were also included and all conditions were assayed by triplicate in every experiment. Final concentrations of azaspiracids were ranging from 0.01 nM to 100 nM. Finally, Alamar Blue was aseptically added to the culture wells following the recommendations of the commercial source, and the plates were then returned to the incubator. Alamar Blue fluorescence was measured at several times after the incubation with the toxins was started using a FL600 fluorescence plate reader (Bio-Tek, Vermont, U.S.A.). The excitation wavelength was 530 nm and the emission wavelength was 590 nm. Results are expressed as the percentage of the increment in the fluorescence of toxin-treated wells versus the increment of fluorescence in control (DMSO-treated) cells, therefore the percent value correlates to cell viability, having as reference 100 % viability in control cells.
Actin cytoskeleton imaging
Actin cytoskeleton was stained with Oregon Green® 514 Phalloidin that binds specifically to F-actin. Cells previously incubated with toxin or carrier were fixed with 4 % paraformaldehyde and permeabilized with 0.1% Triton X-100 in PBS. After blocking for 30 min with 1 % BSA/PBS the cells were incubated with 165 nM Oregon Green Phalloidin in 1 % BSA/PBS for 20 min and washed three times with PBS. The coverslips were then mounted in 50 % glycerol/PBS and sealed with nail polish. Images were captured with a Nikon Eclipse TE2000-E confocal microscope as described before (19). Confocal images are shown as volume render with maximum projection method (19).
Caspase activation
PARP (poly ADP ribose polymerase) is a target of caspases. These proteases cleave PARP at a specific site. Caspase activation was detected with an anti-cleaved PARP antibody specific for one of the fragments generated after caspase cleavage. Neuroblastoma cells were incubated with vehicle (DMSO, 0.025%) or toxin. After two washes with PBS the cells were harvested by scraping, centrifuged, lysed in sample buffer with 2.5% β-mercaptoethanol and boiled for 5 min. Cellular proteins were separated by electrophoresis and transferred to a nitrocellulose membrane. After blocking with 3% milk, the membrane was incubated with the anti-cleaved PARP antibody, washed, incubated with an anti-mouse AlexaFluor 546 and washed again. Cleavage of PARP by caspases was detected in a FX imaging system (BioRad, no pixels were saturated with fluorescence). The very same membranes were re-blotted with anti-β-actin or anti-β-tubulin as controls for lane loading, since previous studies showed that the amount of polymerized and monomeric actin per cell and the microtubule cytoskeleton are not affected after treatment with AZA-1 in spite of the change the actin cytoskeleton arrangement (19, 20, 21).
Intracellular transformation of AZA-2-ME and biotin-AZA-2 into AZA-2
Neuroblastoma cells were incubated in the presence of 100 nM AZA-2-ME or 500 nM biotin-AZA-2 for 10 min. Alternatively, after 10 min of incubation with the toxin, the cells were incubated without toxin for 1 h following 3 washes in toxin free medium. When the incubation time was completed, the plates were placed on ice for 5 min and washed 3 times with 1 ml ice-cold PBS. Then the cells were collected in 1 ml PBS by scraping the well plate surface and centrifuged. The cell pellet was suspended in 60-70 μl of methanol and filtered through a 0.45 μm pore size filter (Millipore, Spain). AZA-2, AZA-2-ME and biotin-AZA-2 were quantified in the methanol cell extracts by LC-MS. A HPLC system (Shimadzu, Japan) was coupled to a QTRAP LC/MS/MS system (Applied Biosystems, USA). HPLC separation was achieved in a BDS-Hypersil C8 3 μm (50 × 2 mm) column (Phenomenex, USA) with a 10 × 2.1 mm guard cartridge (Thermo, USA) at 25°C. The injection volume was 5 μl. Mobile phase consisted of 2 mM ammonium formate and 50 mM formic acid in water in pump A and acetonitrile:water (95:5) with 2 mM ammonium formate and 50 mM formic acid in pump B. The analysis was carried out with a constant flow of 0.2 ml min-1 and a run time of 18 minutes. In each run %B started at 30%, achieving 90% at minute 8, conditions that were held during 3 minutes, the %B decreased to 30% at minute 11.5 and it was maintained until the next run. The samples were analyzed with the ESI interface operating in positive mode after optimization of MS parameters with the toxin stock solutions. The mass spectrometer was operated in multiple reaction monitoring (MRM), analyzing two product ions per compound. Transitions selected were 856.700>838.700/820.700 for AZA-2, 870.579>852.579/834.579 for methyl AZA-2 and 1124.840>1106.600/1088.600 for biotin AZA-2. Quantification was done with the most abundant ion: 838.700 (AZA-2), 852.579 (methyl AZA-2) and 1106.600 (biotin AZA-2).
Statistical analysis
For statistical significance p<0.05 by an ANOVA paired test with Tukey multiple comparison post-test was used in the cytotoxicity studies. In the metabolic transformation studies, a paired t-test, p<0.05, was used for statistical significance.
Results
AZA-1, AZA-2 and AZA-2-ME effects on cell viability of several cell models
The viabilility of neuroblastoma BE(2)-M17 cells, clone 9 hepatocytes and HMC-1 mast cells was assessed using the metabolic activity marker Alamar Blue after exposure to several concentrations of synthetic AZA-1, AZA-2 and AZA-2-ME for varying periods of time. AZA-1, AZA-2 and AZA-2-ME induced a significant reduction of neuroblastoma cell viability at concentrations of 1 nM and higher, and times of exposure to the toxin longer than 36 h (figure 2A,B&C). At earlier time points no effect on cell viability was detected for any concentration tested. Similarly to neuroblastoma cells, clone 9 hepatocytes showed a decrease of cell viability only at times of exposure longer than 36 h, although the effect seemed to be slightly weaker than in neuroblastoma cells (figure 2D,E&F). Again the three higher concentrations of toxin (1,10 and 100 nM) seemed to induce a similar reduction of cell viability, while the lower concentrations (0.1 and 0.01 nM) seemed to have no effect. However, in the case of hepatocytes statistical significance was achieved only for a few points in the AZA-1 and AZA-2 inhibition curves (figure 2D,E&F). HMC-1 viability was not affected by any of the three compounds (figure 2G,H&I), even when the concentration of the toxins was raised up to 1 μM (data not shown). No significant differences were found among the three toxins at any concentration tested in neuroblastoma cells or clone 9 hepatocytes, suggesting that the potencies of AZA-1, AZA-2 and AZA-2-ME are similar. However, the AZA-2-ME molecule seemed to induce a weaker reduction of cell viability in clone 9 hepatocytes.
Figure 2.

Cell metabolism inhibition induced by AZA-1, AZA-2 and AZA-2-ME in neuroblastoma BE(2)-M17 cells (A,B and C), clone 9 hepatocytes (D, E and F) and HMC-1 mast cells (G, H and I). The cells were incubated for varying periods of time in the presence of 0.01, 0.1, 1, 10 and 100 nM concentrations of AZA-1, AZA-2 and AZA-2-ME. Cell metabolism was evaluated using Alamar Blue, which is reduced by viable cells into a fluorescent form. The results are expressed as percentage of control fluorescence that is equivalent to cell viability. Control cells were considered as the 100% viability reference at every time point. Mean ± S.E.M. (* statistical significance, p<0.05. Where data points overlap, the number of * indicates the number of points that were significantly different).
Effects of AZA-1, AZA-2, AZA-2-ME and biotin-AZA-2 on actin cytoskeleton and caspase activation in neuroblastoma cells
Human neuroblastoma BE(2)-M17 cells were treated with AZA-1, AZA-2, AZA-2-ME and biotin-AZA-2 and stained with Oregon Green Phalloidin in order to visualize actin cytoskeleton. The results showed that the four compounds induced similar changes in cell morphology and actin cytoskeleton (figure 3). Moreover, the potency of the four compounds was very similar for the induction of cytoskeletal alterations during continuous exposure experiments with an observable change in morphology at a 10 nM concentration and above (images obtained for 50 and 100 nM concentrations looked like cells treated with 10 nM for the four molecules and therefore were not included in figure 3). The cells treated with concentrations of 0.01, 0.1 and 1 nM looked like DMSO controls. The kinetics of these morphological changes was also similar for the four compounds, with a clear change in cell shape and actin cytoskeleton morphology at times of 24 h and longer. In a previous work, it was shown that AZA-1 effects on actin cytoskeleton were irreversible (20). In order to know if the modifications in the AZA-2 structure versus AZA-1 and the carboxylic acid moiety affected irreversibility, the cells were incubated with 10, 25 and 50 nM AZA-1, AZA-2, AZA-2-ME and biotin-AZA-2 for 10 min, washed twice with toxin-free culture medium and incubated in the absence of toxin for 48 h. AZA-2 and AZA-2-ME (figure 4), as well as AZA-1 (data not shown), had irreversible effects on neuroblastoma cells after only 10 min of incubation in the presence of concentrations of toxin higher than 25 nM. However, 50 nM biotin-AZA-2 did not have irreversible effects on cell morphology or actin cytoskeleton of neuroblastoma cells when the exposure time was 10 min. In this case the exposure time had to be increased to 60 min to observe cytoskeleton and morphological alterations 47 h later (data not shown). In order to obtain irreversible effects on the cell morphology and the actin cytoskeleton with only a 10 min exposure to the toxin, the concentration of biotin-AZA-2 had to be 10 times higher than the concentration of the other three compounds (figure 4). Biotin alone did not induce any morphological/cytoskeleton changes at a concentration of 1 μM for 48 h in neuroblastoma cells. Moreover the presence of 1 μM biotin in the culture medium did not reduce the effective concentration of biotin-AZA-2 in the irreversibility experiments. The morphological/cytoskeletal changes observed at 48 h were identical for the cells that were exposed to an effective concentration of toxin for the whole period of 48 h (figure 3) or only for the first 10 min (Figure 4).
Figure 3.
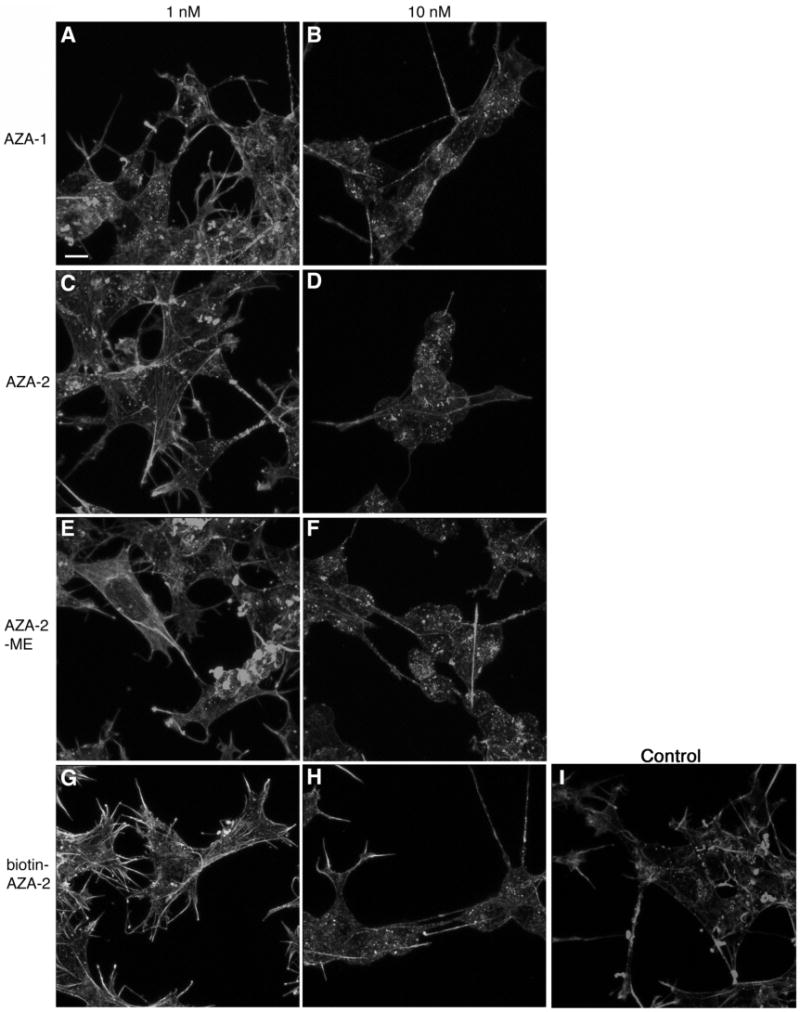
Effect of AZA-1, AZA-2, AZA-2-ME and biotin-AZA-2 on actin cytoskeleton of neuroblastoma BE(2)-M17 cells. Human neuroblastoma cells were incubated with concentrations of 1 and 10 nM of AZA-1 (A and B), AZA-2 (C and D), AZA-2-ME (E and F), biotin-AZA-2 (G and H) for 48 h. Control cells (I) were incubated with carrier in the same conditions as toxin-treated cells. Actin cytoskeleton was labelled with Oregon Green® 514 Phalloidin. Bar size: 10 μm. Representative of 3 experiments.
Figure 4.

Irreversible effects of AZA-2, AZA-2-ME and biotin-AZA-2 on actin cytoskeleton of neuroblastoma BE(2)-M17 cells. Human neuroblastoma cells were incubated with concentrations of 10, 25 and 50 nM of AZA-2 (A, B and C) and AZA-2-ME (D, E and F) and 100, 250 and 500 nM of biotin-AZA-2 (G, H and I) for 10 min. Then the cells were washed twice with a toxin-free medium and incubated in the absence of toxin for a total time of 48 h. Control cells (J) were incubated with carrier in the same conditions as toxin-treated cells. Actin cytoskeleton was labelled with Oregon Green® 514 Phalloidin. Bar size: 10 μm. Representative of 3 experiments.
Caspase activation by AZA-1 in neuroblastoma cells was reported in a previous work. Since it is not known if caspase activation is an event independent of cytoskeleton alterations it has been included in this study as a third readout of azaspiracid in vitro toxicity. Cleavage of PARP by activated caspases was detected with an antibody specific for a caspase-cleaved PARP fragment. Cleaved PARP appeared after 48 h of incubation with 50 nM AZA-1, AZA-2, AZA-2-ME and biotin-AZA-2 but not at 24 h (figure 5). AZA-1, AZA-2, AZA-2-ME and biotin-AZA-2 activated caspases in a similar degree. The kinetics of AZA-induced caspase activation detected by PARP cleavage for the four toxins mimicked the kinetics described previously with a FLICA (fluorescence inhibitor of caspases) detection method in AZA-1 treated neuroblastoma cells.
Figure 5.
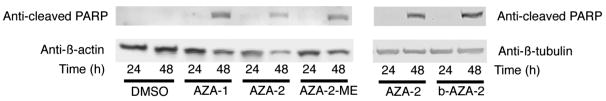
Caspase activation by AZA-1, AZA-2, AZA-2-ME and biotin-AZA-2 in neuroblastoma cells. Human neuroblastoma cells were incubated in the presence of 50 nM AZA-1, AZA-2, AZA-2-ME and biotin-AZA-2 for 24 or 48 h. The upper panels shown caspase activation detected with an anti-cleaved PARP antibody specific for caspase-cleaved PARP fragment. In the lower panels the same membranes were re-blotted for β-actin or β-tubulin. Representative of 3 experiments.
Intracellular transformation of AZA-2-ME and biotin-AZA-2 to AZA-2
The transformation of AZA-2-ME and biotin-AZA-2 into AZA-2 by the neuroblastoma cells was studied using LC-MS. The percentage of AZA-2 in cells incubated with AZA-2-ME increased from a 12.8 ± 0.3 % of total AZA molecules in the AZA-2-ME stock solution to a 27.5 ± 2.8 % in cells incubated with 100 nM AZA-2-ME for 10 min (figure 6A). In these experimental conditions the incubation was stopped while the cells were still in a medium containing AZA-2-ME, and therefore the intracellular AZA-2-ME contained in a total cell volume of a few μl was in equilibrium with the extracellular AZA-2-ME contained in 3.2 ml of culture medium. To avoid the underestimation of AZA-2 percentage due to the practically unlimited source of AZA-2-ME from the culture medium, the cells were washed twice with toxin-free medium after the 10 min incubation with AZA-2-ME and incubated for 1 h in the absence of toxin. In these experiments the percentage of AZA-2 was increased to a 56.2 ± 12.5 % of total AZA molecules (figure 6A). Actually in these conditions a decrease of the amount of AZA-2-ME was accompanied by an increase of the amount of AZA-2. For example, when the sum of AZAs (AZA-2 + AZA-2-ME) in the stock solution as measured by LC-MS was 72.05 pg/ml consisting of 62.5 and 9.55 pg/ml AZA-2-ME and AZA-2 respectively, after 10 min of incubation in the presence of toxin a cell lysate that contained 70.5 pg/ml AZAs had 47.5 and 23 pg/ml AZA-2-ME and AZA-2 respectively. In a single test, 1 h of incubation in the continuous presence of toxin yielded a percentage of AZA-2 similar to a 10 min incubation and a net toxin amount inside the cells slightly higher. Moreover, a 1 h incubation in the absence of toxin after a 10 min exposure to these molecules determined the loss of 57.7 ± 9.8 % (n=2, mean ± sem) of the total toxin amount measured at 10 min in AZA-2 incubated cells and the loss of 58.5 ± 14.5 % (n=4, mean ± sem) in AZA-2-ME incubated cells. Unfortunately, for technical reasons the measurement of the toxin lost to the extracellular medium during this 1 h period was not possible due to sensitivity limitations of the technique and toxin availability. If the increase of AZA-2 percentage was due to a selective, complete degradation of AZA-2-ME versus AZA-2 instead of a transformation of one molecule into the other one, the percentage of toxin loss during the 1 h incubation without toxin after a 10 min exposure would have to be higher for the cells incubated with AZA-2-ME than for those incubated with AZA-2. The transformation of biotin-AZA-2 into AZA-2 in the same experimental conditions was much less efficient, but nevertheless existent. The concentration of biotin-AZA-2 in the culture medium had to be increased to 500 nM in order to generate an amount of AZA-2 in the cells within the range of sensitivity of the LC-MS method. After 10 min of incubation with the biotinylated molecule, AZA-2 was already detectable in the cells, although the percentage of AZA-2 related to the total content of AZA molecules was as low as 1.88 ± 0.47 % even after 1 h of incubation in a toxin-free medium (figure 6B). A full kinetic study to determine toxin entry rate into the cell could not be performed because of toxin availability limitations, however after a 10 min incubation with 100 nM of AZA-2, AZA-2-ME and biotin-AZA-2 the amount of AZAs measured in the cell extract was similar for the 3 compounds, with an average value of 121.5 ± 11.5, 141.2 ± 24.7 and 89.5 ± 9.5 pg/ml for AZA-2, AZA-2-ME and biotin-AZA-2 respectively (n=2, 4 and 2 respectively, mean ± sem, it should be considered that normalization vs. cell number was not possible due to toxin availability limitations that precluded the measurement of any other assay parameters, therefore, these results are subject to cell number variations per extract from one condition and/or experiment to another).
Figure 6.

Transformation of AZA-2-ME and biotin-AZA-2 into AZA-2 by neuroblastoma cells. (A) AZA-2 and AZA-2-ME percentage of total AZA molecules in the AZA2-ME stock solution, in neuroblastoma cells incubated for 10 min with 100 nM AZA-2-ME and in neuroblastoma cells incubated for 10 min with 100 nM AZA-2-ME with a posterior incubation of 1 h in a toxin-free medium (n=4, mean ± SEM, * statistical significance vs. toxin stock, p<0.05). (B) AZA-2 and biotin-AZA-2 percentage of total AZA molecules in the biotin-AZA-2 stock solution, in neuroblastoma cells incubated for 10 min with 500 nM biotin-AZA-2 and in neuroblastoma cells incubated for 10 min with 500 nM biotin-AZA-2 with a posterior incubation of 1 h in a toxin-free medium (n=4, mean ± SEM, * statistical significance vs. toxin stock, p<0.05).
Discussion
The structure-activity relationship of a toxin or group of toxins provides valuable information that can be useful to understand toxic potency and molecular interactions, to find targets, to develop detection methods or even possible antidotes and therapeutic strategies. There is a growing body of evidence related to the structure-activity relationship of marine phycotoxins. Regarding AZAs, their in vivo toxicity, reported as LD in mice, suggests that the differences in the molecules of AZA-1, AZA-2 (additional methyl moiety at C8) and AZA-3 (loss of methyl group at C22) do not seem to affect the ability of the molecule to exert toxic effects, since the LD values are quite close (0.2 mg/Kg, 0.11 mg/Kg and 0.14 mg/Kg respectively) (2, 15, 17, 18). Although we could order these compounds as AZA-2 having a higher toxicity than AZA-3, followed by AZA-1, the determination of the reported LDs was done in different studies and therefore the comparison of compound toxicity has to be taken cautiously. However, the presence of hydroxyl moieties in the backbone of the AZA-3 molecule seems to reduce the toxicity, with AZA-4 (OH at C8) having a reported LD of 0.45 mg/Kg and AZA-5 (OH at C23) having a reported LD of 1 mg/Kg (14). This comparison of LDs provides a structure-toxicity relationship, but assignment of a relationship between structure and activity at the molecular level might not be accurate due to possible pharmacokinetic variations among molecules. In this study we show that AZA-1 and AZA-2 induce a reduction of cell viability, cytoskeletal alterations and caspase activation with the same potency, kinetics and irreversibility in cell cultures. Although AZA-1 and AZA-2 have been shown to have effects on intracellular calcium and cAMP in lymphocytes before (23, 24), an in vitro comparison of the potencies of both molecules within the same experiment had not been reported yet. Besides, although in these separate studies the effects of AZA-1 and AZA-2 on intracellular calcium were not qualitatively similar, the concentration required for these effects to occur was relatively high (more than 20 times higher than that required for cytotoxicity and cytoskeletal alterations), which speaks against their specificity and points to the involvement in the calcium modulation of cellular molecules less sensitive to AZAs than those involved in cytotoxicity and cytoskeleton alterations. The results presented in this study provide a closer look at the structure-molecular activity relationship suggesting that the presence (AZA-2) or absence (AZA-1) of a methyl moiety at C8 does not affect AZAs activity at a molecular level in highly sensitive cellular targets. However, we should not forget that at the cellular level there are still issues such as membrane permeability and cell compartmentalization that might affect the final data, so complementary information about molecular interactions will be needed when the target/s of AZAs is found.
Additionally, modifications of the AZA-1 molecule generated in the laboratory have been also used in structure-activity studies. Several fragments of the AZA-1 molecule, including ABCD rings, ABCDE rings and FGHI rings, demonstrated no in vitro toxicity in conditions where AZA-1 induced cytotoxicity, caspase activation and cytoskeleton/ morphological alterations (19, 20, 26), suggesting that the whole molecule is necessary for toxicity. The stereochemistry of the ABCD rings within the AZA-1 molecule does not affect toxicity, since AZA-1 and ABCD-epi-AZA-1 (where the ABCD domain is enantiomeric to AZA-1) have the same toxic effects in vitro (19, 20, 26). In this study we demonstrate that in vitro toxicity of the AZA-2 molecule is dependent on its carboxylic acid moiety, one of the more reactive moieties of the molecule. The evidence is provided by the comparison of the toxic effects of three molecules, AZA-2, AZA-2-ME and biotin-AZA-2 that differ only in the presence of a carboxylic acid group, a methyl ester group or a biotinylated amide linker at C1. The inhibition of cell viability by AZA-2 and AZA-2-ME (biotin-AZA-2 effect on viability was not tested due to availability issues), as well as the actin cytoskeleton alterations and the activation of caspases in neuroblastoma cells by AZA-2, AZA-2-ME and biotin-AZA-2 are similar in intensity and kinetics for the three molecules. However, when the irreversibility of the effects induced by these molecules was explored, biotin-AZA-2 needed higher concentrations (10 times) or longer exposure times than AZA-2 and AZA-2-ME. These results could have different explanations. First, the carboxylic acid moiety of the AZA-2 molecule could be irrelevant to toxicity but the plasma membrane permeability of the biotin-AZA-2 molecule would be reduced. Second, the carboxylic acid moiety of the AZA-2 molecule could be irrelevant to toxicity but bitotin-AZA-2 might be captured through its biotin by other cellular molecules not related to toxicity. Third, the two AZA-2 synthetic modifications could be metabolized by cellular enzymes into AZA-2 at different rates. Regarding the first possibility mentioned above, AZA-2, AZA-2-ME and biotin-AZA-2 were readily detected inside neuroblastoma cells after 10 min of incubation by LC-MS without apparent differences in membrane permeability. Following the second line of thought, the incubation in the presence of biotin did not reduce the high dose of biotin-AZA-2 needed to exert an effect during irreversibility studies, suggesting that sequestration of biotin-AZA-2 by biotin targets was not a factor in the reduction of biotin-AZA-2 potency. Additionally, the presence of a 12-13 % AZA-2 in the AZA-2-ME stock solution would not explain the similar potency of AZA-2 and AZA-2-ME. In fact, the results obtained for the irreversibility studies could be attributed to a contamination of the AZA-2-ME stock with AZA-2 only if AZA-2 was higher than 40%. The close match of the cytotoxicity results for AZA-2 and AZA-2-ME in neuroblastoma cells cannot be explained either by the 12-13% contamination of the AZA-2-ME. We present evidence of a quick metabolism of AZA-2-ME to AZA-2 in neuroblastoma cells, while biotin-AZA-2 transformation into AZA-2 is much less efficient. This intracellular transformation of AZA-2-ME, that reaches percentages of AZA-2 higher than 50% in short exposure experiments, is not surprising since it is well known the presence of very active intracellular esterases in many cellular models. As discussed above, levels of AZA-2 higher than 40% would actually account for the effects obtained during the irreversibility experiments in neuroblastoma cells. A lower rate of AZA-2-ME transformation in clone 9 hepatocytes would explain the seemingly lower cytotoxicity of this compound versus the neuroblastoma cell line. Apparently, the transformation of biotin-AZA-2 into AZA-2 is a slower process, which would be expected based on the amide bond being stronger than the corresponding ester bond of AZA-2-ME. Only when the concentration of biotin-AZA-2 is high enough or the incubation with biotin-AZA-2 is long enough, the amount of AZA-2 generated is sufficient to induce the reported in vitro toxic effects. These results suggest that the chemical group present at C1 is critical for AZA-2 to exert its in vitro toxicity. The loss of toxicity by modification of the carboxylic acid moiety was previously reported for okadaic acid with an important reduction of its protein phosphatase inhibition activity (29, 30). Since AZA-1 and AZA-2 are so similar in structure and effects, then presumably, AZA-1 activity is also dependent on the C1 substituent.
The in vitro toxic effects chosen for this structure-activity study had been described previously. The reduction of cell viability in the presence of AZA-1 has been shown in tumour cell cultures and primary cells. Neuroblastoma, B and T lymphocyte, monocyte, lung epithelial, renal and pituitary epithelial cell lines and mouse primary neurons are known to be sensitive to AZA-1-induced cytotoxicity (20, 21, 26). In our hands, AZA-1 and -2 were also cytotoxic to the clone 9 rat hepatocyte cell line, however human HMC-1 mast cells were resistant to AZA-induced cytotoxicity. To our knowledge this is the first report of an AZA resistant cell type, which can help to understand AZA toxicity and possible applications in cancer therapy. Cytoskeletal changes usually precede cytotoxicity in the cell death cascade and therefore the AZA-induced effects described in this paper could be consecutive events within the same chain reaction. The kinetics of morphological/cytoskeletal alterations seem to be faster, with clear effects at 24 h (19), than the reduction of cell viability, detectable at 36 h. This delayed reduction in cell viability is in agreement with the also relatively late activation of caspases. However a causal relationship between cytoskeleton alterations and cytotoxicity has not been demonstrated yet in AZA-treated cells and it is also possible that these effects are parallel or independent. Actually, the characteristics of AZA-induced morphological/cytoskeletal alterations and cytotoxicity in neuroblastoma cells suggest that these two events might be unrelated. Cell viability is sensitive to lower concentrations of AZAs with a significant reduction of cell viability at 1 nM, concentration that does not induce cytoskeleton alterations. Therefore, it is possible that AZAs exert their toxicity through more than one target. And in that case the moiety located at C1 would, and the C8 methyl moiety would not, be implicated in the activity of AZA-1 and AZA-2 on the targets responsible for the in vitro effects tested in this work, but the situation might be different for other, still unknown activities.
In summary, AZA-1 and AZA-2 have very similar toxic activities in terms of cytotoxicity and cytoskeleton alterations, with no qualitative or quantitative differences between the two molecules. Moreover, AZA-2 toxic activity seems to be dependent on the moiety present at C1 position, as cellular transformation of AZA-2-ME and biotin-AZA-2 to AZA-2 in the cells explains their in vitro effects on cell cultures.
Acknowledgments
Professor Nicolaou acknowledges financial support for this work from The Skaggs Institute for Chemical Biology, the National Institutes of Health (USA), a predoctoral fellowship from the National Science Foundation (to M. O. F.), and grants from Amgen and Merck. The spanish work was funded with grants from the following agencies: Ministerio de Ciencia y Tecnología, Grant Number: SAF2003-08765-C03-02, REN2001-2959-C04-03, REN2003-06598-C02-01, AGL2004-08268-02-O2/ALI, INIA CAL01-068. Xunta de Galicia, Spain; PGIDT99INN26101, PGIDIT03AL26101PR and PGIDIT04TAL261005PR. Fondo de Investigaciones Sanitarias, Grant Number: FISS REMA-G03-007. EU VIth Frame Program; Grant Number: IP FOOD-CT-2004-06988 (BIOCOP), STREP FOOD-CT-2004-514055 (DETECTOX) and CRP 030270-2 (SPIES-DETOX).
Footnotes
ABREVIATIONS: AZA, Azaspiracid; EMEM, Eagle's Minimum Essential Medium; HBSS, Hank's balanced salt solution; DMSO, dimethylsulfoxide; BSA, bovine serum albumin; PBS, phosphate buffered saline; i.p., intraperitoneal; p.o., per os or oral administration; IMDM, Iscove's modified Dulbecco's medium; FBS, fetal bovine serum; PARP, poly ADP ribose polymerase, HMC-1, human mastocytoma cell line-1; LD, lethal dose.
References
- 1.McMahon T, Silke J. Winter toxicity of unknown aetiology in mussels. Harmful Algae News. 1996;14:2. [Google Scholar]
- 2.Satake M, Ofuji K, Naoki H, James K, Furey A, McMahon T, Silke J, Yasumoto T. Azaspiracid, a new marine toxin having unique spiro ring assemblies, isolated from Irish mussels, Mytilus edulis. J Am Chem Soc. 1998;120:9967–9968. [Google Scholar]
- 3.Nicolaou KC, Chen DY, Li Y, Qian W, Ling T, Vyskocil S, Koftis TV, Govindasamy M, Uesaka N. Total synthesis of the proposed azaspiracid-1 structure, part 2: coupling of the C1-C20, C21-C27, and C28-C40 fragments and completion of the synthesis. Angew Chem Int Ed Engl. 2003;42:3649–3653. doi: 10.1002/anie.200351826. [DOI] [PubMed] [Google Scholar]
- 4.Nicolaou KC, Chen DY, Li Y, Uesaka N, Petrovic G, Koftis TV, Bernal F, Frederick MO, Govindasamy M, Ling T, Pihko PM, Tang W, Vyskocil S. Total synthesis and structural elucidation of azaspiracid-1. Synthesis-based analysis of originally proposed structures and indication of their non-identity to the natural product. J Am Chem Soc. 2006;128:2258–2267. doi: 10.1021/ja054748z. [DOI] [PubMed] [Google Scholar]
- 5.Nicolaou KC, Frederick MO, Petrovic G, Cole KP, Loizidou EZ. Total synthesis and confirmation of the revised structures of azaspiracid-2 and azaspiracid-3. Angew Chem Int Ed Engl. 2006;45:2609–2615. doi: 10.1002/anie.200600295. [DOI] [PubMed] [Google Scholar]
- 6.Nicolaou KC, Koftis TV, Vyskocil S, Petrovic G, Ling T, Yamada YM, Tang W, Frederick MO. Structural revision and total synthesis of azaspiracid-1, part 2: definition of the ABCD domain and total synthesis. Angew Chem Int Ed Engl. 2004;43:4318–4324. doi: 10.1002/anie.200460696. [DOI] [PubMed] [Google Scholar]
- 7.Nicolaou KC, Koftis TV, Vyskocil S, Petrovic G, Tang W, Frederick MO, Chen DY, Li Y, Ling T, Yamada YM. Total synthesis and structural elucidation of azaspiracid-1. Final assignment and total synthesis of the correct structure of azaspiracid-1. J Am Chem Soc. 2006;128:2859–2872. doi: 10.1021/ja054750q. [DOI] [PubMed] [Google Scholar]
- 8.Nicolaou KC, Li Y, Uesaka N, Koftis TV, Vyskocil S, Ling T, Govindasamy M, Qian W, Bernal F, Chen DY. Total synthesis of the proposed azaspiracid-1 structure, part 1: construction of the enantiomerically pure C1-C20, C21-C27, and C28-C40 fragments. Angew Chem Int Ed Engl. 2003;42:3643–3648. doi: 10.1002/anie.200351825. [DOI] [PubMed] [Google Scholar]
- 9.Nicolaou KC, Pihko PM, Bernal F, Frederick MO, Qian W, Uesaka N, Diedrichs N, Hinrichs J, Koftis TV, Loizidou E, Petrovic G, Rodriquez M, Sarlah D, Zou N. Total synthesis and structural elucidation of azaspiracid-1. Construction of key building blocks for originally proposed structure. J Am Chem Soc. 2006;128:2244–2257. doi: 10.1021/ja0547477. [DOI] [PubMed] [Google Scholar]
- 10.Nicolaou KC, Vyskocil S, Koftis TV, Yamada YM, Ling T, Chen DY, Tang W, Petrovic G, Frederick MO, Li Y, Satake M. Structural revision and total synthesis of azaspiracid-1, part 1: intelligence gathering and tentative proposal. Angew Chem Int Ed Engl. 2004;43:4312–4318. doi: 10.1002/anie.200460695. [DOI] [PubMed] [Google Scholar]
- 11.Nicolaou KC, Frederick MO, Loizidou EZ, Petrovic G, Cole KP, Koftis TV, Yamada YM. Second-generation total synthesis of azaspiracids-1, -2, and -3. Chem Asian J. 2006;1:245–263. doi: 10.1002/asia.200600059. [DOI] [PubMed] [Google Scholar]
- 12.Rehmann N, Hess P, Quilliam MA. Discovery of new analogs of the marine biotoxin azaspiracid in blue mussels (Mytilus edulis) by ultra-performance liquid chromatography/tandem mass spectrometry. Rapid Commun Mass Spectrom. 2008;22:549–558. doi: 10.1002/rcm.3385. [DOI] [PubMed] [Google Scholar]
- 13.James KJ, Sierra MD, Lehane M, Brana Magdalena A, Furey A. Detection of five new hydroxyl analogues of azaspiracids in shellfish using multiple tandem mass spectrometry. Toxicon. 2003;41:277–283. doi: 10.1016/s0041-0101(02)00288-x. [DOI] [PubMed] [Google Scholar]
- 14.Ofuji K, Satake M, McMahon T, James KJ, Naoki H, Oshima Y, Yasumoto T. Structures of azaspiracid analogs, azaspiracid-4 and azaspiracid-5, causative toxins of azaspiracid poisoning in Europe. Biosci Biotechnol Biochem. 2001;65:740–742. doi: 10.1271/bbb.65.740. [DOI] [PubMed] [Google Scholar]
- 15.Ofuji K, Satake M, McMahon T, Silke J, James KJ, Naoki H, Oshima Y, Yasumoto T. Two analogs of azaspiracid isolated from mussels, Mytilus edulis, involved in human intoxication in Ireland. Nat Toxins. 1999;7:99–102. doi: 10.1002/(sici)1522-7189(199905/06)7:3<99::aid-nt46>3.0.co;2-l. [DOI] [PubMed] [Google Scholar]
- 16.Volmer DA, Brombacher S, Whitehead B. Studies on azaspiracid biotoxins. I. Ultrafast high-resolution liquid chromatography/mass spectrometry separations using monolithic columns. Rapid Commun Mass Spectrom. 2002;16:2298–2305. doi: 10.1002/rcm.851. [DOI] [PubMed] [Google Scholar]
- 17.Ito E, Satake M, Ofuji K, Higashi M, Harigaya K, McMahon T, Yasumoto T. Chronic effects in mice caused by oral administration of sublethal doses of azaspiracid, a new marine toxin isolated from mussels. Toxicon. 2002;40:193–203. doi: 10.1016/s0041-0101(01)00226-4. [DOI] [PubMed] [Google Scholar]
- 18.Ito E, Satake M, Ofuji K, Kurita N, McMahon T, James K, Yasumoto T. Multiple organ damage caused by a new toxin azaspiracid, isolated from mussels produced in Ireland. Toxicon. 2000;38:917–930. doi: 10.1016/s0041-0101(99)00203-2. [DOI] [PubMed] [Google Scholar]
- 19.Vilarino N, Nicolaou KC, Frederick MO, Cagide E, Ares IR, Louzao MC, Vieytes MR, Botana LM. Cell Growth Inhibition and Actin Cytoskeleton Disorganization Induced by Azaspiracid-1 Structure-Activity Studies. Chem Res Toxicol. 2006;19:1459–1466. doi: 10.1021/tx060131z. [DOI] [PubMed] [Google Scholar]
- 20.Vilarino N, Nicolaou KC, Frederick MO, Vieytes MR, Botana LM. Irreversible cytoskeletal disarrangement is independent of caspase activation during in vitro azaspiracid toxicity in human neuroblastoma cells. Biochem Pharmacol. 2007;74:327–335. doi: 10.1016/j.bcp.2007.04.004. [DOI] [PubMed] [Google Scholar]
- 21.Twiner MJ, Hess P, Dechraoui MY, McMahon T, Samons MS, Satake M, Yasumoto T, Ramsdell JS, Doucette GJ. Cytotoxic and cytoskeletal effects of azaspiracid-1 on mammalian cell lines. Toxicon. 2005;45:891–900. doi: 10.1016/j.toxicon.2005.02.015. [DOI] [PubMed] [Google Scholar]
- 22.Kulagina NV, Twiner MJ, Hess P, McMahon T, Satake M, Yasumoto T, Ramsdell JS, Doucette GJ, Ma W, O'Shaughnessy TJ. Azaspiracid-1 inhibits bioelectrical activity of spinal cord neuronal networks. Toxicon. 2006;47:766–773. doi: 10.1016/j.toxicon.2006.02.011. [DOI] [PubMed] [Google Scholar]
- 23.Roman Y, Alfonso A, Louzao MC, de la Rosa LA, Leira F, Vieites JM, Vieytes MR, Ofuji K, Satake M, Yasumoto T, Botana LM. Azaspiracid-1, a potent, nonapoptotic new phycotoxin with several cell targets. Cell Signal. 2002;14:703–716. doi: 10.1016/s0898-6568(02)00015-3. [DOI] [PubMed] [Google Scholar]
- 24.Roman Y, Alfonso A, Vieytes MR, Ofuji K, Satake M, Yasumoto T, Botana LM. Effects of Azaspiracids 2 and 3 on intracellular cAMP, [Ca2+], and pH. Chem Res Toxicol. 2004;17:1338–1349. doi: 10.1021/tx0341862. [DOI] [PubMed] [Google Scholar]
- 25.Ronzitti G, Hess P, Rehmann N, Rossini GP. Azaspiracid-1 alters the E-cadherin pool in epithelial cells. Toxicol Sci. 2007;95:427–435. doi: 10.1093/toxsci/kfl167. [DOI] [PubMed] [Google Scholar]
- 26.Vale C, Nicolaou KC, Frederick MO, Gomez-Limia B, Alfonso A, Vieytes MR, Botana LM. Effects of azaspiracid-1, a potent cytotoxic agent, on primary neuronal cultures. A structure-activity relationship study. J Med Chem. 2007;50:356–363. doi: 10.1021/jm061063g. [DOI] [PubMed] [Google Scholar]
- 27.Alfonso A, Roman Y, Vieytes MR, Ofuji K, Satake M, Yasumoto T, Botana LM. Azaspiracid-4 inhibits Ca2+ entry by stored operated channels in human T lymphocytes. Biochem Pharmacol. 2005;69:1627–1636. doi: 10.1016/j.bcp.2005.03.022. [DOI] [PubMed] [Google Scholar]
- 28.Alfonso A, Vieytes MR, Ofuji K, Satake M, Nicolaou KC, Frederick MO, Botana LM. Azaspiracids modulate intracellular pH levels in human lymphocytes. Biochem Biophys Res Commun. 2006;346:1091–1099. doi: 10.1016/j.bbrc.2006.06.019. [DOI] [PubMed] [Google Scholar]
- 29.Honkanen RE, Codispoti BA, Tse K, Boynton AL, Honkanan RE. Characterization of natural toxins with inhibitory activity against serine/threonine protein phosphatases. Toxicon. 1994;32:339–350. doi: 10.1016/0041-0101(94)90086-8. [DOI] [PubMed] [Google Scholar]
- 30.Takai A, Murata M, Torigoe K, Isobe M, Mieskes G, Yasumoto T. Inhibitory effect of okadaic acid derivatives on protein phosphatases. A study on structure-affinity relationship. Biochem J. 1992;284:539–544. doi: 10.1042/bj2840539. [DOI] [PMC free article] [PubMed] [Google Scholar]
- 31.Zhang HZ, Kasibhatla S, Wang Y, Herich J, Guastella J, Tseng B, Drewe J, Cai SX. Discovery, characterization and SAR of gambogic acid as a potent apoptosis inducer by a HTS assay. Bioorg Med Chem. 2004;12:309–317. doi: 10.1016/j.bmc.2003.11.013. [DOI] [PubMed] [Google Scholar]
- 32.O'Brien J, Wilson I, Orton T, Pognan F. Investigation of the Alamar Blue (resazurin) fluorescent dye for the assessment of mammalian cell cytotoxicity. Eur J Biochem. 2000;267:5421–5426. doi: 10.1046/j.1432-1327.2000.01606.x. [DOI] [PubMed] [Google Scholar]
- 33.Takahashi T, Maruyama W, Deng Y, Dostert P, Nakahara D, Niwa T, Ohta S, Naoi M. Cytotoxicity of endogenous isoquinolines to human dopaminergic neuroblastoma SH-SY5Y cells. J Neural Transm. 1997;104:59–66. doi: 10.1007/BF01271294. [DOI] [PubMed] [Google Scholar]