

Abstract
New and more biologically relevant in vitro models are needed for use in drug development, regenerative medicine, and fundamental scientific investigation. While the importance of the extracellular microenvironment is clear, the ability to investigate the effects of physiologically relevant biophysical and biochemical factors is restricted in traditional cell culture platforms. Moreover, the versatility for multi-parameter manipulation, on a single platform, with the optical resolution to monitor the dynamics of individual cells or small population is lacking. Here we introduce a microfluidic platform for 3D cell culture in biologically derived or synthetic hydrogels with the capability to monitor cellular dynamics in response to changes in their microenvironment. Direct scaffold microinjection, was employed to incorporate 3D matrices into microfluidic devices. Our system geometry permits a unique window for studying directional migration, e.g. sprouting angiogenesis, since sprouts grow predominantly in the microscopic viewing plane. In this study, we demonstrate the ability to generate gradients (non-reactive solute), surface shear, interstitial flow, and image cells in situ. Three different capillary morphogenesis assays are demonstrated. Human adult dermal microvascular endothelial cells (HMVEC-ad) were maintained in culture for up to 7 days during which they formed open lumen-like structures which was confirmed with confocal microscopy and by perfusion with fluorescent microspheres. In the sprouting assay, time-lapse movies revealed cellular mechanisms and dynamics (filopodial projection/retraction, directional migration, cell division and lumen formation) during tip-cell invasion of underlying 3D matrix and subsequent lumen formation.
Introduction
Progress in microfabrication technologies has paved the way for new approaches to manipulate and monitor cells in an environment that closely mimics in vivo conditions. The in vivo microenvironment is characterized by short distances to nutrient flow, a 3-dimensional (3D) scaffold, and the presence of multiple cell types in proper spatial relationship. These features are readily achievable by current microfabrication techniques and can be combined with appropriate cell culture protocols. The major advantages of micro-scale cell culture systems or microfluidic devices are their ability to use small quantities of cells and reagents, precise control of spatial and temporal environment and high resolution visualization of cellular events in real-time.
Microfluidic devices of varying levels of complexity are rapidly gaining popularity within the cell biology community1–4. Most are 2D in the sense that the cells are plated on top of a coated substrate. Patterned substrates have been studied as well as surfaces with topological variations5–7. These are useful for studying cell confinement, alignment and cell-cell cell-surface or receptor-ligand interactions. Researchers now generally agree, however, that many critical biological subtleties may be missed in 2D cell culture models 8–10 and are seeking alternative approaches that incorporate a 3D gel or matrix.
The in vivo microenvironment is an integration of a complex array of global as well as local stimuli and interactions that can be categorized as either biochemical or biophysical in nature. Biochemical factors include the steady or time-dependent presentation of soluble factors as well as functionalization of the 3D scaffold the cells reside either within or on top of. Some of the known biophysical factors are the stiffness, density and pore size of the scaffold material, and features related to flow, either surface shear stress or interstitial flow around the cells in the matrix or through a surface layer of, say, endothelial or epithelial cells.
While the importance of the extracellular microenvironment is clear, the ability to investigate the effects of physiologically relevant biophysical and biochemical factors is restricted in existing 3D cell culture platforms. Current 3D in vitro models range from traditional multi-well plate cultures 11, 12 to macrofluidic systems 13–15. Most are limited in the scope of biochemical or biophysical factors that can be controlled, and often cannot be imaged at high resolution during the course of an experiment. Better resolution has been achieved in micro-scale systems, for example, 3D gel microscope slide assays or cells cultured on 2D microfluidic channels, but with an obvious compromise in the range of parameter control and/or, physiological relevance. Recent advances in 3D microfluidic systems include the works of Koh and Pishko who use photo-patterning techniques to fabricate cell-containing hydrogel microstructures inside microfluidic channels16 and Desai and Tan who took a microfluidic multilayer patterning approach to created biomimetic 3D structures17. Paguirigan and Beebe fabricated a novel microfluidic device from gelatin which was used to culture mammary gland epithelial cell which organized to form a more in vivo like 3-dimesional structures as opposed to cell culture on tissue culture plastic18.
In this study, we develop a novel microfluidic device (μFD) for 3D cell culture and demonstrate its capability for studying capillary morphogenesis. Capillary morphogenesis is an important process that occurs in both physiological (e.g. wound healing and development) and pathological (e.g. tumor growth) conditions. In addition, one of the major challenges facing the field of tissue engineering is creating highly vascularized tissue with a functional vascular network. Each of these processes has been extensively studied and shown to be regulated by a wide spectrum of biophysical factors and sequenced biochemical cues. Due to system constraints, however, each individual study typically focuses on the effects of one or a small number of factors, making it difficult to comprehend their potential interactions. Moreover, since capillary sprouting occurs perpendicular to an existing monolayer, it is advantageous to have the capability to view the monolayer from the side, so that capillary growth occurs in the viewing plane. To provide greater flexibility and a higher degree of control, we have developed an in vitro μFD designed to permit: (1) 3D cell culture, (2) the delivery of controlled time-dependent delivery of biochemical agents, uniformly or with a spatial gradient, (3) the generation of pressure gradients and flows, both surface and interstitial, (4) advantageous viewing angle perpendicular to a formed monolayer and (5) real-time monitoring of cells in response to changes in their microenvironment.
Here we demonstrate the capability of our system for studying capillary morphogenesis; however it can be used in the study of other cell types either as single cultures or co-cultures. We know of no in vitro angiogenesis models and microfluidic systems which couple microfabricated technology with the basic concepts of traditional 3D in vitro angiogenesis models and that are geared towards promoting and studying capillary morphogenesis in response the relevant biochemical and biophysical features present in vivo.
Materials and Methods
Microfluidic Device Design
In order to satisfy these stated design criteria, a μFD was created (figure 1a) consisting of two parallel microfluidic channels for delivering cell culture medium and a central “gel cage” with a micro-pillar array for housing cell-seeded scaffolds. One primary objective was to facilitate the incorporation of most commonly used injectable cell culture scaffolds (hydrogels), which may be biologically derived (collagen gels or matrigel) or synthetic (self-assembling peptide gels)19. Gel cage geometry was optimized to permit the use of a range of hydrogel concentrations, with the posts providing physical support to prevent the fracture of brittle gels and provide stability for soft gels. The microfluidic network and gel cage were cast in PDMS which was bonded to glass after loading the scaffold (see details below). With the scaffold in place the two media channels are isolated from each other, communicating only through the gel containing region. This permits the establishment of gradients in both pressure and chemotactic factors across the gel. Either static or dynamic cultures can be established by integration with macro-scale plumbing. In dynamic cultures, the microfluidic chip is connected to an external flow circuit which allows the control of both surface shear stress and interstitial flow perpendicular to a cultured monolayer or past cells suspended in the gel. The external platform is equipped with two isolated media reservoirs having adjustable hydrostatic heads (producing a pressure gradient across the gel) at the inlet, two-way valves (to isolate the system when necessary) and outlet connectors to a programmable push/pull syringe pump (PHD 2000, Harvard Apparatus). Pressure gradients can also be generated by connecting reservoirs directly to the PDMS wafer. The entire μFD platform was designed to be small enough to fit on conventional microscope stage to allow real-time monitoring of cells over the course of an experiment.
Figure 1. Schematic of μFD and scaffold loading protocol.

(a) The DFD consists of two parallel channels for controlling fluid flow and a central gel “cage” for 3D cell culture. One key feature of the gel “cage” is the staggered array of micro pillars which provide mechanical support for soft hydrogels. (b) Scaffold loading protocol. PDMS wafers were fabricated as described in Methods and Materials. PDMS wafers were cleaned, sterilized and surface treated (step 1). Pre-polymer solution was precisely microinjected in the gel “cage”. Hydrophilic PDMS surface permitted proper gel spreading and filling. (step 2). Microfluidic channels were defined by sealing device with glass cover slip. (c) Microinjection station in sterile laminar flow cell culture hood. Precise scaffold loading can be achieved with a custom made microinjection setup which include digital microscope, xyz micromanipulator with microliter syringe. (d) Micrograph of assembled μFD showing media channels and collagen partially stained with commasic blue. Both biologically derived and synthetic matrices used for traditional macro-scale 3D cell culture can be precisely immobilized in gel “cage”. With the gel in place media channels are virtually isolated except for diffusive or convective transport of molecules through the porous matrix.
Device Fabrication and Surface Modification
The design of the microfluidic network was created in AutoCAD (Autodesk, San Rafael, CA) with the dimensions of the microfluidic channels, gel “cage” and micro-pillars as provided in supplementary table 1. A transparency mask was created from the CAD file with a minimum geometric feature size of approximately 100 μm and printed by a high-resolution printer (PageWorks, MA). This transparency mask was used in photolithography of SU-8 photoresist to create a silicon wafer master. Microfluidic devices were made by replica molding20 polydimethylsiloxane (PDMS) (Dow Corning, USA) and curing the degassed elastomer mix (10:1, base: curing agent) against the silicon master in an 80 °C oven for 2 hours. Polymerized PDMS wafers were peeled off the silicon master, individual microfluidic wafers (35 mm diameter, 0.8–1cm height) cut out and inlets and outlets cored down to microfluidic channels using a sharpened flat-ended 16 gauge needle. Prior to cell culture PDMS wafers were cleaned and sterilized at 120 °C for 20 minutes in a wet cycle followed by a dry cycle at 120 °C for 35 minutes (20 min sterilization/15min dry). Next, the PDMS surface was rendered hydrophilic by exposure to air plasma to facilitate scaffold loading (detailed below). Briefly, sterilized wafers were placed on trays in plasma cleaner (Harrick, CA) chamber (pattern side up). A pump down cycle (~ 2 minutes) was initiated followed by irradiation for 2 minutes with pink plasma. Surface treated wafers were stored in sterile container and used within 0.5 – 2 hrs following plasma treatment.
Scaffold Loading Microinjection System and Device Assembly
A microinjection station was created to load the cell culture scaffold (sub μL volumes) into the device under aseptic conditions (Fig. 1c). The system components included a manual micromanipulator (MN-151 Joystick Micromanipulator with H-7 Pipette Holder, NARISHIGE, NY), microliter syringe (Hamilton, 62RNR, 2.5 μL SYR, 22s/2″/3, VWR), digital microscope (Big Blue QX5, COMPUVISOR.COM, TX) (all housed in a laminar flow hood) and a monitor for visual guidance. The MN-151 joystick feature provided control of micro-scale adjustment in the XY plane with additional coarse adjustments along the X, Y and Z axes.
Scaffold Microinjection
Sterilized PDMS wafers with their surfaces rendered hydrophilic as described above are positioned on the microscope stage (patterned surface upward) with the “gel cage” in clear view on the video monitor (Fig. 1b). The tip of the microliter syringe (pre-loaded with pre-polymer solution), attached to micromanipulator, is positioned a few microns above of the “gel cage” and a small droplet of the pre-polymer solution is created manually and lowered until the droplet first makes contact with the micro-pillars (supplementary Fig. 2). Droplet size is controlled such that its diameter is approximately equal to half the width of the “gel cage”. Small droplets are created just above the gel cage, lowered and dispensed; this process is repeated until the gel cage is full.
Scaffold Loading and Device Assembly
Gel pre-polymer solution (collagen type I, rat tail in these experiments) is microinjected into the “gel cage” (details above); fluidic channels are sealed with a clean glass cover slip (35 mm, VWR) and secured with a mechanical clamp (dynamic cultures when connected to external platform). This is repeated for multiple wafers at a time. After scaffold injection, assembled PDMS wafers are placed in a secondary humidified container, to prevent the hydrogels from drying out. Gels are allowed to polymerize for 30 min at 37 °C in a humidified incubator.
Demonstration of Concentration Gradient across Gel in OFD with and without Channel Flow
Collagen gels were formed as previously described. Following polymerization, microfluidic channels were filled with cell culture media (without supplements). Gradient studies were performed under static (no flow) (Fig. 2c) and dynamic (flow through the channels) conditions (detailed in supplementary material) with the media in one microchannel replaced by a dilute solution of fluorescent dextran (40 kDa, Invitrogen) at an initial concentration of 20 μg ml−1. Fluorescent intensity was visualized with a Nikon TE300 microscope (Nikon Instruments Inc., NY). A series of fluorescent images (4× magnification) of the gel region were acquired with a Hamamatsu camera (Hamamatsu, Japan) using Openlab (Improvision, MA) data acquisition software and stored for further analysis. Images were processed to obtain the changes in fluorescent intensity across the gel at each time point. Image processing of time-lapse fluorescent images was performed using a custom written ImageJ (NIH public-domain image processing software) macro and MATLAB (MathWorks, MA) code. Briefly, parallel diagonal lines were drawn across the gel region from the sink to the source channel (Fig. 2a) in each fluorescent image. A clear path was defined which avoided the PDMS micro-pillars. Pixel intensities and corresponding location from the “source” channel were recorded for these line sections. Average fluorescent intensities were calculated for pixels at the same distances from the dextran channel for all pixels across the length of the gel. At each time point a plot of the normalized average intensity profile across the gel was generated. Variations in fluorescent intensity as a function of time were plotted at fixed locations within the gel region and compared to theoretical predictions (detailed in supplementary material) obtained from a finite element model generated in FEMLAB (Comsol, USA).
Figure 2. Experimental design and device capabilities.
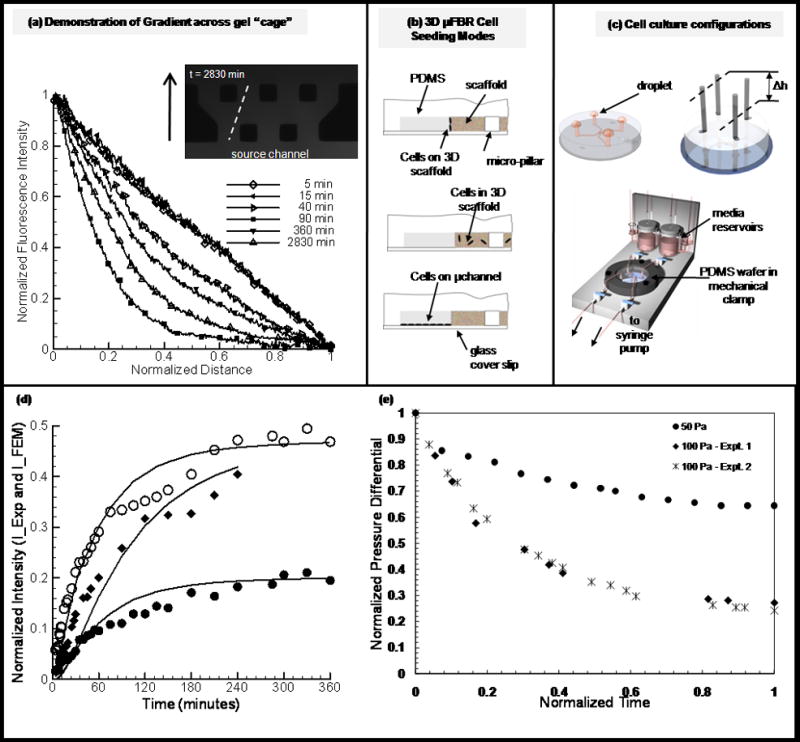
(a) Demonstration of gradient across gel “cage”. Collagen gels were formed as described in Methods and Materials. Fluorescent dextran (40kDa) was used to demonstrate the capability of generation gradients in the μFD. Shown are the time-course of fluorescent intensity and concentration of dextran (used to simulate nonreactive solute within that size range) across the gel “cage”. Plot (a) shows representative experimental curves plotted for over 40 hours. (b) Schematic of cell culture assays. (top) EC sprouting assay. Cells are cultured on a 3-dimensional gel with physiological relevant polarity. (middle) 3D encapsulation assay. Cells are suspended in the gel and are initially separated from each other. (bottom) 2D migration assay. Cells form monolayer predominantly on glass substrate (non-compliant) coated with ECM material (fibronectin) (d) Cell culture flow configurations. (1) For static cultures droplets of media are place on inlet and outlet ports. Devices are kept in local high humidity (Petri dish with water) secondary container in the incubator. (2) Setup used for imposing pressure gradient across gel cage, differential in height of liquid reservoirs. (3) Microfluidic platform. Schematic of platform used for generating physiological levels of shear stress in micro channels. (d) Plots represent values of normalized intensity at fix locations in the gel region, solid lines are theoretical predictions and shape-markers (circles (open-middle, solid-near sink channel) and squares for devices D and C respectively (supplementary table 1) are for experimental results (detailed in supplementary materials). (e) Experimental results for the evolution of normalized pressure differential (dP/dPmax) for generating interstitial flow through three-dimensional scaffold in DFD (detailed in supplementary materials), values in Pa indicate initial pressure differential.
Cell Culture and in vitro capillary morphogenesis models
All cell cultures were maintained in a humidified incubator at 5% CO2 and 37 °C. Human adult dermal microvascular endothelial cells (HMVEC-ad, LONZA, USA) were propagated in EGM-2MV media system with 5 % fetal bovine serum (LONZA formerly CAMBREX, USA). Cells were expanded on collagen-coated flasks and used at passages 6–8.
3D encapsulation in collagen gels
For 3D encapsulation studies, cells well suspended at 1 × 10⁶ cells ml−1 in ice-cold liquid type I rat tail collagen with a final gel concentration of 2mg ml−1. Liquid collagen was prepared by adding collagen stock solution to a mixture of 10X PBS, 1M NaOH and tissue culture grade water to obtain a 2.5mg ml−1 solution. A predetermined volume of high density cell suspension was then mixed with the collagen solution to obtain the required seeding density. The collagen/cell mixture was loaded in a microliter syringe and gels cast as previously described. Following gelation, microfluidic channels were filled with cell culture medium and incubated for 24 hours. To demonstrate the effects of biochemical factors, cells were cultured under static conditions with complete media (control) or media enriched with pro-angiogenic factors (bFGF, VEGF and PMA all at 50 ng ml−1). Cells maintained in cultures for several days in complete media or media supplemented with bFGF/VEGF/PMA cocktail which were replenished at 24 hour time points. At the end of an experiment samples were fixed, tagged with fluorescent markers and imaged (see details below).
Shear stress on 3D encapsulated cells
To demonstrate the capability to produce biophysical stimuli, cells were subjected to small levels of shear stress induced by interstitial flow through the three-dimensional scaffold. EC populated gels were formed and culture as previously described. A pressure differential (50 Pa) was imposed across the gel by varying the difference in the height of culture media in the reservoir columns (Fig. 2c, detailed in supplementary material).
Endothelial cell monolayer formation
Two different cell seeding protocols were used to control the substrate on which ECs initially formed confluent monolayers, namely 2D and 3D substrate monolayer seeding. Collagen gels were formed as previously described. Following gelation, microfluidic channels were filled with a 2 mg ml−1 fibronectin coating solution and incubated overnight. Prior to cell seeding the coating solution was replaced with complete media and equilibrated for another 2 – 4 hours. A cell suspension of 2–3 × 10⁶ cells ml−1 was flowed into one microfluidic channel and the cells permitted to adhere to the rigid glass or compliant gel surface as they settle out of suspension by gravity. Endothelial cells were cultured for 24 – 48 hours on the rigid (2D monolayer seeding) or compliant (3D monolayer seeding) surface before further treatment. Pro-angiogenic factors were either presented as a gradient or at uniform concentration. For this assay VEGF (10 – 50 ng ml−1) and S1P (250 nM) were used to promote morphogenesis.
Shear stress on endothelial monolayer
Flows can also be generated within either or both of the channels for the purpose of either maintaining a stable gradient across the gel region or subjecting the cell monolayer to surface shear stress. To generate channel flow, the inlets are connected to constant pressure reservoirs and the outlets to a syringe pump set to maintain a constant flow rate (time-varying flows are also possible, but have not yet been tested). (See supplementary material for details.)
Characterization of capillary morphogenesis and tube-like structures
Phase-contrast, epifluoresence and confocal microscopy were used to characterize capillary morphogenesis and the 3D morphology of EC structures. Fluorescent and phase contrast images were acquired on Nikon TE300 microscope equipped with a Hamamatsu camera and Openlab image acquisition software. Time-lapse images were taken of live samples every 12 – 24 hours with phase contrast microscopy. At the end of an experiment, samples were fixed with 4.0 % paraformaldehyde (PFA) and tagged with a fluorescent marker for actin cytoskeleton and cell nuclei. Confocal images were collected using spinning disk confocal microscope (Zeiss Axiovert 200M) furnished with Imaging Suite (PerkinsElmer Life Science) acquisition software. A series of 100 optical serial sections (1 μm thick) were obtained. The aligned images were stacked and rendered for 3D visualization using Imaris (Bitplane, MN). In addition to confocal microscopy, in order to demonstrate the presence of open lumen-like structures (in fixed samples) the cell seeding channel was perfused with fluorescent micro-beads (supplementary movie 3).
Microvascular Endothelial Cells Sprouting Movies
To demonstrate the capability to monitor cells in real-time, time-lapse movies were recorded of endothelial cells during sprouting angiogenesis. An endothelial monolayer was formed on collagen gel as previously described. The μFD was kept in a custom built environmental control chamber at 37 ºC and 5% CO2 and cells visualized with a Zeiss inverted microscope. To minimize evaporation during the course of the experiment, media reservoirs (with zero height differentials) were connected directly at each inlet and outlet ports. The device was then placed in a secondary container with a humidified local environment and cut-out glass window in the bottom for visualization. Bright-field images were taken with the AxioCam MRm (Carl Zeiss) (at single optical plane) at 2 minutes interval with AxioVision image acquisition software.
Cytoskeleton and Nuclei Staining
F-actin distribution and number of cells involved in “capillary – like” network or tube structures were assessed after 2–7 days culture in the μFD. F-actin and nuclei staining were performed after fixation with 4.0 % PFA (30 minutes). The fixed samples were rinsed twice with 1X phosphate buffered saline (PBS), treated with 0.1 % Triton-X (1–2 minutes), rinsed with 1X PBS followed by the infusion of a mixture of DAPI and rhodamine phalloidin (30 minutes) and a final wash step with 1X PBS.
Results and Discussion
Microfluidic with 3D cell culture capabilities (OFD)
A new μFD was designed and fabricated from PDMS using standard soft lithography and replica molding techniques. To facilitate precise control of the fluidic microenvironment (shear levels and soluble factors), the device consists of two parallel flow channels and a central gel cage which was designed to immobilize injectable scaffolds (soft hydrogels) for cell culture. A staggered array of micro-pillars is incorporated in gel cage to provide mechanical stabilization for the scaffolds which can biologically-derived or synthetic. We have found that this specific design provides optimal mechanical support (supplementary Fig. 1) for gels and can sustain pressure differentials in excess of several cm of water. With the gel in place the two microfluidic channels are essentially isolated from each except for the diffusion or convection of soluble factors through the porous scaffold from one channel to the other.
Creating a 3D in vitro microenvironment
Hydrogel scaffolds are directly microinjected in to the ”gel cage”. The microinjection protocol provided the ability to load minute volumes of scaffold material, with or without cells, directly in the designated space (supplementary Fig. 2c – f) without the need for the alternative perfusion loading.
PDMS surface modification
PDMS was chosen for the device fabrication because of its documented biocompatible and excellent optical transparency. However, after polymerization flat PDMS surfaces are hydrophobic and exhibit poor wetability, which was not amenable to scaffold confinement. Scaffold injection into untreated PDMS devices resulted in gels that exuded into the channels and often did not fill the gel cage, resulting in small bubbles adjacent to the micro-pillars. Fortunately, the hydrophobicity of PDMS is tunable (supplementary Fig. 2a – b) and PDMS surfaces can be temporarily rendered hydrophilic by exposure to air plasma21. Subsequent to plasma treatment, hydrophobic recovery time is dependent upon the method of preparation and storage. Recent work has shown thermal aging, longer oxidation time and storage in nitrogen to be effective in delaying the recovery of hydrophobicity22. Here PDMS was surface treated with air plasma for 2 minutes, longer than is typically required for immediate bonding to glass. To maintain the seal when connected to macro-scale plumbing, typical microfluidic devices are permanently bonded or vacuum sealed23 to glass or a layer of PDMS to prevent leaks. Here neither technique could be used since it was necessary to have direct access to the gel cage for scaffold injection. Instead, we found that the plasma treatment used to contain scaffold spreading and filling was sufficient to promote bonding to glass. We have found that the strength of the bond between PDMS and glass increases over time and have experienced minimal problems with leaks.
Concentration Gradient maintained in μFD
A typical time course of the concentration profile in the gel cage following the introduction of a fluorescent dextran to one channel is shown in Fig. 2a. Normalized florescence intensity (C−Cmin)/(Cmax−Cmin) in the gel is plotted as a function of normalized distance (x/xmax) from the dextran (40 kDa) “source” channel. Depending on the width of the gel region, a steady state concentration profile was reached on the order on an hour. For gradients established under static (no flow) conditions, we have demonstrated the ability to sustain a stable gradient for up to 40 hours (without replenishing either the source or sink channels). While a linear gradient can be maintained, there is depletion and accumulation of dextran in the source and sink channels respectively In order to maintain a constant concentration, it is necessary to continuously replenish the sink and source channels. This was achieved by establishing a slow flow (10 μl min−1) in the two microfluidic channels, one with control fluid and the other containing fluorescent dextran, to maintain a gradient across the gel (supplementary Fig. 4) for several hours. These results demonstrate our ability to simultaneously control surface shear stress (on the surface of the endothelial monolayer) and gradients in our device. In this study, 40 kDa dextran (non-reactive solute) was chosen because it is similar in size to several growth factors of interest including VEGF, bFGF and IGF24.
The experimental results for gradients under static conditions were compared to results from a finite element (supplementary Fig. 3) model assuming a diffusion coefficient of 4 × 10⁻⁷ cm2 s−1 with the gel region. Figure 2d shows the comparison between the theoretical results (solid lines) and experimental results for two “gel cage” geometries. This value for diffusivity agrees well with the range of values reported in the literature25, 26. The ability to generate gradients of soluble factors across a 3-dimensional matrix provides the potential to simulate physiologically relevant mechanisms during directional migration including sprouting angiogenesis, tumor metastasis and immune response. The dynamic motility of migratory cells can be probed in a controlled microenvironment and monitored in real-time. In addition, the spatial and temporal presentation of such factors provides another level of control which would be physiologically relevant but not possible in most current systems. Saadi et al. however, has recently demonstrated the ability to generate concentration gradients in their microfluidic ladder chamber27.
Microfluidic cultures, model system: capillary morphogenesis
As a case study we used our μFD system to study microvascular endothelial morphogenesis. The primary mechanism by which new blood vessels or capillaries are formed in vivo, angiogenesis28, involves a series of well delineated steps including matrix degradation, cell migration, proliferation and lumen formation. This is a tightly regulated process that is affected by metabolic stress29, 30, mechanical stresses31–33, soluble factors34 and ECM matrix components35, 36. With this wide range of stimuli and morphological responses they elicit this serves as a model system to demonstrate the unique capabilities of our μFD.
ECs invade 3D matrix to form capillary-like structures reminiscent of sprouting angiogenesis
HMVEC-ad were cultured until sub-confluence on a collagen coated flask in EGM-2MV complete media, harvested and subsequently cultured in the μFD. HMVEC-ad remain viable for a period of several days. Within a few hours following cell seeding EC form a monolayer on collagen gels. In order to demonstrate the capability to better characterize and study the cellular mechanism during sprout formation time-lapse movies were made. In traditional sprouting models this capability is limited since cells are viewed through the monolayer. Here the directional sprouting and migration occurs in the microscopic viewing plane. As a result we were able to capture the dynamics that occurs which have not been demonstrated in other systems. Figure 3, panels (a)-(i) show the sequence of morphological changes that occurs. Time–lapse imaging shows a “lead-cell” as it invades the underlying 3D collagen matrix. In case of single sprout formation (supplementary movie 1); the lead-cell extends filopodial projections into the underlying matrix while the neighboring ECs on the monolayer remain non-invasive. Cell invasion follows a period of dynamic projection and retraction of filopodia while maintaining contact with the monolayer and remain highly polarized. An initial root-like structure is formed in the direction of migration that persists for several minutes with more dynamic smaller extensions. Subsequent morphological changes included increased penetration depth, filopodial diameter and translocation of cell from monolayer (evident by movement of nucleus) (Fig. 3c & d) followed by conical structure (onset of lumen formation). The invading cells subsequently form sprouts with open lumen structures (Fig. 3(h) shows a particle trapped in the newly developing lumen). With this system, we were able to demonstrate all the sequential cellular mechanisms that occur during sprouting angiogenesis in vivo. This provides a very powerful tool for future studies with the capability to answer and clarify some of the controversy in this area of research.
Figure 3. Microvascular endothelial cells sprout to form capillary – like structures.
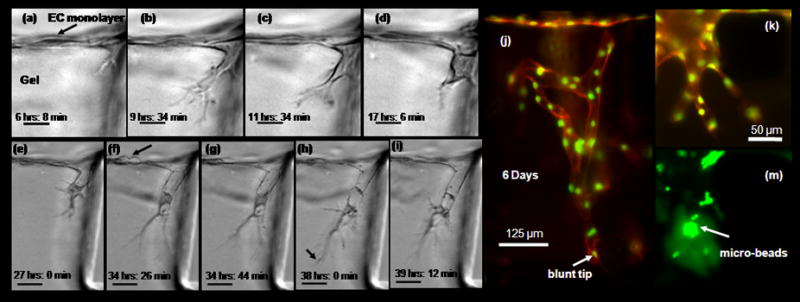
(a) – (i) Time – lapse images demonstrating cellular mechanism during early sprouting process (movie in supplementary material). Microvascular endothelial cells were cultured to form monolayer on collagen gel according to Methods and Materials. Directional migration and sprouting occurs in the microscopic view plane. Cells were cultured in VEGF enriched media (10 ng ml−1) with a gradient in S1P (250 nM). Time indicated in hours and minutes refer to time after stimulation with VEGF and S1P. Scale bar shown in (a) - (d) represents 20 μm, those in 50 μm (e) - (i) (a) Initial root – like structure forms from membrane protrusion just below monolayer. (b) Filopodia lengthens to form highly branched structure. (c) Onset of nucleus translocation into thickens filopodia. (d) Filopodia further thickens, nucleus completely translocated into filopodia and forms cone – like structure. (e) Formation of lumen – like structure behind polarized cell. (e) Cell division on monolayer (f) – (i) single sprout elongation, lumen like structure lengths behind highly polarized cell. Particle trapped in lumen demonstrate it is a open structure. (j) EC monolayer cultured for several days (here 6 days) with soluble angiogenic stimuli (VEGF 10 ng ml−1 enriched media, with a gradient in S1P (250 nM)) form complex multi-cellular capillary – like structure. End point sample tagged with fluorescent marker shows actin cytoskeleton (orange) and nuclei (green). (k) - (l) Another small microvascular sprout, with green fluorescent microspheres collected in lumen space.
Figure 3(j) shows a representative result for long term cultures. ECs maintained in cultured for several days form multi-cellular capillary-like structures. Endpoint F-actin and DAPI labeling shows the organization and the complexity of these structures. However, capillaries maintained under static conditions regress and lose their connection to the monolayer. One of the hallmarks of capillary formation is development lumen structures. To demonstrate the presence of open lumens, fluorescent microspheres were added to the channel on the apical surface of the monolayer. Figure 3, panels (k) and (m) provides confirmation of open lumen (microspheres collected in structure).
ECs suspended in 3D collagen gels form capillary-like structures
The culture of EC populated collagen gels have been previously studied in macro-scale systems37 but not yet in a microscale device. Endpoint results are shown in Fig. 5. Isolated cells cultured in 3D formed multi-cellular chords and EC rings. To demonstrate the effect of biochemical stimuli, 3D encapsulated ECs were cultured in medium supplemented with bFGF, VEGF and PMA (Fig. 5b). As expected, there was a drastic difference in morphology compared to control samples (Fig. 5a). In control sample, cells migrate and organize to form isolated multi-cellular ring-like structure. Cells stimulated with pro-angiogenic factors remodel to form complex interconnected multi-cellular capillary – like structures. Figure 5e shows the variation of the pressure differential over time which is used to estimate the velocity through the gel. In the presence of interstitial flow (~ 90μm min−1) ECs form multi-cellular structures within the gel and the monolayer at the gel/liquid interface (Fig. 5c).
Figure 5. Single suspended microvascular endothelial cells form multi-cellular structures.
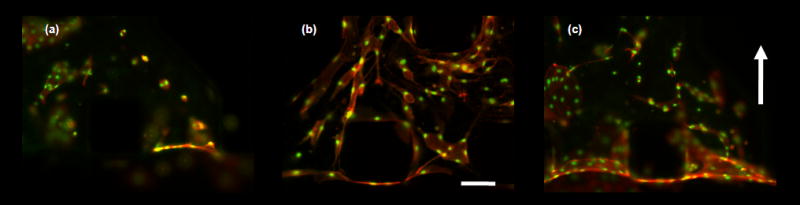
Fixed samples of microvascular endothelial cells encapsulated in collagen gels cultured for 4 days. Scale bar shown represents 125 μm. Cell were stimulated with angiogenic factors or switch to interstitial flow after 24 hours after cell seeding. (a) – (c) Micrographs of fixed samples stained for actin cytoskeleton (orange) and nucleus (green). (a) – (b) Images show the effect of biochemical stimuli. (a) cell cultured in complete EGM-2MV medium, (b) complete EGM-2MV medium supplemented with VEGF/bFGF/PMA cocktail (all at 50 ng ml−1 final concentration). Results showed a drastic difference in EC morphology and extent of multi-cellular structures organization. Control sample form EC rings that are mostly isolated from each other, while EC cultured with potent pro-angiogenic factors organize to form cellular cords. (c) Interstitial flow (flow direction indicated by arrow bottom to top), with complete medium EGM-2MV. ECs form multi-cellular structures and monolayer at gel/medium interface.
2D surface migration promotes formation of tube-like structures
Microvascular ECs cultured as shown in Fig. 2b (bottom) experienced extensive morphogenesis. ECs on the fibronectin coated channel retain their characteristic cobblestone phenotype while a remarkable difference in morphology is evident at the gel surface (Fig. 4a). Prior to sheet or tube formation, the cells migrated as a contiguous structure into the gel region with a prominent increase in vacuoles and blebs (Fig. 4b & 4c). These structures were highly dynamic (supplementary movie 2) but eventually evolved into more stable sheets (Fig. 4d) and tubes (Figs. 4e & 4f). Serial sections of fixed samples obtained from confocal imaging and subsequent 3D reconstruction of EC networks confirm the presence of circular and flattened lumen-like structures which extend throughout the length of the vessel. The existence of continuous lumens is further demonstrated by flowing beads through the vessels under a small pressure drop (supplementary movie 3). Some beads can be observed flowing all the way across the gel cage and others collect at necked-down regions in the vascular structure.
Figure 4. 2D migration promotes sheet-like and tube-like structures.
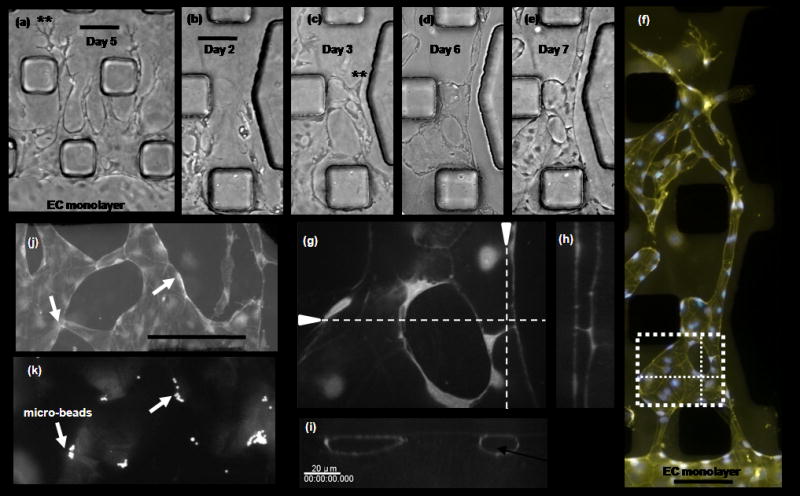
ECs cultured on 2D substrate next to 3D collagen gel migrated in to gel region to form sheet – like and tube – like structures. (a) EC stimulated with a gradient in S1P (250nM) and media enriched with VEGF (10 ng ml−1). Results show a clear transition from cobble – stone to multicellular well defined individual 2D tube structures with highly polarized tips. Scale bar shown represents 100 μm. (b) – (e) The morphogenesis of EC can be tracked over several days. Here, a sequence of micrographs depicting morphological changes during the formation of EC tube-like structures over a 7 day period. Scale bar represent 100 μm. Cells migrate into gel region with a prominent increase in vacuolar structures that precede tube structure development. (f) Cells were fixed and stained for actin (yellow) and nucleus (blue). Merged images show complex multi-cellular organization to for tubular and flatten sheet-like structure. Scale bar shown represents 100 μm. (g) – (i) Confocal images of tube – like structure in panel (f), boxed region. 3D reconstruction of serial sections confirms the presence of open lumen structure. (j) – (k) Branched flattened tubular structure with fluorescent microspheres in lumen. Scale bar shown represents 250 μm.
Conclusions
In vitro models offer enormous potential for gaining new insights into essential but complex in vivo phenomena. Angiogenesis is one example that has been widely investigated because of its profound physiological and pathological importance. The main challenge has been to provide a model system that accurately mimics key features of the in vivo microenvironment yet provides means for continuous observation and control. The growth of new blood vessels involves a cascade of events that are a result of molecular, cellular and mechanical interactions in a spatiotemporally controlled environment. As a result in vitro systems should be able to accommodate these physiologically relevant features.
We have developed a novel microfluidic (μFD) system that for the first time is capable of mimicking many of these complexities on a single in vitro platform. The integration of 3D scaffolds and microfluidic networks permits the control of the fluidic environment with the benefit of a more in vivo –like 3D micro-architecture and high-quality imaging capabilities for dynamic studies. With this platform we are able to control (1) surface shear stress, (2) interstitial flow through the matrix (3) gradients in non-reactive solutes, (4) properties of cell culture scaffold and (5) simultaneously monitor cells in real-time.
We have presented a new procedure for introducing 3D matrices into microfabricated systems using surface treatment followed by gel microinjection. Our gel cage geometry incorporating a staggered array of micro-pillars is the key enabling feature of this design. Soft hydrogels can be mechanically supported against differentials in pressure across the gel.
We demonstrate the flexibility of this system in three separate EC capillary morphogenesis assays. The capillary-like structures that form in these three assays differ drastically with the most promising and physiologically relevant being the 3D sprouting assay (Fig. 3). In the 3D encapsulated assay (Fig. 5), ECs form multi-cellular cords and isolated ring structures, while ECs that predominately migrate in a 2D manner (against hard substrate into a 3D matrix region) form tube and sheet-like structures (Fig. 4).
Finally, we have also demonstrated the ability to monitor cells in real-time by recording time-lapse movies of endothelial morphogenesis. We find that the ability to follow and capture these dynamic processes in time provides insights not possible through single images taken hours or days apart.
While the original motivation and design specifications for the μFD were tailored to study the morphogenesis of ECs in response to biochemical and biophysical stimulation, variations on this basic platform can be used for a variety of other cell experiments. Some examples include studies of cell migration through 3D matrices and co- or multi-cell culture systems to create the appropriate modes of cell-cell communication necessary for the creation of more complex tissues.
Supplementary Material
Acknowledgments
The authors thank Carlos Semino and Alisha L Seiminski for discussions about angiogenesis experiments, Jeffrey Borenstein and Ernest Kim for insights regarding microfabrication techniques, Alexandre Micoulet for assistance with time-lapse imaging and Hyungsuk Lee for help with confocal microscopy. This work was supported by funding from Draper Laboratory (Cambridge, MA).VV is supported by NIBIB (EB003805 and a research supplement grant to VV).
References
- 1.Park TH, Shuler ML. Biotechnol Prog. 2003;19(2):243–53. doi: 10.1021/bp020143k. [DOI] [PubMed] [Google Scholar]
- 2.Li N, Tourovskaia A, Folch A. Crit Rev Biomed Eng. 2003;31(5–6):423–88. doi: 10.1615/critrevbiomedeng.v31.i56.20. [DOI] [PMC free article] [PubMed] [Google Scholar]
- 3.Spence DM, Torrence NJ, Kovarik ML, Martin RS. Analyst. 2004;129(11):995–1000. doi: 10.1039/b410547h. [DOI] [PubMed] [Google Scholar]
- 4.Price AK, Fischer DJ, Martin RS, Spence DM. Anal Chem. 2004;76(16):4849–55. doi: 10.1021/ac0495992. [DOI] [PubMed] [Google Scholar]
- 5.Chiu DT, Jeon NL, Huang S, Kane RS, Wargo CJ, Choi IS, Ingber DE, Whitesides GM. Proc Natl Acad Sci U S A. 2000;97(6):2408–13. doi: 10.1073/pnas.040562297. [DOI] [PMC free article] [PubMed] [Google Scholar]
- 6.Fosser KA, Nuzzo RG. Anal Chem. 2003;75(21):5775–82. doi: 10.1021/ac034634a. [DOI] [PubMed] [Google Scholar]
- 7.Chin VI, Taupin P, Sanga S, Scheel J, Gage FH, Bhatia SN. Biotechnol Bioeng. 2004;88(3):399–415. doi: 10.1002/bit.20254. [DOI] [PubMed] [Google Scholar]
- 8.Cukierman E, Pankov R, Stevens DR, Yamada KM. Science. 2001;294(5547):1708–12. doi: 10.1126/science.1064829. [DOI] [PubMed] [Google Scholar]
- 9.Pedersen JA, Swartz MA. Ann Biomed Eng. 2005;33(11):1469–90. doi: 10.1007/s10439-005-8159-4. [DOI] [PubMed] [Google Scholar]
- 10.Abbott A. Nature. 2003;424(6951):870–2. doi: 10.1038/424870a. [DOI] [PubMed] [Google Scholar]
- 11.Bayless KJ, Salazar R, Davis GE. Am J Pathol. 2000;156(5):1673–83. doi: 10.1016/s0002-9440(10)65038-9. [DOI] [PMC free article] [PubMed] [Google Scholar]
- 12.Bayless KJ, Davis GE. Biochem Biophys Res Commun. 2003;312(4):903–13. doi: 10.1016/j.bbrc.2003.11.017. [DOI] [PubMed] [Google Scholar]
- 13.Ueda A, Koga M, Ikeda M, Kudo S, Tanishita K. Am J Physiol Heart Circ Physiol. 2004;287(3):H994–1002. doi: 10.1152/ajpheart.00400.2003. [DOI] [PubMed] [Google Scholar]
- 14.Boardman KC, Swartz MA. Circ Res. 2003;92(7):801–8. doi: 10.1161/01.RES.0000065621.69843.49. [DOI] [PubMed] [Google Scholar]
- 15.Semino CE, Kamm RD, Lauffenburger DA. Exp Cell Res. 2006;312(3):289–98. doi: 10.1016/j.yexcr.2005.10.029. [DOI] [PubMed] [Google Scholar]
- 16.Koh WG, Pishko MV. Anal Bioanal Chem. 2006;385(8):1389–97. doi: 10.1007/s00216-006-0571-6. [DOI] [PubMed] [Google Scholar]
- 17.Tan W, Desai TA. J Biomed Mater Res A. 2005;72(2):146–60. doi: 10.1002/jbm.a.30182. [DOI] [PubMed] [Google Scholar]
- 18.Paguirigan A, Beebe DJ. Lab Chip. 2006;6(3):407–13. doi: 10.1039/b517524k. [DOI] [PubMed] [Google Scholar]
- 19.Zhang S, Marini DM, Hwang W, Santoso S. Curr Opin Chem Biol. 2002;6(6):865–71. doi: 10.1016/s1367-5931(02)00391-5. [DOI] [PubMed] [Google Scholar]
- 20.McDonald JC, Duffy DC, Anderson JR, Chiu DT, Wu H, Schueller OJ, Whitesides GM. Electrophoresis. 2000;21(1):27–40. doi: 10.1002/(SICI)1522-2683(20000101)21:1<27::AID-ELPS27>3.0.CO;2-C. [DOI] [PubMed] [Google Scholar]
- 21.Kim BETKP, Papautsky I. Conf Proc IEEE Eng Med Biol Soc. 2004;7:5013–6. doi: 10.1109/IEMBS.2004.1404385. [DOI] [PubMed] [Google Scholar]
- 22.Eddington DT, Beebe PJPDJ. Sensors and Actuators B. 2006;(114):170–172. [Google Scholar]
- 23.Schaff UY, Xing MM, Lin KK, Pan N, Jeon NL, Simon SI. Lab Chip. 2007;7(4):448–56. doi: 10.1039/b617915k. [DOI] [PubMed] [Google Scholar]
- 24.Favoni RE, de Cupis A. Pharmacol Rev. 2000;52(2):179–206. [PubMed] [Google Scholar]
- 25.Braga J, Desterro JM, Carmo-Fonseca M. Mol Biol Cell. 2004;15(10):4749–60. doi: 10.1091/mbc.E04-06-0496. [DOI] [PMC free article] [PubMed] [Google Scholar]
- 26.Ramanujan S, Pluen A, McKee TD, Brown EB, Boucher Y, Jain RK. Biophys J. 2002;83(3):1650–60. doi: 10.1016/S0006-3495(02)73933-7. [DOI] [PMC free article] [PubMed] [Google Scholar]
- 27.Saadi W, Rhee SW, Lin F, Vahidi B, Chung BG, Jeon NL. Biomed Microdevices. 2007;9(5):627–35. doi: 10.1007/s10544-007-9051-9. [DOI] [PubMed] [Google Scholar]
- 28.Folkman J. Nat Med. 1995;1(1):27–31. doi: 10.1038/nm0195-27. [DOI] [PubMed] [Google Scholar]
- 29.Verma A. Curr Opin Clin Nutr Metab Care. 2006;9(4):366–78. doi: 10.1097/01.mco.0000232895.28674.79. [DOI] [PubMed] [Google Scholar]
- 30.Graven KK, Farber HW. New Horiz. 1995;3(2):208–18. [PubMed] [Google Scholar]
- 31.Tressel SL, Huang RP, Tomsen N, Jo H. Arterioscler Thromb Vasc Biol. 2007;27(10):2150–6. doi: 10.1161/ATVBAHA.107.150920. [DOI] [PMC free article] [PubMed] [Google Scholar]
- 32.Wang HQ, Zhao L. Chin J Traumatol. 2006;9(2):118–24. [PubMed] [Google Scholar]
- 33.Korff T, Augustin HG. J Cell Sci. 1999;112(Pt 19):3249–58. doi: 10.1242/jcs.112.19.3249. [DOI] [PubMed] [Google Scholar]
- 34.Conway EM, Collen D, Carmeliet P. Cardiovasc Res. 2001;49(3):507–21. doi: 10.1016/s0008-6363(00)00281-9. [DOI] [PubMed] [Google Scholar]
- 35.Ingber DE, Folkman J. Cell. 1989;58(5):803–5. doi: 10.1016/0092-8674(89)90928-8. [DOI] [PubMed] [Google Scholar]
- 36.Ingber DE, Folkman J. J Cell Biol. 1989;109(1):317–30. doi: 10.1083/jcb.109.1.317. [DOI] [PMC free article] [PubMed] [Google Scholar]
- 37.Sieminski AL, Was AS, Kim G, Gong H, Kamm RD. Cell Biochem Biophys. 2007;49(2):73–83. doi: 10.1007/s12013-007-0046-1. [DOI] [PubMed] [Google Scholar]
Associated Data
This section collects any data citations, data availability statements, or supplementary materials included in this article.