

Abstract
The volumic rearrangement of both chromosomes and immunolabeled upstream binding factor in entire well-preserved mitotic cells was studied by confocal microscopy. By using high-quality three-dimensional visualization and tomography, it was possible to investigate interactively the volumic organization of chromosome sets and to focus on their internal characteristics. More particularly, this study demonstrates the nonrandom positioning of metaphase chromosomes bearing nucleolar organizer regions as revealed by their positive upstream binding factor immunolabeling. During the complex morphogenesis of the progeny nuclei from anaphase to late telophase, the equal partitioning of the nucleolar organizer regions is demonstrated by quantification, and their typical nonrandom central positioning within the chromosome sets is revealed.
INTRODUCTION
It is now widely accepted that the cell nucleus is a highly organized volume, as revealed by the localization of nuclear functions such as DNA replication, RNA transcription, and RNA maturation within specialized domains (Spector, 1993; Strouboulis and Wolffe, 1996). Equally, interphase chromosomes are not distributed throughout the whole nuclear volume but are clustered in territories (Haaf and Schmid, 1991; Cremer et al., 1993; Spector, 1993), whose spatial organization changes relative to cell activity (Haaf et al., 1990), differentiation (Xing et al., 1995), and steps within the cell cycle (Fergusson and Ward, 1992; Vourc’h et al., 1993). A typical organization of chromosomes during interphase, the Rabl orientation, in which centromeres and telomeres are clustered at opposing sides of the nucleus, has been demonstrated in some cell types (Hochtrasser et al., 1986) but is not generalized (Chaly and Brown, 1988; Ferreira et al., 1997).
In contrast, mitosis appears to be a disorganizing event, because it is characterized by RNA synthesis down-regulation, chromosome condensation, nuclear envelope breakdown, and chromosome rearrangements. However, by performing statistical analyses of chromosome positions within spread metaphases, cytogeneticists have proposed several models for the nonrandom organization of chromosomes within the mitotic cell (reviewed in Oud et al., 1989), which could account for the preferential recombination that occurs in some cancers (Mitelman and Heim, 1990). Such a nonrandom organization was clearly evidenced by the diametral position of homologous chromosomes in human mitotic fibroblasts after chromosome painting of entire chromosomes (Nagele et al., 1995). However, although these studies reveal a nonrandom organization, they do not provide data concerning the precise three-dimensional organization of all of the chromosome sets during all the steps of mitosis within entire human cells, or the three-dimensional localization of given genes relative to chromosomes. This lack of data is due to two reasons. The first reason is the high number of chromosomes within human cells and their dramatic spatial movements during condensation, congression, and separation. The second reason is the difficulty of performing simultaneous high-resolution, three-dimensional investigation of mitotic chromatin within three-dimensional, well-preserved cells and the localization of a given set of genes. For this purpose, ribosomal DNA (rDNA) genes (coding for rRNA) are good candidates because they are amplified (200–500 copies per diploid cell) and are strictly segregated into secondary constrictions of acrocentric chromosomes during mitosis, the nucleolar organizer regions (NORs) (Hadjiolov, 1985; Thiry and Goessens, 1996). Moreover, the transcriptional machinery, composed of RNA polymerase I (RPI) and associated with upstream binding factor (UBF) and SL1, remains associated with the rDNA genes within mitotic NORs (Scheer and Rose, 1984; Chan et al., 1991; Rendon et al., 1992; Roussel et al., 1993, 1996; Zatsepina et al., 1993; Gilbert et al., 1995; Weisenberger and Scheer, 1995; Jordan et al. 1996). Consequently, these elements provide useful protein markers of these genes during mitosis.
We have previously shown that the optical sectioning capacity of confocal microscopy renders feasible the simultaneous study of RPI relative to chromosomes throughout entire cells during interphase and mitosis. Using this technique, we were able to reveal the high three-dimensional complexity of such structures (Gilbert et al., 1995). Although promising, these results led us to the conclusion that a prerequisite for the thorough investigation of the three-dimensional disposition of other NOR proteins would be the availability of software that allows for high-quality and interactive three-dimensional visualization. This approach, based on three-dimensional visualization and tomography, has recently been developed by our group (Lucas et al., 1996) and has allowed us to investigate the three-dimensional organization of metaphase NORs at a high resolution (Héliot et al., 1997).
In the present work, we used confocal microscopy and volumic rendering to simultaneously investigate the three-dimensional organization of chromosomes during both their condensation and segregation, the precise spatial localization of NORs relative both to each other and to chromosome sets, and finally their volumic characteristics.
MATERIALS AND METHODS
Cell culture
KB cells (European Collection of Cell Cultures number 86103004) were grown on minimum essential medium (Sigma, St. Louis, MO) supplemented with 10% (vol/vol) fetal calf serum (Sigma), 100 μg/ml streptomycin, 100 IU/ml penicillin, and 2 mM glutamine (Sigma) at 37°C in 5% CO2. Cells were seeded at 5 × 10⁴ cells/cm2 and grown for 72 h on glass coverslips.
Immunocytochemistry
Cells were rinsed in PBS containing 0.133 g/l CaCl2 and 0.100 g/l MgCl2, and were simultaneously fixed and permeabilized for 5 min in a 3% (wt/vol) paraformaldehyde and 1% (vol/vol) Triton X-100 mixture in PBS. After a 30-min incubation in PBS containing 10% (vol/vol) normal goat serum, the cells were placed either within an anti-human UBF rabbit serum at 1:200 for 30 min or an anti-human UBF (human autoimmune serum provided by Dr. E.K.L. Chan, The Scripps Research Institute, La Jolla, CA). The secondary antibody, which was either biotinylated goat anti-rabbit or biotinylated goat anti-human (Jackson ImmunoResearch, West Grove, PA), was applied for 30 min and revealed by a 15-min incubation with a Texas Red–streptavidin conjugate (Amersham, Little Chafont, United Kingdom). After staining of DNA with 100 μM chromomycin A3 in PBS containing 150 mM MgCl2 for 5 min, cells were mounted in Citifluor AF1 agar (Agar Scientific, Starsted, United Kingdom).
Confocal Microscopy
A Bio-Rad MRC600 system (Bio-Rad, Hercules, CA) mounted on a Zeiss Axioplan optical microscope (Carl Zeiss, West Thornwood, NY) was used. All acquisitions were made using a planapochromat ×63, 1.4 numerical aperture oil immersion objective. Most of the optical sections (384 of 512 pixels) were collected at zoom 6. Dual-channel acquisitions were performed by alternatively exciting chromomycin A3 with the 457-nm line of an air-cooled argon ion laser and Texas Red with the 543-nm line of an HeNe laser. To avoid misalignment caused by block filter exchange, a special filter set (DC 570, high-pass 560) was used. This enabled the simultaneous excitation and collection of fluorescence from both Texas Red and chromomycin A3. Depending on cell thickness, 20–40 sections per cell were recorded with a 0.3-μm z step for each fluorochrome, to collect the whole volume with a sufficient z sampling. Files were then transferred to a Sun Sparc20 (Sun Microsystems, Mountain View, CA) workstation for processing.
Three-dimensional Visualization and Quantification
Preprocessing was performed using the Analyze computer software (CNSoftware, Southwater, United Kingdom). Digital volumes were resized in x and y directions to minimize the file size. Volumes were then isotropically restored, taking into account geometric distortions caused by the refraction index mismatch, to get the same pixel size in x, y, and z directions. A 3 × 3 × 3–cubic median filter was subsequently applied to remove background voxels that might have appeared in final volumic visualization pictures.
The two different routines used for the visualization were either Analyze or Visuvoxel, a computer software developed in our laboratory. In both cases, a volumic visualization method based on light reflection was used (ray-tracing method). The principle of this mode is that an observer perceives objects within a scene according to the light reflected by the boundaries of objects. Therefore, the software (Lucas et al., 1996) produces an image by simulating light interactions with the object boundaries by applying a theoretical lighting model. This is performed by taking into account light source position and attributes of the object points such as reflectance coefficients, the transmissive coefficient, and the refractive index to compute the value of the pixel in the resultant image.
Double-labeling visualization was obtained using Visuvoxel. The two digital volumes corresponding, respectively, to DNA and UBF were merged with suitable factors. Grey level bands were determined for each object. Visualization was then performed using double thresholding and by applying different values to the attributes of the simultaneously defined object boundaries.
By using this three-dimensional visualization mode, volumes can be extensively investigated by performing both rotations and stereo pairs around any chosen axis to present pertinent views, as well as images in three dimensions with a high depth of field. Moreover, the inner parts of the volumes were also investigated by presenting either a single section obtained in a given direction or a section with its three-dimensional environment (referred to as a split volume in this article).
The measured volumes correspond to the number of voxels counted on binary images obtained by interactive thresholding and multiplied by the voxel volume. When the threshold was difficult to choose, local contrast enhancement was applied to the image to enhance the bimodality of its histogram (Le Negrate et al., 1992). The volume of the boundary box for UBF labeling was measured during the different steps of the cell cycle. It was defined as the smallest rectangular parallelepiped in which the whole labeling was enclosed. The boundary box was thus an index of the spatial distribution of the measured volume.
RESULTS
An example of the four main modes of three-dimensional visualizations used in the present work is displayed in Figure 1. In Figure 1A, the classical maximal projection mode was used and shows all of the chromosomes. Because of the large amount of data, detailed structures hardly appear. However, it is possible to reduce the size of the volume studied (represented by the dashed lines) in any of the three directions, as shown in Figure 1B. Thus, the internal chromosomal organization becomes visible relative to the remaining volume. To improve the three-dimensional visualization, surface visualization was performed (Figure 1C). This permitted the generation of more informative images in which the volumic complexity and the chromosome positioning directly appear either on a single image or on stereopairs. Finally, the additional use of a transparency allows the simultaneous visualization of internal structures and surface aspects (Figure 1D, UBF labeling is shown in yellow). The cube can be cut in any direction (Figure 1B) and give rise to a “split volume” (for example, see Figure 5C).
Figure 1.

Main modes of three-dimensional visualization used in this work, exemplified by a prometaphase cell. (A) Projection mode with maximum intensity applied to the whole volume. (B) The initial volume was cut and sectioned chromosomes appear on the faces of the cube. This procedure allows us to examine the chromosomes in more detail within the volume. (C) Volumic visualization giving rise to a very informative view and showing the high complexity of the chromosomes (blue). (D) Same procedure, but chromosomes are partially transparent; this allows us to position UBF immunolabeled structures (yellow) within the set of chromosomes. Bars, 2 μm.
Figure 5.

Volumic visualization of an entire prometaphase cell. The volumic arrangement of the chromosomes (blue) as three layers is revealed in a front-view stereo-pair (A) and a side-on view (B) (L1, L2, and L3). By cutting away half of the volume, the radial disposition of the chromosomes and the central cavity are revealed (C and D). Localization of UBF (yellow) within the NORs appears when DNA is rendered partly transparent: (E) front view; (F) side-on view. Bars, 2 μm.
Behavior of Immunolabeled UBF During Mitosis
First, the immunolabeling of UBF alone during the different steps of mitosis is presented in Figure 2, whereas Figures 3–10 display in more detail its localization compared with DNA.
Figure 2.

Behavior of UBF during the cell cycle. For each step, all the positive structures of a cell are displayed using the volumic visualization mode. (A) Interphase. (B) Prophase. (C) Metaphase. (D) Anaphase. (E) Telophase. (F) Early interphase. Bars, 2 μm.
Figure 3.

Volumic visualization of an entire interphasic nucleus (DNA labeling, blue): (A) front view; (B) side-on view. By rendering DNA transparent, UBF (yellow) appears within the central part of the nucleus: (C) front view; (B) side-on view. Bars, 2 μm.
Figure 10.

Volumic visualization of an entire early interphase cell. (A) The two progeny nuclei show a disk shape with a chromatin texture (blue) similar to that of late interphase. (B) Transparency mode reveals that UBF positive structures (yellow) are centrally localized. (C) The symmetric disposition of UBF sites appears on this view. Bars, 2 μm.
During interphase (Figure 2A), UBF is present as several roundish structures ranging from 0.3 to 0.8 μm. They are disposed as necklaces, as previously shown for other nucleolar components revealed by Ag-NOR staining (Ploton et al., 1994), RPI localization (Gilbert et al., 1995), and rDNA and rRNA in situ hybridization (Junera et al., 1997). These structures rarely appear as smooth beads and are frequently seen as irregular volumes with a rough surface.
During prophase (Figure 2B), UBF labeling presents the same irregular aspect. These irregular beads are less numerous, occupy a smaller volume, and are grouped more within the nucleus compared with interphase (Table 1). As metaphase takes place, two kinds of UBF-containing structures (or NORs) are observed, both of which present a smooth surface (Figure 2C). The first of these are spherical structures that are associated in doublets of the same size (small, medium, or large) and are positioned 0.7 μm apart. The second are elongated, crescent-shaped NORs, 1.3 μm long and 0.2 μm wide. During anaphase (Figure 2D), each set of chromosomes contains the same number (between 5 and 7) of irregularly shaped NORs, which are close together and occupy a similar volume (Table 1). During telophase, the individual and global volumes of those NORs, as well as their spatial dispersion, dramatically increase (Figure 2E and Table 1), producing smooth-surfaced roundish shapes. Their strong similarities in number, size, spatial disposition, and total volume in both sets of chromosomes are striking during this step of mitosis. Finally, during early interphase (Figure 2F), some NORs become larger and more irregular with a typical interphasic structure.
Table 1.
Quantification of the volume of UBF-immunolabeled structures and their boundary box during the cell cycle
| Step (number of cells analyzed) | Volume of UBF labeling (μm3) | Volume of UBF labeling per daughter cell (μm3)a | Volume of boundary box (μm3) |
|---|---|---|---|
| Interphase (n=10) | 4.085 ± 0.720 | 233.70 ± 114.39 | |
| Prophase (n=4) | 3.080 ± 0.692 | 63.169 ± 43.726 | |
| Metaphase (n=7) | 1.255 ± 0.455 | 67.02 ± 34.60 | |
| Anaphase (n=6) | 1.145 ± 0.341 | 0.596 ± 0.176 (0.087 ± 0.066) | 14.291 ± 7.829 |
| Telophase (n=4) | 2.516 ± 0.597 | 1.258 ± 0.310 (0.148 ± 0.072) | 36.745 ± 26.831 |
| Early interphase (n=4) | 2.784 ± 0.456 | 1.392 ± 0.263 (0.241 ± 0.105) | 28.951 ± 9.849 |
Values are ± SEM.
Difference between two daughter cells of same pair is shown in parentheses.
Simultaneous Localization of Chromosomes and UBF During Mitosis
Through systematic three-dimensional reconstructions and visualizations, we investigated both the detailed three-dimensional organization of chromosomes during mitosis and the precise three-dimensional position of UBF sites within the chromosome volumes.
During interphase (Figure 3), the nucleus appears as a biconvex disk (11 μm in diameter and 5 μm in thickness) with a rough surface because of the texture of interphase chromatin, which is composed of fibers 0.2 μm in diameter. UBF labeling, seen by transparency, appears within the more central part of the nucleus on frontal (Figure 3C) and lateral (Figure 3D) views.
During prophase (Figure 4, A and B), the nucleus appears as a discoid with a central part 5 μm thick and a thinner periphery 2 μm thick. Chromatin is no longer organized as thin fibrils but consists of large smooth clumps. At the periphery of the nucleus, elongated and contorted clumps are more dispersed, as assessed by the presence of numerous cavities. These correspond to condensing chromosomes, which are always initially observed in this peripheral domain. Transparency mode (Figure 4, C and D) indicates that UBF-positive sites are located within the thickest and most central part of the nucleus.
Figure 4.

Volumic visualization of an entire prophase nucleus (DNA labeling, blue): (A) front view; (B) side-on view. Localization of UBF (yellow) appears when DNA is rendered partly transparent: (C) front view; (D) side-on view. Bars, 2 μm.
During prometaphase, two shapes of chromosome sets were seen: a classical biconcave one and a biconvex one, both of which were characterized by the presence of well-defined condensed chromosomes ∼1.4 μm in diameter and by their typical radial positioning. Only the biconvex shape will be considered here (Figure 5). The frontal (Figure 5A, stereopair) and the lateral views (Figure 5B) reveal that the chromosome set is a biconvex disk (13 μm in diameter and 6 μm in thickness for maximal sizes) in which chromosomes are disposed as three layers, each with a characteristic diameter. The two smallest ones (Figure 5B, 8 μm in diameter; L2 and L3 on left and right sides, respectively, on the lateral view) are disposed on either side of the central largest one (L1) (13 μm in diameter). In each of these layers, chromosomes are radially disposed with their centromeres near the center of the disk. Moreover, these views demonstrate that the longer chromosomes are preferentially located within the central layer, whereas shorter ones are located within the two other layers. Very rarely, a chromosome can be disposed orthogonally to the set. A split view of DNA and UBF reconstructed volumes (Figure 5, C and D) shows that there is one large ovoid cavity (3 μm on 1.3 μm in diameter) in the center of the chromosome set and that most of UBF-positive sites are close to the surface of this cavity. UBF labeling is clearly observed by transparency within the most central part of the rosette (Figure 5, E and F).
Figure 6A shows a typical metaphase plate with the two spindle poles disposed on either side, as assessed by immunolocalization of tubulin (our unpublished observations). Chromosomes are less discernible than during prometaphase. They are tightly packed and their volume is a parallelogram ∼14 μm long, 6 μm thick, and 5 μm wide. A polar view (Figure 6B) is obtained by rotating the chromosome mass at 90°, perpendicularly to the long axis of the spindle. The stereopair presentation shows the presence, within the chromosome set, of a central depression facing the pole and lined by chromosomes with their telomeres protruding toward the pole. This view also shows the two parallelly disposed chromatids within some chromosomes. When the volume is longitudinally cut and displayed with the same orientation as in Figure 6A, two identical and well-defined depressions are seen on each side (Figure 6C, arrows). Transparency views (Figure 6, D and E) show that UBF-labeled structures frequently appear as doublets, which are preferentially located within the median plane (Figure 6E) of the chromosome mass. The cavity is no longer visible. Finally, the presence of UBF as crescent-shaped structures and as doublets close together confirm that this cell was fixed precisely during metaphase.
Figure 6.
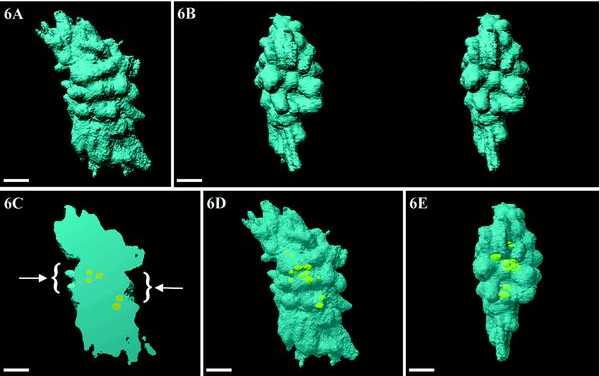
Volumic visualization of an entire metaphase cell. (A) Chromosomes (blue) are tightly packed and less visible. (B) Stereo-pair of a polar view showing the presence of a depression, facing the pole, which is limited by chromosomes protruding toward the pole. (C) By cutting half of the chromosomes, the two depressions (arrows) and the internal position of NORs are revealed. (D and E) By rendering DNA transparent, the NORs appear clearly as doublets that are aligned in one central plane (E). Bars, 2 μm.
During early anaphase, chromosomes are separated in two distinct sets disposed 5 μm apart (Figure 7A). Chromosomes, 0.6 μm in diameter, are clearly seen with their telomeres protruding outside each set in a direction opposite that of the pole. This set was rotated by 90° to get a polar view. The stereopair thus obtained (Figure 7B) clearly shows the volumic characteristics of the chromosome set. A central concave depression, which is a well-defined half sphere 2 μm in diameter, is surrounded by chromosomes that are much less well-separated compared with the other face of the set (c.f., Figure 7C). They appear fused into large smooth clumps, separated by deep radial furrows. When a set is observed from the rear (assuming a virtual observer placed between the two sets) (Figure 7C), the protruding chromosomes clearly appear radially oriented relative to the set, with their axes converging toward the pole. On a split view (Figure 7D), each chromosome set appears as a disk with both a convex and a concave face turned toward the midplane of the cell and the spindle pole, respectively. On the transparency views (Figure 7, E and F) and on the split view (Figure 7D), UBF-positive structures are clearly disposed nonrandomly, because they are localized in the vicinity of the depression as a circular array.
Figure 7.

Volumic visualization of an entire anaphase cell. (A) Chromosomes (blue) protruding at the periphery of the two sets are evidenced. (B) A stereo pair of the polar view shows the presence of a regular circular depression. The fusing chromosomes appear as several large masses, limited with radial furrows. (C) Median view of a set showing the presence of radially disposed and unfused chromosomes. (D) The transversal sectioning of this set shows the concave polar face with the depression, the concave median face, and the presence of NORs (yellow) within the central part of the set. (E and F) By rendering DNA transparent, the NORs are clearly localized within the central part of the set. They are disposed as a ring at the bottom of the depression (E). Bars, 2 μm.
During early telophase (Figure 8), the two chromosome sets are placed 7 μm apart. On the lateral view (Figure 8A), individual chromosomes are no longer visible but are replaced by large blobs that correspond to fusing chromosomes. On a polar view (Figure 8B), the fusing chromosomes, separated by very pronounced grooves, surround a deep cavity. When a set is observed from the middle plane of the cell toward the pole (Figure 8C), some individual chromosomes are still visible, indicating that their fusion occurs later than on the lateral and polar faces. A split view (Figure 8D) clearly indicates that each set is a hollow half sphere, 7 μm in diameter with a wall 2 μm thick. The central cylindrical cavity is 3 μm in diameter and 1.6 μm in depth. With the transparency mode (Figure 8, E and F), the sites containing UBF appear circulary disposed at the periphery of the cavity of the hollow sphere.
Figure 8.

Volumic visualization of an entire early telophase cell. (A) Chromosomes (blue) are less visible than during anaphase because of their fusing. (B) A stereo pair of a polar view shows the presence of a profound circular depression, lined by fusing chromosomes, which are separated by very deep furrows. (C) Median view of a set showing the presence of unfused chromosomes on this face. (D) Cutting one set in half shows evidence of its typical hollow half-sphere structure. (E and F) By rendering DNA transparent, NORs (yellow) appear clearly localized within the central part of the set disposed as a ring at the bottom of the depression (E). Bars, 2 μm.
By the end of telophase (Figure 9A), the two nascent nuclei adopt the shape of a disk ∼7 μm in diameter and 2.6 μm in thickness. When observed from the pole, each set shows characteristic features (Figure 9B). A central circular depression (4 μm in diameter and 0.8 μm in depth) is clearly seen. It is limited by a peripheral ledge ∼1.6 μm wide and 0.5 μm high. The face turned toward the middle plane of the cell is flat and, when rotated through 90° (Figure 9C), appears irregular because of fusing chromosomes. A transverse section of the disk (Figure 9D) confirms that the two faces are not identical. UBF-labeled structures are still circularly distributed at the limit of the ledge and in close proximity to the two faces of the nascent nucleus (Figure 9, D–F).
Figure 9.

Volumic visualization of an entire late telophase cell. (A) Each nascent nucleus is a regular disk (DNA, blue). (B) When observed on a stereo-pair of a polar view, each set appears with a large depression (less profound than during previous step) limited by a regular ledge with some radial furrows. (C) A median view showing that individual chromosomes are no longer visible on that face. (D) Sectioning of the set shows that the disk is a biconcave flat disk. (E and F) Transparency views confirming the central localization of the NORs (yellow) as a ring at the bottom of the depression (F). Bars, 2 μm.
Finally, typical interphasic nuclei are reformed within the two daughter cells (Figure 10). Each of them appears as a flat disk, sometimes presenting a small central depression (our unpublished observations). Because of its decondensation, the chromatin displays a granular texture similar to that observed in late interphase (compare with Figure 1A). UBF labeling is very similar within both progeny nuclei. It is typical of interphase, with irregular structures perfectly centered within the nucleus (Figure 10, B and C).
DISCUSSION
Necessity for High-Resolution, Three-dimensional Reconstruction
In this article we describe the investigation by confocal microscopy of the precise internal and external three-dimensional arrangement of whole chromosomes (and more specifically those bearing NORs) during mitosis. This work is based on new three-dimensional processing methods that allow the generation of high-quality volumic visualizations (Lucas et al., 1996). Compared with classical optical and ultrastructural approaches, these modes of visualization present five decisive advantages: 1) the whole labeling within a cell appears at a glance on a single image; 2) the detailed three-dimensional organization of each labeled structure is visible thanks to the high-quality ray-tracing method used for the visualization; 3) the most informative view can be chosen, because the reconstructed volume can be positioned in any spatial orientation and cut in any direction; 4) the whole volume can be investigated by rotation relative to any chosen axis; and 5) two different labelings can be easily localized relative to each other in any direction. In summary, these techniques constitute an invaluable tool for the precise study of the main volumic characteristics of labeled structures such as their relative three-dimensional positioning, discontinuities and spatial links, size, shape, and irregularities, features that never appear on either single optical sections or on total projection. In addition, quantitative data may also be obtained to measure distances and the number and volume of labeled structures.
Interestingly, reflection-based surface visualization generates very detailed “realistic” images of chromosomes that can be easily compared with those obtained in scanning electron microscopy, although their resolution is lower. In comparison with previous studies performed by scanning electron microscopy (Welter et al., 1985; Hodge et al., 1990, 1995), our study did not necessitate an isolation procedure and was directly performed on three-dimensional, well-preserved entire cells.
A major part of this work is devoted to the immunolabeling of UBF, which remains associated to the mitotic rDNA genes, which are strictly localized within the secondary constrictions of acrocentric chromosomes.(Chan et al., 1991; Rendon et al., 1993; Roussel et al., 1993; Zatsepina et al., 1993; Weisenberger and Scheer, 1995; Héliot et al., 1997). Therefore, we demonstrate that the visualization methods provide a means both of directly observing the secondary constrictions of the acrocentric chromosomes and of indirectly localizing their centromeres, which are positioned in their vicinity from late prophase to early telophase (Warburton and Henderson, 1979; Howell, 1982; Verma and Babu, 1995).
Three-dimensional Organization of UBF-containing Structures during Interphase and Mitosis
UBF is an RNA polymerase I transcription factor associated with rDNA promoters localized in both transcriptionally active and inactive regions of the nucleolus (Cavanaugh et al., 1995; Jordan et al., 1996; Gébrane-Younès et al., 1997). At the ultrastructural level, UBF is within the dense fibrillar component and fibrillar centers of nucleoli (Rendon et al., 1992; Roussel et al., 1993; Raska et al., 1995). Although it was previously demonstrated that UBF is dramatically rearranged during mitosis (Rendon et al., 1992; Roussel et al., 1993), data concerning both the precise three-dimensional organization of UBF-positive sites (NORs) and quantification of their volume and position were still lacking. In this work we have addressed this problem. The quantification of the volume occupied by the immunolabeling is based on the counting of voxels having a fluorescence intensity above a determined level. However, one must keep in mind that quantification cannot be considered as a tool to evaluate the relative number of UBF molecules but rather as a way to convert, in quantitative data, the qualitative differences observed by naked eye (Rost, 1991).
The present three-dimensional reconstruction of UBF labeling during interphase demonstrates UBF organization as several necklaces composed of rough and irregular beads. This result is different from that obtained after Ag-NOR staining (Ploton et al., 1986, 1994; Robert-Fortel et al., 1993) and after RPI immunolabeling, which, after three-dimensional reconstruction, appears as a necklace of very irregular or smooth beads, respectively (Gilbert et al., 1995; our unpublished results). With regard to mitosis, the availability of a three-dimensional view of the whole volume has provided novel information hitherto unattainable using single optical sections. Thus, during prophase, UBF sites are seen to be less dispersed than during interphase, but still have an irregular shape. This latter characteristic can certainly be related to the transcriptional activity remaining during prophase (Gébrane-Younès et al., 1997). Here we confirm that each metaphasic cell contains very different NORs in terms of size and shape (i.e., doublets of various sized spheres and crescent-shaped structures) (Ploton et al., 1987), each of which probably contains a variable number of rDNA genes (Héliot et al., 1997). By using complex rotations, we have been able to reveal the symmetrical number, shape, and localization of NORs during anaphase. Moreover, quantitative analysis definitively reveals an equal partitioning of UBF within the two anaphase cells (Roussel et al., 1993) as well as a high spatial clustering of NORs during that step. Quantification confirmed that this symmetry is maintained during telophase, suggesting that no reorganization of chromosome position occurs during anaphase to telophase transition, as previously demonstrated (Oud et al., 1989; Nagele et al., 1995). The quantification also reveals that the volume of the NORs doubles from late anaphase to early telophase, although their number is constant. This increase can be related to the decondensation of telophasic NORs and, interestingly, correlates with the onset of transcription shown by incorporation of Br-UTP (Gébrane-Younès et al., 1997). This volume is maintained during early interphase and remains identical in both interphase daughter cells.
Chromosome Organization
Our study has provided insight into the dynamic three-dimensional structural rearrangement of whole chromosomes, and more particularly of NOR-bearing ones, during each step of mitosis.
During prophase, chromosome condensation is not randomly initiated but rather commences at the periphery of the nucleus. Large cavities between separating chromosomes first appear not strictly in contact with the nuclear envelope but at a limited distance from it. Chromosome condensation then expands within the interior of the nucleus by preserving a central island around the nucleolus. These results are consistent with those of Comings and Okada (1970), demonstrating large chromosome-less areas within the prophase nucleus. Moreover, the localization of UBF leads to the conclusion that during prophase the centromeric regions of acrocentric chromosomes are grouped toward the center of the nucleus. These results are consistent with previous ones showing that during prophase, telomere sequences are associated with the nuclear envelope (Lichter et al., 1991), whereas chromosome centromeres migrate toward the center of the nucleus (Fergusson and Ward, 1992). Overall, these data suggest that condensation of chromosomes during prophase is a polarized process that could begin at the telomeres situated at the nuclear periphery and end near the centromeric regions within the center of the nucleus.
We also confirm the typical central positioning of centromeres and the peripheral positioning of telomeres during prometaphase, as previously shown (Chaly and Brown, 1988). By performing complex rotations of this chromosome set, we clearly saw that smaller chromosomes are clustered as two layers on each side of a central one containing the longest chromosomes. These findings are in good agreement with the work of Mosgöller et al. (1991), which used serial sectioning to demonstrate that groups D- and G-specific chromosomes are centrally located, whereas group A-specific chromosomes are more peripheral. Hodge et al. (1995) found a similar result and showed a clustering of NOR-bearing chromosomes, which is confirmed in our work by the clear grouping of NORs.
Our results also show the typical rosette-like configuration previously described by Chaly and Brown (1988) and Nagele et al. (1995) but only within early prometaphase (as assessed by microtubules immunolocalization). When an external view of late prometaphasic chromosome set is observed, the rosette no longer appears. Interestingly, this is only revealed when these chromosome sets are split in the computer, i.e., when the central layer of the chromosomes alone is investigated. We interpret this typical figure as the result of two phenomena. The first is a circular disposition of the longer chromosome centromeres in the plane of the central layer, delimiting a discoidal cavity and the second is the grouping of shorter chromosomes into two layers above and below this cavity. In the course of the dynamic mitosis process, we hypothesize that during early prometaphase the rosette consists of three layers of chromosomes (two external ones with smaller chromosomes and a central one with longer chromosomes), disposed as three rings that delimit a central cavity called the hub. During late prometaphase, the sliding of smaller chromosomes on the central layer would result in the closing of the extremities of the hub. This produces a central spheroidal cavity. During metaphase, the two layers of shorter chromosomes converge toward the center of the cavity. This phenomenon is attested by 1) the typical radial arrangement of these chromosomes with their telomeres turned toward the pole on a polar view, 2) the preferential positioning of the NORs within the more central part of the set, and 3) the absence of a central cavity. Additionally, the longer chromosomes change orientation and the set adopts a parallelepipedic shape (rectangular in section), as previously observed (Chaly and Brown, 1988).
Interestingly, when the set is visualized from one pole, a typical arrangement of chromosomes is seen, with their arms radially disposed and their telomeres turned toward the pole. These chromosomes limit a circular cavity, which corresponds to the presence of a half spindle with a conic shape (Merdes et al., 1991).
From early anaphase to late telophase, each chromosome set follows a complex three-dimensional dynamic process. Initially, each appears as a curved disk having a concave and a convex face. In the ensuing stages, this global shape evolves toward a half sphere and finally to a biconcave disk. This dramatic evolution results from differential changes of the polar and median faces, which have not previously been fully observed (Welter et al., 1985). Thus, the median convex face, on which individual chromosomes are clearly defined, gradually becomes smoother and more convex. At the end of mitosis, it is very smooth and very flat (or slightly concave). On the other hand, the depression of the concave polar face, which was a half sphere during early anaphase, acquires a more profound and larger cylindrical shape during early telophase, and adopts a less profound but wider cylindrical form limited by a regular ledge during late telophase. Such modifications could be linked not only to the shortening and spreading of the kinetokorial fibers but also to other proteic complexes during the migration of the chromosomes toward the pole (Merdes et al., 1991; Paddy and Chelsky, 1991; Gaglio et al., 1997).
Interestingly, the texture of the two faces of the set is different. We interpret the smooth aspect of the anaphase polar face to be the result of nuclear envelope reformation (Chaudhary and Courvalin, 1993), a phenomenon that only arises during late telophase on the median face.
Typically, UBF staining indicates that the centromeric regions of acrocentric chromosomes are first positioned in the vicinity of the bottom of the cavity (the same as for other centromeres forming a circular array at the bottom of the chamber) (Hodge et al., 1990), and that they remain in this position during late telophase. This behavior is different from that of centromeric regions of nonacrocentric chromosomes, which migrate toward the periphery of the nuclei during early interphase (Fergusson and Ward, 1992; Vourch et al., 1993; Shelby et al., 1996). However, this is consistent with the recent findings of Ferreira et al. (1997), who showed that early replicating DNA (a characteristic of transcribed rDNA genes) migrates toward the center of early G1 nuclei.
In conclusion, besides demonstrating a characteristic three-dimensional complex rearrangement of chromosomes during each step of mitosis, we also demonstrated their nonrandom positioning with evidence of the striking central position of NORs from interphase to late telophase.
ACKNOWLEDGMENTS
We thank Dr. E.K.L. Chan for the generous gift of UBF antibody. We also thank Dr. M. O’Donohue for reading the manuscript. This work was supported by Association pour la Recherche sur le Cancer (grant 6166).
REFERENCES
- Cavanaugh AH, Hempel WM, Taylor LJ, Rogalsky V, Todorov G, Rothblum LI. Activity of RNA polymerase I transcription factor UBF blocked by Rb gene product. Nature. 1995;374:177–180. doi: 10.1038/374177a0. [DOI] [PubMed] [Google Scholar]
- Chaly N, Brown DL. The prometaphase configuration and chromosome order in early mitosis. J Cell Sci. 1988;91:325–335. doi: 10.1242/jcs.91.3.325. [DOI] [PubMed] [Google Scholar]
- Chan EKL, Imai H, Hamel JC, Tan EM. Human autoantibody to RNA polymerase I transcription factor hUBF. Molecular identity of nucleolus organizer region autoantigen NOR-90 and ribosomal RNA transcription upstream binding factor. J Exp Med. 1991;174:1239–1244. doi: 10.1084/jem.174.5.1239. [DOI] [PMC free article] [PubMed] [Google Scholar]
- Chaudhary N, Courvalin JC. Stepwise reassembly of the nuclear envelope at the end of mitosis. J Cell Biol. 1993;122:295–306. doi: 10.1083/jcb.122.2.295. [DOI] [PMC free article] [PubMed] [Google Scholar]
- Comings DE, Okada TA. Condensation of chromosomes onto the nuclear membrane during prophase. Exp Cell Res. 1970;63:471–473. doi: 10.1016/0014-4827(70)90243-0. [DOI] [PubMed] [Google Scholar]
- Cremer T, et al. Role of chromosome territories in the functional compartmentalization of the cell nucleus. Cold Spring Harbor Symp Quant Biol. 1993;58:777–792. doi: 10.1101/sqb.1993.058.01.085. [DOI] [PubMed] [Google Scholar]
- Fergusson M, Ward DC. Cell cycle dependent chromosomal movement in pre-mitotic human T-lymphocyte nuclei. Chromosoma. 1992;101:557–565. doi: 10.1007/BF00660315. [DOI] [PubMed] [Google Scholar]
- Ferreira J, Paolella G, Ramos C, Lamond AI. Spatial organization of large-scale chromatin domains in the nucleus: a magnified view of single chromosome territories. J Cell Biol. 1997;139:1597–1610. doi: 10.1083/jcb.139.7.1597. [DOI] [PMC free article] [PubMed] [Google Scholar]
- Gaglio T, Dionne MA, Compton DA. Mitotic spindle poles are organized by structural and motor proteins in addition to centrosomes. J Cell Biol. 1997;138:1055–1066. doi: 10.1083/jcb.138.5.1055. [DOI] [PMC free article] [PubMed] [Google Scholar]
- Gébrane-Younès J, Fomproix N, Hernandez-Verdun D. When rDNA transcription is arrested during mitosis, UBF is still associated with non-condensed rDNA. J Cell Sci. 1997;110:2429–2440. doi: 10.1242/jcs.110.19.2429. [DOI] [PubMed] [Google Scholar]
- Gilbert N, Lucas L, Klein C, Menager M, Bonnet N, Ploton D. Three-dimensional co-location of RNA polymerase I and DNA during interphase and mitosis by confocal microscopy. J Cell Sci. 1995;108:115–125. doi: 10.1242/jcs.108.1.115. [DOI] [PubMed] [Google Scholar]
- Haaf T, Schmid M. Chromosome topology in mammalian interphase nuclei. Exp Cell Res. 1991;192:325–332. doi: 10.1016/0014-4827(91)90048-y. [DOI] [PubMed] [Google Scholar]
- Haaf T, Steinlein C, Schmid M. Nucleolar transcriptional activity in mouse Sertoli cells is dependent on centromere arrangement. Exp Cell Res. 1990;191:157–160. doi: 10.1016/0014-4827(90)90051-b. [DOI] [PubMed] [Google Scholar]
- Hadjiolov AA. Ribosomal genes. In: Hadjiolov AA, editor. The Nucleolus and Ribosome Biogenesis. Vienna: Springer-Verlag; 1985. pp. 5–51. [Google Scholar]
- Héliot L, Kaplan H, Lucas L, Klein C, Beorchia A, Doco-Fenzy M, Ménager M, Thiry M, O’Donohue MF, Ploton D. Electron-tomography of metaphase nucleolar organizer regions (NORs): evidence for a twisted loop organization. Mol Biol Cell. 1997;8:2199–2216. doi: 10.1091/mbc.8.11.2199. [DOI] [PMC free article] [PubMed] [Google Scholar]
- Hochtrasser M, Mathog D, Gruenbaum Y, Saumweber H, Sedat JW. Spatial organization of chromosomes in the salivary nuclei of Drosophila melanogaster. J Cell Biol. 1986;102:112–123. doi: 10.1083/jcb.102.1.112. [DOI] [PMC free article] [PubMed] [Google Scholar]
- Hodge LD, Barrett JM, Welter DA. Computer graphics of SEM images facilitate recognition of chromosome position in isolated human metaphase plates. Microsc Res Tech. 1995;30:408–418. doi: 10.1002/jemt.1070300507. [DOI] [PubMed] [Google Scholar]
- Hodge LD, Martinez JE, Allsbrook WC, Pantazis CG, Welter DA. Intermediate structures in nuclear morphogenesis following metaphase from HeLa S3 cells can be isolated and temporally grouped. Chromosoma. 1990;99:169–182. doi: 10.1007/BF01731127. [DOI] [PubMed] [Google Scholar]
- Howell WM. The Cell Nucleus. Vol. 11. H. Busch and L. Rothblum, New York: Academic Press; 1982. Selective staining of nucleolus organizer regions (NORs) pp. 89–142. [Google Scholar]
- Jordan P, Mannervick M, Tora L, Carmo-Fonseca M. In vivo evidence that TATA-binding protein/SL1 colocalizes with UBF and RNA polymerase I when rRNA synthesis is either active or inactive. J Cell Biol. 1996;133:225–234. doi: 10.1083/jcb.133.2.225. [DOI] [PMC free article] [PubMed] [Google Scholar]
- Junera HR, Masson C, Géraud G, Suja J, Hernandez-Verdun D. Involvement of in situ conformation of ribosomal genes and selective distribution of upstream binding factor in rRNA transcription. Mol Biol Cell. 1997;8:145–156. doi: 10.1091/mbc.8.1.145. [DOI] [PMC free article] [PubMed] [Google Scholar]
- Le Negrate A, Beghdadi A, Dupoisot H. An image enhancement technique and its evaluation through bimodality. Computer Vision Graphics Image Processing. 1992;54:13–22. [Google Scholar]
- Lichter PL, Boyle AL, Cremer T, Ward DC. Analysis of genes and chromosomes by non-isotopic in situ hybridization. Genet Anal Tech Appl. 1991;8:24–35. doi: 10.1016/1050-3862(91)90005-c. [DOI] [PubMed] [Google Scholar]
- Lucas L, Gilbert N, Ploton D, Bonnet N. Visualization of volume data in confocal microscopy: comparison and improvements of volumic visualization methods. J Microsc. 1996;181:238–252. doi: 10.1046/j.1365-2818.1996.117397.x. [DOI] [PubMed] [Google Scholar]
- Merdes A, Stelzer EHK, de Mey J. The three-dimensional architecture of the mitotic spindle, analyzed by confocal fluorescence and electron microcopy. J Electron Microsc Tech. 1991;18:61–73. doi: 10.1002/jemt.1060180110. [DOI] [PubMed] [Google Scholar]
- Mitelman F, Heim S. Nonrandom chromosome changes in human cancer and leukemia. Chromosomes Today. 1990;10:169–184. [Google Scholar]
- Mosgöller W, Leitch AR, Brown JKM, Heslop-Harison JS. Chromosome arrangements in human fibroblasts at mitosis. Hum Genet. 1991;88:27–33. doi: 10.1007/BF00204924. [DOI] [PubMed] [Google Scholar]
- Nagele R, Freeman T, McMorrow L, Lee HY. Precise spatial positioning of chromosomes during prometaphase: evidence for chromosomal order. Science. 1995;270:1831–1835. doi: 10.1126/science.270.5243.1831. [DOI] [PubMed] [Google Scholar]
- Oud JL, Mans GJ, Van der Voort HTM, Van Spronsen EA, Nanninga N. Three-dimensional chromosome arrangement of Crepis capillaris in mitotic prophase and anaphase as studied by confocal scanning laser microscopy. J Cell Sci. 1989;92:329–339. doi: 10.1242/jcs.92.3.329. [DOI] [PubMed] [Google Scholar]
- Paddy MR, Chelsky D. Spoke: a 120-kD protein associated with a novel filamentous structure on or near kinetochore microtubules in the mitotic spindle. J Cell Biol. 1991;113:161–171. doi: 10.1083/jcb.113.1.161. [DOI] [PMC free article] [PubMed] [Google Scholar]
- Ploton D, Gilbert N, Ménager M, Kaplan H, Adnet JJ. Three-dimensional co-localization of nucleolar argyrophilic components and DNA in cell nuclei by confocal microscopy. J Histochem Cytochem. 1994;42:137–148. doi: 10.1177/42.2.8288859. [DOI] [PubMed] [Google Scholar]
- Ploton D, Ménager M, Jeannesson P, Himber G, Pigeon F, Adnet JJ. Improvement in the staining and in the visualization of the Ag-NOR proteins (argyrophilic proteins of the nucleolar organizer region) at the optical level. Histochem J. 1986;18:5–17. doi: 10.1007/BF01676192. [DOI] [PubMed] [Google Scholar]
- Ploton D, Thiry M, Ménager M, Lepoint A, Adnet JJ, Goessens G. Behavior of nucleolus during mitosis. A comparative ultrastructural study of various cancerous cell-lines using Ag-NOR staining procedure. Chromosoma. 1987;95:95–107. doi: 10.1007/BF00332182. [DOI] [PubMed] [Google Scholar]
- Raska Y, Dundr M, Koberna K, Melcak I, Risueno MC, Török I. Does the synthesis of ribosomal RNA take place within nucleolar fibrillar centers or dense fibrillar components? A critical appraisal. J Struct Biol. 1995;114:1–22. doi: 10.1006/jsbi.1995.1001. [DOI] [PubMed] [Google Scholar]
- Rendon MC, Rodrigo RM, Goenechea LG, Garcia-Herdugo G, Valdivia MM, Moreno F. Characterization and immunolocalization of a nucleolar antigen with anti-NOR serum in Hela cells. Exp Cell Res. 1992;200:393–403. doi: 10.1016/0014-4827(92)90187-d. [DOI] [PubMed] [Google Scholar]
- Robert-Fortel I, Junera HR, Géraud G, Hernandez-Verdun D. Three-dimensional organization of the ribosomal genes and Ag-NOR proteins during interphase and mitosis in Ptk1 cells studied by confocal microscopy. Chromosoma. 1993;102:146–157. doi: 10.1007/BF00387729. [DOI] [PubMed] [Google Scholar]
- Rost FWD. Quantitative Fluorescence Microscopy. F.W.D. Rost, New York: Cambridge University Press; 1991. Microfluorimetry: errors, standardization and data processing; pp. 41–58. [Google Scholar]
- Roussel P, André C, Comai L, Hernandez-Verdun D. The rDNA transcription machinery is assembled during mitosis in active NORs and absent in inactive NORs. J Cell Biol. 1996;133:235–246. doi: 10.1083/jcb.133.2.235. [DOI] [PMC free article] [PubMed] [Google Scholar]
- Roussel P, André C, Masson C, Géraud G, Hernandez-Verdun D. Localization of the RNA polymerase I transcription factor hUBF during the cell cycle. J Cell Sci. 1993;104:327–337. doi: 10.1242/jcs.104.2.327. [DOI] [PubMed] [Google Scholar]
- Scheer U, Rose KM. Localization of RNA polymerase I in interphase cells and mitotic chromosomes by light and electron microscopic immunocytochemistry. Proc Natl Acad Sci USA. 1984;81:1431–1435. doi: 10.1073/pnas.81.5.1431. [DOI] [PMC free article] [PubMed] [Google Scholar]
- Shelby RD, Hahn K, Sullivan KF. Dynamic elastic behavior of 224-satellite DNA domains visualized in situ in living human cells. J Cell Biol. 1996;135:545–557. doi: 10.1083/jcb.135.3.545. [DOI] [PMC free article] [PubMed] [Google Scholar]
- Spector DL. Macromolecular domains within the cell nucleus. Annu Rev Cell Biol. 1993;9:265–315. doi: 10.1146/annurev.cb.09.110193.001405. [DOI] [PubMed] [Google Scholar]
- Strouboulis J, Wolffe AP. Functional compartmentalization of the nucleus. J Cell Sci. 1996;109:1991–200. doi: 10.1242/jcs.109.8.1991. [DOI] [PubMed] [Google Scholar]
- Thiry M, Goessens G. The Nucleolus during the Cell Cycle. New York: R.G. Landes, Chapman and Hall; 1996. pp. 1–144. [Google Scholar]
- Verma RS, Babu A. In: Human Chromosomes: Principles and Techniques. Verma RS, Babu A, editors. New-York: McGraw-Hill; 1995. pp. 70–110. [Google Scholar]
- Vourc’h C, Taruscio D, Boyle AL, Ward DC. Cell cycle dependent distribution of telomeres, centromeres, and chromosome-specific subsatellite domains in the interphase nucleus of mouse lymphocytes. Exp Cell Res. 1993;205:142–151. doi: 10.1006/excr.1993.1068. [DOI] [PubMed] [Google Scholar]
- Warburton D, Henderson AS. Sequential silver staining and hybridization in situ on nucleolus organizing regions in human cells. Cytogenet Cell Genet. 1979;24:168–175. doi: 10.1159/000131373. [DOI] [PubMed] [Google Scholar]
- Weisenberger D, Scheer U. A possible mechanism for the inhibition of ribosomal RNA gene transcription during mitosis. J Cell Biol. 1995;129:561–575. doi: 10.1083/jcb.129.3.561. [DOI] [PMC free article] [PubMed] [Google Scholar]
- Welter DA, Black DA, Hodge LD. Nuclear reformation following metaphase in HeLa S3 cells: three-dimensional visualization of chromatid rearrangements. Chromosoma. 1985;93:57–68. doi: 10.1007/BF01259447. [DOI] [PubMed] [Google Scholar]
- Xing Y, Johnson CV, Moen PT, McNeil JA, Bentley Lawrence J. Non-random gene organization: structural arrangements of specific pre-m RNA transcription and splicing with SC-35 domains. J Cell Biol. 1995;131:1635–1647. doi: 10.1083/jcb.131.6.1635. [DOI] [PMC free article] [PubMed] [Google Scholar]
- Zatsepina OV, Voit R, Grummt I, Spring H, Semenov MV, Trendelenburg MF. The RNA polymerase I specific transcription initiation factor UBF is associated with transcriptionally active and inactive ribosomal genes. Chromosoma. 1993;102:599–611. doi: 10.1007/BF00352307. [DOI] [PubMed] [Google Scholar]