Abstract
This work presents the first implementation of cascaded stages for a microfabricated free-flow isoelectric focusing device. Both analytical and computational models for IEF suggest device performance will be improved by utilizing multiple stages to reduce device residence time. These models are shown to be applicable by using focusing of small IEF markers as a demonstration. We also show focusing of fluorescently tagged proteins under different channel geometries, with the most efficient focusing occurring in the cascaded design, as predicted by theory. An additional aim of this work is to demonstrate the compatibility of cascaded FF-IEF with common bioanalytical tools. As an example, outlet fractions from cascaded FF-IEF were analyzed by SDS-PAGE. Processing of whole cell lysate followed by immunoblotting for cell signaling markers demonstrates the reduction of albumin from samples, as well as the enrichment of apoptotic markers.
Introduction
Isoelectric focusing (IEF) is a powerful technique to separate proteins on a basis independent of molecular weight. Most commonly IEF is performed in a gel format, as the first dimension of a 2D gel, where immobilized pH gradient (IPG) strips are used to focus samples to high resolution, followed by a size based separation. The disadvantages of IPG strips include the limited sample composition, very low salt levels and highly denaturing conditions (8 M urea) are required to prevent gel burning and precipitation. Following the second dimension, the proteins must be removed from the gel for analysis by western blot or mass spectrometry, a time consuming process. Thus, the most promising routes for high throughput analysis lies with liquid phase separation techniques.1
Analytical separations by capillary IEF (CIEF) are an alternative to IPG strips as they offer the high resolution of IPG strips, but perform liquid phase separation.2 This advantage of CIEF has been used with various orthogonal separation and detection schemes to speed analysis times and promote automation. The disadvantage of CIEF is that it is a batch separation technique, only small sample volumes may be processed. For multidimensional separations, IEF is attractive not only as an analytical technique, but as a prefractionation technique to coarsely resolve complex samples.
Free flow isoelectric focusing (FF-IEF) continuously focuses amphoteric molecules (e.g. proteins and peptides) to their isoelectric point (pI). In this technique, a sample solution is pumped through a rectangular chamber and an electric field is applied perpendicular to the fluid flow. Either an imposed or natural pH gradient is established across the width of the chamber and is stabilized by the electric field. Devices to perform FF-IEF have been in use since the 1960's.3 FF-IEF is best suited as a preparative technique compared to capillary IEF or gel IEF, as it can fractionate large volumes of liquid with high recoveries (while maintaining protein biological activity) but with the trade-off of a lower separation resolution. Commercial FF-IEF devices have been developed4, 5 and shown to be successful as a prefracitonation tools for proteomic applications.6 However, commercial systems FF-IEF require many inlets to establish a pH gradient with specialized buffer sheath flow, requiring extra equipment, extra reagents, and dilution of the purified sample.
Microfabricated FF-IEF devices are attractive as simple, inexpensive, and disposable prefractionation devices that can either be integrated with separation techniques on chip, process hazardous or radio-labeled samples, or compliment existing orthogonal separation techniques, such as SDS-PAGE or capillary electrophoresis. Micro FF-IEF devices have been shown to separate and concentrate fluorescent dyes7, proteins8, 9, protein complexes10, and organelles.11 Practical challenges to micro-FF-IEF design and operation with a uniform electric field include removal or isolation of bubble-forming electrolysis products at the electrode interface, stable pH gradient formation, and Joule heating. To mitigate the effect of electrolysis, in these microdevices, researchers have used non-gassing electrodes8, diffusion potentials at the junction of two different solutions12-14, or electrode isolation using either fabricated structures with high hydrodynamic resistance9 or photopatterned polyacrylamide.7 To stabilize the pH gradient formation within the device, buffer sheath flow has been used.7, 8 Recently, we reported using functionalized gels in conjunction with an active cooling module to perform FF-IEF in a PDMS device without sheath flow or Joule heating effects.10 Another challenge for micro-FF-IEF devices is the task of collecting liquid fractions of different pI ranges for subsequent processing by orthogonal techniques such as capillary electrophoresis, SDS-PAGE, and immunoblotting (western blotting).
The notion of different focusing distances or multiple stages to design IEF tools within the scope of gel membrane or capillary IEF techniques has largely been ignored until recently, chiefly due to the lack of suitable fabrication techniques. However, advances in microfabrication techniques and polymer machining now enable the fabrication of new and complex geometries for isoelectric focusing. Segmented IEF using parallel functionalized gels15 was devised based on a simple analytical model. Das and Fan16 observed the effects of capillary IEF channel length on focusing time and resolution within a microfabricated device. Cui et al.17 controlled potentials across a channel with several T-junctions to perform multiple focusing operations while decreasing the pH gradient. By “zooming in” to a narrow pH range, higher resolution was obtained, but species outside of this range were lost.
Given the new freedom in microfabrication, design considerations for complex geometries are increasingly important. The mechanism of IEF results from the interplay of hundreds to thousands of charged species 3, making it difficult to model. Rigorous simulation tools 18-21 for capillary IEF have shown good agreement with experiments and have offered insights into the dynamics of IEF, but are not yet used in the design of new IEF tools. In this paper, we use simulations to determine the trade-offs of device geometry on FF-IEF performance in order to design faster and more efficient FF-IEF prefractionation tools. Figure 1 illustrates the concept of using cascaded IEF stages for more efficient FF-IEF. Micro FF-IEF rapidly establishes a steep pH gradient, enabling rapid focusing but with the consequence of lower resolution. Conventional FF-IEF tools use a shallower pH gradient, resulting in slower, but more resolved focusing. For cascaded FF-IEF, the final resolution is expected to be equivalent to focusing in a shallow pH gradient, but with the necessary residence time for focusing reduced. A shorter residence time in a free flow device equates to smaller device size and reduces losses associated with adsorption and electroosmotic flow. These efficient, simple devices could be fast and inexpensive enough to serve as a convenient technique to compliment many separation protocols.
Figure 1.
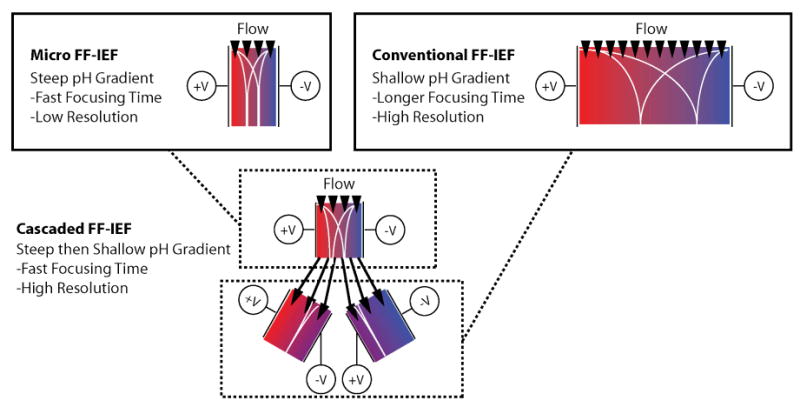
Motivation for cascaded free-flow isoelectric focusing. Using cascaded FF-IEF stages to change the pH gradient midway through focusing delivers resolution greater than micro-FF-IEF designs and in less time than conventional FF-IEF.
To explore the possibility of cascaded FF-IEF, the analytical expressions for IEF are first examined, followed by more rigorous numerical simulations of IEF for theoretical ampholytes in channels of different geometries. Following these analyses, devices are fabricated and tested. Our aims for cascaded IEF in a microfabricated device are: i) to demonstrate that focusing time can be reduced and ii) that the fractions produced these devices are compatible with existing molecular biology analytic techniques.
Experimental Section
Device Design and Fabrication
Free flow IEF devices were designed to have a sample channel defined by a porous material capable of allowing ion conduction between the sample channel and the electrode buffer, while preventing fluid convection between the two regions. Our previous 10 single stage straight channel design 20 mm long by 1 mm wide was compared with a similar straight channel design that was a 30 mm long by 3 mm wide as well as a cascaded design (Figure 2a). The channel height is nominally 50 microns in each of these designs. To demonstrate the speed and resolution advantages suggested by IEF modeling section, a device with cascaded IEF stages was designed and fabricated. The cascaded design consists of four focusing regions: the first IEF stage is a single channel (1 mm wide by 7.62 mm long) that branches into three secondary IEF stages with dimensions identical to the first stage. This split configuration was chosen over a 3 mm channel for two reasons: i) more uniform fluidic resistance for an improved flow field and sample collection and ii) more control over the electric field within the device. The anticipated pH range “zoomed in” for the three secondary stages (for Ampholine 3-10) is 3-5.3 (Figure 2a, V1 to V2), 5.3-7.7 (V2 to V5), and 7.7-10 (V5 to V6) from anode to cathode. The designs were based on a PDMS channel bordered by posts (Figure 2b) to define placement of the porous material without the need for a photo-polymerization mask. Small liquid reservoirs (2 for each straight design, 6 for the cascaded design) were manually cut out of the PDMS to contain catholyte and anolyte as well as platinum electrodes, which were connected to an external power source.
Figure 2.
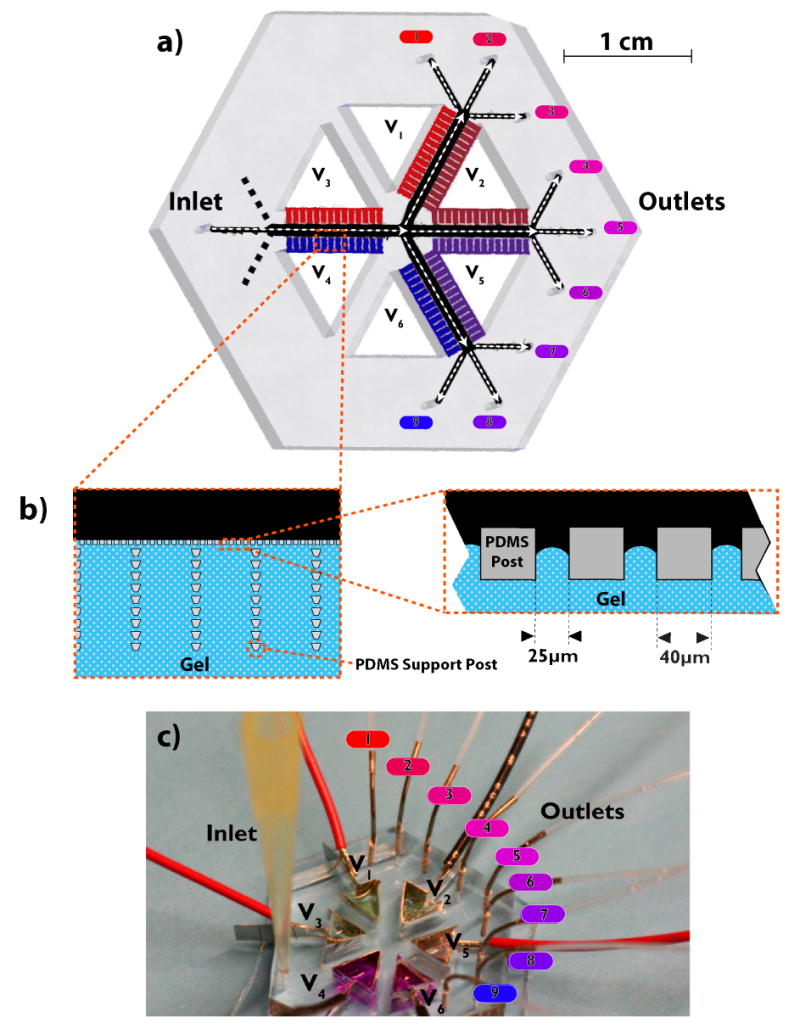
Cascaded FF-IEF device design. a) Rendering of the cascaded device. b) Detail of square channel posts and trapezoidal support array. c) Photo of device in operation.
The body of the device was fabricated using standard soft lithography techniques.22 Briefly, a silicon wafer was coated with a layer of SU-8 2050 (MicroChem, Newton, MA), which was pattered using a 5080dpi transparency mask (Pageworks, Cambridge, MA). Next, Sylgard 184, (Dow Chemicals, Midland, MI) was cast over the SU-8 mold and cured at 70°C for two hours. After curing, the PDMS was peeled off of the master; individual devices were cut out, and fluidic connections were punched using a 20 gauge Luer stub adapter (Becton-Dickinson, Sparks, MD). When a 23 gauge Luer stub adapter was inserted in to these holes, the connection was self-sealing; no epoxy or glue was necessary. Next, the devices (two at a time) were treated with oxygen plasma for 40 seconds prior to permanently bonding to a 50×75 mm microscope slide. After bonding, the microscope slide was scored and cut with a diamond scribe to separate pairs of devices. Next, the channels were filled with 1% 3-(trimethoxysilyl)propyl methacrylate in ethanol and allowed to dry at room temperature overnight.
Gel Casting
To cast acrylamide within the devices, the devices were rinsed with ethanol, and degassed in a vacuum oven at 70°C and 50 mmHg for more than 2 hours. Subsequently, the devices were kept under nitrogen using an acrylic glove box (Air Control, Inc., Henderson, NC). The monomer solution used in the polyacrylamide devices tested was 15% total acrylamide (15% T), with 3% of the acrylamide present as bis-acrylamide (3% C) (PlusOne ReadySol IEF, GE Healthcare, Piscataway, NJ). Note: solutions containing acrylamide are neurotoxic and should be handled with caution. Immobilines (pKa 3.6 and pKa 9.3, GE Healthcare) were added to the monomer solution (anode and cathode respectively) to a final concentration of 12 mM. To fill the anode side of the device, 60 μL of 1% v/v Triton X-100 (EMD Chemicals, Gibbstown, NJ), and 6 μL of 10% w/v DMPA (2,2-Dimethoxy-2-phenylacetophenone, Sigma-Aldrich, St. Louis, MO) in acetone was added to 1mL of the anode (pKa 3.6) monomer mixture. For the cathode side, 30 μL of 1% Triton and 6 μL of 10% DMPA was added to 1 mL of the cathode (pKa 9.3) monomer mixture. These anode and cathode monomer mixtures with DMPA and Triton were mixed together at a 2:1 or 1:2 ratios to form the intermediate pH gels used in the cascaded design. These intermediate gels were used to provide some pH stability at values anticipated to be 5.3 and 7.7 without additional reagents. Across the second stages from anode to cathode, the low pH buffering capacity of the gels is incrementally reduced as the high pH buffering capacity is increased.
These monomer mixtures were cast inside the devices by introducing them to the electrolyte reservoirs, where they were drawn into the device by capillary action. Reaching the hydrophobic PDMS posts at the sample channel, the solution was held in place by surface tension, long enough to polymerize using a UV lamp (354nm, Spectroline ENF-280C, Spectronics Corporation, Westbury, NY). DMPA was observed to graft the polyacrylamide gel to the PDMS. However, because DMPA is highly soluble in PDMS, incomplete polymerization occurred for very shallow channels, and for long wait times (>5 min) before exposure. To correct for this, long exposure times (2 minutes at a distance of 3 cm) were used to ensure adequate polymerization. After polymerization, the devices were stored under 1% w/v solution of poly(vinyl alcohol) (PVA, MW 146-186kDa, 87-89% hydrolyzed, Sigma-Aldrich).
Device Packaging and Operation
Platinum wires or foil (0.5 mm diameter or 0.1 mm thickness, Alfa Asear, Ward Hill, MA) were used to connect the electrode reservoirs to a high voltage electrophoresis power supply (VWR, West Chester, PA). Silicone sealant (ASI 502, American Sealants Inc, Fort Wayne, IN) was used to fix the wires in place and to form reservoirs for the anolyte and catholyte buffers. The anolyte used was 100 mM phosphoric acid with 1% w/v hydroxypropyl methyl cellulose (HPMC, Fluka, Buchs, Switzerland) and 1% Triton; the catholyte was 200 mM lysine and 200 mM arginine (10X IEF Cathode Buffer, Bio-Rad, Hercules, CA) in 1% HPMC and 1% Triton. To buffer the second stages to an intermediate pH, 50 mM MES (adjusted to pH 5.35) and 50 mM HEPES (adjusted to pH 7.25) buffers each with 1% HPMC and 1% Triton were used. Samples were pulled through the device using a multichannel syringe pump (EW-74901-10, Cole-Parmer, Vernon Hills, IL) equipped with nine 100μL gas-tight syringes (Hamilton, Reno, NV) set to withdrawal mode. At the inlet of device, a 200μL pipette tip was simply inserted into the PDMS. This sample reservoir was easily refilled by adding samples into the top of the pipette tip.
The size and layout of the cascaded device is too intricate to cool with commercially available thermoelectric elements. Therefore, two cooling strategies were employed. For fluorescent samples, the devices were cooled by venting nitrogen gas withdrawn from a liquid nitrgen cylinder over the glass underside of the device while it was mounted on the microscope stage. The forced convection proved to be sufficient to observe focusing, although it was not as effective as a thermoelectric cooling module 10. For SDS-PAGE or immunoblot analysis, where no in situ observations were required, the devices were cooled by placing the device atop an aluminum heat sink (659-65AB, Wakefield Engineering, Pelham, NH) inverted (fins down) in a shallow dish. The dish was filled with enough ice water to immerse the fins of the heat sink, effectively keeping the device near 0°C.
To apply voltages to the cascaded devices, three power supplies were connected in parallel to apply up to 180V to one reservoir, (V1 in Figure 2a), 120V (V2 and V3), or 60V to others (V4 and V5), while grounding the remaining reservoir (V6). This configuration results in 60V across each focusing region within the device, and minimizes electrical interaction between regions.
Dye and Protein Preparation
Dye focusing experiments were conducted with fluorescent low molecular weight pI markers (isoelectric points: 5.1, 7.2, 7.6, and 9.5, Fluka, Buchs, Switzerland). Markers were used at a final concentration of 1 mg/mL. Ampholine 3-10 and NP-40 (Nonident P-40 substitute, Fluka) were added to deionized water (Millipore, Billerica, MA) to a final concentration of 2% and 0.5%, respectively.
To visualize the focusing of fluorescently labeled protein, Alexa 488 conjugated protein G (Invitrogen, Carlsbad, CA) was mixed in phosphate buffered saline (PBS, Invitrogen) with 2% Ampholine 3-10 (Fluka) to a final concentration of 80 μg/mL (4 mM). For experiments where the fractions were subsequently processed by SDS-PAGE, the sample consisted of unlabeled protein standards for IEF: amylglucosidase, carbonic anhydrase II, trypsin inhibitor, and trypsinogen (IEFM1A-1KT, Sigma-Aldrich) as well as Alexa labeled protein G and Texas Red labeled streptavidin (Invitrogen) were mixed together in PBS with 2% Ampholine to a final concentration of 0.95 mg/mL for the unlabeled protein standards, and 0.24 mg/mL for protein G and streptavidin. Approximately 0.4 mL of sample was used for each experiment.
Semi-quantitative immunoblot assays of total ERK2, phosphorylated AKT (pAKT), and cytochrome C were performed using HeLa cell lysates. HeLa cells (ATCC, Manassas, VA) were cultured in DMEM medium supplemented with 10% fetal serum, 100 units/mL penicillin, 100 μg/mL streptomycin, and 2 mM glutamine (Invitrogen) at 37 °C and 5% CO2. For narrow pH range focusing, the cells were washed with PBS prior to lysis to remove albumin in the cell media. The lysis buffer consisted of: 1% Triton X-100, 150 mM NaCl, 10 mM β-glycerophosphate, 10 mM Na4P2O7, 10 mM NaF, 1 mM Na3VO4, 10 μg/mL leupeptin, 10 μg/mL pepstatin, and 10 μg/mL chymostatin. To ensure both phosphorylated and unphosphorylated forms of ERK, half of the cell lysate originated from cells stimulated with 50 ng/mL TNF-α for 10 minutes. The insoluble (pellet) and soluble (supernatant) fractions were isolated by centrifugation (10min at 20000g). No other purification steps were performed. Before FF-IEF, the sample was mixed with an equal volume of 8M urea, adjusted to a final concentration of 0.45% NP-40 and 15 mM CHAPS (3-[(3-Cholamidopropyl)dimethylammonio]-1-propanesulfonate, JT Baker, Phillipsburg, NJ) and 2% Ampholine pH 3-10.
Imaging and Analysis
Focusing behavior was observed with an inverted fluorescent microscope (Axiovert 200, Carl Zeiss, Inc, Thornwood, NY) with a high speed 8-bit color camera (MF-046C, Allied vision technology GMBH). A FITC filter was used to detect green fluorescence. Full frames were captured with a shutter time between 100 ms and 2.5 seconds, depending on the fluorescent intensity of the sample. The images captured by the camera were subsequently processed by programs written in MATLAB. Full-color images were desaturated and contrast enhanced prior to analysis. To find pixel intensity across the width of the channel, 50 to 500 pixels from a steady state image were averaged.
SDS-PAGE and Immunoblotting
Following FF-IEF, the collected fractions were mixed with SDS-PAGE tricine sample buffer containing β-mercaptoethanol as a reducing agent and separated on a precast 10 or 12 lane tricine gel according to the manufacturer's instructions. Following electrophoresis, the gel was stained using either a silver staining kit (Thermo Fisher, Portsmouth, NH) or Coomassie (Simply Blue, Invitrogen) according to the manufacturer's instructions. The setup and run time (approximately an hour) for the IEF separation was equivalent or less than the SDS-PAGE setup and run time.
Immunoblots of total ERK2 (SC1647, Santa Cruz Biotechnology, Santa Cruz, CA), phosphorylated AKT (pAKT, sc-33437-R, Santa Cruz Biotechnology), and cytochrome C (556433, BD Biosciences, San Jose, CA) were performed using the same primary antibodies as for flow cytometry at a 1:1000, 1:500, and 1:1000 dilution, respectively. Proteins were separated by SDS-PAGE and transferred to nitrocellulose. After blocking (30-60 min at room temperature), blots were probed overnight at 4 °C in primary antibody, washed 3 times for 5 min in TBS-T (20 mM Tris-HCl pH 7.5, 150 mM NaCl, 0.1% Tween-20), incubated 1 h at room temperature in secondary antibody (1:5000 IRDye800-conjugated donkey anti-rabbit IgG, Rockland Immunochemicals), and finally washed 3 × 5 min in TBS-T. Blots were scanned on an Odyssey imaging system (Li-Cor Biosciences)
Results and Discussion
Analytical Scaling Approximations for IEF
The derivation in the supplementary section (similar to other analytical solutions 23, 24) yields Equations 1 and 2. These equations were used to define the focusing resolution and characteristic focusing time, respectively, of an idealized species in a pre-established pH gradient.
| (1) |
| (2) |
From Equation 1, the focusing resolution, Res, depends on the square root of the electric field, E, mobility μ, the difference in species charge Δz across the channel width w, divided by diffusion constant D. Equation 2 describes the relationship between the characteristic focusing time (t*) and focusing distance as linear with respect to w.
Simulations of IEF in Channels of Varying Widths
Because the analytical expressions for IEF must assume an established pH gradient, and do not consider nonlinear changes in sample conductivity, a 2-D IEF model using Jacobian (Numerica Technologies, Cambridge, MA)10 was employed to explore the effect of distance on focusing dynamics. This model is based on previously published models 18, 19, 25 and assumes electroneutrality and instant pH equilibrium for a mixture of 140 biprotic ampholytes. The model was expanded to accommodate dynamic changes in channel width and applied voltage, to compare focusing dynamics for channels of various widths. A model with 240 spatial points (resulting in over 135,000 coupled equations) was used to simulate focusing at these widths, requiring about 3 hours of CPU time on a 3.8 GHz personal computer. Custom MATLAB (The Mathworks, Natick, MA) programs were used to provide Jacobian self-consistent initialization conditions, as well as to parse and post-process the simulation results.
To test the analytical predictions, several simulations were run at various widths and constant average electric field (100V/cm). Figure 3 shows the results of these simulations, plotting the time to reach steady state (tss, Figure 3a) and resolution Res (from a Gaussian fit of one of the ampholytes, Figure 3b) versus channel width for the simulations. A nearly linear relationship (exponent of 0.908) exists between focusing time and channel width, as predicted by scaling arguments. The relationship between resolution and channel width also follows the predicted power law behavior, with a fitted exponent of 0.488 versus 0.5 for the analytical case. From the solid lines in Figure 3, a wider FF-IEF channel has the effect of increasing both focusing resolution and focusing time. These results indicate that the effects of pH gradient formation and changes in conductivity do not significantly alter the idealized focusing behavior of simple ampholytes, underscoring the usefulness of the analytical expressions for IEF.
Figure 3.
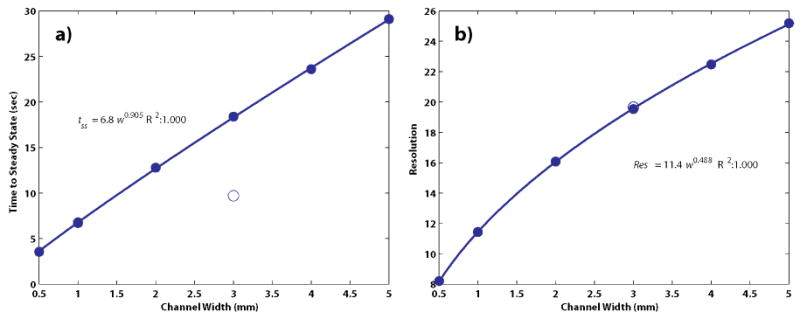
Dynamics of the IEF simulation with respect to channel size. The results of simulations (solid circles) were fitted to two-parameter power law equations of the form y=awb (solid lines). The time to reach steady state, a) is nearly linear (w0.908) with respect to the channel width. The resolution b) at steady state, as defined by Equation (1), increased with nearly the square-root of the channel width (w0.488). These findings are consistent with analytical expressions for IEF. A simulation of focusing for 5 sec at 1 mm followed by focusing at 3 mm (open circles) shows that high resolution can be reached in much less time.
In order to examine the effect of changes in channel geometry, a simulation was made where the channel was instantly widened from 1 to 3 mm after 5 seconds (Figure 3, open circles). The results show that the higher resolution of the 3 mm channel can be reached in half the time (8.70 versus 17.49 seconds to steady state) when the average electric field is held constant at 100 V/cm. Similar simulation results for protein focusing shown in Figure S-1 show that these findings are valid for species with more complicated electrophoretic behavior.
Marker Focusing
Fluorescent IEF markers were focused in the device to determine if using cascaded stages could deliver increased resolution. To focus these markers, 75 to 85V were applied across each section of the device for inlet flowrates of 55nL/s. Figure 4 plots intensity versus position at the exit of the first and second stages. Gaussian fits to the pI 5.1 marker exiting both the first and second stage were used to calculate focusing resolution (Res) according to Equation (1). The improvement in resolution from the first to second stage (10.7 vs. 5.9) is a factor of 1.81, consistent with the expected value of 1.71 for a 3-fold increase in channel width. Under ideal conditions, using Ampholine 3-10, the pH range in the main channel should be 3-10 from the anode to the cathode. The pH range in the second channels should ideally be 3-5.3, 5.3-7.7, and 7.7-10. However, from Figure 4, it is clear that the pI 5.1 marker focuses in the second channel, illustrating a cathodic shift in the pH gradient.
Figure 4.
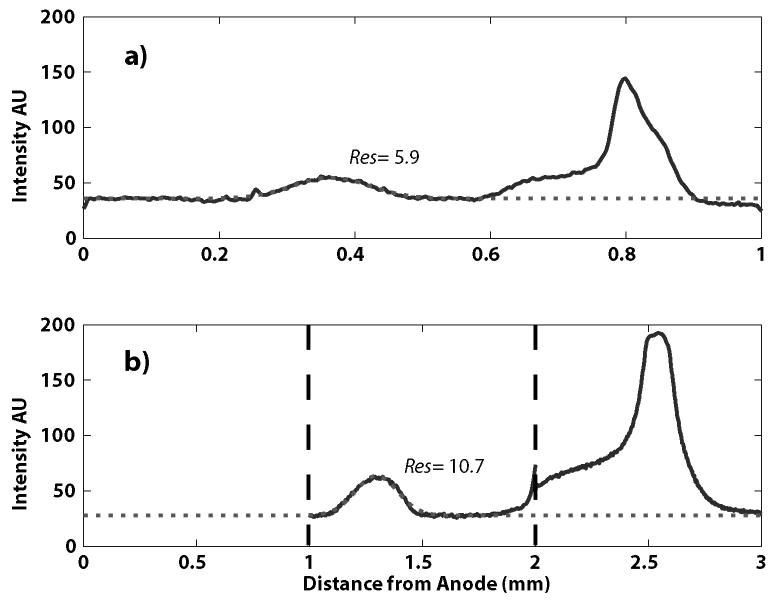
Focusing of IEF markers in the cascaded design. Focusing at the exit of the first stage (a) shows a fluorescent profile (solid line) similar to our earlier work.10 Here, a Gaussian peak (dotted line) is fitted to the peak of the pI 5.1 marker, yielding a steady-state resolution of 5.9 after 6.8 seconds of focusing. Intensities at the exit of the second stages (b) show greater resolution and concentration of the markers after an additional 20.4s of focusing. A Gaussian fit to the pI 5.1 marker calculates a resolution of 10.7, consistent with theory.
Protein Focusing
The ultimate goal of our micro-FF-IEF device work is to develop a rapid separation tool that is compatible with current biological techniques. To demonstrate this, a mixture of proteins with known pI's and molecular weights were separated in the device. Figure 5 shows focusing of protein G in each of the three designs with the same field strength. The 1 mm wide straight channel device reaches steady state before the other designs, but with the lowest resolution. The 3 mm wide device required the longest residence time to reach steady state, approximately 22 seconds, as predicted by theory. The cascaded device required approximately 14s of focusing time, but had a final resolution comparable to the wider straight channel design. However, incomplete fractionation of proteins in the semi-focused first stage results in protein G entering stages with pH ranges above its pI. This incomplete focusing results in minor buildup and adhesion on the anode gel in the neighboring stages shown by the solid line in Figure 5b at x/w= 0.33 and 0.67.
Figure 5.
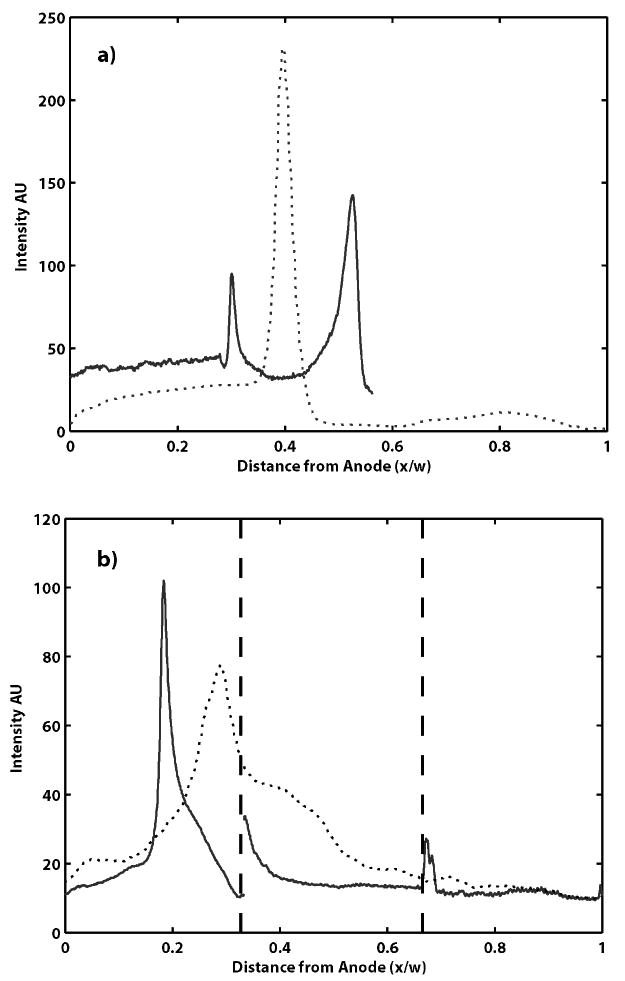
Focusing of Alexa protein G in channels of varying widths a) Focusing in a 3 mm channel (solid line, w =3 mm – only part of the channel could be imaged) for 13s is still incomplete, while it reaches steady state in less than 9s in a 1mm device (dotted line, w =1 mm). b) Focusing in the cascaded design shows incomplete focusing after 3.4 seconds in the first stage (dotted line, w =1 mm), but is tightly focused after an additional 10.2s in the second stage (solid line spliced from each stage, w =3 mm)
SDS-PAGE and Immunoblotting
To demonstrate that the cascaded FF-IEF device can be used with other orthogonal separations, a mixture of proteins with known pI and molecular weight were separated in the device, and loaded on a SDS-PAGE gel. In all cases the outlets are numbered from 1 to 9 with outlet #1 corresponding to the lowest pH fraction and outlet #9 to highest pH fraction. Figure 6 shows the Coomassie stained gel where each IEF fraction 1-9 is separated in one lane of the gel. The gel shows that the proteins were focused into one, two, or three IEF fractions, and that no two fractions had the same protein composition. The labeled recombinant streptavidin was reduced by the tris-tricene sample buffer into its four subunits appearing at 13.2 instead of 57 kDa. The collected fractions are the integral of an hour of continuous focusing in the device; the consistent focusing shows that there is minimal drift in device performance. Of note is the compressed pH gradient observed in other focusing work.10, 16, 17 The linear ampholyte pH range of 3-10 is expected to be bordered by more extreme, nonlinear pH regions formed by dissociated ions from the salts present in the PBS. This results in the empty fractions near the anode and cathode (1, 8, and 9). Also, carrier ampholytes (which can interfere with detection tools such as mass spectrometry) were easily separated from the proteins in the outlet fractions, staining as a low molecular weight (< 1 kDa) band just above the salt front. This coarse 2-D separation requires less labor and one-tenth the operating time of a 2-D gel.
Figure 6.
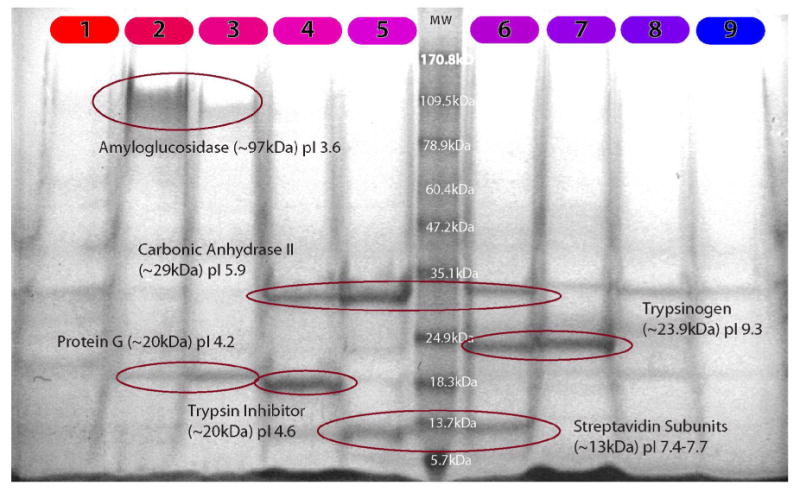
Coomassie stained SDS-PAGE of five model proteins in PBS separated in a 3-10 pH gradient. Outlets are numbered from the most acidic (1) to the most basic (9). Sample processed at 111 nL/s (14s residence time) and ∼150V/cm.
For low abundance proteins (such as signaling kinases) detection must be performed using affinity techniques such as immunoblotting. To demonstrate the ability of the cascaded devices to fractionate and simplify the most complex and challenging of samples, we chose to fractionate whole cell lysate in the devices. An additional application of the device is to remove major contaminants such as albumin from samples. As an example, Figure S-2 (supplementary material) shows western blots of the kinase JNK in lysate contaminated with cell medium where FF-IEF was used to reduce albumin in the sample.
Figure 7 shows pAKT, total ERK2, and cytochrome C focusing in a 3-10 pH gradient under denaturing conditions as well as total protein (as determined by silver staining) present in each outlet. Band intensity was quantified and scaled to represent fold concentration over the averaged outlet signal and total protein levels. Here, cytochrome C focuses well at its pI of ∼9.6, with over a 200% (3-fold) enrichment for outlets 8 and 9. ERK2 and pAKT show 100% enrichment, presumably due to the short focusing time and multiple pIs across the 5-7 range for various isoforms.
Figure 7.
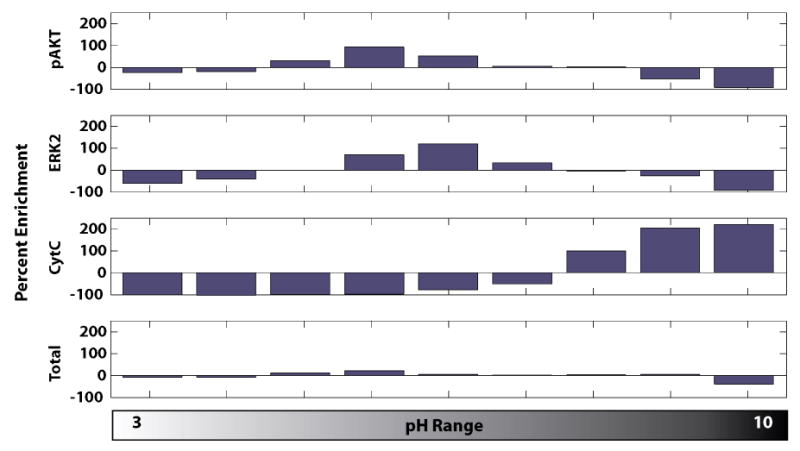
Immunoblot and silver stain results for signaling proteins in HeLa cell lysate focused in a 3-10 pH gradient. Phospho-AKT and total ERK2 signal shows weaker focusing, with a maximum concentration factor of twofold. Cytochrome C is focuses strongly at a high pH, consistent with its high isoelectric point. As these proteins are focused, the total amount of protein, as determined by silver stain remains largely unchanged. These proteins are concentrated and collected from whole cell lysate at 83nL/s (18s of focusing) at ∼300V/cm.
Under non-denaturing conditions in Figure S-3, different focusing behavior was observed. In particular, cytochrome C would focus to an average pI of approximately ∼5.7, far from its expected pI. This apparent shift in pI is most likely due to the focusing of a protein complex or mitochondria 11 still intact in the whole cell lysate. Cytochrome C is present in mitochondria but is released under denaturing conditions.
Conclusions
We have demonstrated that the use of multiple stages for free flow isoelectric focusing can be used to more efficiently sort proteins in a complex mixture such as whole cell lysate. Using analytical expressions and numerical simulations, a cascaded design was proposed and fabricated to improve FF-IEF speed and resolution. Fabrication improvements, specifically maskless patterning of chemically different gels and gel-PDMS grafting with an UV initiator, were used to create devices. For cascaded FF-IEF the final resolution is expected to be equivalent to focusing in a shallow pH gradient; however, the necessary residence time for focusing is reduced. With a lower residence time, smaller device sizes are possible, reducing surface adsorption, Joule heating, and device manufacturing costs.
These simple, disposable FF-IEF devices have proven utility and reproducible performance, with operating times an order of magnitude faster than conventional techniques. FF-IEF has been shown to focus native model proteins, denatured proteins as well as protein complexes. Moreover, these FF-IEF devices tolerate messy, salty samples that present difficulties to other techniques such as IPG gel strips. Microfabricated FF-IEF devices have promise as disposable tools with reduced capital and operational costs compared to bench scale FF-IEF equipment, although this equipment can still benefit from cascaded stages. Although it is a relatively low-resolution technique, micro-FF-IEF with outlet collection is versatile and compatible with other common downstream techniques such as SDS-PAGE and immunoblotting. We have shown here that micro-FF-IEF performance can be improved with the use of cascaded stages that are easy to design and fabricate. For these reasons, micro-FF-IEF could become a very attractive “first step” separation tool for protein isolation and detection.
Supplementary Material
A derivation of analytical IEF expressions, additional simulation results, and additional experimental results are presented as supporting information. This material is available free of charge at http://pubs.acs.org.
Acknowledgments
We thank the National Institutes of Health (P50-GM68762) for funding; the staff of the MIT Microsystems Technology Laboratories for technical support; John Tolsma (Numerica Technologies) for assistance with Jacobian; J. Wen for proofreading the manuscript; S. Gaudet, and B. Aldridge for critical reagents and valuable assistance with immunoblotting and cellular preparations.
References
- 1.Kraly J, Fazal MA, Schoenherr RM, Bonn R, Harwood MM, Turner E, Jones M, Dovichi NJ. Analytical Chemistry. 2006;78:4097–4110. doi: 10.1021/ac060704c. [DOI] [PubMed] [Google Scholar]
- 2.Kilar F. Electrophoresis. 2003;24:3908–3916. doi: 10.1002/elps.200305650. [DOI] [PubMed] [Google Scholar]
- 3.Righetti PG. Isoelectric Focusing: Theory, Methodology and Applications. Elsevier; Amsterdam: 1983. [Google Scholar]
- 4.Weber G, Bocek P. Electrophoresis. 1996;17:1906–1910. doi: 10.1002/elps.1150171216. [DOI] [PubMed] [Google Scholar]
- 5.Burggraf D, Weber G, Lottspeich F. Electrophoresis. 1995;16:1010–1015. doi: 10.1002/elps.11501601169. [DOI] [PubMed] [Google Scholar]
- 6.Hoffmann P, Ji H, Moritz RL, Connolly LM, Frecklington DF, Layton MJ, Eddes JS, Simpson RJ. Proteomics. 2001;1:807–818. doi: 10.1002/1615-9861(200107)1:7<807::AID-PROT807>3.0.CO;2-6. [DOI] [PubMed] [Google Scholar]
- 7.Kohlheyer DB, Geert AJ, Schlautmann Stefan, Schasfoort Richard BM. Lab on a Chip. 2006;6:374–380. doi: 10.1039/b514731j. [DOI] [PubMed] [Google Scholar]
- 8.Macounova K, Cabrera CR, Yager P. Analytical Chemistry. 2001;73:1627–1633. doi: 10.1021/ac001013y. [DOI] [PubMed] [Google Scholar]
- 9.Xu Y, Zhang CX, Janasek D, Manz A. Lab on a Chip. 2003;3:224–227. doi: 10.1039/b308476k. [DOI] [PubMed] [Google Scholar]
- 10.Albrecht J, Jensen KF. Electrophoresis. 2006;27:4960–4969. doi: 10.1002/elps.200600436. [DOI] [PubMed] [Google Scholar]
- 11.Lu H, Gaudet S, Schmidt MA, Jensen KF. Analytical Chemistry. 2004;76:5705–5712. doi: 10.1021/ac049794g. [DOI] [PubMed] [Google Scholar]
- 12.Cabrera C, Finlayson B, Yager P. Analytical Chemistry. 2001;73:658–666. doi: 10.1021/ac000495a. [DOI] [PubMed] [Google Scholar]
- 13.Macounova K, Cabrera C, Holl MR, Yager P. Analytical Chemistry. 2000;72:3745–3751. doi: 10.1021/ac000237d. [DOI] [PubMed] [Google Scholar]
- 14.Song YA, Hsu S, Stevens AL, Han JY. Analytical Chemistry. 2006;78:3528–3536. doi: 10.1021/ac052156t. [DOI] [PubMed] [Google Scholar]
- 15.Zilberstein GV, Baskin EM, Bukshpan S. Electrophoresis. 2003;24:3735–3744. doi: 10.1002/elps.200305663. [DOI] [PubMed] [Google Scholar]
- 16.Das C, Fan ZH. Electrophoresis. 2006;27:3619–3626. doi: 10.1002/elps.200600013. [DOI] [PubMed] [Google Scholar]
- 17.Cui HC, Horiuchi K, Dutta P, Ivory CF. Analytical Chemistry. 2005;77:7878–7886. doi: 10.1021/ac050781s. [DOI] [PubMed] [Google Scholar]
- 18.Mao QL, Pawliszyn J, Thormann W. Analytical Chemistry. 2000;72:5493–5502. doi: 10.1021/ac000393k. [DOI] [PubMed] [Google Scholar]
- 19.Mosher RA, Gebauer P, Caslavaska J, Thormann W. Analytical Chemistry. 1992;64:2991–2997. doi: 10.1021/ac970513x. [DOI] [PubMed] [Google Scholar]
- 20.Thormann W, Huang TM, Pawliszyn J, Mosher RA. Electrophoresis. 2004;25:324–337. doi: 10.1002/elps.200305749. [DOI] [PubMed] [Google Scholar]
- 21.Thormann W, Mosher RA. Electrophoresis. 2006;27:968–983. doi: 10.1002/elps.200500575. [DOI] [PubMed] [Google Scholar]
- 22.Duffy DC, McDonald JC, Schueller OJA, Whitesides GM. Analytical Chemistry. 1998;70:4974–4984. doi: 10.1021/ac980656z. [DOI] [PubMed] [Google Scholar]
- 23.Vesterberg O, Svensson H. Acta Chemica Scandinavica. 1966;20:820–834. doi: 10.3891/acta.chem.scand.20-0820. [DOI] [PubMed] [Google Scholar]
- 24.Rilbe H. Annals of the New York Academy of Sciences. 1973;209:11–22. doi: 10.1111/j.1749-6632.1973.tb47520.x. [DOI] [PubMed] [Google Scholar]
- 25.Bier M, Paulinski OA, Mosher RA, Saville DA. Science. 1983;219:1281–1287. doi: 10.1126/science.6828855. [DOI] [PubMed] [Google Scholar]
Associated Data
This section collects any data citations, data availability statements, or supplementary materials included in this article.
Supplementary Materials
A derivation of analytical IEF expressions, additional simulation results, and additional experimental results are presented as supporting information. This material is available free of charge at http://pubs.acs.org.


