

Abstract
Foveal and parafoveal increment thresholds were measured for 50 observers (12−88 years of age) under conditions that isolated retinal mechanisms dominated by short- (S-), middle- (M-), or long- (L-) wave-sensitive cones. Thresholds were obtained on the plateau of the threshold-versus-intensity function of each isolated mechanism and were referred to the retina by using individual measurements of ocular media and macular pigment density. Age-related increases in foveal thresholds, specified at the retina, were found for all three cone mechanisms. Parallel sensitivity losses for each cone mechanism were also observed at 4° and 8° in the temporal retina. A significant positive correlation was found between foveal macular pigment density and the S-cone, but not the M- and L-cone, log sensitivity difference (0°−8°) specified at the retina. This relation is expected from the hypothesis that the macular pigment protects the photoreceptors from senescent losses in sensitivity. However, because this result is independent of age, it is interpreted as being due to local gain changes resulting from differential filtering of incident light by the macular pigment between the fovea and the parafovea.
1. INTRODUCTION
Age-related losses in the sensitivity of short- (S-), middle- (M-), and long- (L-) wave-sensitive cone mechanisms have been documented,1,2 but the magnitude of these losses in the fovea and the parafovea are still not agreed on. Recent studies have been more informative about the sites of sensitivity loss than earlier studies because of attempts to control for senescent changes in retinal illuminance that result from age-related reductions in pupillary area3 and increases in the density of the ocular media.4 Because of senescent neural changes, however, any equation physically of stimuli for observers of different ages virtually guarantees that they will not be equated physiologically. We have recently shown that, at least for an S-cone mechanism, age-related losses in sensitivity depend on the level of light adaptation.5 Variations across studies in the level of light adaptation may thus explain some of the variation in estimates of senescent cone sensitivity losses. In this study stimuli were varied physically between observers in order to equate the state of light adaptation. Thresholds for mechanisms dominated by the sensitivity of S, M, and L cones were measured for test lights superimposed on appropriate background and auxiliary fields that placed subjects on the plateau of their threshold-versus-intensity (tvi) functions.
The sensitivity of each cone mechanism was probed at three retinal loci (fovea and 4° and 8° temporal retina) that differ in their prereceptoral screening by macular pigment (MP). These data were used to evaluate hypotheses about the role of MP in long-term regulation of visual sensitivity. One suggested role of MP is that it may impart some protection to the central retina from photo-chemical changes contributing to senescence. Evidence consistent with this possibility has been reported by Haegerstrom-Portnoy,6 who observed that sensitivity losses in an S-cone mechanism of an older group of observers, relative to those for young controls, were less in the fovea, where the density of the MP is highest, than in the parafovea. Consistent with this study, Hammond et al.7 showed that older individuals with high MP density had higher S-cone sensitivity (specified at the retina) than individuals of the same age having lower MP density. The clinical implications of such a finding may be important in light of recent work showing that MP density can be increased by dietary supplementation with lutein and zeaxanthin.8-10
Conclusions that can be drawn from these psychophysical studies are somewhat limited, however, because measurements did not include cone sensitivity at more than one retinal locus and/or MP density estimates in the same observers. These methodological concerns are important in view of an alternative hypothesis. It might be that long-term adaptation or gain changes in the foveal S cones results in higher sensitivity that is directly related to the reduction in short-wave light that is due to MP screening. This type of (multiplicative) scaling of receptor sensitivity, in proportion to long-term quantal catch, has been proposed to explain why there is little age-related change in the stimulus that appears achromatic, despite reductions in short-wave light incident on the retina that are due to lenticular senescence.11 A similar explanation, but one requiring long-term postreceptoral gain changes, has been proposed to account for within-subject variation in the yellow–blue opponent-cancellation function with retinal eccentricity,12 despite inhomogeneity of the spatial distribution of MP. These results could be due to compensation by the visual system for the spectrally selective screening of the retinal illuminant by the lens and MP. Such compensation would also tend to promote constancy of color appearance across the life span.2,13,14 Renormalization of receptor sensitivities relative to natural illuminants has been suggested in other contexts, both implicitly15 and explicitly.16 No explicit physiological mechanism for renormalization has been suggested, but it is interesting to note that in rat rods, outer segment length, cell diameter, rhodopsin packing per disk, and regeneration rate may all vary, so that photon capture is relatively constant across a range of ambient intensities.17,18 The MP protection hypothesis and the compensation hypothesis both predict a correlation between MP density and foveal S-cone sensitivity, unlike the case for parafoveal S-cone sensitivity (specified at the retina), but only the former predicts that this correlation should be age dependent.
The results of the present study show that thresholds for the S-, M-, and L-cone mechanisms increase linearly in the central retina with age. The sensitivity difference between 0° and 8° for the S-cone mechanism, but not the M- and L-cone mechanisms, was significantly related to peak MP density, but this effect was unrelated to observer age. These results would not be predicted from the MP protection hypothesis; however, they are consistent with the hypothesis that long-term changes in S cones or their postreceptoral pathways compensate for the loss of stimulation that is due to the presence of MP in the fovea.
2. METHODS
A. Subjects
Twenty-two males and 28 females between the ages of 12 and 88 years participated in five or more test sessions that lasted approximately 1.5 hours each. At the time of testing, none of the subjects reported having any systemic, ocular, or neurological diseases that disrupted normal visual function. Undilated direct ophthalmoscopy was performed by a licensed optometrist on all subjects to rule out the presence of retinal disease and abnormal ocular media. All subjects demonstrated a corrected visual acuity (Bailey–Lovie Eye Chart #4) of 20/30 or better, as well as normal color vision when tested with the Farnsworth Panel D-15 test, the F-2 plate, and American Optical HRR pseudoisochromatic plates. In addition, 1−1.5 years after testing, a clinician performed a dilated fundus examination and intraocular pressure measurements using applanation tonometry on the 23 subjects over the age of 50 at the time of testing. At the time of these examinations, healthy retinas were found in every case. It is thus unlikely that age-related disease was present in early stages at the time of testing.
Although not used as a screening criterion, subjects were asked about their history of smoking behavior in view of evidence that it is negatively correlated with MP density.19 Two older observers (>50 years) reported smoking more than 20 cigarettes per day, while five younger observers (<50 years) reported smoking 1−5 cigarettes per week.
B. Apparatus
Stimuli were produced with a five-channel Maxwellian-view optical system having two sources (1-kW and 300-W xenon arc lamps) regulated by dc supplies. Light from each channel was rendered monochromatic by use of narrow-band interference filters (Ditric) or holographic grating monochromators (Instruments SA, V-20) having half-band passes <8 nm. Calibrated neutral-density filters and wedges were placed in collimated and focused portions of the beams, respectively. Wedge positions were controlled by computer or the subject and monitored with potentiometers and a linear readout system. The optical channels were combined by beam splitters or by a rotating sectored mirror to produce square-wave flicker. Presentation of the square-wave test flashes was controlled by a liquid-crystal shutter (Displaytech, model LV1300AC). Fixation points were formed by three ∼15-arc-min opaque dots placed on a thin glass cover slip over the aperture forming the background field. Test lights could then be imaged along the horizontal meridian of the temporal retina at 0°, 4°, and 8° eccentricity. The combined beams were focused onto a common artificial pupil and passed through an individually determined spherical corrective lens. The final Maxwellian-view image was of 1.5-mm diameter at the plane of the observer's pupil.
An adjustable chair and bite-bar assembly, allowing movements along three orthogonal directions, were used to position the subjects. The centration of the Maxwellian image in the plane of the pupil was evaluated by using a pupil viewer.
C. Calibrations
Radiometric measurements of the spectral lights and calibrations of the neutral-density wedges and filters were made by using a silicon photodiode and a linear readout system (United Detector Technology, 81 Optometer) that was calibrated relative to the standards of the National Institute of Standards and Technology. Photometric measurements were made with a Minolta (LS-100) photometer and a barium sulfate plate and then converted to retinal illuminance by using the method described by Westheimer.20 Calibration of the wavelength dial of the monochromators was obtained by adjusting the dial so that maximal emission of a He–Ne laser occurred at 632.8 nm and was confirmed with a series of mercury-line interference filters.
D. Procedures
1. Measurement of Ocular Media Density
The density of the ocular media was measured following the technique of van Norren and Vos.21 Following 30 min of dark adaptation, flicker detection thresholds were obtained by using the method of adjustment for two monochromatic lights (400 and 565 nm). Time permitting, additional scotopic thresholds were obtained for a second pair of monochromatic stimuli (410 and 561 nm). Test lights were 8° in diameter, presented at 12° temporal eccentricity and square-wave modulated at 3 Hz. A 0.7°, 650-nm light served as the fixation point. Stimuli were presented in random order, and 5−8 settings were obtained for each stimulus.
The members of each pair of monochromatic lights were equated for rhodopsin quantal catch but differed in absorbance by the ocular media. The difference in sensitivity between the two wavelengths was used to define a multiplicative scalar that was used in combination with the ocular media template tabled by Vos22 to estimate an individual's ocular media density at other wavelengths of interest. Although one pair of wavelengths was sufficient to define the scalar, measurements from a second pair of wavelengths could be used to confirm the assumptions underlying this method.
2. Measurement of Macular Pigment Density
MP density was measured by using the method described by Werner and Wooten.23 The stimulus consisted of a 1.5-log-troland (td), 0.70°-diameter disk in which a 560-nm standard was alternated in square-wave counter-phase (12−25 Hz) with one of three monochromatic lights (460, 500, and 560 nm). These test stimuli were presented on a 16°, 420-nm adapting field (1.0 log td, adjusted individually based on ocular media density) to suppress rod and S-cone sensitivity. The log difference in sensitivity to 460- and 560-nm test lights at the fovea versus this difference at parafoveal locations under these conditions was assumed to be due to MP absorption. The 500−560-nm log sensitivity difference served as a control to verify that the data followed the expected shape of the MP density spectrum. Appendix A examines the validity of the major assumptions underlying this method and the effect of violations of these assumptions on estimates of MP density.
Following 10 min of dark adaptation and 3 min of adaptation to the 420-nm background, subjects adjusted the intensity of the monochromatic test light until flicker was eliminated or minimized with respect to the 560-nm standard. To avoid adaptation to the test stimuli and Troxler fading, the stimulus was presented for 5 s with 3-s inter-stimulus intervals. Flicker settings were obtained at 0°, 4°, and 8° retinal eccentricity. MP density was assumed to reach its spatial asymptote by 8°. Thus estimates of the MP density at 0° and 4° were calculated by taking the 8° − 0° and 8° − 4° difference in log sensitivities, respectively.
3. Measurement of Increment Thresholds
Increment thresholds for isolated cone mechanisms were measured at 0°, 4°, and 8° temporal retinal eccentricity by using a 0.70°-diameter test light that was concentric with a 16° background and a 16.5° auxiliary field. Test and background wavelengths were 440 and 580 nm, 480 and 620 nm, and 620 and 485 nm for S-, M-, and L-cone mechanisms, respectively. The retinal illuminance of the adapting background was varied for individual observers so that thresholds were measured on the plateau of each subject's threshold-versus-intensity (tvi) function for each mechanism. The auxiliary field (520 nm, S-cone conditions; 450 nm, M- and L-cone conditions) was used to suppress rod response. It was set at 10, 5, and 1 photopic td (equated for individual observers based on ocular media and MP density) for isolation of the S-, M-, and L-cone mechanisms, respectively.
Test light durations were 50 ms for isolation of an S-cone mechanism and 10 ms for isolation of M- and L-cone mechanisms. The 10-ms duration for isolation of M- and L-cone mechanisms was chosen because sensitivity to brief test flashes is more likely to be determined by the quantum catch of a single class of cone,24 whereas longer test flash durations (∼200 ms) are more likely to be detected through a chromatically opponent pathway.25 Longer durations were used for S-cone isolation conditions in view of the lower temporal sensitivity of the S-cone pathway(s) under our conditions26 (but see Ref. 27).
Pilot work with three subjects established that these stimulus conditions placed subjects on the plateau of the tvi functions for the S-, M-, and L-cone mechanisms. Further verification of the plateau was obtained by measuring foveal increment thresholds at a minimum of two background intensities (spaced 0.3−0.5 log unit apart) for each observer. Subsequent increment thresholds were considered to be on the plateau of the tvi function provided that they were within 0.2 log unit of one another. When this did not occur, an additional series of background intensities was tested until a background satisfying this criterion was found. This was usually necessary only for the M-cone isolation condition. In addition, test sensitivities were obtained from a subset of observers under each isolation condition to verify the identity of the cone mechanism mediating detection at each retinal location.
Before measuring increment thresholds for a given cone mechanism, subjects dark adapted for 10 min and then to the appropriate chromatic background for 3 min. An additional 1−2 min of dark adaptation was provided between increment threshold measures for different background intensities or retinal loci.
Increment thresholds were measured by using a temporal two-alternative forced-choice procedure together with a 3-down, 1-up staircase. The initial step size for the staircase was 0.3 log unit and was reduced to 0.1 log unit following the second reversal. A warning tone signaled the beginning of each interval. The interstimulus interval was 3.5 s. The increment threshold for each test light was based on the geometric mean of the last four of six reversals and corresponds to a 0.79 probability of stimulus detection. Thresholds for a single cone mechanism were measured at 0°, 4°, and 8° temporal eccentricity in one session.
4. Dietary Questionnaires
Dietary information was obtained from each subject by using the Health Habits and History Questionnaire (HHHQ) developed at the National Cancer Institute.28 This questionnaire consists of detailed questions about the frequency and the serving size of various food items (vegetables, fruits, carbohydrates, meats, and dairy products) eaten throughout the year. Questions were also included about the use of nutritional supplements (multivitamins, antioxidants, etc). Data were analyzed by using the revised HHHQ Diet System Analysis Software.29
3. RESULTS
The data were analyzed by using regression statistics applied to the entire sample. Data from subgroups of subjects are shown only for descriptive (and not for inferential) purposes because median or multiple splits result in a loss of statistical power and may increase the probability of type I errors.30 All datasets were screened for candidate outliers by using three statistics: Levers, Studentized deleted residual, and Cook's D.31 The latter was considered the most useful statistic for present purposes because it takes into account whether an observation is unusually influential in determining the parameters of the model fits. There were usually two or three candidates (not necessarily true outliers) for each condition, divided about evenly between the youngest and oldest subjects, and no one subject or condition was consistently responsible for such candidates. The analyses were repeated without such candidate outliers. Unless otherwise noted, these “suspects” did not influence the statistical significance of the analyses, so the statistics and the graphs are based on the entire sample. Each dataset was also tested with linear and nonlinear models. Except for the ocular media density, nonlinear models did not produce statistically significant improvements in the fits for any of the dependent variables. Thus, with the exception of ocular media density, only the linear regression analyses are presented.
A. Ocular Media and Macular Pigment Densities
1. Ocular Media Density Changes with Age
Figure 1 (upper panel) shows ocular media density at 400 nm plotted as a function of age. Table 1 presents means and standard deviations for three subgroups of these subjects of increasing age. As expected from previous work using a variety of methods,32-34 the data are well described by a linear function. The least-squares linear regression equation plotted in Fig. 1 accounted for 71% of the variance (F1,48 = 110.446, p < 0.0001). An analysis of covariance indicated that there was no significant difference (p > 0.05) between males and females or a significant age × gender interaction (p > 0.05).
Fig. 1.
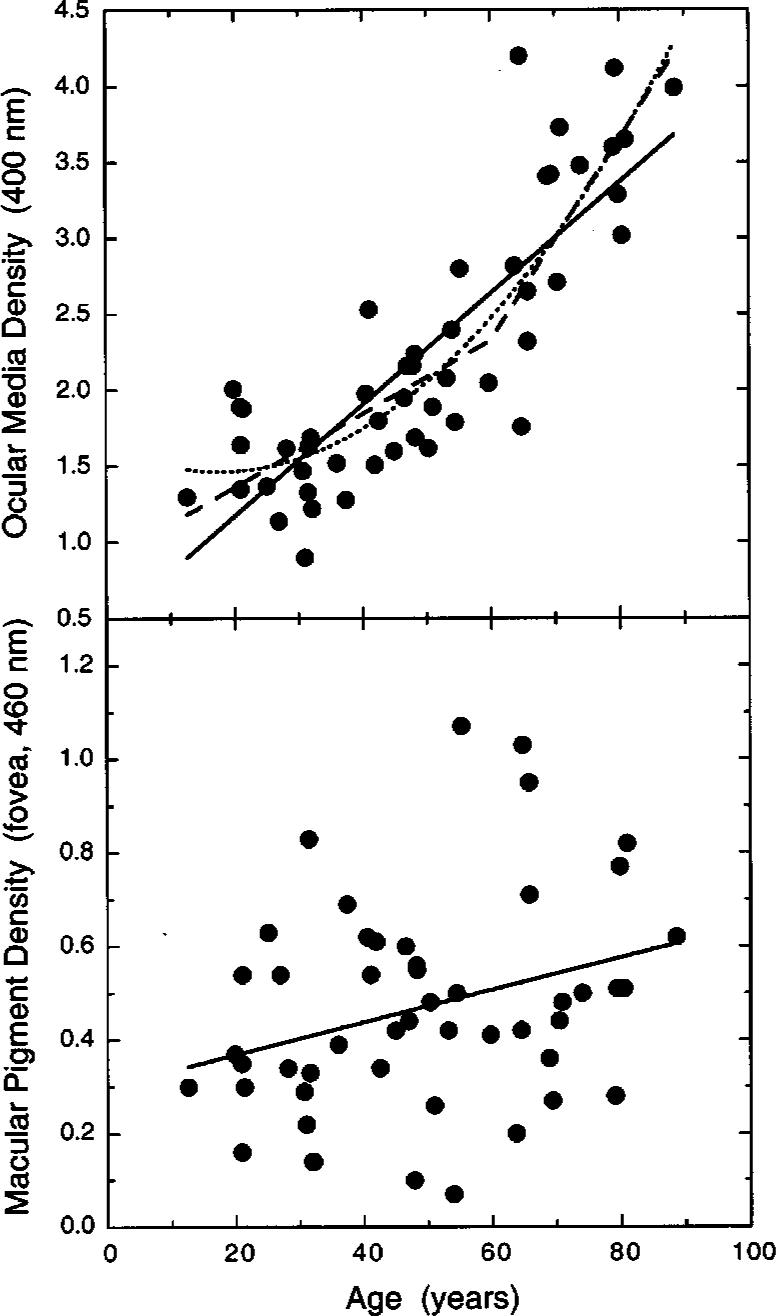
Optical density (OD) of the ocular media at 400 nm plotted in the upper panel as a function of age. The best-fitting linear fit (solid line, OM400 = 0.0366A + 0.4381, where OM400 is the ocular media density at 400 nm and A is age in years), a quadratic fit (dotted curve, OM400 = −0.0198A + 0.00056A2 + 1.638), and a bilinear fit constrained to an inflection at 60 years [dashed function, OM400 = max(0.0242A + 0.8767, 0.0663A − 1.6526)] are shown. The lower panel presents foveal MP density at 460 nm plotted as a function of age. The solid line (MPf,460 = 0.0035A + 0.2989) shows the best-fitting linear function.
Table 1.
Ocular Media and MP Densities of the Sample
| Age Range (years) | N | Sex | Mean (s.d.) Ocular Media Density (400 nm) | Mean (s.d.) Foveal MP Density (460 nm) | Mean (s.d.) 4° MP Density (460 nm) |
|---|---|---|---|---|---|
| 12−34 | 15 | 7 M, 8 F | 1.50 (0.307) | 0.37 (0.194) | 0.03 (0.028) |
| 35−64 | 20 | 8 M, 12 F | 1.99 (0.420) | 0.46 (0.222) | 0.05 (0.056) |
| 65−88 | 15 | 7 M, 8 F | 3.29 (0.686) | 0.58 (0.233) | 0.10 (0.108) |
Pokorny et al.35 have proposed that age-related changes in ocular media density follow a bilinear function, as a result of an acceleration in density change that begins to manifest itself at approximately age 60 years. This function was fitted to the data, as shown by the dashed function in Fig. 1. It provided a statistically significant improvement in the fit compared with the linear function, in that it accounted for 3% more of the variance (F3,46 = 48.455, p < 0.0001). Further analyses showed that improvements over the linear function were also obtained for bilinear functions having inflection points at every age tested (in steps of 5 years) from 25 to 65 years, with the best fit occurring not at 60 years but at 25 years. This result implies a continuously changing function, and, indeed, a quadratic function fitted to the data (dotted curve in Fig. 1) accounted for 76% of the variance (F2,47 = 73.280, p < 0.0001). An important use of these functions is to estimate ocular media density in situations where it is not feasible to measure it directly for individual subjects. Figure 1 shows that the differences in prediction among the three models is small at each age relative to the range of individual variation.
2. Macular Pigment Density Changes with Age
MP density at the fovea is plotted as a function of age in the lower panel of Fig. 1. Table 1 presents mean values for different age groups. The overall mean (0.47) and range (0.07−1.07) of densities is consistent with values reported in the literature.36-39 A linear regression analysis indicated that there is a small, but statistically signifi-cant, increase (0.03 density increase per decade) in the density of MP with age (F1,48 = 4.795, p < 0.05). Indeed, age accounts for only 7% of the variance. An analyses of covariance indicated that there was no significant difference (p > 0.05) between males and females or a significant interaction between age and gender (p > 0.05). The change in MP density with age is consistent with the work of Hammond et al.,7 who found a slightly higher density in an older (mean = 70 years) group of normal observers, compared with that in a younger (mean = 29 years) group of normal observers, although MP density appeared to decrease again in the oldest observers. Previous work in our laboratory36 failed to find a significant change in MP density with age, perhaps because of three reasons: (1) There may have been different dietary habits in the two samples, (2) the previous study used a slightly larger foveal test stimulus at a retinal location where MP density declines exponentially, or (3) perhaps the previous study underestimated the spatial spread of MP across the parafovea in individuals with high MP densities40 (Appendix A). In fact, when a 4° reference is used to estimate MP density with the current sample, the change with age is not statistically significant (p > 0.05) and the sample mean (0.41) is close to that reported by Werner et al.36 (0.39). Even with an 8° reference point, however, the aging effect is quite small relative to the variation in MP density at any given age.
B. Control Experiments
Figure 2 shows tvi functions obtained from one observer under conditions that isolate S-, M-, and L- cone mechanisms. Log relative threshold is plotted as a function of background intensity for each condition. Filled circles, squares, and unfilled circles represent increment thresholds obtained at 0°, 4°, and 8° temporal retinal eccentricity, respectively. The tvi data shown for 0° represent the measured threshold values, while the tvi data obtained at 4° and 8° have been arbitrarily scaled upward for clarity. As shown in this figure, all datasets are well described by Stiles's tabulated template for π mechanisms, ζ(x).41 The only difference between the tvi functions was in the sensitivity of a particular mechanism at different retinal eccentricities. The arrows in Fig. 2 show the range of background intensities that placed individual observers on the plateau of the tvi functions for their respective cone mechanisms. As shown in the middle panel of Fig. 2, the plateau for the M-cone mechanism spans a narrower range of adapting intensities than those for the S- and L-cone mechanisms. This is likely to be due to the substantial overlap in spectral sensitivities between the M cone and the other two cone mechanisms. For this reason foveal increment thresholds were measured under M-cone isolation at 3−7 different background intensities for 35 of the 50 observers. This permitted better identification of the plateau of the individual tvi functions, albeit still not as well as those for S- and L-cone mechanisms.
Fig. 2.

Log relative threshold (quanta s−21 deg−22) plotted as a function of log background intensity (quanta s−21 deg−22) for conditions that isolated S-, M-, and L-cone mechanisms of one observer. Test (λ), background (μ), and auxiliary (μaux) wavelengths are noted in each panel. Filled circles, squares, and unfilled circles represent data obtained at 0°, 4°, and 8° temporal retinal eccentricity, respectively. The solid curves represent Stiles's ζ(x) function. Each dataset has been arbitrarily spaced along the ordinate for clarity. Arrows indicate the range of background intensities that were used in measuring increment thresholds for all observers.
Figure 3 shows foveal test sensitivity data obtained from two observers under each condition of cone mechanism isolation. Test sensitivities were measured at background intensities that placed each subject on the plateau of the appropriate tvi functions. Log relative quantal sensitivity is plotted as a function of wavelength. The lower, middle, and upper datasets were obtained under conditions that isolated S-, M-, and L-cone mechanisms, respectively. The various curves represent Smith and Pokorny's42 S-, M-, and L-cone fundamentals fit by eye to the data. Arrows correspond to the wavelengths of the test lights used in the main experiments to measure increment thresholds for each cone mechanism.
Fig. 3.

Left and right panels show test sensitivities obtained from two observers (ages 42 and 27 years, respectively) for background intensities corresponding to thresholds on the plateau of the individual tvi functions for S-cone (triangles), M-cone (squares), and L-cone (circles) mechanisms. Log relative sensitivity (quanta) is plotted as a function of wavelength. Smooth curves represent the Smith–Pokorny42 cone fundamentals. Each action spectrum is arbitrarily spaced along the ordinate for clarity. The wavelengths of the adapting backgrounds were those used to measure increment thresholds of all observers; arrows indicate the test wavelengths used for the increment threshold measurements for all observers.
The test sensitivity data presented in Fig. 3 confirm that the increment threshold conditions isolated mechanisms dominated by the sensitivities of the cone types intended, although it is not shown or suggested that these mechanisms are univariant. Test sensitivities were also measured at 4° and 8° temporal eccentricity (not shown). These data indicated that the combinations of test and background wavelengths were also appropriate for isolating each cone mechanism at these retinal eccentricities. This is consistent with a previous study43 showing that all three cone mechanisms can be isolated by the same conditions of chromatic adaptation out to approximately 80° retinal eccentricity.
C. Increment Thresholds As a Function of Age and Retinal Eccentricity
The upper and lower panels in Fig. 4 show log increment thresholds specified at the cornea and the retina, respectively, plotted as a function of retinal eccentricity for groups of younger (12−34 years) and older (65−88 years) observers. Table 1 shows ocular media and MP densities for these groups (at wavelengths corresponding to the plotted values in Fig. 1). The lower panels show log increment thresholds referred to the retina at each retinal location by subtracting the density of the ocular media and MP (at corresponding retinal locations). These corrections are based on Vos's22 templates to define the shape of the spectral density functions of the ocular media and MP. It is apparent that much of the threshold elevation is due to differences in prereceptoral screening, as expected from previous work in which thresholds and ocular media density were measured for the same observers.5 These retinally specified thresholds have two advantages over corneally specified values: They do not depend on the wavelength of measurement, and they define the magnitude of the sensitivity losses that cannot be ascribed to age-related changes in absorption by the ocular media and MP. Unless stated otherwise, retinally specified thresholds (sensitivities) are used for the remainder of this paper.
Fig. 4.

Log increment threshold plotted as a function of retinal eccentricity for groups of younger (12−34 years, unfilled circles) and older (65−88 years, filled circles) observers. Upper panels present thresholds specified at the cornea for each cone mechanism; lower panels show the data specified at the retina.
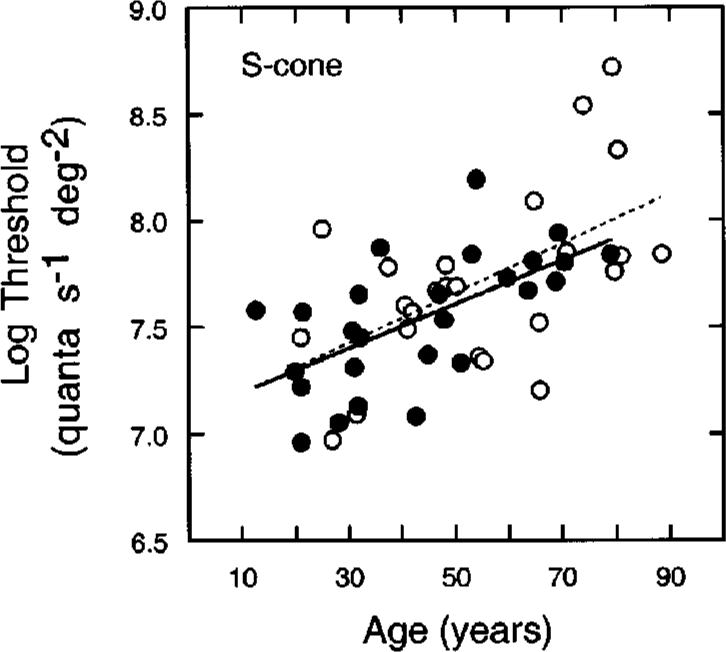
Figure 5 shows log relative threshold specified at the retina for each cone mechanism and retinal eccentricity as a function of age for individual observers. Filled circles, squares, and unfilled circles represent threshold data obtained at 0°, 4°, and 8°, respectively. Foveal data in Fig. 5 represent measured threshold values, while thresholds at 4° and 8° are scaled upward by 1.5 and 3.0 log units, respectively. Best-fitting linear functions based on a least-squares criterion are plotted with each dataset; parameters from the linear regression analyses are presented in Table 2.
Fig. 5.

Log relative (retinal) thresholds of individual observers plotted as a function of age for S-, M-, and L-cone isolation conditions. Filled circles, squares, and unfilled circles represent data measured at 0°, 4°, and 8° retinal eccentricity, respectively. Data for 4° and 8° have been scaled upward along the ordinate by 1.5 and 3.0 log units, respectively. Functions are based on a least-squares linear regression; parameters are presented in Table 2.
Table 2.
Parameters of Linear Regression of Log Threshold (Retina) versus Age
| Condition | Intercept | Slope (s.e.) | N | r |
|---|---|---|---|---|
| S-cone 0° | 7.071 | 0.011 (0.002) | 50 | 0.61a |
| S-cone 4° | 6.978 | 0.011 (0.002) | 50 | 0.57a |
| S-cone 8° | 7.051 | 0.013 (0.002) | 50 | 0.63a |
| M-cone 0° | 7.776 | 0.007 (0.002) | 48 | 0.54a |
| M-cone 4° | 8.053 | 0.007 (0.001) | 48 | 0.62a |
| M-cone 8° | 8.169 | 0.007 (0.001) | 48 | 0.57a |
| L-cone 0° | 7.403 | 0.007 (0.001) | 50 | 0.59a |
| L-cone 4° | 7.732 | 0.007 (0.001) | 50 | 0.58a |
| L-cone 8° | 7.850 | 0.009 (0.002) | 50 | 0.65a |
p < 0.0001.
As indicated in Table 2, thresholds for each of the isolated cone mechanisms show a statistically significant increase as a function of age. At all three retinal locations, the mean rate of change for the S-, M-, and L-cone mechanisms is essentially 0.12, 0.07, and 0.07 log unit/decade, respectively (see Table 2). An analysis of covariance taking into account covariate interactions44 indicated that the slopes (describing threshold versus age) for each cone mechanism were not significantly different across the three retinal loci (p > 0.05). (This is illustrated for the S-cone 0° − 8° log sensitivity difference in the panel on the right of Fig. 7 below.) Comparisons among the three cone types within each retinal eccentricity indicated that the slopes (describing threshold versus age) of the M- and L-cone mechanisms did not differ significantly from each other, while at each retinal locus the slope for the S-cone mechanism was significantly greater than the slopes for the M- and L-cone mechanisms.
Fig. 7.

Log sensitivity difference (0° − 8°) for S-cone isolation condition plotted in separate panels as a function of peak MP density (left) and as a function of age (right). The regression line differs from zero only for the data in the left panel. This line is described by S0°−8° = 0.475MPf,460 − 0.174, where S0°−8° is the log sensitivity difference between S cones of the fovea and 8° and MPf,460 is the foveal MP density at 460 nm.
D. Relation between Macular Pigment Density and Cone Increment Thresholds
The relations between MP density and cone increment thresholds were examined in view of the hypothesis that MP may protect an S-cone mechanism by reducing the rate of age-related loss in sensitivity. From psychophysics two pieces of evidence have supported this interpretation. First, Haegerstrom-Portnoy6 reported that the rate of sensitivity loss for an S-cone mechanism is higher outside the fovea than in the fovea. However, because MP was not measured in these subjects, the data could not be specified at the retina. As described in Subsection 3.C, our measurements of sensitivity specified at the retina show similar age-related losses across the central 8°. Second, Hammond et al.7 reported that the age-related loss in the sensitivity of an S-cone mechanism (but not an M/L-cone mechanism) was less for individuals with higher MP density. Following Hammond et al., observers were separated into two groups, those having MP density below the mean of all 50 subjects (<0.47; n = 26, mean = 0.30) and those above the mean MP density (>0.47; n = 24, mean = 0.65). Figure 6 shows foveal S-cone thresholds as a function of age for these subgroups. Filled and unfilled symbols represent data, and solid and dashed lines represent linear regressions, for low and high peak MP groups, respectively. Regression analyses indicated that there was no significant age × MP interaction for S cones. Thus this analysis does not support the hypothesis that MP protects S cones from declines in sensitivity associated with senescence.
Fig. 6.
Log relative threshold at the fovea plotted as a function of age for conditions of S-cone mechanism isolation. Filled and unfilled symbols represent data, and solid and dashed lines represent linear regressions, for low and high peak MP groups, respectively. Regression lines are based on a least-squares criterion.
A second analysis examined the relation between the difference in log sensitivity at 0° and 8° and density of MP. The left-hand panel of Fig. 7 presents this relation for the S-cone mechanism as a function of peak MP density, which was statistically significant (r = 0.35, F1,48 = 6.771, p = 0.01). This relation is expected from both the MP protection hypothesis and the gain change hypothesis. A simple form of the two hypotheses may, however, be distinguished in that age dependency is expected from the former, but not the latter, hypothesis. Support for the latter hypothesis comes from an analysis applied to differences in log sensitivity at 0° and 8° plotted as a function of age in the right-hand panel of Fig. 7. Multiple-regression analyses showed that the significant relation between MP density and the sensitivity difference between 0° and 8° is not dependent on age (MP controlling for age, F2,47 = 6.230, p = 0.01; age controlling for MP, p = 0.89; age × MP interaction, p = 0.24).
The analyses presented in Figs. 6 and 7 for S-cone sensitivities were repeated for M- and L-cone mechanisms. MP density was not correlated with the sensitivity of these mechanisms or their log sensitivity differences between 0° and 8°.
E. Dietary Analyses
Nutrient questionnaires were collected from 45 of the 50 subjects. Each dataset was analyzed by using the HHHQ Diet System Analysis Software.29 Five of the subjects were excluded from further analysis because of inaccurate (measured nutrient levels were unusually low) or incomplete reporting. The nutrient analysis yielded an estimate of the total caloric intake and the protein, fat, and carbohydrate intake, as well as intake estimates of 29 nutrients45 important in the human diet. The nutrient analyses were performed assuming age- and sex-specific portion sizes. Regression analyses were conducted to identify potential relations between the estimated nutrients with variables such as ocular media and MP density, as well as foveal thresholds for each of the isolated cone mechanisms. All analyses incorporated age as a covariate because intake of some of the nutrients was correlated with age. Particular interest was focused on vitamin E, beta-carotene, and lutein, given that high intake levels of these nutrients have proven to be correlated with good visual health.46,47
Foveal thresholds for the S-, M-, and L-cone mechanisms were not correlated with any nutrient estimates when controlling for age. Significant positive correlations were found between peak MP density and the provitamin A carotenoids (β = 0.33, F2,37 = 4.314, p = 0.04), beta-carotene (β = 0.37, F2,37 = 5.934, p = 0.02), and lutein (β = 0.40, F2,37 = 8.083, p < 0.01). Lutein is one of the primary constituents of MP, and the relation between it and MP density is stronger than that between MP density and age (b = 0.36, F2,37 = 6.770, p = 0.01). Figure 8 shows MP density in the fovea plotted as a function of dietary carotenoid intake (mg) and fitted by a simple linear regression. The slope is significantly different from zero (r = 0.39). However, it appears that one subject (with MP density 1.03 and lutein of 5548 μg) may be an outlier with respect to this particular sample based on tests of the Studentized deleted residual and Cook's D.31 Without this observation the slope is not significantly different from zero (r = 0.22). Her MP measurements were quite reliable, however, and the high lutein intake estimated by the HHHQ analysis is consistent with her self-reports of unusually high consumption of fruits and vegetables. The scatterplot is presented because of its potential clinical significance and because such a relation has been reported in previous work.8,9 That several carotene nutrients were found to be significantly correlated with peak MP density may be due to the fact that foods rich in lutein (i.e., collard greens, broccoli, spinach, etc.) are also rich in other carotenes. Given that blood plasma levels of carotenoids are reduced in smokers,48,49 the analyses were repeated without the data of two subjects who reported smoking more than one pack of cigarettes daily. Essentially the same results were obtained.
Fig. 8.
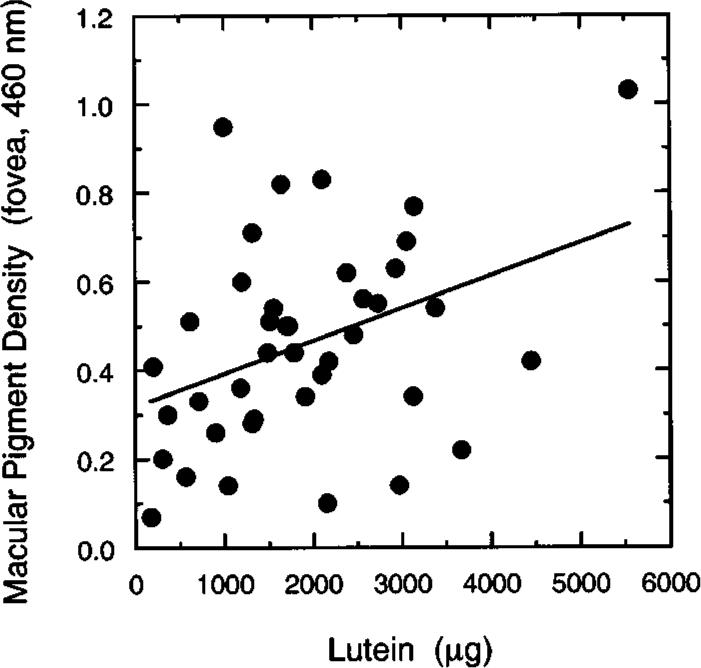
MP density in the fovea (460 nm) plotted as a function of dietary lutein-intake level (μg). The equation for the regression line is MPf,460 = 0.0000741L + 0.318. See the text for analysis of a possible outlying point.
4. DISCUSSION
The primary goal of this study was to quantify age-related changes in thresholds of S-, M-, and L-cone mechanisms in the central retina under comparable states of light adaptation (i.e., on the plateau of each mechanism's tvi function). At all retinal eccentricities, there are signifi-cant age-related elevations in thresholds of all three cone mechanisms. Consistent with previous work in our laboratory,50 the sensitivity of all three cone mechanisms declined linearly with increasing age.
Table 3 shows that there is a fair degree of agreement among studies regarding the changes in sensitivity of an S-cone mechanism in the fovea, although some differences remain, presumably as a result of differences in the level of light adaptation, spatiotemporal parameters of the test stimuli, and age ranges. There is less agreement among the studies, however, regarding the changes in sensitivity of M/L-cone mechanisms. These differences may be largely due to the choice of stimulus parameters. For example, Werner and Steele reported threshold elevations of 0.11 log unit per decade for M- and L-cone mechanisms under conditions that they considered appropriate for isolation (e.g., short-wavelength adapting backgrounds and 20-Hz flicker), but like Haegerstrom-Portnoy,6 they found little age-related change with 2-Hz flicker of a 550-nm test light superimposed on a 587-nm background. Significant age-related losses in sensitivity of M- and L-cone mechanisms were obtained in the present study with brief test flashes presented on backgrounds that placed the subjects on the plateau of the tvi function for the mechanisms in question.
Table 3.
Summary of Studies Reporting Age-Related Increases in the Thresholds of Isolated-Cone Mechanisms
| Reference | Retinal Locus | Age Range (years) | Mechanisms | Subjects (n) | Test λ (nm) | Background λ or λd (nm) and Intensity (log td)a | Flicker Frequency (Hz) or Flash Duration (ms) | Threshold Decrease (per decade) |
|---|---|---|---|---|---|---|---|---|
| Eisner et al.51 | Fovea | ≥60 | S-cone | 122 | 440, 490b | 580 (3.0)b | 1.5 Hz | 0.15d |
| M/L-cone | 122 | 660b | 580 annulus (0.3)b | 160 ms | 0.09d | |||
| Werner and Steele50 | Fovea | 10−84 | S-cone | 76 | 420−550b | 587 (4.2−4.7)c | 2 Hz | 0.07d |
| M-cone | 71 | 500−650b | 661 (2.9−3.4)c | 20 Hz | 0.11d | |||
| L-cone | 69 | 500−650b | 445 (2.5−3.0)c | 20 Hz | 0.11d | |||
| Johnson et al.52 | Central 30° | 20−72 | S-cone | 62 | <500c | >530 (3.4−3.9)c | 200 ms | 0.09d |
| M/L-cone | 62 | >530c | >530 (3.4−3.9)c | 200 ms | 0.06−0.07d | |||
| Haegerstrom-Portnoy6 | Central 20° | 20−28 | S-cone | 29 | 450b | 595 (3.0−3.5)c | 200 ms | ∼0.05d |
| and 52−78 | M/L-cone | 29 | 578b | 578 (3.0−3.5)b | 200 ms | 0.00d | ||
| Hammond et al.7 | Fovea | 24−36 | S-cone | 37 | 440b | >520 (3.2)c | 500 ms | 0.10e |
| and 60−84 | M/L-cone | 37 | 550b | >520 (3.2)c | 500 ms | 0.07e | ||
| Present Study | Fovea—8° | 12−88 | S-cone | 50 | 440b | 580 (2.3−2.8)b | 50 ms | 0.117e |
| Temporal | M-cone | 50 | 480b | 620 (2.2−2.8)b | 10 ms | 0.070e | ||
| L-cone | 50 | 620b | 485 (1.0−2.2)b | 10 ms | 0.077e |
Conversions from luminance to retinal illuminance were based on pupil diameters of 7 and 4 mm in order to encompass approximate ranges for the youngest and oldest observers, respectively.3 No additional correction was made for lenticular senescence.
Monochromatic light.
Broadband light.
Specified at retina (corrected for ocular media density only).
Specified at retina (corrected for ocular media and MP density).
A second goal of this research was to evaluate whether variations in MP density are related to the magnitude of age-related sensitivity loss. There is increasing psychophysical and epidemiological evidence that suggests that MP may provide a protective function for the aging central retina. Contrary to a previous study,7 we find no significant relation between MP density and the age-related change in thresholds obtained from healthy observers under conditions of foveal S-cone isolation. It should be noted, however, that the older observers in this study were healthy and fairly active physically. Only two of the older subjects were smokers, and their dietary intake of lutein was not significantly different from that of our younger observers. It is not entirely clear how these observers differ from those of Hammond et al., but there may be important sampling differences between the studies. For example, while Hammond et al. excluded current smokers, 63% of their older sample reported smoking in the past (for an average of 25 years), and there was a significant negative correlation between increment sensitivity (550 nm) and the number of past years of smoking cigarettes. Hammond et al. also observed a significant decrease in MP density for subjects older than 60 years, while there was a positive relation between MP density and observers over age 60 years in the present sample. This may be due to differences in the health of the oldest subjects in the two studies. Given the well-documented effect of diet on MP density,8,9 age-related changes in MP might be expected to vary between samples having different health-related behaviors.
While other studies have found significant relations between foveal sensitivity and foveal MP density, a more powerful means of evaluating the potential role of MP might be to obtain within-subject comparisons of cone mechanism sensitivities at retinal loci differing in MP density. If MP serves a protective function, one might expect the 0°−8° log sensitivity difference to depend on MP density. Our data show a significant correlation between S-cone-mediated (but not M- or L-cone-mediated) differences in log sensitivity (0°−8°) and peak MP density. Individuals with higher MP densities tended to have higher S-cone sensitivity in the fovea relative to 8° in the temporal retina. At first glance this finding is consistent with the hypothesis that MP protects foveal S cones from age-related changes leading to sensitivity reductions. This result does not, however, prove the case. It is possible that these sensitivity differences are related to gain changes in the receptors that compensate for regional variations in MP density. Hammond et al. noted that above age 60 years there is an accelerated loss in S-cone sensitivity and a correlated decrease in MP density. While this additional observation is consistent with a protective role of MP, it is also expected from the hypothesis that S-cone sensitivity is multiplicatively scaled in proportion to MP density as a result of a long-term process that normalizes cone sensitivities relative to natural illuminants. Importantly, the correlation between MP density and the log sensitivity difference between 0° and 8° in the present sample is not age dependent. A lack of dependence on age would not be expected from the MP protection hypothesis as it has been put forward in the psychophysical literature. While we do not interpret our data as clearly refuting the MP protection hypothesis, the data do not strongly support it with a healthy sample and conditions of testing that included sensitivity measures at three retinal loci, individual corrections for ocular media and MP density, as well as controls over the level of light adaptation, and use of criterion-free methods for measuring thresholds. The results of this study and others6,7,11-13 are consistent with the gain change hypothesis. It is conceivable that evidence favoring the MP protection hypothesis could be obtained with our methods and a sample having different or more heterogeneous diets, but the results in this paper imply that any analysis of a protective effect of MP must take gain changes into account. Longitudinal studies might be useful in separating the relative contributions of MP to S-cone gain and long-term protection.
The gain change hypothesis, while consistent with the results of this study, is based primarily on our prior studies of color appearance. Without mechanisms to compensate for age-related changes in ocular media and MP density, the appearance of lights and surfaces would gradually shift toward yellow, as a result of the selective attenuation of short-wave light reaching the retina. Evidence that the visual system recalibrates itself was obtained in a previous study by measuring the ratio of a mixture of short- and long-wave monochromatic lights (individually determined wavelengths of unique blue and unique yellow) that appeared achromatic.11 Based on the age-related changes in the ocular media absorption of the short-wave light, this ratio would be expected to change by approximately 64% between 20 and 70 years of age, thereby shifting the achromatic point toward the short-wave spectrum locus in color mixture space. This does not happen. Instead, the locus of the achromatic point does not change significantly with age. Similarly, the brightness53 and the scaled saturation14 of short- and middle-wavelength stimuli change less than would be expected from the physical changes in the retinal stimulus that are due to lenticular senescence. Many of these changes can be modeled by multiplicative scaling or renormalization to maintain constant quantal catches for the three cone types relative to an arbitrary white point, consistent with the view that much compensation occurs at the receptoral level. According to our model of compensation for age-related changes in the spectral distribution of the illuminant,2 changes in receptor sensitivity, specified at the cornea, should be nearly parallel across cone types with increasing age, resulting in only minor shifts in unique blue, unique yellow, and the achromatic point, as has been shown empirically for subjects covering a range of approximately 60 years.11,54 It may be noted that the loss in corneally specified sensitivity found in this study is not equal for the three types of cone mechanism, as would be expected for complete compensation. Nevertheless, the crossover points expected from the data between the S- and M-, the S- and L-, and the M- and L-cone mechanisms change from age 25 to 75 years by only −5 (482.5 to 477.5), −5 (490.5 to 485.5), and 0 (569.5) nm, respectively. These shifts would not likely result in more than minor age-related changes in most aspects of color appearance. Thus the age-related change in the cone sensitivities reported in the current study is consistent with a model of compensation that yields relatively stable color appearance across the life span. It should also be noted that compensation is less complete at the level of detection and discrimination55 than with respect to brightness53 and hue,13,14 implying additional age-related gain change at postreceptoral site(s). Not all post- receptoral mechanisms are likely to contribute equally, however. Hibino12 has reported evidence for greater compensation for spatial variations in MP density in a yellow–blue than in a red–green opponent pathway.
If the relation between log sensitivity difference (0° versus 8°) and MP density is the result of local gain changes in the photoreceptors or at a later postreceptoral site, one might ask why this process is more apparent in an S-cone pathway than in M- and L-cone pathways. For example, the test wavelengths for the S-cone-isolation (440-nm) and the M-cone-isolation (480-nm) conditions were equated with respect to MP absorption (assuming Vos's template), but the relation to MP variations is significant statistically only for S-cone sensitivity. We assume that the effect of a compensation mechanism is related to the total quantal catch within each cone class. Because of the spectral signature of the ocular media and MP, any such compensation mechanism would require substantially greater gain changes in S-cone than in M- or L-cone mechanisms, as would short-term compensation for variations in the natural phases of daylight illumination.2
ACKNOWLEDGMENTS
This work was supported by the National Institute on Aging (AG04058), a National Eye Institute Core Grant (EY12576), and a Jules and Doris Stein RPB Professor-ship.
APPENDIX A: ASSUMPTIONS UNDERLYING THE PSYCHOPHYSICAL MEASUREMENT OF MACULAR PIGMENT DENSITY
All psychophysical methods for measuring MP density require the general assumption that the retina is identical at the locations of measurement except for the presence of MP itself. Because the retina is not homogeneous, and this general assumption is incorrect, methods must be found to equate functionally the retinal locations tested. Here we consider three of the main problems in measuring MP density psychophysically that are related to retinal inhomogeneity: (1) The distributions of the three cone types are not uniform across the retina, (2) the optical density (OD) of the photopigments is not uniform within cone classes across the retina, and (3) the reference point associated with zero MP density is uncertain.
1. Because the distribution of S cones and of rods is not constant across the retina, we have used chromatic adaptation and heterochromatic flicker photometry at 12−24 Hz to minimize their contributions.26,56 The adapting background was equated in retinal illuminance across observers after measuring their ocular media density, and its wavelength (420 nm) was chosen so that the intensity would be expected to vary minimally as a result of retinal variations in MP. Heterochromatic flicker photometry is mediated under these conditions by M and L cones. Although there is known to be a large degree of individual variability in both M- and L-cone photopigment λmax and the M/L-cone ratio, there is little evidence for regional variations within an observer for either of these variables, at least for the stimulus size used in this study. For example, a number of psychophysical studies have concluded that within observers the ratio of M/L-cone sensitivity57-59 and/or number60 is invariant over a region of central retina that exceeds 10°. While recent molecular work has suggested that L-pigment gene expression increases outside the central 20°−40°,61 this is well outside the region in which our testing was performed. Testing under our conditions, therefore, seems to be largely dependent on the same cone ratio and neural weightings at the fovea and the parafovea (8°).
2. The length of the cone outer segments decreases from the fovea to the parafovea,62 and this is believed to be the basis of corresponding changes in photopigment OD.63,64 Decreased density of the photopigment narrows the absorption spectrum in accordance with the Beer–Lambert law. The consequences seem not to have been great enough to have influenced the heterochromatic flicker photometry spectral sensitivities in studies cited in the previous paragraph, but Sharpe et al.65 have provided modeling and data to demonstrate that the derived MP density spectrum is influenced by regional variations in cone photopigment density. Their methods were different from the approach taken here, so additional modeling was undertaken to evaluate the importance of variations in photopigment OD for conditions more closely related to those of this study. Theoretical sensitivity functions for the fovea were generated by summing the Smith and Pokorny42 M- and L-cone fundamentals (λmax of 533 and 557 nm, peak OD of 0.35 and 0.40, respectively) in a ratio of 1/2. These functions were corrected for absorption by Vos's22 ocular media (ODL) and MP (ODMP) density spectra. Thus
| (A1) |
Theoretical parafoveal functions were generated similarly, however now assuming photopigment OD reductions of 10%, 25%, or 50% from the foveal peak OD values. The modified M- and L-cone spectra are indicated by M′ and L′, respectively. The parafoveal functions were corrected for absorption by the ocular media but not for MP under the assumption that there is negligible MP in the parafovea. Thus
| (A2) |
The theoretical spectral sensitivity functions spanned the spectral range 400−700 nm (10-nm steps) and were similar to those obtained empirically with our method. Predicted MP density spectra were then calculated by taking the difference between the theoretical parafoveal and fo-veal functions normalized at 560 nm:
| (A3) |
If regional variations in photopigment OD do not influence MP density estimates and/or the predicted absorption spectrum, then the difference spectrum will be equal to the MP absorption.
The upper panel of Fig. 9 shows modeled MP density spectra plotted as a function of wavelength. The solid curve represents Vos's template. The various symbols denote the predicted MP density spectra assuming variable cone photopigment OD differences between the fovea and the parafovea. All functions have been normalized to 0.33 (the peak of the Vos template) in order to compare the shapes of the estimated MP density spectra. As reported previously by Sharpe et al.,65 one of the main effects of reducing photopigment OD is the narrowing of the MP density spectrum, particularly at short wavelengths. Moreover, it also gives rise to predicted differences in the density of MP beyond approximately 550 nm. However, there are only small differences, primarily below 450 nm, within the range of wavelengths (400−550 nm) that are typically used to measure the MP density spectrum. A second, and more important, consequence of reduced parafoveal photopigment OD for this study is that it results in underestimation of the overall MP density. This is shown in the lower panel of Fig. 9. The solid curve and the symbols are as in the upper panel but are normalized at 550 nm to compare the heights of the modeled MP density spectra. If photopigment OD had no effect on MP measurements, the data points should all fall on the solid curve.
Fig. 9.
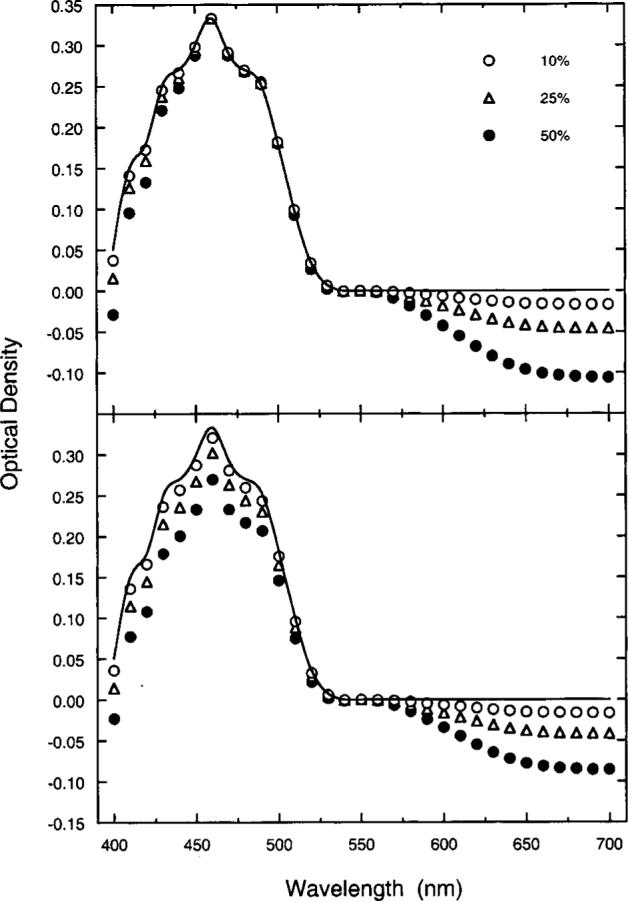
Calculated effects [Eqs. (A1)–(A3)] of photopigment OD differences between foveal and parafoveal M and L cones on psychophysical measurements of MP. The key denotes reductions in parafoveal OD of 10%, 25%, and 50% compared with that of the fovea. The solid curve is Vos's22 template. Model data in the upper panel illustrate effects on the shape of the density spectrum with normalization to a peak density of 0.33 at 460 nm. Model data in the lower panel illustrate effects of photopigment OD differences between foveal and parafoveal M and L cones on overall MP density when all datasets are normalized to 0.0 at 550 nm.
Figure 10 shows measured MP density spectra plotted as a function of wavelength for two observers compared with MP templates from the literature. The data and the templates were normalized to a peak of 0.33. There is reasonable correspondence between the psychophysically derived curves and the various templates, except for small deviations at short wavelengths. These data, which resemble previous measures using similar methods,36 are consistent with small cone photopigment OD differences between the fovea and the parafovea.
Fig. 10.
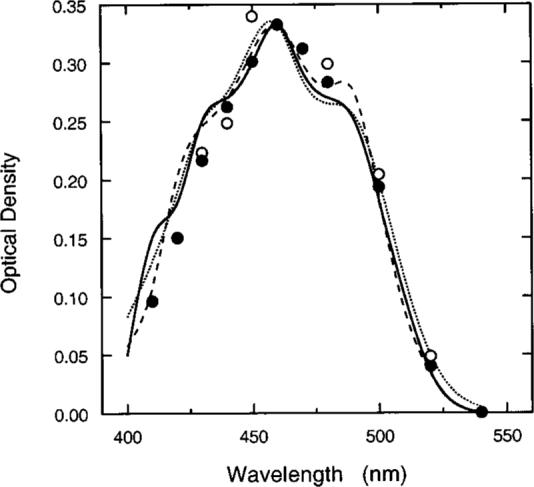
Symbols show MP density spectra for two observers compared with three MP templates in the literature: solid curve,22 dotted curve,66,67 and dashed curve.41 Data and functions are normalized to 0.33 at 460 nm.
Evidence in prior studies36,38 indicates that MP density estimates obtained with this method are primarily determined by the edge of the stimulus rather than by the average density across the entire test field. Our foveal stimulus is thus dependent on M/L-cone optical density at 0.35° temporal eccentricity and compared with parafoveal receptors at 7.65°−8.35° temporal eccentricity. This corresponds to an OD difference of approximately 0.05−0.15 according to recent data.68 It is possible that these differences between the fovea and the parafovea decrease with age,69 but even with a 25% OD difference between the fovea and the parafovea, the above modeling exercise indicates an underestimation of MP density by less than 10%, or ∼0.04 for our sample.
3. Our method is based on the assumption that MP density is negligible at a parafoveal reference eccentricity or at least reaches a constant value with further increases in eccentricity. We have chosen a reference eccentricity of 8° temporal eccentricity, which is supported by previous psychophysical36,38,70-72 and extraction studies.73 Figure 11 shows the spatial profile of MP for five observers with relatively high peak MP densities from this study with the use of a 12° reference eccentricity. MP density at 460 nm is plotted as a function of retinal eccentricity. As can be seen, MP density reaches zero for each observer by at least 8° retinal eccentricity.
Fig. 11.
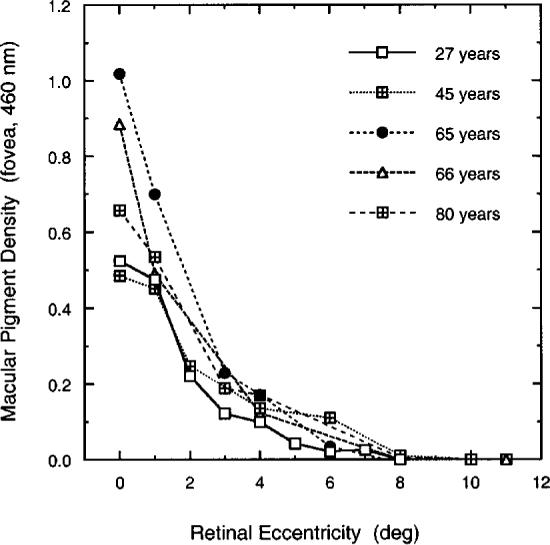
MP density plotted as a function of temporal retinal eccentricity along the horizontal meridian for five observers. Methods were as in the main experiment but with the use of parafoveal reference of 12°.
REFERENCES AND NOTES
- 1.Weale RA. The Senescence of Human Vision. Oxford U. Press; Oxford, UK: 1992. [Google Scholar]
- 2.Werner JS. Visual problems of the retina during ageing: compensation mechanisms and colour constancy across the life span. Prog. Retinal Eye Res. 1996;15:621–645. [Google Scholar]
- 3.Kadlecová V, Peles̆ka M, Vas̆ko A. Dependence on age of the diameter of the pupil in the dark. Nature (London) 1958;18:1520–1521. doi: 10.1038/1821520a0. [DOI] [PubMed] [Google Scholar]
- 4.Boettner EA, Wolter JR. Transmission of the ocular media. Invest. Ophthalmol. 1962;1:776–783. [Google Scholar]
- 5.Schefrin BE, Werner JS, Plach M, Utlaut N, Switkes E. Sites of age-related sensitivity loss in a short-wave cone pathway. J. Opt. Soc. Am. A. 1992;9:355–363. doi: 10.1364/josaa.9.000355. [DOI] [PubMed] [Google Scholar]
- 6.Haegerstrom-Portnoy G. Short-wavelength-sensitive-cone sensitivity loss with aging: a protective role for macular pigment? J. Opt. Soc. Am. A. 1988;5:2140–2144. doi: 10.1364/josaa.5.002140. [DOI] [PubMed] [Google Scholar]
- 7.Hammond BR, Jr., Wooten BR, Snodderly DM. Preservation of visual sensitivity of older subjects: association with macular pigment density. Invest. Ophthalmol. Visual Sci. 1998;39:397–406. [PubMed] [Google Scholar]
- 8.Hammond BR, Jr., Johnson EJ, Russell RM, Krinsky NI, Yeum K-J, Edwards RB, Snodderly DM. Dietary modification of human macular pigment density. Invest. Ophthalmol. Visual Sci. 1997;38:1795–1801. [PubMed] [Google Scholar]
- 9.Landrum JT, Bone RA, Kilburn MD. The macular pigment: a possible role in protection from age-related macular degeneration. Adv. Pharmacol. (San Diego) 1997;38:537–556. doi: 10.1016/s1054-3589(08)60998-9. [DOI] [PubMed] [Google Scholar]
- 10.Landrum JT, Bone RA, Joa H, Kilburn MD, Moore LL, Sprague KE. A one year study of the macular pigment: the effect of 140 days of a lutein supplement. Exp. Eye Res. 1997;65:57–62. doi: 10.1006/exer.1997.0309. [DOI] [PubMed] [Google Scholar]
- 11.Werner JS, Schefrin BE. Loci of achromatic points throughout the life span. J. Opt. Soc. Am. A. 1993;10:1509–1516. doi: 10.1364/josaa.10.001509. [DOI] [PubMed] [Google Scholar]
- 12.Hibino H. Red–green and yellow–blue opponent-color responses as a function of retinal eccentricity. Vision Res. 1992;32:1955–1964. doi: 10.1016/0042-6989(92)90055-n. [DOI] [PubMed] [Google Scholar]
- 13.Schefrin BE, Werner JS. Age-related changes in the color appearance of broadband surfaces. Color Res. Appl. 1993;18:380–389. [Google Scholar]
- 14.Kraft JM, Werner JS. Aging and the saturation of colors: 2. Scaling of color appearance. J. Opt. Soc. Am. A. 1999;16:231–235. doi: 10.1364/josaa.16.000231. [DOI] [PubMed] [Google Scholar]
- 15.Mollon JD. Color vision. Annu. Rev. Psychol. 1999;33:41–85. doi: 10.1146/annurev.ps.33.020182.000353. [DOI] [PubMed] [Google Scholar]
- 16.Pokorny J, Smith VC. Evaluation of single-pigment shift model of anomalous trichromacy. J. Opt. Soc. Am. 1977;67:1196–1209. doi: 10.1364/josa.67.001196. [DOI] [PubMed] [Google Scholar]
- 17.Williams TP, Penn JS, Bush RA, Makino CL. Renewal of rod outer segment and regulation of daily photon catch by the rat retina; Proceedings of the Yamada Conference XXI; Kyoto, Japan. Yamada Science Foundation; 1988. pp. 255–260. [Google Scholar]
- 18.Schremser J-L, Williams TP. Photoreceptor plasticity in the albino rat retina following unilateral optic nerve section. Exp. Eye Res. 1992;55:393–399. doi: 10.1016/0014-4835(92)90111-5. [DOI] [PubMed] [Google Scholar]
- 19.Hammond BR, Jr., Wooten BR, Snodderly DM. Cigarette smoking and retinal carotenoids: implications for age-related macular degeneration. Vision Res. 1996;36:3003–3009. doi: 10.1016/0042-6989(96)00008-9. [DOI] [PubMed] [Google Scholar]
- 20.Westheimer G. The Maxwellian view. Vision Res. 1966;6:669–682. doi: 10.1016/0042-6989(66)90078-2. [DOI] [PubMed] [Google Scholar]
- 21.van Norren D, Vos JJ. Spectral transmission of the human ocular media. Vision Res. 1974;14:1237–1244. doi: 10.1016/0042-6989(74)90222-3. [DOI] [PubMed] [Google Scholar]
- 22.Vos JJ. Tabulated Characteristics of a Proposed 2° Fundamental Observer. Institute for Perception; Soesterberg, The Netherlands: 1978. [Google Scholar]
- 23.Werner JS, Wooten BR. Opponent-chromatic mechanisms: relation to photopigments and hue naming. J. Opt. Soc. Am. 1979;69:422–434. doi: 10.1364/josa.69.000422. [DOI] [PubMed] [Google Scholar]
- 24.Wandell BA, Pugh EN., Jr. A field-additive pathway detects brief-duration, long-wavelength incremental flashes. Vision Res. 1980;20:613–624. doi: 10.1016/0042-6989(80)90118-2. [DOI] [PubMed] [Google Scholar]
- 25.Wandell BA, Pugh EN., Jr. Detection of long-duration, long-wavelength incremental flashes by a chromatically coded pathway. Vision Res. 1980;20:625–636. doi: 10.1016/0042-6989(80)90119-4. [DOI] [PubMed] [Google Scholar]
- 26.Brindley GS, Du Croz JJ, Rushton WAH. The flicker fusion frequency of the blue-sensitive mechanism of colour vision. J. Physiol. (London) 1966;183:497–500. doi: 10.1113/jphysiol.1966.sp007879. [DOI] [PMC free article] [PubMed] [Google Scholar]
- 27.Stockman A, MacLeod DIA, DePriest DD. The temporal properties of the human short-wave photoreceptors and their associated pathways. Vision Res. 1991;31:189–208. doi: 10.1016/0042-6989(91)90111-h. [DOI] [PubMed] [Google Scholar]
- 28.Block G, Hartman AM, Dresser CM, Carroll MD, Gannon J, Gardner L. A data-based approach to diet questionnaire design and testing. Am. J. Epidemiol. 1986;124:453–469. doi: 10.1093/oxfordjournals.aje.a114416. [DOI] [PubMed] [Google Scholar]
- 29.Block G, Coyle LM, Hartman AM, Scoppa SM. Revision of dietary analysis software for the Health Habits and History Questionnaire. Am. J. Epidemiol. 1994;139:1190–1196. doi: 10.1093/oxfordjournals.aje.a116965. [DOI] [PubMed] [Google Scholar]
- 30.Maxwell SE, Delaney HD. Bivariate median splits and spurious statistical significance. Psychol. Bull. 1993;113:181–190. [Google Scholar]
- 31.Judd CM, McClelland GH. Data Analysis: A Model Comparison Approach. Harcourt Brace Jovanovich; San Diego, Calif.: 1989. [Google Scholar]
- 32.Werner JS. Development of scotopic sensitivity and the absorption spectrum of the human ocular media. J. Opt. Soc. Am. 1982;72:247–258. doi: 10.1364/josa.72.000247. [DOI] [PubMed] [Google Scholar]
- 33.Weale RA. Age and the transmittance of the human crystalline lens. J. Physiol. (London) 1988;395:577–587. doi: 10.1113/jphysiol.1988.sp016935. [DOI] [PMC free article] [PubMed] [Google Scholar]
- 34.Savage GL, Haegerstrom-Portnoy G, Adams AJ, Hewlett SE. Age changes in the optical density of human ocular media. Clin. Vision Sci. 1993;8:97–108. [Google Scholar]
- 35.Pokorny J, Smith VC, Lutze M. Aging of the human lens. Appl. Opt. 1987;26:1437–1440. doi: 10.1364/AO.26.001437. [DOI] [PubMed] [Google Scholar]
- 36.Werner JS, Donnelly SK, Kliegl R. Aging and human macular pigment density; appended with translations from the work of Max Schultze and Ewald Hering. Vision Res. 1987;27:257–268. doi: 10.1016/0042-6989(87)90188-x. [DOI] [PubMed] [Google Scholar]
- 37.Pease PL, Adams AJ, Nuccio E. Optical density of human macular pigment. Vision Res. 1987;27:705–710. doi: 10.1016/0042-6989(87)90067-8. [DOI] [PubMed] [Google Scholar]
- 38.Hammond BR, Jr., Wooten BR, Snodderly DM. Individual variations in the spatial profile of the human macular pigment. J. Opt. Soc. Am. A. 1997;14:1187–1196. doi: 10.1364/josaa.14.001187. [DOI] [PubMed] [Google Scholar]
- 39.Beatty S, Hui-Hiang K, Carden D, Murray IJ. Macular pigment optical density measurement: a novel compact instrument. Ophthalmic Physiol. Opt. 1999;19:105–111. [PubMed] [Google Scholar]
- 40.Bieber ML, Werner JS. Vision Science and Its Applications. I. Optical Society of America; Washington, D.C.: 1998. The spatial distribution of human macular pigment; pp. 10–13. [Google Scholar]
- 41.Wyszecki G, Stiles WS. Color Science: Concepts and Methods, Quantitative Data and Formulae. 2nd ed. Wiley; New York: 1982. [Google Scholar]
- 42.Smith VC, Pokorny J. Spectral sensitivity of the foveal cone photopigments between 400 and 500 nm. Vision Res. 1975;15:161–171. doi: 10.1016/0042-6989(75)90203-5. [DOI] [PubMed] [Google Scholar]
- 43.Wooten BR, Wald G. Color-vision mechanisms in the peripheral retinas of normal and dichromatic observers. J. Gen. Physiol. 1973;61:125–145. doi: 10.1085/jgp.61.2.125. [DOI] [PMC free article] [PubMed] [Google Scholar]
- 44.Judd CM, McClelland GH, Smith ER. Testing treatment by covariate interactions when treatment varies within subjects. Psychol. Methods. 1996;1:366–378. [Google Scholar]
- 45.The nutrients were calcium, phosphorus, iron, sodium, potassium, vitamin A (IU), vitamin A (RE), thiamin (vitamin B1), riboflavin (vitamin B2), niacin, vitamin C, saturated fat, oleic acid, linoleic acid, cholesterol, dietary fiber, folate, vitamin E α-TE, zinc, zinc from animal, vitamin B6, magnesium, alpha-carotene, beta-carotene, cryptoxanthin, lutein, lycopene, retinol, and provitamin A carotinoids.
- 46.Seddon JM, Ajani UA, Sperduto RD, Hiller R, Blair N, Burton TC, Farber MD, Gragoudas ES, Haller J, Miller DT, Yannuzzi LA, Willett W. Dietary carotenoids, vitamins A, C, and E, and advanced age-related macular degeneration. J. Am. Med. Assoc. 1994;272:1413–1420. [PubMed] [Google Scholar]
- 47.Snodderly DM. Evidence for protection against age-related macular degeneration by carotenoids and antioxidant vitamins. Am. J. Clin. Nutr. Suppl. 1995;62:1448S–1461S. doi: 10.1093/ajcn/62.6.1448S. [DOI] [PubMed] [Google Scholar]
- 48.Stryker WS, Kaplan LA, Stein EA, Stampfer MJ, Sober A, Willett WC. The relation of diet, cigarette smoking, and alcohol consumption to plasma beta-carotene and alpha-tocopherol levels. Am. J. Epidemiol. 1988;127:283–296. doi: 10.1093/oxfordjournals.aje.a114804. [DOI] [PubMed] [Google Scholar]
- 49.Rimm E, Colditz G. Smoking, alcohol, and plasma levels of carotenes and vitamin E. Ann. N.Y. Acad. Sci. 1993;686:323–333. doi: 10.1111/j.1749-6632.1993.tb39195.x. [DOI] [PubMed] [Google Scholar]
- 50.Werner JS, Steele VG. Sensitivity of human foveal color mechanisms throughout the life span. J. Opt. Soc. Am. A. 1988;5:2122–2130. doi: 10.1364/josaa.5.002122. [DOI] [PubMed] [Google Scholar]
- 51.Eisner A, Fleming SA, Klein ML, Mauldin WM. Sensitivities in older eyes with good acuity: cross-sectional norms. Invest. Ophthalmol. Visual Sci. 1987;28:1824–1831. [PubMed] [Google Scholar]
- 52.Johnson CA, Adams AJ, Twelker JD, Quigg JM. Age-related changes in the central visual field for short-wavelength-sensitive pathways. J. Opt. Soc. Am. A. 1988;5:2131–2139. doi: 10.1364/josaa.5.002131. [DOI] [PubMed] [Google Scholar]
- 53.Kraft JM, Werner JS. Spectral efficiency across the life span: flicker photometry and brightness matching. J. Opt. Soc. Am. A. 1994;11:1213–1221. doi: 10.1364/josaa.11.001213. [DOI] [PubMed] [Google Scholar]
- 54.Schefrin BE, Werner JS. Loci of spectral unique hues throughout the life span. J. Opt. Soc. Am. A. 1990;7:305–311. doi: 10.1364/josaa.7.000305. [DOI] [PubMed] [Google Scholar]
- 55.Kraft JM, Werner JS. Aging and the saturation of colors: 1. Colorimetric purity discrimination. J. Opt. Soc. Am. A. 1999;16:223–230. doi: 10.1364/josaa.16.000223. [DOI] [PubMed] [Google Scholar]
- 56.Eisner A, MacLeod DIA. Blue-sensitive cones do not contribute to luminance. J. Opt. Soc. Am. 1980;70:121–123. doi: 10.1364/josa.70.000121. [DOI] [PubMed] [Google Scholar]
- 57.Stabell B, Stabell U. Absolute spectral sensitivity at different eccentricities. J. Opt. Soc. Am. 1981;71:836–844. doi: 10.1364/josa.71.000836. [DOI] [PubMed] [Google Scholar]
- 58.van Esch JA, Lokdenhof EE, van Doorn AJ, Koenderink JJ. Spectral sensitivity and wavelength discrimination of the human peripheral visual field. J. Opt. Soc. Am. A. 1984;1:443–450. doi: 10.1364/josaa.1.000443. [DOI] [PubMed] [Google Scholar]
- 59.Knau H, Jägle H, Sharpe LT. L/M cone ratios as a function of retinal eccentricity. Color Res. Appl. (to be published) [Google Scholar]
- 60.Otake S, Cicerone CM. L and M cone relative numerosity and red–green opponency from fovea to mid-periphery in human retina. J. Opt. Soc. Am. A. 2000;17:615–627. doi: 10.1364/josaa.17.000615. [DOI] [PubMed] [Google Scholar]
- 61.Hagstrom SA, Neitz J, Neitz M. Variations in cone populations for red–green color vision examined by analysis of mRNA. NeuroReport. 1998;22:1963–1967. doi: 10.1097/00001756-199806220-00009. [DOI] [PubMed] [Google Scholar]
- 62.Polyak SL. The Retina. U. of Chicago Press; Chicago, Ill.: 1941. [Google Scholar]
- 63.Pokorny J, Smith VC, Starr SJ. Variability of color mixture data—II. The effect of viewing field size on the unit coordinates. Vision Res. 1976;16:1095–1098. doi: 10.1016/0042-6989(76)90248-0. [DOI] [PubMed] [Google Scholar]
- 64.Elsner AE, Burns SA, Webb RH. Mapping cone photopigment optical density. J. Opt. Soc. Am. A. 1993;10:52–58. doi: 10.1364/josaa.10.000052. [DOI] [PubMed] [Google Scholar]
- 65.Sharpe LT, Stockman A, Knau H, Jägle H. Macular pigment densities derived from central and peripheral spectral sensitivity functions. Vision Res. 1998;38:3233–3239. doi: 10.1016/s0042-6989(97)00457-4. [DOI] [PubMed] [Google Scholar]
- 66.Bone RA, Landrum JT, Cains A. Optical density spectra of the macular pigment in vivo and in vitro. Vision Res. 1992;32:105–110. doi: 10.1016/0042-6989(92)90118-3. [DOI] [PubMed] [Google Scholar]
- 67.Bone RA. Department of Physics. Florida International University; Miami, Fla.: 33199, August 1999 (personal communication for λ < 420 nm).
- 68.Elsner AE, Burns SA, Beausencourt E, Weiter JJ. Foveal cone photopigment distribution: small alterations associated with macular pigment distribution. Invest. Ophthalmol. Visual Sci. 1998;39:2394–2404. [PubMed] [Google Scholar]
- 69.Swanson WH, Fish GE. Age-related changes in the color-match-area effect. Vision Res. 1996;36:2079–2085. doi: 10.1016/0042-6989(95)00280-4. [DOI] [PubMed] [Google Scholar]
- 70.bell U. Sta, bell B. Sta. Variation in density of macular pigmentation and in short-wave cone sensitivity with eccentricity. J. Opt. Soc. Am. 1980;70:706–711. doi: 10.1364/josa.70.000706. [DOI] [PubMed] [Google Scholar]
- 71.Viénot F. Can variation in macular pigment account for the variation of colour matches with retinal position? In: Mollon JD, Sharpe LT, editors. Colour Vision. Academic; London: 1983. pp. 107–116. [Google Scholar]
- 72.Moreland JD, Bhatt P. Retinal distribution of macular pigment. In: Verriest G, editor. Colour Vision Deficiencies VII. Junk; The Hague, The Netherlands: 1984. pp. 127–132. [Google Scholar]
- 73.Bone RA, Landrum JT, Fernandez L, Tarsis SL. Analysis of the macular pigment by HPLC: retinal distribution and age study. Invest. Ophthalmol. Visual Sci. 1988;29:843–849. [PubMed] [Google Scholar]