

Abstract
Conformational heterogeneity in proteins is known to often be the key to their function. We present a coarse grained model to explore the interplay between protein structure, folding and function which is applicable to allosteric or non-allosteric proteins. We employ the model to study the detailed mechanism of the reversible conformational transition of Adenylate Kinase (AKE) between the open to the closed conformation, a reaction that is crucial to the protein’s catalytic function. We directly observe high strain energy which appears to be correlated with localized unfolding during the functional transition. This work also demonstrates that competing native interactions from the open and closed form can account for the large conformational transitions in AKE. We further characterize the conformational transitions with a new measure ΦFunc, and demonstrate that local unfolding may be due, in part, to competing intra-protein interactions.
Keywords: Conformational Change, Energy Landscape Theory, Cracking, Strain Energy, Adenylate Kinase
Introduction
Flexibility and conformational changes are well acknowledged to be indispensable properties of proteins. New experiments using ultrafast laser technology and detailed computer simulations have begun to reveal the motions of these proteins, which encompass a rich repertoire of movements on various length and time scales. These motions, which complement the static three-dimensional structures provided by X-ray crystallography and NMR measurements, are essential to understand protein functions[1].
Protein flexibility and plasticity allow proteins to bind ligands, form oligomers, aggregate, and perform mechanical work. Therefore, the ability to alter protein dynamics may enable quantitative control of protein functionality. While this form of functional control is very important to biology, it is not well understood from either a theoretical or experimental basis. Thus, the question arises: How can we quantitatively connect conformational dynamics with biomolecular recognition and function? To address this question, we propose a new structure-based model to study the dynamical properties of proteins, specifically, conformational rearrangement.
Large conformational changes in proteins are important in many cellular signaling pathways, which can be generally described by the following steps. First, a signaling protein becomes activated, which then activates, or deactivates, signal transducing proteins, such as kinases. Signal transducing proteins are mobile and communicate with receptor proteins, which then produce specific reactions. The activity of many signal transducing proteins is associated with large conformational changes. For example, C-terminal Src Kinase protein[2], the Cyclin Dependent Kinase family [3], the Protein Kinase C family [4] and Adenylate Kinase (AKE)[5] have stable inactive conformations, in addition to active forms. Since the balance between conformations regulates protein activity, conformational transitions play important roles in the machinery of the cell[6].
Functional conformational transitions require a biomolecule to have at least a pair of conformational states of nearly equal free energy. The energy landscapes of these proteins have several basins of attraction and the transitions between basins dictates the conformational dynamics[7]. Despite the biological significance of these processes, the details of these processes are not fully understood. With a complete understanding of conformational changes we hope to predict which proteins have multiple conformations, predict these alternate conformations, determine the properties of the conformational transition ensemble, explain how proteins have evolved to have these properties and eventually design novel macromolecular machines which can execute any given biological function. To work towards these objectives, we explore the relationship between the structure, folding and function of AKE.
While many studies have investigated the relationship between protein structure and folding, fewer have focused on the relationship between structure and function, and even fewer have explored the interplay between protein structure, folding mechanism and function. Current experimental methods, including NMR, X-ray crystallography and fluorescence spectroscopy have been successful in describing the structural properties of individual states. These methods sometimes also manage to capture the chain flexibility[8,9]. Nonetheless, experimental techniques have not been able to provide the molecular details necessary to fully understand the mechanism of conformational changes. Due to these limitations, there has been significant effort to develop a theoretical framework for describing functional transitions in proteins[10–15]. With a developed framework, one may study the energetic barriers associated with conformational transitions, their coupling to folding/unfolding (cracking), the role of ligands, and the role of energetic heterogeneity and frustration in conformational transitions[10,11]. In this work we propose a structure-based model that has a clear physical interpretation. Our model demonstrates that intraprotein contacts formed in the ligand bound structure of AKE can be responsible for the observed functional conformational changes. There has been success in applying simplified models to conformational changes, but our model provides a new physical interpretation that has not been proposed elsewhere.
The simplest model to describe functional transitions is based on landscape hopping and cracking between elastic networks[10,11]. To lowest order approximation, all interactions about a minimum are harmonic. Thus, this approach uses the most simplified approximation to the landscape about two energetic basins. From this model, the energetics of transitions are determined. This approach has been successful in demonstrating the physical relationship between protein fluctuations (low frequency normal modes) and protein function (conformational transition), and thus serves as a benchmark for further work.
To elucidate the relationship between protein structure, folding and function, functional transitions have been modeled as a result of ”hopping” [12,14] between structure-based energy surfaces. These structure-based potentials, which were inspired by the work of Gō[16], have had great success in explaining the interplay between protein structure and protein folding[17,18]. A limitation of these models is that the two structure-based energy surfaces have many nearly redundant contributions, since the conformations of interest have structural overlap. When applying these models to entire proteins, these near-redundancies may, or may not, contribute to the conformational changes. These redundancies add a degree of uncertainty to the physical interpretation of the system. Therefore, redundant interactions have been removed and replaced by single contacts for both structures.
Inspired by the successes of minimalist structure-based models in advancing our understanding of protein folding and molecular recognition[17–26], our approach begins with the established theoretical framework of protein folding. As described below, we extend this framework to account for large conformational changes.
It is well established that protein folding is the result of a globally funneled, minimally frustrated energy landscape[27–29]. The application of the principle of minimal frustration via structure-based potentials with single native basins has had considerable success in explaining the physics of protein folding. To now explain large functional transitions, there is a need for multiple basins. Thus, we generalize the minimally frustrated energy landscape of protein folding studies to incorporate biologically functional motions. We propose protein structure dominates functional behavior, as well as protein folding. Thus, we begin with a structure-based potential and add gradual perturbations, based on an alternate structure, to produce multiple minima. Our model implies, as does our previous model[10], that the transition ensemble can be determined from information of the conformations of interest. This is an implication of structure-based models in general (folding transition states can be determined by information of the native state). Using our model, we also show that multiple stable conformations may be due to amplified roughness in the global energetic landscape upon ligand binding.
Some proteins undergo large conformational changes without the aid of a cofactor. In allosteric proteins, however, such as Calmodulin and AKE, large conformational changes are associated with a co-factor, often an ion or a small biological molecule. Our model is general enough to be applied to both allosteric and non-allosteric conformational changes.
The model protein used in this study is E. Coli Adenylate Kinase. AKE is a 214 residue 3 domain protein (Figure 1) that catalyzes the reaction
Fig. 1. Functionally Relevant Conformations of AKE.
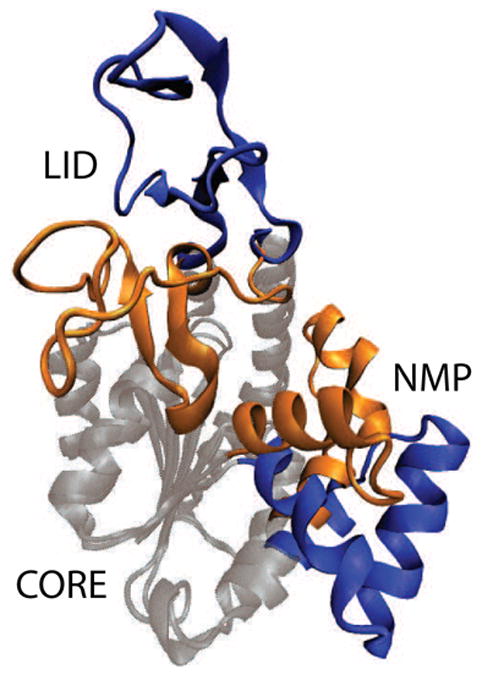
Structure of the open (blue)[42] and closed (orange)[5] forms of AKE, with the CORE domain spatially aligned (grey). ATP binds in the pocket formed by the LID and CORE domains. AMP binds in the pocket formed by the NMP and CORE domains. Figure prepared with VMD[43].
| (1) |
while undergoing large conformational changes which are believed to be the rate limiting steps of the reaction[30]. This protein was chosen mainly because it is well established that its multiple structures are catalytically relevant and because there is evidence that the conformational changes are rate limiting. Moreover, AKE is a good protein system to study the physics of conformational switching because there is a large amount experimental and theoretical data available on this process.
RESULTS
Hamiltonian Determination and Implications
First, we developed several potentials and determined which reproduces the structural properties of the open and closed forms of AKE. Second, we employed the superior potential to study the conformational transitions of AKE. Analogous to protein folding models where information of the native state is used to model the folding properties, this work uses information about two stable forms of AKE to infer conformational transition properties. To determine which potential most accurately accounts for the structural properties of AKE’s conformations, we compared conformational preference (i.e., open or closed), interresidue distance distributions and B-factors to experimental results. Four proposed Hamiltonians were compared: (open structure potential), (open/closed mixed structure potential), (closed/open structure potential) and (closed structure-based potential, see Models and Methods). Each potential stabilizes the contacts native to the open or closed form (denoted by C-open and C-closed) and the dihedral angles found in the open or closed form (D-open and D-closed). According to the above criteria, reproduces experimental results most accurately (explained below).
The first experimentally known property of AKE that our potential must reproduce is that the unligated protein must be predominantly in the open form. Since we later propose ligand binding can be represented by introducing contacts unique to the closed form (which are scaled by ε2; see Models and Methods), the simulated AKE without the contacts unique to the closed form (i.e. ε2 = 0.0) must also be in the open form. and have this property. and do not exhibit this property under any conditions (data not shown). Since the open state is not an energetic minimum (global or local) for nor these are not appropriate potentials for our investigation, and were not further considered. This result suggests that the open state is not purely a consequence of entropy, but energetic contributions are important as well.
Distance distributions P(r) of residues A55 and V169 (located in the NMP and LID domains, respectively) have been determined experimentally for unligated and ligated AKE[31] and were compared to the values obtained for the remaining two Hamiltonians: and . Rmax is the value of r at which P(r) is a maximum. In simulations, Rmax does not vary significantly for T < Tf. The resulting Rmax values from simulations and experiments are summarized in Table 1. Rmax for with ε2 = 0 (unligated) agrees very well with experiments. For residues A55 and V169 are closer than in experiments, indicating the relative locations of the LID and NMP domains do not reflect in-solution dynamics. Rmax for the closed form (ε2 = 1.6 maintains a closed conformation) for both potentials agrees equally well with the crystal structure distances but not as well with the fluorescence results. These results support as the more appropriate potential for our studies.
Table 1.
Summary of Cα – Cα distance distributions for A55 and V169 from experiments[31] and simulations. Rmax is value for which the Cα – Cα distance distribution is peaked. This data suggests is the more appropriate potential to represent the dynamical properties of AKE.
| System | Rmax (Å) | Rcryst (Å) |
|---|---|---|
| unligated AKE (experimental) | 29.2–31.4 | 29.5a |
| ε2 = 0 | 27.0–32.7 | 29.5 |
| ε2 = 0 | 22.0–30.0 | 29.5 |
| AKE – Ap5A (experimental) | 10.0–10.7 | 12.3b |
| ε2 = 1.6 | 11.6–13.8 | 12.3 |
| ε2 = 1.6 | 11.8–13.4 | 12.3 |
from pdb file 4AKE.
from pdb file 1AKE.
B-factors for each conformation, simulated under the different potentials, were compared to crystal structure B-factors. Correlation coefficients between simulated B-factors and experimental B-factors were computed. The correlation coefficient for the B-factors from the open crystal structure and is 0.68. To correlation coefficient between B-factors from the crystal structure and is 0.56. Both potentials’ B-factors were poorly correlated for the closed conformation (r<0.5). B-factors for all simulations were significantly larger than crystal structure B-factors, which is expected when comparing simulated to crystallographic B-factors[32]. Large B-factors have also been observed in all-atom, explicit solvent, simulations and were attributed to not including crystal contacts[33]. To validate this claim, we simulated the dimeric form (PDB entry 4AKE:chains A and B) of the open conformation using a structure-based potential. The native interactions were determined with CSU[34]. The average B-factor was reduced from the monomer value of 273 Å2 to 78 Å2 for the dimer, and the correlation with experimental B-factors decreased to 0.44. The experimental average B-factor is around 38 Å2. Since including a fraction of the crystal contacts (via a dimer) significantly alters the dynamics, crystallographic B-factors may not accurately describe in-solution multi-domain protein dynamics. Though, the discrepancy may also imply that our model is too flexible. Since the simulated dimeric B-factors are two times larger than the crystal B-factors, it is possible that the energetic barriers in our model are too small by up to a factor of two.
The analysis of conformational preference for the four designed potentials shows that most accurately represents the open and closed conformations of AKE and is thus used to study the conformational transitions. This decision has several implications. First, it suggests that the energy landscape has a single minimum corresponding to the open form, and additional minima are the result of perturbations from ligand binding. Second, the open conformation is the only stable state for some non-zero values of ε2 (Figure 2). This demonstrates that contacts that are not native to the open form can exist and aid in conformational changes while not destabilizing the open form. Finally, ligand binding is well represented by increasing ε2, therefore, to first approximation the effects of ligand binding are manifested in contacts found in the closed form.
Fig. 2. Contacts Native to the Closed Conformation Can Account for Large Conformational Changes.
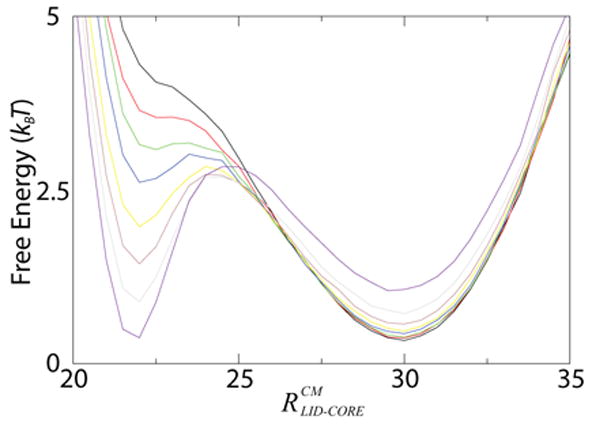
Free energy as a function of the distance between center of mass of the LID domain and CORE domain ( ) for ε2 = 0.5 − 1.2 (incremented by 0.1, colored black to purple). ε2 is the interaction strength of closed conformation contacts, which represent ligand binding. For ε2 > 0.6 there are multiple minima indicating ε2 can represent ligand binding accurately. For ε2 < 0.7 there is only one minimum corresponding to the open form, indicating non-open interactions can exist without distorting the open form.
Energetic Barriers of Conformational Transitions
Free energy as a function of RMSD from the closed form is shown in Figure 3(a). TSE I and TSE II correspond predominantly to LID domain closure, and NMP domain closure, respectively (see Figure 4(d)). Figures 3(b) and 3(c) illustrate the energetic properties of TSE I and TSE II (see Functional Φ-values below). This finding is surprising, since there are more interactions between the NMP domain and CORE domain than there are between the LID domain and CORE domain. The barrier for LID closure is 0.9 kBT and the barrier for NMP closure is 3.0 kBT. Thus, if structural contributions dominate functional kinetics, then NMP domain closure should be rate limiting in AKE catalysis. While this prediction has not been made previously, it agrees with previous results from elastic network models where the lowest frequency normal mode corresponds to LID domain motion and the second lowest mode corresponds to NMP domain motion[35]. Thus, it is reasonable to expect the curvature of the NMP closure barrier will be greater than that of LID closure. While elastic network models have not explored the possibility of the intermediate we observe here (LID closed, NMP open), they have predicted a steeper strain energy barrier when opening the NMP domain than closing the LID domain[10], also in agreement with our results.
Fig. 3. Multiple Transitions Seen in Conformational Rearrangement of AKE.
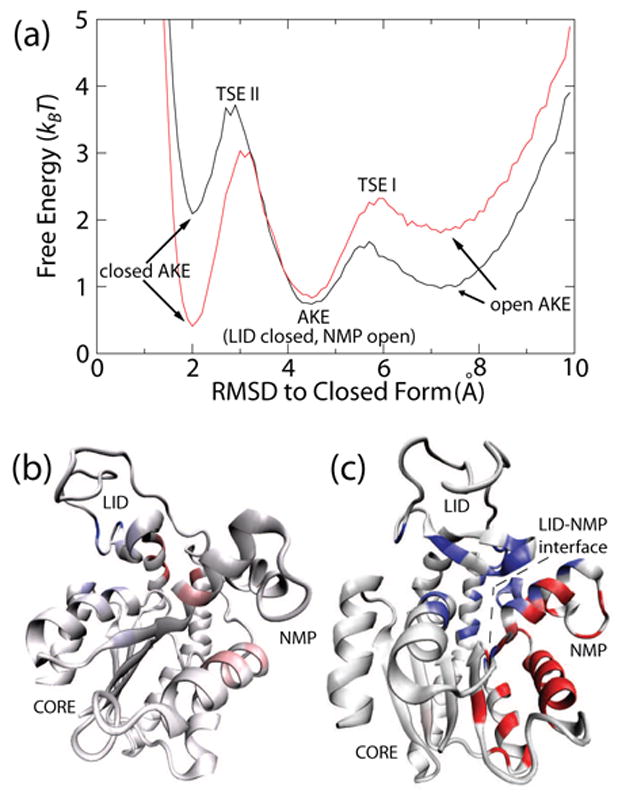
(a) Free energy versus RMSD from the closed conformation for ε2 = 1.2 (black) and ε2 = 1.3 (red) shows the free energy barriers to close the LID domain (TSE I) and the NMP domain (TSE II). This result suggests NMP domain closure is rate limiting. ΦFunc-values mapped onto the closed structure for LID closure (b, rotated for clarity) and NMP closure (c). For residues with ΔΔGY − X < 0 (residues that resist closing), ΦFunc-values are colored white (= 0) to red (≥1). For ΔΔGY − X > 0 (residues that contribute to closing), ΦFunc-values are colored white (= 0) to blue (≥1). The dotted line represents the LID-NMP interface, which contributes strongly to NMP domain closure. Figures (b) and (c) prepared with VMD[43].
Fig. 4. Proposed Hamiltonian Captures Dynamics of AMP, ATP and Ap5A Binding.
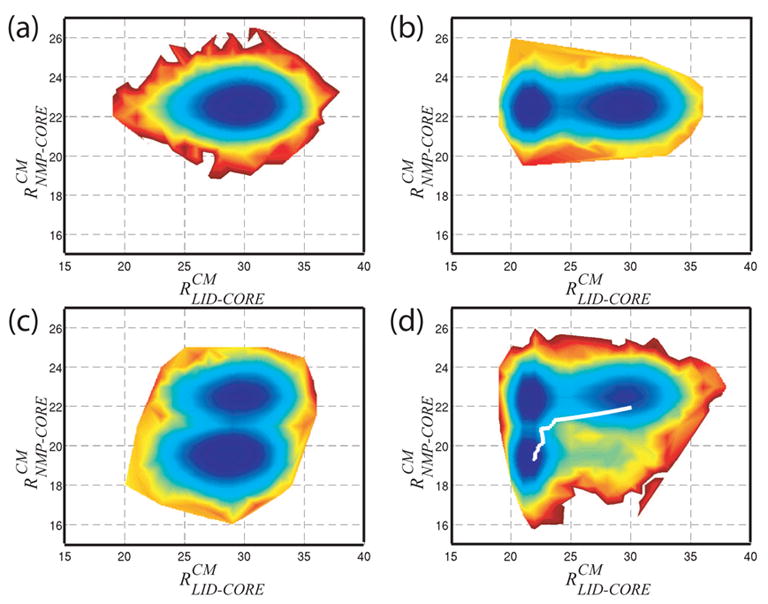
Free Energy surfaces for with four subsets of QLigand and varied ligand binding parameter ε2. (a) ε2 = 0.0 represents the unligated AKE. (b) with ε2 = 1.5 represents ATP binding. (b) with ε2 = 1.9 represents AMP binding. (d) All QLigand contacts, ε2 = 1.3, represents Ap5A binding, or simultaneous AMP and ATP binding. A predicted pathway generated via normal mode analysis[10] (white line in (d)) shows excellent agreement with our results. 10 kBT energy scale (dark blue to dark red).
Localized Strain Energy and Unfolding Govern Conformational Changes
We previously proposed a cracking mechanism for allosteric proteins, based on normal mode analysis of AKE[10]. Upon translation along the lowest frequency modes, insurmountably high strain energy accumulated in very localized regions of the protein. This strain was enough to unfold the entire protein (>20kcal/mol), thus we predicted that localized regions of the protein unfold during conformational transitions, as a mechanism to reduce strain and enhance catalytic efficiency. The simulations reported here support the high strain energy and unfolding hypothesis (Figure 5).
Fig. 5. High Strain Energy Gives Rise to Local Unfolding.
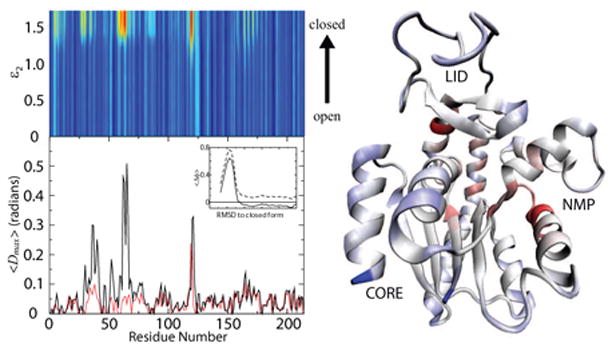
Strain energy as a function of binding parameter, ε2, and residue number (top left), colored blue (low strain) to red (high strain). Unfolding measure, <Dmax>, by residue number (bottom left). Red and black lines correspond to <Dmax> for LID and NMP transition. Average deviation from PDB dihedral values for dihedral angle 63 as a function of RMSD from closed form (inset). Strain energy for ε2 = 1.7 mapped onto closed form of AKE. Red indicates high strain energy, blue indicates low strain energy and white indicated intermediate strain energy. The correlation between high strain energy and protein unfolding suggests unfolding is a mechanism by which strain energy is released during conformational changes. Analysis of individual domain motion (as seen in Figures 4(b) and (c)) shows that each peak in strain energy and <Dmax> is due to NMP or LID domain motion (not shown). Figure of structure prepared with VMD[43].
Figure 5 (top left) shows the average strain energy (defined as the total potential energy) by residue. There are clear peaks near residues 60–70, 120–125 and to a lesser extent residues 10–20, 30–35, 80–90 and 170–180. These finding are in excellent agreement with normal mode predictions of high strain in residues 10, 110–125, 150 and 160–170[10]. In normal mode studies, residues 30, 60 and 80 have only weak peaks at the later stage of the conformational transition. This is likely due to the previous data mainly reporting the strain associated with LID closure, and not NMP closure [10].
We believe that the high strain energy in AKE is the result of competing energetic contributions. Since competing energetic terms can not be satisfied simultaneously, internal strain must result. Some regions of strain drive the protein’s opening transition and other regions of strain drive the closing transition (see Functional Φ-values below). Thus, the balance between competing strains energies is very important for the function of AKE.
Local unfolding was measured by calculating the average deviation in dihedral angle i from the closed and open conformations as a function of RMSD from the closed conformation. The inset in Figure 5 shows and (residues 63–66). The fact that and both exceed zero indicates an unfolding event is occuring. To quantify the unfolding we calculated the D-value, defined as
| (2) |
as a function of RMSD from the closed form. By definition, D is greater than zero unless φclosed < φ < φopen, for which values D is zero (if 0 < φopen − φclosed < π). In other words, if a given dihedral angle is between the corresponding angles of the open and closed forms, D equals zero, otherwise D > 0 as it deviate from the boundary. The maximum value of D for each TSE, Dmax, was calculated for each dihedral angle and averaged by residue1. < Dmax > for the two energetic barriers is shown in Figure 5.
There is excellent agreement between regions of high strain energy and local unfolding (Figure 5). To no surprise the hinge region of the LID domain is under significant strain. More surprisingly, and in excellent agreement with normal mode predictions, is the strain experienced by residues 60–63. The different regions of strain correspond to strain that drives the protein opening and strain that drives the protein closing. Thus, large conformational changes in AKE are, in part, the result of competing intra-protein interactions. These interaction give rise to large strain energies, which are reduced through local unfolding.
Functional Φ-values
To determine which interactions are responsible for conformational changes, high strain energy and local unfolding, we calculated functional Φ-values for each residue[10–12], defined as
| (3) |
where ΔΔG‡−X = ΔG‡ − ΔGX, ΔΔGY − X = ΔGY − ΔGX and ‡ is the transition state between states X and Y2. The ΦFunc values for LID closure (TSE I) and NMP closure (TSE II) are mapped onto the structure of the closed form (Figures 3(b) and (c)). Before discussing the results, it is important to clarify the similarities and differences in the definition and interpretation of ΦFunc-values and protein folding Φ-values.
Protein folding Φ-values measure the amount of native content present in a residue at the folding transition state ensemble[36]. Owing to the funneled global landscape[28] and the principle of minimal frustration[37] ΔΔGY − X ≥ ΔΔG‡ − X ≥ 0, where Y = native state and X = denatured state (i.e. non-local interactions stabilize the transition state more than the denatured state, and the native state more than the transition state). Thus, for protein folding, negative Φ-values and Φ-values greater than 1 are not easily interpreted.
As with folding Φ-values, ΦFunc measures the amount of state Y content present in the transition state ensemble. Though, due to the complexity of conformational changes, the same restrictions on ΔΔG and ΦFunc are not applicable. Since conformational changes arise from perturbations to the global landscape, |ΔΔGY − X| can be less than |ΔΔG‡ − X| and ΔΔG‡ − X can be negative. In order to obtain a complete picture of the dynamics, we must study Φfunc in conjunction with ΔΔG.
A positive ΦFunc-value indicates ΔΔGY − X ≥ ΔΔG‡ − X ≥ 0 or ΔΔGY − X ≤ ΔΔG‡ − X ≤ 0. i.e., the residue stabilizes both the transition state and state Y (relative to state X), or destabilizes the transition state and state Y. Like-wise, negative ΦFunc-values (ΔΔGY − X ≥ 0 ≥ ΔΔG‡ − X or ΔΔGY − X ≤ 0 ≤ ΔΔG‡ − X) indicate the residue’s energetic effect on the transition state is opposite of that on state Y. The ambiguity is resolved by observing ΔΔGY − X.
An additional deviation from Φ-values is ΦFunc is not calculated if |ΔΔGY − X| < 0.75 kBT AND |ΔΔG‡ − X| < 0.75 kBT, rather than just using a cut-off for |ΔΔGY − X|. Since we can’t assume |ΔΔGY − X| > |ΔΔG‡ − X|, residues may strongly affect the transition state and not state X nor Y. We do not want to filter this feature out accidentally.
Our model indicates, as shown in Figure 3(b), that residues 131, 135 and 143 (blue residues in LID domain) stabilize the closed LID domain (ΔΔGY − X > 0) and contribute to closure of the LID domain (ΦFunc > 0). Our model also predicts that residues 118 and 121 (red residues at hinge region between the LID and CORE domains) resist LID domain closure (ΔΔGY − X < 0) and this resistance is accumulated during the closing transition state (ΦFunc > 0), in agreement with high strain energies observed during the closing transition in normal mode calculations[10]. Additionally, the large ΦFunc-values for ΔΔGY − X > 0 that span the LID-NMP interface in Figure 3(c) and the lack of ΦFunc-values at the interface in Figure 3(b) indicate that NMP closure is stabilized substantially by the closed LID domain while LID closure is not highly influenced by the NMP domain. To further illustrate the NMP domain’s dependence on the LID domain and the LID domain’s independence of the NMP domain, we excluded the LID-NMP contacts and observed strong inhibition of NMP closure, with little effect on LID closure (not shown). Finally, our model shows that NMP intra-domain interactions resist conformational changes. Therefore, we predict that mutations in the core of the NMP domain will disrupt the interhelical interactions, reduce the energetic barrier to change conformation and/or stabilize the closed NMP domain.
These results support the claim that strain energy can be characterized as strain due to opening (ΔΔGY − X > 0) or strain due to closing (ΔΔGY − X < 0).
High Strain and Cracking are Robust Features of Conformational Changes
Using subsets of our ligand binding interactions, QLigand, we were able to simulate the unligated (Figure 4(a)), ATP bound (4(b)), AMP bound (4(c)) and Ap5A bound (4(d)) states. Since Ap5A is a bisubstrate analogue for AMP and ATP, which are biologically relevant, we have focused our attention there, thus far.
Strain energy and <Dmax> values were also computed for ATP binding and AMP binding (not shown). We observe that each peak in strain energy and <Dmax> in Figure 5 corresponds exclusively to either LID closure or NMP closure (not shown). This suggests the coupling between high strain and local unfolding (cracking) is a property common to many multi-domain proteins, where the number of domains is inconsequential.
CONCLUSIONS
Using a coarse-grained model, we have shown that large conformational changes in AKE can be accounted for by the intra-protein contacts that are formed upon ligand binding. This work demonstrates that the energy landscape of AKE follows the principle of minimal frustration, with the addition of contacts of two competing native states. Analysis of the structural properties of AKE has been performed via this model and has yielded several novel findings. One finding is that energetically competing native interactions can exist in AKE and contribute to its functional dynamics. This model provides the first direct measurements of cracking (which was proposed based on the results from normal mode analysis of AKE[10]). We have further demonstrated that this local unfolding is the result of competing strain energies in the protein and that this phenomenon applies to the motion of individual domains, suggesting it is not limited to three-domain proteins.
While this energetically heterogenous structure-based model has had considerable success, it is yet to be established whether or not it is common for intra-protein interactions to produce competing strain energies that give rise to local unfolding during functional transitions, or if AKE is somehow unique. Additionally, it will be interesting to see to what extent non-local interactions contribute to conformational changes. These answers, in addition to a more detailed understanding of conformational changes, will hopefully become clear as theoretical models become more widely applied and refined.
Models and Methods
Construction of the Energy Function
We study the conformational transitions of AKE by employing a structure-based Hamiltonian[21] with a modified contact map (described below). Structure-based potentials account for native interactions which are usually given the same energy weighting and produce a single funneled energy landscape. In a Cα-model each residue is represented by a single bead centered at the Cα position. Interaction energies of adjacent beads are harmonic in bond length and angle, with the geometry of the native state included through a dihedral term and non-local bead-bead interaction terms. Non-local contacts are included via
| (4) |
which has a minimum of depth εn at r = σij, with σij being the native distance between the Cα (i) and Cα (j) atoms in the crystal structure. In homogenous structure-based models, there is a single value for εn. To model conformational changes, different sets of contacts n are given different values of εn (see below). Temperature and energy values reported in this work are in units of ε1 (interaction strength of contacts in Qopen or Qclosed, see below), and distances are reported in Angstroms. A detailed description of a structure-based potential can be found elsewhere[21].
A simple structure-based potential has a single minimum. Making such a model for each form of AKE is straightforward. In this work, however, we construct a single potential that has multiple minima. Thus, to extend a structure-based model to systems with multiple minima, we modified the contact map and the dihedral angles. To determine whether dihedral angles of non-local interactions govern conformational change, two sets of non-local interactions were determined, one based on the open conformation and the other based on the closed conformation. In addition, two sets of dihedral values were considered, one from the open conformation and the other based on the closed conformation. All four combinations of contact map and dihedral values were simulated and compared to experimental data.
Native contact maps Qopen and Qclosed were generated using the CSU software package[34], and are assigned interaction distances from their respective structures. Contacts that are unique to the closed form, and are over 50% further apart when in the open form (QLigand in Figure 6) are deleted from Qclosed. Both contact sets, Qopen and Qclosed, were used in different simulations to model the open (unligated) conformation and were given an energetic weighting of ε1 = 1.0. These two contact maps were simulated to determine if non-local interactions govern the open conformational dynamics (see Results). To simulate the closed (ligand bound) conformation, QLigand contacts are added to each simulation with an energetic weight of ε2, which is varied from 0.0 to 2.0. QLigand is defined as the contacts when in the closed conformation with Cα–Cα distances that are over 50% further apart in the open conformation. In summary, Qopen and Qclosed are contact maps based on the open and closed structures where additional contacts (QLigand) are added to represent ligand binding.
Fig. 6. Contacts Unique to Closed Form.
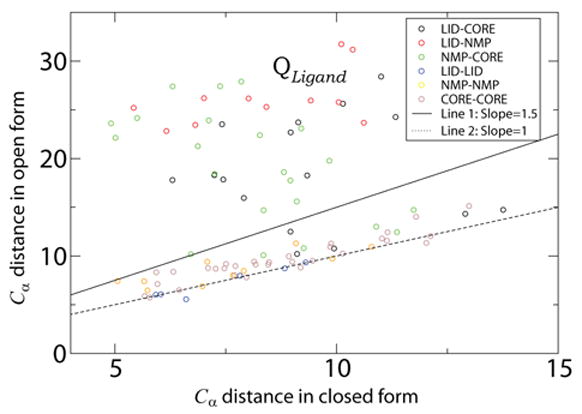
Each point represents a contact between residue i and residue j that is unique to the closed form. The Y-axis is the distance between the Cα atoms of residues i and j in the open form and the X-axis is the distance in the closed form. The locations of the residue pairs are indicated by color. i.e., black circles indicate the contact is between a residue in the LID domain and a residue in the CORE domain. Contacts above the line of slope 1.5 (solid line) constitute the set QLigand.
Modeling ligand binding by including QLigand interactions is a warranted approximation. QLigand represents interactions that, inarguably, stabilize the ligand bound form. When ε2 > 0 there is an energetic bias to the closed form. Inspection of the ligand-protein interactions in AKE shows that many ligand mediated interactions are included in QLigand through direct residue-residue interactions. Additionally, some missing ligand mediated interactions are accounted for by local (in sequence) contacts. For example, the ligand mediated interaction between residues L58 and R167 is not included in QLigand, though several contacts between L58 and residues 170–175 are included.
The mixing of multiple structure-based potentials has been successful in representing conformational tranistions[12,14]. Previous studies mixed energetic terms at the global level (conformational switching is the result of all energetic contributions switching simultaneously between the two minima), whereas our potential is local (one interaction can stabilize the open conformation while a different interaction stabilizes the closed conformation). Thus, we must ask: Are dihedral angles or non-local contacts responsible for conformational transitions? To explore this question, Qopen and Qclosed were permuted with the open and closed values for dihedral angles, resulting in 4 possible Hamiltonians H(Qopen, φopen), H(Qclosed, φopen), H(Qopen, φclosed) and H(Qclosed, φclosed) (denoted by , , and , where C and D signify contacts and dihedral angles). The properties of AKE were examined with each potential. Several properties (conformational preference, interresidue distance distributions and B-factors) were compared to experimental values in order to determine the potential that most accurately captures AKE’s dynamics about the two known structures. As discussed in the Results section, we find the potential (single structure-based potential, based on the open structure, plus QLigand contacts) is the most appropriate to study the conformational transitions of AKE.
Calculating Thermodynamic Properties
We used Molecular Dynamics (MD) to simulate the conformational changes of AKE. We developed our own software to simulate constant temperature runs. Temperature was maintained using the Berendsen algorithm to couple the system to a thermal bath[38]. Our code was tested extensively to ensure correct calculations of energy and force through systematic debugging and simulated folding of CI2 and α-spectrin SH3 domain proteins. The folding mechanisms and thermodynamics of these proteins are in excellent agreement with previously reported simulations using AMBER[20].
Free energy profiles were obtained by simulating several constant temperature runs near room temperature and combining them by using the WHAM algorithm[39,40].
The folding temperature, Tf, was approximated, via kinetic unfolding simulations to be between, 1.15 and 1.25 (in reduced units). All results in this paper are at T=0.9≈ 0.8Tf, which corresponds approximately to room temperature.
and RMSD calculations
Allosteric conformational changes involve major domain motion. We measure this motion via the spatial distance between the centers of mass of the domains and the RMSD from the closed conformation. and are the distances between the centers of mass of the LID and the CORE domains, and the distance between the centers of mass of the NMP and the CORE domains, respectively. is 30.1 Å and 21.0 Å in the open and closed form. is 22.0 Å and 18.4 Å in the open and closed form. Domain definitions are given in Table 2. RMSD was calculated using the McLachlan algorithm[41] in the PROFIT software package.
Table 2.
Summary of symbols and names.
| Name/Symbol | Description |
|---|---|
| CORE domain | Residues 1–29, 68–117 and 161–214 |
| NMP domain | Residues 30–67 |
| LID domain | Residues 118–160 |
| Hamiltonian with dihedral angles (D) from conformation X(=open/closed) and contact set (C) QY (Y=open/closed). There are 4 possibilities: , , and | |
| QY and σY | Contact set and contact distances for conformation Y (=open/closed) |
| QLigand | Contacts above line 1 in Figure 6: N=39 |
| Subset of QLigand, contacts between LID domain and CORE domain: N=11 | |
| Subset of QLigand, contacts between NMP domain and CORE domain: N=17 | |
| Subset of QLigand, contacts between LID domain and NMP domain: N=11 | |
| ε1 | Interaction strength of contacts in QY |
| ε2 | Interaction strength of contact set QLigand |
| Distance between center of masses of NMP and CORE domains | |
| Distance between center of masses of LID and CORE domains | |
Definition of Open and Closed states
The open and closed structures were obtained from PDB entry 4AKE, chain A[42] and 1AKE, chain A[5]. The system is ”open” when and have only one minimum each located near 30.1 Å and 22.0 Å. Figure 2 shows for several values of ε2
Supplementary Material
Acknowledgments
We are are particularly grateful to Peter Wolynes for many discussions, in particular on the concept of ΦFunc. We also thank S. Takada and K. Okazaki for insightful comments on the manuscript. This work was funded by the NSF-sponsored Center for Theoretical Biological Physics (Grants PHY-0216576 and 0225630) and the NSF Grant 0543906. PW is supported by the NIH Molecular Biophysics Training Grant at UCSD (Grant T32 GM08326).
Footnotes
For each residue, there are two Dmax values for which that residue is one of the middle two residues constituting the angle. We average over these two Dmax values for each residue.
ΔΔG is the calculated change in free energy upon removal of all non-local interactions via perturbation theory. Thus, positive ΔΔGY − X values indicate that a residue stabilizes state Y more than state X.
Publisher's Disclaimer: This is a PDF file of an unedited manuscript that has been accepted for publication. As a service to our customers we are providing this early version of the manuscript. The manuscript will undergo copyediting, typesetting, and review of the resulting proof before it is published in its final citable form. Please note that during the production process errors may be discovered which could affect the content, and all legal disclaimers that apply to the journal pertain.
References
- 1.Swain J, Gierasch L. The changing landscape of protein allostery. Curr Opin Struct Biol. 2006;16:102–108. doi: 10.1016/j.sbi.2006.01.003. [DOI] [PubMed] [Google Scholar]
- 2.Ogawa A, Takayama Y, Sakai H, Chong KT, Takeuchi S, Nakagawa A, Nada S, Okada M, Tsukihara T. Structure of the carboxyl-terminal Src kinase, Csk. J Biol Chem. 2002;277:14351–14354. doi: 10.1074/jbc.C200086200. [DOI] [PubMed] [Google Scholar]
- 3.Deffondt HL, Rosenblatt J, Jancarik J, Jones HD, Morgant DO, Kim S. Crystal Structure of cyclin-dependent kinase 2. Nature. 1993;363:595–602. doi: 10.1038/363595a0. [DOI] [PubMed] [Google Scholar]
- 4.Xu Z, Chaudhary D, Olland S, Wolfrom S, Czerwinski R, Malakian K, Lin L, Stahl M, Joseph-McCarthy D, Benander C, Fitz L, Greco R, Somers W, Mosyak L. Catalytic domain crystal structure of protein kinase C-θ (PKCθ) J Biol Chem. 2004;279:50401–50409. doi: 10.1074/jbc.M409216200. [DOI] [PubMed] [Google Scholar]
- 5.Muller CW, Schulz GE. Structure of the complex between adenylate kinase from Escherichia coli and the inhibitor Ap5A refined at 1.9 A resolution. A model for a catalytic transition state. J Mol Biol. 1992;224:159–177. doi: 10.1016/0022-2836(92)90582-5. [DOI] [PubMed] [Google Scholar]
- 6.Gunasekaran K, Ma B, Nussinov R. Is Allostery an Intrinsic Property of All Dynamic Proteins? Proteins: Struct Funct Bioinfo. 2004;57:433–443. doi: 10.1002/prot.20232. [DOI] [PubMed] [Google Scholar]
- 7.Tsai CJ, Kumar S, Ma B, Nussinov R. Folding funnels, binding funnels, and protein function. Prot Sci. 1999;8:1181–1190. doi: 10.1110/ps.8.6.1181. [DOI] [PMC free article] [PubMed] [Google Scholar]
- 8.Eisenmesser EZ, Bosco DA, Akke M, Kern D. Enzyme dynamics during catalysis. Science. 2002;295:1520–1523. doi: 10.1126/science.1066176. [DOI] [PubMed] [Google Scholar]
- 9.Kern D, Zuiderweg ERP. The role of dynamics in allosteric regulation. Curr Opin Struct Biol. 2003;13:748–757. doi: 10.1016/j.sbi.2003.10.008. [DOI] [PubMed] [Google Scholar]
- 10.Miyashita O, Onuchic JN, Wolynes PG. Nonlinear elasticity, proteinquakes, and the energy landscapes of functional transitions in proteins. Proc Nat Acad Sci USA. 2003;100:12570–12575. doi: 10.1073/pnas.2135471100. [DOI] [PMC free article] [PubMed] [Google Scholar]
- 11.Miyashita O, Wolynes PG, Onuchic JN. Simple energy landscape model for kinetics of functional transitions in proteins. J Phys Chem B. 2005;109:1959–1969. doi: 10.1021/jp046736q. [DOI] [PubMed] [Google Scholar]
- 12.Okazaki K, Koga N, Takada S, Onuchic JN, Wolynes PG. Multiple-basin energy landscapes for large amplitude conformational motions of proteins: Structure-based molecular dynamics simulations. Proc Nat Acad Sci USA. 2006;103:11844–11849. doi: 10.1073/pnas.0604375103. [DOI] [PMC free article] [PubMed] [Google Scholar]
- 13.Zuckerman DM. Simulation of an ensemble of conformational transitions in a united-residue model of calmodulin. J Phys Chem B. 2004;108:5127–5137. [Google Scholar]
- 14.Best RB, Chen Y, Hummer G. Slow protein conformational dynamics from multiple experimental structures: The helix/sheet transition of Arc repressor. Structure. 2005;13:1755–1763. doi: 10.1016/j.str.2005.08.009. [DOI] [PubMed] [Google Scholar]
- 15.Maragakis P, Karplus M. Large amplitude conformational change in proteins explored with a plastic network model: Adenylate Kinase. J Mol Biol. 2005;352:807–822. doi: 10.1016/j.jmb.2005.07.031. [DOI] [PubMed] [Google Scholar]
- 16.Ueda Y, Taketomi H, Gō N. Studies on protein folding, unfolding and fluctuations by computer simulation. I The eNects of specific amino acid sequence represented by specific inter-unit interactions. Int J Pept Res. 1975;7:445–459. [PubMed] [Google Scholar]
- 17.Shoemaker BA, Wang J, Wolynes PG. Structural correlations in protein folding funnels. Proc Nat Acad Sci USA. 1997;94:777–782. doi: 10.1073/pnas.94.3.777. [DOI] [PMC free article] [PubMed] [Google Scholar]
- 18.Nymeyer H, Garcia AE, Onuchic JN. Folding funnels and frustration in oN-lattice minimalist protein landscapes. Proc Nat Acad Sci USA. 1998;95:5921–5928. doi: 10.1073/pnas.95.11.5921. [DOI] [PMC free article] [PubMed] [Google Scholar]
- 19.Chavez LL, Onuchic JN, Clementi C. Quantifying the roughness on the free energy landscape: Entropic bottlenecks and protein folding rates. J Am Chem Soc. 2004;126:8426–8432. doi: 10.1021/ja049510+. [DOI] [PubMed] [Google Scholar]
- 20.Clementi C, Jennings PA, Onuchic JN. Prediction of folding mechanism for circular-permuted proteins. J Mol Biol. 2001;311:879–890. doi: 10.1006/jmbi.2001.4871. [DOI] [PubMed] [Google Scholar]
- 21.Clementi C, Nymeyer H, Onuchic JN. Topological and energetic factors: What determines the structural details of the transition state ensemble and ”en-route” intermediates for protein folding? An investigation for small globular proteins. J Mol Biol. 2000;298:937–953. doi: 10.1006/jmbi.2000.3693. [DOI] [PubMed] [Google Scholar]
- 22.Gosavi S, Chavez LL, Jennings PA, Onuchic JN. Topological frustration and the folding of interleukin-1 beta. J Mol Biol. 2006;357:986–996. doi: 10.1016/j.jmb.2005.11.074. [DOI] [PubMed] [Google Scholar]
- 23.Levy Y, Onuchic JN. Mechanisms of protein assembly: Lessons from minimalist models. Acc Chem Res. 2006;39:135–142. doi: 10.1021/ar040204a. [DOI] [PubMed] [Google Scholar]
- 24.Levy Y, Cho SS, Shen T, Onuchic JN, Wolynes PG. Symmetry and frustration in protein energy landscapes: A near degeneracy resolves the Rop dimer-folding mystery. Proc Nat Acad Sci USA. 2005;102:2373–2378. doi: 10.1073/pnas.0409572102. [DOI] [PMC free article] [PubMed] [Google Scholar]
- 25.Levy Y, Cho SS, Onuchic JN, Wolynes PG. A survey of flexible protein binding mechanisms and their transition states using native topology based energy landscapes. J Mol Biol. 2005;346:1121–1145. doi: 10.1016/j.jmb.2004.12.021. [DOI] [PubMed] [Google Scholar]
- 26.Yang SC, Cho SS, Levy Y, Cheung MS, Levine H, Wolynes PG, Onuchic JN. Domain swapping is a consequence of minimal frustration. Proc Nat Acad Sci USA. 2004;101:13786–13791. doi: 10.1073/pnas.0403724101. [DOI] [PMC free article] [PubMed] [Google Scholar]
- 27.Leopold PE, Montal M, Onuchic JN. Protein folding funnels - a kinetic approach to the sequence structure relationship. Proc Nat Acad Sci USA. 1992;18:8721–8725. doi: 10.1073/pnas.89.18.8721. [DOI] [PMC free article] [PubMed] [Google Scholar]
- 28.Bryngelson JD, Onuchic JN, Socci ND, Wolynes PG. Funnels, pathways, and the energy landscape of protein-folding - a synthesis. Proteins. 1995;21:167–195. doi: 10.1002/prot.340210302. [DOI] [PubMed] [Google Scholar]
- 29.Onuchic JN, Wolynes PG. Theory of protein folding. Curr Opin Struct Biol. 2004;14:70–75. doi: 10.1016/j.sbi.2004.01.009. [DOI] [PubMed] [Google Scholar]
- 30.Wolf-Watz M, Thai V, Henzler-Wildman K, Hadjipavou G, Eisenmesser EZ, Kern D. Linkage between dynamics and catlysis in thermophilic-mesophilic enzyme pair. Nat Struct Biol. 2004;11:945–949. doi: 10.1038/nsmb821. [DOI] [PubMed] [Google Scholar]
- 31.Sinev MA, Sineva EV, Ittah V, Haas E. Domain Closure in Adenylate Kinase. Biochemistry. 1996;35:6425–6437. doi: 10.1021/bi952687j. [DOI] [PubMed] [Google Scholar]
- 32.Atilgan AR, Durell SR, Jernigan RL, Demirel MC, Keskin O, Bahar I. Anisotropy of Fluctuation Dynamics of Proteins with an Elastic Network Model. Biophys J. 2001;80:505–515. doi: 10.1016/S0006-3495(01)76033-X. [DOI] [PMC free article] [PubMed] [Google Scholar]
- 33.Krishnamurthy H, Lou H, Kimple A, Vieille C, Cukier R. Associative mechanism for phosphoryl transfer: A molecular dynamics simulation of Escherichia coli adenylate kinase complexed with its substrates. Proteins: Struct Funct Bioinfo. 2005;58:88–100. doi: 10.1002/prot.20301. [DOI] [PubMed] [Google Scholar]
- 34.Sobolev V, Wade R, Vried G, Edelman M. Molecular docking using surface complementarity. Proteins: Struct Funct Genet. 1996;25:120–129. doi: 10.1002/(SICI)1097-0134(199605)25:1<120::AID-PROT10>3.0.CO;2-M. [DOI] [PubMed] [Google Scholar]
- 35.Temiz NA, Meirovitch E, Bahar I. Escheria coli Adenylate Kinase dynamics: comparison of elastic network model modes with mode-coupling 15N-NMR relaxation data. Proteins: Struct Funct Bioinfo. 2004;57:468–480. doi: 10.1002/prot.20226. [DOI] [PMC free article] [PubMed] [Google Scholar]
- 36.Fersht A. Structure and mechanism in protein science: A guide to enzyme catalysis and protein folding. W.H. Freeman and Company; 1999. [Google Scholar]
- 37.Bryngelson JD, Wolynes PG. Spin-glasses and the statistical mechanics of protein folding. Proc Nat Acad Sci USA. 1987;84:7524–7528. doi: 10.1073/pnas.84.21.7524. [DOI] [PMC free article] [PubMed] [Google Scholar]
- 38.Berendsen HJC, Postma JPM, VanGunsteren WF, Dinola A, Haak JR. Molecular-dynamics with coupling to an external bath. J Chem Phys. 1984;81:3684–3690. [Google Scholar]
- 39.Ferrenberg AM, Swendsen RH. New Monte Carlo technique for studying phase transitions. Phys Rev Letters. 1988;61:2635–2638. doi: 10.1103/PhysRevLett.61.2635. [DOI] [PubMed] [Google Scholar]
- 40.Ferrenberg AM, Swendsen RH. Optimized Monte-Carlo data analysis. Phys Rev Letters. 1989;63:1195–1198. doi: 10.1103/PhysRevLett.63.1195. [DOI] [PubMed] [Google Scholar]
- 41.McLachlan AD. Rapid comparison of protein structures. Acta Cryst A. 1982;38:871–873. [Google Scholar]
- 42.Mueller CW, Schlauderer GJ, Reinstein J, Schulz GE. Adenylate kinase motions during catalysis: An energetic counterweight balancing substrate binding. Structure. 1996;4:147–156. doi: 10.1016/s0969-2126(96)00018-4. [DOI] [PubMed] [Google Scholar]
- 43.Humphrey W, Dalke A, Schulten K. VMD - Visual Molecular Dynamics. J Molec Graphics. 1996;14:33–38. doi: 10.1016/0263-7855(96)00018-5. [DOI] [PubMed] [Google Scholar]
Associated Data
This section collects any data citations, data availability statements, or supplementary materials included in this article.