

Abstract
AIMS
To characterize the cytochrome P450 enzyme(s) responsible for the N-dealkylation of maraviroc in vitro, and predict the extent of clinical drug–drug interactions (DDIs).
METHODS
Human liver and recombinant CYP microsomes were used to identify the CYP enzyme responsible for maraviroc N-dealkylation. Studies comprised enzyme kinetics and evaluation of the effects of specific CYP inhibitors. In vitro data were then used as inputs for simulation of DDIs with ketoconazole, ritonavir, saquinavir and atazanvir, using the Simcyp™ population-based absorption, distribution, metabolism and elimination (ADME) simulator. Study designs for simulations mirrored those actually used in the clinic.
RESULTS
Maraviroc was metabolized to its N-dealkylated product via a single CYP enzyme characterized by a Km of 21 µM and Vmax of 0.45 pmol pmol−1 min−1 in human liver microsomes and was inhibited by ketoconazole (CYP3A4 inhibitor). In a panel of recombinant CYP enzymes, CYP3A4 was identified as the major CYP responsible for maraviroc metabolism. Using recombinant CYP3A4, N-dealkylation was characterized by a Km of 13 µM and a Vmax of 3 pmol pmol−1 CYP min−1. Simulations therefore focused on the effect of CYP3A4 inhibitors on maraviroc pharmacokinetics. The simulated median AUC ratios were in good agreement with observed clinical changes (within twofold in all cases), although, in general, there was a trend for overprediction in the magnitude of the DDI.
CONCLUSION
Maraviroc is a substrate for CYP3A4, and exposure will therefore be modulated by CYP3A4 inhibitors. Simcyp™ has successfully simulated the extent of clinical interactions with CYP3A4 inhibitors, further validating this software as a good predictor of CYP-based DDIs.
WHAT IS ALREADY KNOWN ABOUT THE SUBJECT
Maraviroc is known to undergo oxidative metabolism in vivo and is a substrate for cytochrome P450 (CYP).
Simcyp™ has recently become more widely used for the prediction of CYP-mediated drug–drug interactions (DDIs) using in vitro metabolism data.
WHAT THIS STUDY ADDS
Maraviroc has been identified as a CYP3A4 substrate and the kinetic constants characterized.
The predicted DDIs associated with maraviroc as a CYP3A4 substrate using Simcyp™ have been compared against the clinical data.
This study demonstrates the value of a reliable Simcyp™ model for prediction of DDIs.
Keywords: drug–drug interactions, in vitro metabolism, maraviroc, Simcyp™
Introduction
Maraviroc (Figure 1) is a CC chemokine receptor 5 (CCR5) antagonist for the treatment of human immunodeficiency virus (HIV) infection. It is potent, orally bioavailable and has been shown to be effective and well tolerated in preclinical,[1, 2] and clinical studies [3]. It is generally accepted that combination pharmacotherapy for the treatment of HIV infection is the best approach for viral load reduction and clinical success. HIV-infected patients are frequently prescribed highly active antiretroviral therapy regimens, which typically consist of at least three different drugs, from at least two different classes, and currently include nucleoside reverse transcriptase inhibitors, non-nucleoside reverse transcriptase inhibitors, protease inhibitors and the entry inhibitor enfuvirtide [4]. Many of these agents are known to modulate the activity of important drug-metabolizing enzymes and transporters, such as CYP3A4 and P-glycoprotein (P-gp). Patients with HIV also have a high prevalence of co-morbid conditions that may require other medications [5]. Therefore, examination of drug interactions is a requisite step in the development of new HIV drugs, to determine their suitability for introduction into existing treatment regimens and define dose adjustments if necessary. In order to assess potential for drug–drug interactions (DDIs), knowledge of clearance mechanisms, enzymes responsible for major metabolic pathways and modulating capabilities of enzyme activities is essential. Through understanding of these mechanisms the likelihood for a new chemical entity to be the victim of a DDI can be assessed, in addition to predicting any potential the drug itself may have for interfering with clearance mechanisms of other agents. In vitro data can guide the clinical strategies for complex pharmacotherapy programmes.
Figure 1.
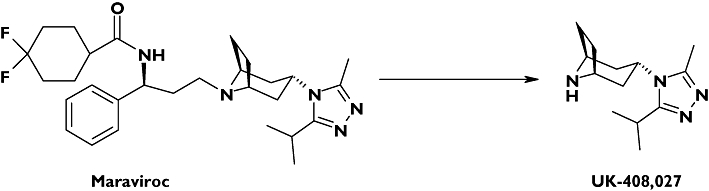
Structures of maraviroc and UK-408,027
The metabolite profile of maraviroc has been determined in male human volunteers [2, 6]. Parent compound was the major component present in human urine, faeces and plasma, accounting for 33% of excreted radioactivity and 42% of plasma radioactivity. Several oxidized metabolites were identified in excreta, with oxidative pathways accounting for 53% of the excreted radioactivity. The most abundant metabolite detected in human plasma was a secondary amine product of N-dealkylation (UK-408,027) accounting for 22% of plasma radioactivity.
By characterizing the enzymes responsible for metabolism in human liver microsomes (HLM), an in vitro assessment of maraviroc as the victim of potential DDIs can be made. This study also describes investigations into the inhibitory potency of maraviroc against cytochrome P450, the major drug-metabolizing enzyme system. Through a combination of victim and perpetrator in vitro DDI data, we have been able to model successfully the DDIs observed for maraviroc with several CYP3A4 inhibitors using Simcyp™, a population-based simulator of DDI. Having access to such a model then allows for prediction of other DDIs without the need for a clinical study.
Materials and methods
Drugs and chemicals
Maraviroc (UK-427,857) and authentic metabolite (UK-408,027) were synthesized at Pfizer Global Research and Development (Sandwich, UK). Furafylline, (S)-mephenytoin and (S)-4’-hydroxy mephenytoin were obtained from Salford Ultrafine Chemicals and Research Ltd (Manchester, UK). Specific CYP Supersomes™ and HLMs (prepared from a pool of 60 donors) were obtained from BD Biosciences (Bedford, MA, USA). All other reagents were of at least Analar grade quality, obtained from Sigma-Aldrich (Poole, UK).
Assays for maraviroc metabolism
Microsomal incubations (HLMs or recombinant CYPs) were performed under standard conditions. Each incubation (final volume 100 µl) comprised 50 mM phosphate buffer (pH 7.4) and 1 mM MgCl2. Reducing equivalents required for CYP metabolism were provided by nicotinamide adenine dinucleotide phosphate (NADPH) (1 mM), which was regenerated in situ by an isocitric acid/isocitric acid dehydrogenase system. The incubation mixture was preincubated at 37°C in the presence of substrate prior to addition of NADPH. Samples were analysed for either loss of substrate or formation of the N-dealkylated metabolite UK-408,027 using LC-MS/MS.
Analytical conditions
Samples were chromatographed on a chromolith monolithic C18 column (5 cm × 4.6 mm) with a mobile phase of A, methanol:water (10:90) containing 2 mM ammonium acetate and 0.27% formic acid, and B, methanol:water (90:10) containing 2 mM ammonium acetate and 0.27% formic acid, at a flow rate of 3 ml min−1 using a stepped elution (0–0.5 min 100% A, 0.5–1.0 min 100% A to 100% B, 1.0–1.49 min 100% B, 1.5 min 100% A, 1.5–2.2 min 100% A). Following chromatographic separation, the sample was split 50:1 using an Acutate™ splitter and delivered to a Sciex API3000 mass spectrometer. Analytes were measured in positive ion multiple reaction monitoring mode using the following transitions: maraviroc 514 > 389, UK-408,027 235 > 110, midazolam (IS) 326 > 291, UK-412,069 (IS) 325 > 200.
Maraviroc loss assay
At the end of the incubation the reaction was terminated either by the addition of 100 µl ice-cold acetonitrile or 2 ml ethyl acetate and 1 ml 0.2 M borate buffer pH 9. Midazolam was used as internal standard in the assay. Acetonitrile precipitated samples were centrifuged and supernatant analysed directly by LC-MS/MS. Ethyl acetate/borate extracted samples were rotary mixed, and the organic layer dried under vacuum. Samples were reconstituted in mobile phase (200 µl) and analysed directly by LC-MS/MS. The coefficient of variation (CV) was 14% for 1 µM maraviroc. The first-order rate constant (k) was calculated by plotting the natural log of maraviroc peak area ratio (maraviroc area/midazolam area) against incubation time, and determining the gradient of the initial disappearance rate. The rate of maraviroc disappearance was then expressed as µl pmol−1 CYP min−1.
Metabolite formation assay
At the end of the incubation the reaction was terminated by the addition of 500 µl ice-cold 0.2% acetic acid containing UK-412,069, an internal standard structurally related to UK-408,027. Samples were extracted using a 50-mg Certify 96-well block. Following elution in a acetonitrile:water (50:50) mix containing 5% ammonia, samples were centrifuged and the supernatant analysed directly by LC-MS/MS. The amount of UK-408,027 formed in the incubations was determined by interpolation from standard curves constructed in microsomal incubates from 1 to 500 ng UK-408,027 (CV was 5.7, 5.1 and 4.2% for concentrations of 5, 50 and 150 ng, with mean inaccuracies of 3.6, −5.8 and −2.4%, respectively). The rate of UK-408,027 formation was expressed as pmol UK-408,027 formed pmol−1 CYP min−1.
Maraviroc kinetics in human liver microsomes
The rate of formation of UK-408,027 was determined in HLMs. Initial studies were conducted to optimize the incubation time and protein concentration before the kinetic study, which was conducted over a maraviroc concentration range of 1–1000 µM. Rates of UK-408,027 formation were analysed to obtain values for Km and Vmax.
Chemical inhibition studies
The effect of various specific inhibitors of CYP enzymes on maraviroc metabolism was investigated in microsomes prepared from a pool of 60 human livers. The inhibitors (furafylline:CYP1A2, sulphaphenazole:CYP2C9, benzylnirvanol:CYP2C19, quinidine:CYP2D6, ketoconazole: CYP3A4) were chosen on the basis of selective inhibition of a particular CYP enzyme, and the concentrations used had been previously established to cause significant inhibition of that CYP [7]. For the mechanism-based inhibitor, furafylline, a 15-min preincubation period was used. For substrate loss experiments, inhibitors were co-incubated with maraviroc (1 µM) at 0.5 µM CYP for up to 60 min. For UK-408,027 formation studies, inhibitors were co-incubated with maraviroc (50 µM) at 0.1 mg ml−1 microsomal protein for 15 min. The effect of inhibitors on both maraviroc intrinsic clearance and UK-408,027 formation was measured.
Metabolism of maraviroc by expressed recombinant CYPs
Incubations were performed at 100 pmol recombinant CYP (rCYP) for up to 60 min with maraviroc at 1 µM (parent loss) and 50 µM (UK-408,027 formation) in Supersomes™ expressing individual CYP enzymes. Rates of maraviroc metabolism were expressed as intrinsic clearance or UK-408,027 formation, respectively. Kinetic characterization of UK-408,027 formation was performed in rCYP3A4 Supersomes™ after first establishing assay linearity with respect to time and CYP concentration. Incubations were performed across a maraviroc concentration range of 1–1000 µM.
Inhibition of CYP enzymes by maraviroc
The effect of maraviroc (up to 30 µM) on the metabolism of probe substrates for specific CYP enzymes was investigated in a pool of HLMs. Substrates used were 20 µM phenacetin (CYP1A2), 100 µM bupropion (CYP2B6), 9 µM rosiglitazone (CYP2C8), 18 µM diclofenac (CYP2C9), 37 µM (S)-mephenytoin (CYP2C19), 4 µM dextromethorphan (CYP2D6), 120 µM testosterone (CYP3A4), 3 µM midazolam (CYP3A4) and 20 µM felodipine (CYP3A4). Specific assays used were those previously described in the literature [8, 9]. Samples were preincubated in the presence and absence of maraviroc for 5 min at 37°C prior to the addition of NADPH.
Simcyp™ simulations
A clinical DDI programme was conducted for maraviroc, and the clinical data were used to validate predictions. The predicted effect of co-administration of the CYP3A4 inhibitors on maraviroc exposure was determined using Simcyp™. Simulations were carried out using the Simcyp™ population-based absorption, distribution, metabolism and elimination (ADME) simulator (version 7.01) using time-based and steady-state simulations. The time-based model accounts for time- and concentration-dependent enzyme inhibition using unbound plasma concentrations. The simulations in this mode were generated using the actual study design used in the clinical DDI studies, where both maraviroc and the inhibitor were dosed daily at the following doses. The effects of ketoconazole (400 mg qd), ritonavir (100 mg bid) or saquinavir (1200 mg tid) on the pharmacokinetics of maraviroc (100 mg bid) and the effect of atazanavir (400 mg qd) on maraviroc (300 mg bid), as dosed in the clinical studies [10], were simulated. Plasma concentration–time profiles were generated for both the substrate and the inhibitor in this mode. The simulations were repeated using a trial design where both maraviroc and the inhibitor were at steady-state concentration.
Input parameters for maraviroc and atazanavir [11, 12] are shown in Table 1. For maraviroc, CLint input was generated from the rCYP3A4 metabolism data with appropriate correction [13]. For inhibitors other than atazanavir, inputs were supplied by the program. In addition, inactivation parameters for the CYP3A mechanism-based inhibitor saquinavir were KI = 0.65 µM and kinact = 15.6 h−1[14]. The values of kdeg used for the degradation constants of hepatic and intestinal CYP3A were 0.05 h−1 and 0.03 h−1, respectively [15, 16]. The input parameters for the physicochemical properties, blood:plasma ratio and fraction unbound in plasma (fu(plasma)) for the maraviroc Simcyp™ model used data generated at Pfizer [2].
Table 1.
| Simcyp™ inputs for maraviroc | |
|---|---|
| Parameter | Value |
| Molecular weight | 513.7 |
| Log P | 2.4 |
| pKa (basic) | 7.3 |
| Blood/plasma ratio | 0.59 |
| fu (plasma) | 0.25 |
| Fa | 0.58 (100 mg); 0.83 (300 mg) |
| Ka (h−1) | 0.5 |
| Vss (l kg−1) | 2.5 |
| CLint (rhCYP3A4) (µl min−1 pmol−1) | 1.7 (0.34 after ISEF adjustment) |
| fu(mic) | 0.86 |
| CLR (l h−1) | 12 |
| Simcyp™ inputs for atazanavir | |
|---|---|
| Parameter | Value |
| Molecular weight | 704.9 |
| Log P | 2.12 |
| pKa | Neutral |
| Blood/plasma ratio | 0.75 |
| fu (plasma) | 0.14 |
| Fa | 1 |
| Ka (h−1) | 1.5 |
| Vss (l kg−1) | 1.2 |
| CL/F (l h−1) | 20 |
| CLR (l h−1) | 0.5 |
| CYP3A4 | |
| Ki (reversible) (µM) | 2.3 |
| KI (µM) | 1 |
| kinact (h−1) | 3.6 |
| fu(mic) | 1 |
ISEF, intersystem extrapolation factor.
A physiologically based pharmacokinetic model was used for maraviroc in Simcyp™. Tissue to plasma partition coefficient (Kp) values were estimated using mechanistic tissue composition equations developed by Poulin and co-workers [17] with LogP, LogD and fu(plasma) as input.
Data for absorption and renal clearance of unchanged drug at the dose levels used in the drug interaction studies were obtained from clinical studies and following administration of 14C-maraviroc [2, 6].
Microsomal binding of maraviroc
To determine microsomal binding, a HLM incubation was prepared as described above, omitting the addition of NADP+, and left at room temperature overnight. The following morning maraviroc was spiked into the mixture at a final concentration of 1 µM. Aliquots (3 × 400 µl) of the microsomal mixture containing maraviroc were added to an ultrafiltration plate (Millipore, Billerica, MA, USA; catalogue no. MAPPB1010). Nine aliquots (400 µl) of control microsomal incubation (without maraviroc) were also added to the ultrafiltration plate for construction of a calibration line and for matrix matching of samples prior to analysis. The ultrafiltration plate was centrifuged at 2000 g for 50 min at 37 °C. Filtrate (50 µl) was sampled from the bottom of the ultrafiltration plate into a 96-well block and a calibration line (10–1000 ng) spiked into control filtrate. An aliquot (50 µl) of the microsome mixture retained in the top of the plate was placed into a well of a 96-well block. All samples were matrix matched in the following way. To every filtrate sample, control microsome mixture retained in the top of the plate (50 µl) was added. To each sample of microsome mixture retained in the top of the plate, control filtrate (50 µl) was added. All samples were precipitated with acetonitrile (80 µl) containing internal standard. Samples were centrifuged [3000 rpm (1730 g) for 30 min] and analysed by LC/MS-MS. The concentration of maraviroc in the samples was interpolated from a standard curve of peak area ratio vs. spiked concentration. The fraction unbound in microsomes was calculated from
The recovery in the experiment was calculated from
 |
where mass (ng) = (concentration/1000) × volume (typical volumes are 50 µl filtrate and 350 µl retentate). Recoveries of 80–120% were considered acceptable.
Analysis of results
All results are presented as mean ± SD. Determination of apparent Km and Vmax values were obtained by Grafit (version 4). Statistical analysis was carried out using Microsoft Excel (version 5) using either a one-sided t-test or two-sided t-test for independent variables.
Results
Kinetics of maraviroc N-dealkylation in human liver microsomes
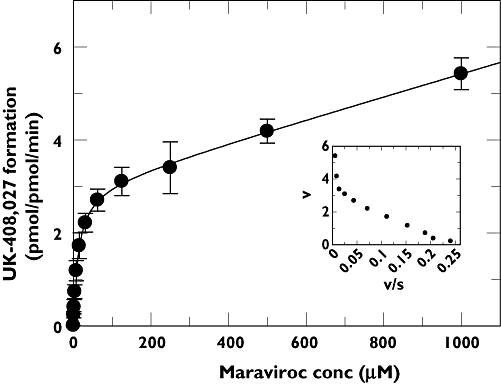
The rate of formation of UK-408,027 in HLMs was found to be linear with time up to 20 min and protein up to 0.5 mg ml−1. Enzyme kinetics were determined at a protein concentration of 0.1 mg ml−1 over 15 min. At this protein concentration, based upon available microsomal binding data, maraviroc is calculated to be 98% free, hence the apparent Km will be close to the real Km. The apparent kinetic constants were estimated using maraviroc concentrations up to 1000 µM. Analysis of samples incubated in the absence of NADPH and also with maraviroc spiked into unincubated samples revealed a concentration-dependent contaminant, which may have been a small amount of UK-408,027 present as an impurity. The apparent Michaelis–Menten kinetic parameters were therefore estimated incorporating a term for the impurity by fitting the data to the following equation:
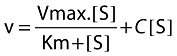 |
where v is the velocity of formation of UK-408,027, S is the concentration of maraviroc in the incubation mixture, C a constant representing the proportion of impurity, Km the Michaelis–Menten constant and Vmax maximum velocity. The curve fit is illustrated in Figure 2, and the calculated kinetic parameters were a Km of 21 µM and Vmax of 0.45 pmol pmol−1 CYP min−1. In one experiment the amount of impurity across the substrate concentration range was also determined, and rates of UK-408,027 formation corrected for this. Fitting these data to a standard Michaelis–Menten equation gave a similar Km and Vmax to fitting uncorrected data to the above equation (data not shown).
Figure 2.
Michaelis–Menten and Eadie–Hofstee (inset) plots for the conversion of maraviroc to UK-408,027 in human liver microsomes. The values are mean ± SD from seven determinations.
Inhibition of maraviroc metabolism in human liver microsomes
The effects of specific CYP inhibitors on maraviroc metabolism at 1 µM (substrate loss) and 50 µM (metabolite appearance) were investigated. The results of this investigation are summarized in Table 2.
Table 2.
Effect of specific CYP inhibitors on maraviroc metabolism in human liver microsomes
| Inhibitor (CYP) | Inhibition (% of control activity remaining) | |
|---|---|---|
| UK-408,027 formation | Maraviroc depletion | |
| 30 µM furafylline (CYP1A2) | 85.0 ± 15.8 | ND |
| 10 µM sulphaphenazole (CYP2C9) | 108.1 ± 27.7 | 99.1 ± 5.3 |
| 10 µM benzylnirvanol (CYP2C19) | 85.4 ± 47 | ND |
| 1 µM quinidine (CYP2D6) | 102.2 ± 20.2 | 100.3 ± 16.0 |
| 1 µM ketoconazole (CYP3A4) | 16.1 ± 5.7* | 17.3 ± 3.4* |
P < 0.00001 compared with control activity. ND, not determined. Maraviroc concentrations were 50 µM and 1 µM for UK-408,027 formation and substrate depletion, respectively. Values are mean ± SD of quadruplicate determinations. Uninhibited control activities: UK-408,027 formation, 75.9 pmol mg−1 min−1; maraviroc depletion, 0.106 µl pmol−1 min−1.
Maraviroc metabolism is clearly inhibited by ketoconazole, with <80% of control activity remaining. There was no significant effect on metabolic activity in the presence of any of the other CYP inhibitors. These data suggest that CYP3A4 is responsible for the metabolism of maraviroc.
Metabolism of maraviroc in expressed recombinant CYPs
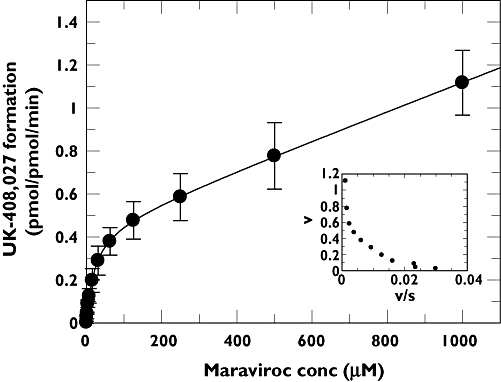
Maraviroc metabolism was investigated in Supersomes™ expressing recombinant CYP1A2, CYP2B6, CYP2C8, CYP2C9, CYP2C19, CYP2D6, CYP3A4 and CYP3A5 by substrate depletion and metabolite appearance at 1 µM and 50 µM maraviroc, respectively (Figure 3). Under the assay condition used for substrate depletion, the lower limit for accurately measuring a disappearance rate was set at 0.06 µl pmol−1 min−1, anything more stable than this being classified at <0.06 µl pmol−1 min−1. A one-sided t-test identified those incubations where maraviroc depletion rate was significantly different from 0.06 µl pmol−1 min−1. Only in incubations with rCYP3A4 was the rate of metabolism significantly greater than the assay cut-off. For recombinant CYP incubations measuring UK-408,027, data were compared with those in control Supersomes™, to identify UK-408,027 formation above the small amount of contaminant present in the substrate. CYP3A4 was again the major contributor to maraviroc formation, whereas for CYP2B6, a small, but statistically significant amount of UK-408,027 was also produced.
Figure 3.
Rate of maraviroc N-dealkylation (left axis, solid bars) and maraviroc intrinsic clearance (right axis, open bars) in a panel of rCYP Supersomes™. Maraviroc concentrations were 50 µM and 1 µM for metabolite formation and substrate depletion, respectively. Each value is mean ± SD, n = 4 (UK-408,027 formation, (▪); Maraviroc Clint, (□))
Kinetics of maraviroc N-dealkylation by rCYP3A4
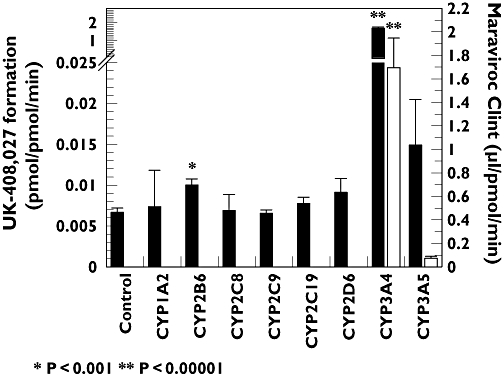
The rate of formation of UK-408,027 in rCYP3A4 Supersomes™ was linear with time up to 20 min and CYP content up to 50 pmol ml−1. Kinetic studies with rCYP3A4 were performed at 10 pmol ml−1 for 15 min over a substrate concentration range of 1–1000 µM. At this CYP concentration, based upon available microsomal binding data, maraviroc is calculated to be 98% free, hence the apparent Km will be close to the real Km. Data analysis indicated that the rCYP3A4-mediated N-dealkylation of maraviroc was characterized by a Km of 13 µM and a Vmax of 3 pmol pmol−1 CYP min−1 (Figure 4). This Km value is consistent with Km in HLMs.
Figure 4.
Michaelis–Menten and Eadie–Hofstee (inset) plots for the conversion of maraviroc to UK-408,027 in rCYP3A4 Supersomes™. The values are mean ± SD from four determinations
In vitro inhibition of CYP enzymes by maraviroc
Inhibition of CYP activity was investigated at concentrations up to 30 µM maraviroc. Over this concentration range maraviroc was a weak inhibitor, with IC50 values of >30 µM against all CYP probe substrates investigated. The greatest effect was observed against midazolam as a CYP3A4 probe, where 65% of midazolam 1-hydroxylase activity remained at 30 µM maraviroc (data not shown). The additional CYP3A4 probes testosterone and felodipine showed no more than 10% inhibition at 30 µM maraviroc (data not shown).
CLint estimates from HLM and rCYP
Substrate disappearance CLint values were used for the CLint input for maraviroc in the Simcyp™ model. These experiments were carried out at a substrate concentration of 1 µM, which was substantially below the Km for the major CYP3A4-mediated metabolite (21 and 13 µM in HLM and rCYP3A4, respectively).
The CLint for maraviroc in HLM was 0.106 µl min−1 pmol−1 of total CYP (Table 1), corresponding to a CLint of 35.0 µl min−1 mg−1 microsomal protein (HLM total CYP concentration = 330 pmol mg−1). The corresponding CLint in rCYP3A4 was 1.7 µl min−1 pmol−1 3A4 (Figure 3), which was corrected to 0.34 µl min−1 pmol−1 using an intersystem extrapolation factor [13] of 0.2 for CYP3A4. A CLint of 40.8 µl min−1 mg−1 was calculated (using the measured CYP3A4 content in the HLM batch of 120 pmol mg−1).
The free fraction in microsomes (fu(mic)) was measured at the protein concentration used in the in vitro assay (1.5 mg ml−1) and was 0.72 for HLM. For rCYP3A4, the incubations were carried out at an enzyme concentration of 100 pmol ml−1 (corresponding to a protein concentration of 0.63 mg ml−1), and a fu(mic) of 0.86 was calculated [18]. After adjustment for fu(mic), CLint HLM = 48.6 µl min−1 mg−1 and CLint rCYP3A4 = 47.4 µl min−1 mg−1 protein.
Clinical oral clearance values for maraviroc and comparison with Simcyp™ simulations
The clinical oral clearance (CL/F) values for maraviroc 100 mg bid in the placebo leg of DDI studies with ketoconazole, ritonavir and saquinavir were 161.6, 167.5 and 205.3 l h−1, respectively [10], whereas the corresponding prediction from Simcyp™ for maraviroc at this dose was 144.0 l h−1[90% confidence interval (CI) 44.2, 237.1). Likewise, the CL/F value for maraviroc 300 mg bid in the placebo leg of the atazanavir study was 107.5 l h−1[10], whereas the corresponding prediction from Simcyp™ was 102.3 l h−1 (90% CI 31.5, 178.6).
Clinical DDI values for maraviroc and comparison with Simcyp™ simulations
The results of simulations for the DDIs, expressed as Cmax and AUC ratios, are shown in Table 3. The simulated median values were in good agreement with mean clinical changes for increases in AUC for both steady-state and time-based (TB) simulations for the inhibitors (within twofold in all cases), although, in general, there was a trend to overprediction in the magnitude of the DDI by Simcyp™. In the case of the TB simulations, the maraviroc plasma concentration–time profiles were also simulated, and the mean Cmax increases in the presence of the inhibitors were in good agreement with the clinical data.
Table 3.
EffectsofinhibitorsonmaravirocCmax and AUC – comparison of clinical results and Simcyp™ simulations
| Maraviroc (mg) | Inhibitor | Inhibitor dose (mg) | Maraviroc Cmax increase (fold change) | Maraviroc AUC increase (fold change) | ||||
|---|---|---|---|---|---|---|---|---|
| Clinical | SimCYP | Clinical | SimCYP | |||||
| Mean | Mean | Mean | 90% CI | Median | 90% CI | |||
| 100 bid | Ketoconazole | 400 qd | 3.4 | 3.4 | 5.0 | (4.0, 6.3) | 4.6 TB | (2.7, 9.1) |
| 5.2 SS | (2.8, 10.6) | |||||||
| 100 bid | Ritonavir | 100 bid | 1.3 | 2.3 | 2.6 | (1.9, 3.6) | 2.6 TB | (1.9, 4.7) |
| 2.6 SS | (1.8, 4.6) | |||||||
| 300 bid | Atazanavir | 400 qd | 2.1 | 3.6 | 3.6 | (3.3, 3.9) | 5.0 TB | (2.4, 7.8) |
| 4.9 SS | (2.6, 9.6) | |||||||
| 100 bid | Saquinavir | 1200 tid | 3.3 | 4.1 | 4.3 | (3.5, 5.2) | 5.8 TB | (2.8, 12.0) |
| 3.5 SS | (2.0, 8.7) | |||||||
SS, steady state; TB, time based.
Discussion
The present study has investigated the major enzymes responsible for the metabolism of maraviroc and the potential for maraviroc to inhibit the major CYP enzymes. In addition, the in vitro data from HLMs and recombinant human CYP systems have been used to simulate the magnitude of clinically relevant DDIs for maraviroc.
Maraviroc is N-dealkylated by HLMs to UK-408,027, which is the most abundant circulating metabolite in man [2]. To identify the CYP enzymes responsible for maraviroc metabolism in human liver, experiments were first performed using HLM to understand the kinetics of UK-408,027 formation. The kinetic parameters were Km of 21 µM and Vmax of 0.45 pmol pmol−1 min−1. In HLMs the intrinsic clearance based upon UK-408,027 formation is approximately 20% of maraviroc intrinsic clearance calculated from substrate depletion experiments, a value consistent with data from the human radiolabel study, which shows multiple routes of metabolism [2].
Further studies to identify the individual CYP were performed at 1 µM maraviroc (substrate depletion) and 50 µM maraviroc (UK-408,027 formation), and employed a combination of chemical inhibition and metabolism by recombinant CYP enzymes. Of the specific inhibitors examined, ketoconazole (a potent/specific CYP3A4 inhibitor) strongly inhibited metabolism of maraviroc (>80% inhibition) and was the only statistically significant inhibitor. In experiments with recombinant human CYP enzymes, maraviroc was clearly metabolized by rCYP3A4 in terms of both substrate depletion and UK-408,027 formation. Compared with control incubations, formation of UK-408,027 was also statistically significant in rCYP2B6; however, the formation rate (0.1 pmol pmol−1 min−1) was 17-fold lower than that observed for rCYP3A4 (1.7 pmol pmol−1 min−1). Given the lower metabolic rate and the approximately 10-fold lower expression levels of CYP2B6 protein compared with CYP3A4 protein in human liver, it is anticipated that the contribution by CYP2B6 will be minimal [19]. In substrate loss experiments there was also a small amount of substrate depletion observed for CYP3A5, although not statistically significant (P > 0.05) compared with the experimental cut-off of 0.06 µl pmol−1 min−1. With the overlapping substrate specificities for CYP3A4 and CYP3A5, is not surprising that both enzymes have the ability to metabolize maraviroc [20]. However, intrinsic clearance for 3A5 is 25-fold lower than that of CYP3A4, indicating that it will have only a minor role in maraviroc clearance. Further kinetic experiments characterized the rCYP3A4-mediated formation of UK-408,027 by a Km of 13 µM and a Vmax of 3 pmol pmol−1 CYP min−1. Therefore, it is concluded that CYP3A4 is the only clinically relevant enzyme responsible for the metabolism of maraviroc in humans.
To investigate the potential inhibitory effects of maraviroc, IC50 values for the major human liver CYP enzymes were determined. The IC50 values of maraviroc for the metabolism of CYP1A2, CYP2B6, CYP2C8, CYP2C9, CYP2C19, CYP2D6 and CYP3A4 substrates were >30 µM, which is much higher than the clinical plasma concentration (300 mg bid, Cmax 1.7 µM [21]). These results indicate that maraviroc is not likely to inhibit significantly drug metabolism mediated by CYP enzymes. This conclusion is consistent with the clinical DDI study, which was designed to investigate the effect of maraviroc on a CYP3A4 substrate (midazolam), since this was the enzyme on which maraviroc had the greatest inhibitory effect (35% inhibition at 30 µM maraviroc). In that study, maraviroc at a dose of 300 mg maraviroc bid had only a minor influence on midazolam pharmacokinetics (geometric mean AUC ratio of midazolam + maraviroc compared with midazolam alone of 118%) [22].
The in vitro data indicate that in terms of CYP-based, clinically significant DDIs, maraviroc is unlikely to be the perpetrator of such an interaction; however, it may be a victim. From in vitro data the metabolic clearance of maraviroc is almost exclusively mediated via CYP3A4. Full kinetic characterization of the most abundant circulating metabolite has been performed; however, other oxidative metabolites are known to be formed in microsomal incubations. These metabolites are also observed in vivo[2]. From substrate depletion experiments using specific CYP inhibitors and in rCYP incubations, we have demonstrated that CYP3A4 is the major enzyme involved in the additional oxidative pathways. Also, the intrinsic clearance estimates based on HLM and rCYP3A4 are very similar, providing further evidence for CYP3A4 being the major enzyme involved in oxidative metabolism of maraviroc. Pharmacokinetics of maraviroc are therefore likely to be influenced by co-administration of CYP3A4 inhibitors. Simulations were therefore performed to look at the effect of co-administration of several CYP3A4 inhibitors (ketoconazole, ritonavir, atazanavir and saquinavir), and the output compared with the results of the clinical DDI programme. Ketoconazole strongly inhibited the metabolism of maraviroc in vitro, and this is the likely explanation for the increase in maraviroc AUC seen when ketoconazole is co-administered with maraviroc. Use of the reversible KI for ketoconazole captured the magnitude of the interaction with maraviroc, and this model has also been shown to simulate the well-characterized interaction between midazolam and ketoconazole [23].
Similarly, ritonavir, atazanavir and saquinavir are all CYP3A4 inhibitors of varying potency – all three compounds are also reported to be mechanism-based inhibitors of CYP3A4 [12, 14, 16], and ritonavir is also an inducer of CYP3A4 [24]. However, whereas atazanavir and saquinavir required use of KI and kinact (time-dependent inhibition parameters) in the model to capture the magnitude of the DDI with maraviroc, the ritonavir model used a reversible KI for CYP3A4. For both the saquinavir–midazolam [25] and ritonavir–midazolam (J. Unadkat, personal communication, June 2006) interactions, the magnitude of clinical DDIs with midazolam have been accurately simulated in Simcyp™ (data not shown) using the time-dependent inhibition (TDI) model for saquinavir and the reversible inhibition model for ritonavir. Whereas saquinavir and atazanavir are relatively weak reversible inhibitors of CYP3A4 (KI values of ∼2 µM), the ritonavir KI vs. CYP3A4 is two orders of magnitude lower and hence the model can capture the magnitude of the DDI using the reversible KI alone [26]. In contrast, both saquinavir and atazanavir are predicted to elicit an AUC change of 1.5× increase in maraviroc AUC using the reversible KI input, much lower than the values seen in the clinic (4.3× and 3.6× increases in maraviroc AUC, respectively) [10].
When TDI parameters vs. CYP3A4 for ritonavir (KI = 0.17 µM and kinact = 24 h−1[14]) were incorporated in the model, the midazolam AUC increase was overpredicted by 3.5-fold (data not shown). One possible reason for overprediction could be CYP3A4 induction, which is not accounted for in the model. However, this seems unlikely, as no induction of CYP3A4 by ritonavir (by monitoring 1'-OH midazolam/midazolam ratio) has been observed after long-term administration of the drug at 200 mg bid [27]. Furthermore, induction did not appear to contribute to the saquinavir–ritonavir interaction, where the ritonavir reversible KI model [28] has been shown to simulate accurately the clinical interaction [29] between saquinavir (as substrate) and ritonavir (inhibitor).
Maraviroc kinetics are supraproportional to dose up to 300 mg bid, which has been attributed to P-gp involvement in maraviroc disposition. The compound has been shown to be a moderate affinity substrate of P-gp, with a Km of 37 µM [2], and hence the transporter may be saturated with increasing dose levels. The clinical data support this theory, with near complete absorption of maraviroc at a dose of 300 mg [2], believed to be due to complete saturation of maraviroc efflux (thought to be mediated by P-gp). There is in vitro evidence to demonstrate that all the CYP3A4 inhibitors investigated here can inhibit P-gp activity [30–33]. Clinical DDIs with maraviroc could also be due in part to interactions with transporters. However, at clinically relevant doses of maraviroc P-gp is thought to be fully saturated. In addition, we have shown that the magnitude of the DDI is accurately simulated by the inhibition of CYP3A4-mediated clearance alone. It is therefore believed that interactions with CYP3A4 rather than P-gp are the major mechanism for the maraviroc AUC increase in the presence of these inhibitors.
We have demonstrated that maraviroc is predominantly metabolized by CYP3A4, and is not itself an inhibitor of CYP enzymes. The pharmacokinetics of maraviroc is predicted to be affected by modulators of CYP3A4, but maraviroc is not predicted to affect the metabolism of other compounds metabolized by CYP. We have built a model within Simcyp™ that simulates maraviroc pharmacokinetics and CYP-based interactions. The simulated maraviroc oral clearance values are in keeping with those observed in the clinic, as are the magnitude of DDIs for saquinavir, ketoconazole and atazanavir. For ritonavir, in vivo data were accurately simulated only when a competitive inhibition model (rather than time-dependent inhibition model) was used. Similar observations have been made by others, suggesting further refinement of the ritonavir model is required. The availability of a reliable Simcyp™ model, validated against clinical data, allows for prediction of other DDIs without the need for clinical studies.
REFERENCES
- 1.Dorr P, Westby M, Dobbs S, Griffin P, Irvine B, Macartney M, Mori J, Rickett G, Smith-Burchnell C, Napier C, Webster R, Armour D, Price D, Stammen B, Wood A, Maraviroc Perros M. (UK-427,857), a potent, orally bioavailable, and selective small-molecule inhibitor of chemokine receptor ccr5 with broad-spectrum anti-human immunodeficiency virus type 1 activity. Antimicrob Agents Chemother. 2005;49:4721–32. doi: 10.1128/AAC.49.11.4721-4732.2005. [DOI] [PMC free article] [PubMed] [Google Scholar]
- 2.Walker DK, Abel S, Comby P, Muirhead GJ, Nedderman AN, Smith DA. Species differences in the disposition of the CCR5 antagonist, UK-427,857, a new potential treatment for HIV. Drug Metab Dispos. 2005;33:587–95. doi: 10.1124/dmd.104.002626. [DOI] [PubMed] [Google Scholar]
- 3.Fatkenheuer G, Pozniak AL, Johnson MA, Plettenberg A, Staszewski S, Hoepelman AI, Saag MS, Goebel FD, Rockstroh JK, Dezube BJ, Jenkins TM, Medhurst C, Sullivan JF, Ridgway C, Abel S, James IT, Youle M, van der Ryst E. Efficacy of short-term monotherapy with maraviroc, a new CCR5 antagonist, in patients infected with HIV-1. Nat Med. 2005;11:1170–2. doi: 10.1038/nm1319. [DOI] [PubMed] [Google Scholar]
- 4.Yeni PG, Hammer SM, Hirsch MS, Saag MS, Schechter M, Carpenter CC, Fischl MA, Gatell JM, Gazzard BG, Jacobsen DM, Katzenstein DA, Montaner JS, Richman DD, Schooley RT, Thompson MA, Vella S, Volberding PA. Treatment for adult HIV infection: 2004 recommendations of the International AIDS Society-USA Panel. JAMA. 2004;292:251–65. doi: 10.1001/jama.292.2.251. [DOI] [PubMed] [Google Scholar]
- 5.Tseng AL, Foisy MM. Management of drug interactions in patients with HIV. Ann Pharmacother. 1997;31:1040–58. doi: 10.1177/106002809703100915. [DOI] [PubMed] [Google Scholar]
- 6.Abel S, Russell D, Whitlock LA, Ridgeway CE, Nedderman ANR, Walker DK. Assessment of the absorption, metabolism, and absolute bioavailability of maraviroc in healthy male subjects. Br J Clin Pharmacol. 2008;65(Suppl)(1):60–7. doi: 10.1111/j.1365-2125.2008.03137.x. [DOI] [PMC free article] [PubMed] [Google Scholar]
- 7.Hyland R, Roe EG, Jones BC, Smith DA. Identification of the cytochrome P450 enzymes involved in the N-demethylation of sildenafil. Br J Clin Pharmacol. 2001;51:239–48. doi: 10.1046/j.1365-2125.2001.00318.x. [DOI] [PMC free article] [PubMed] [Google Scholar]
- 8.Walsky RL, Obach RS. Validated assays for human cytochrome P450 activities. Drug Metab Dispos. 2004;32:647–60. doi: 10.1124/dmd.32.6.647. [DOI] [PubMed] [Google Scholar]
- 9.Walsky RL, Obach RS, Gaman EA, Gleeson JP, Proctor WR. Selective inhibition of human cytochrome P4502C8 by montelukast. Drug Metab Dispos. 2005;33:413–8. doi: 10.1124/dmd.104.002766. [DOI] [PubMed] [Google Scholar]
- 10.Abel S, Russell D, Taylor-Worth RJ, Ridgeway CE, Muirhead GJ. Effects of CYP3A4 inhibitors on the pharmacokinetics of maraviroc in healthy volunteers. Br J Clin Pharmacol. 2008;65(Suppl)(1):27–37. doi: 10.1111/j.1365-2125.2008.03133.x. [DOI] [PMC free article] [PubMed] [Google Scholar]
- 11.Goldsmith DR, Perry CM. Atazanavir. Drugs. 2003;63:1679–93. doi: 10.2165/00003495-200363160-00003. discussion 1694–5. [DOI] [PubMed] [Google Scholar]
- 12.Bristol-Myers Squibb C. Reyataz NDA 021567; FDA Approved Drug Products. [22 April 2008]. Available at http://www.accessdata.fda.gov/scripts/cder/drugsatfda/index.cfm.
- 13.Proctor NJ, Tucker GT, Rostami-Hodjegan A. Predicting drug clearance from recombinantly expressed CYPs: intersystem extrapolation factors. Xenobiotica. 2004;34:151–78. doi: 10.1080/00498250310001646353. [DOI] [PubMed] [Google Scholar]
- 14.Ernest CS, II, Hall SD, Jones DR. Mechanism-based inactivation of CYP3A by HIV protease inhibitors. J Pharmacol Exp Ther. 2005;312:583–91. doi: 10.1124/jpet.104.075416. [DOI] [PubMed] [Google Scholar]
- 15.Mayhew BS, Jones DR, Hall SD. An in vitro model for predicting in vivo inhibition of cytochrome P450 3A4 by metabolic intermediate complex formation. Drug Metab Dispos. 2000;28:1031–7. [PubMed] [Google Scholar]
- 16.Obach RS, Walsky RL, Venkatakrishnan K. Mechanism-based inactivation of human cytochrome p450 enzymes and the prediction of drug–drug interactions. Drug Metab Dispos. 2007;35:246–55. doi: 10.1124/dmd.106.012633. [DOI] [PubMed] [Google Scholar]
- 17.Poulin P, Theil FP. A priori prediction of tissue: plasma partition coefficients of drugs to facilitate the use of physiologically-based pharmacokinetic models in drug discovery. J Pharm Sci. 2000;89:16–35. doi: 10.1002/(SICI)1520-6017(200001)89:1<16::AID-JPS3>3.0.CO;2-E. [DOI] [PubMed] [Google Scholar]
- 18.Austin RP, Barton P, Cockroft SL, Wenlock MC, Riley RJ. The influence of nonspecific microsomal binding on apparent intrinsic clearance, and its prediction from physicochemical properties. Drug Metab Dispos. 2002;30:1497–503. doi: 10.1124/dmd.30.12.1497. [DOI] [PubMed] [Google Scholar]
- 19.Rostami-Hodjegan A, Tucker GT. Simulation and prediction of in vivo drug metabolism in human populations from in vitro data. Nat Rev Drug Discov. 2007;6:140–8. doi: 10.1038/nrd2173. [DOI] [PubMed] [Google Scholar]
- 20.Rendic S. Summary of information on human CYP enzymes: human P450 metabolism data. Drug Metab Rev. 2002;34:83–448. doi: 10.1081/dmr-120001392. [DOI] [PubMed] [Google Scholar]
- 21.Pfizer Inc. Selzentry NDA 022128; FDA Approved Drug Products. [22 April 2008]. Available at http://www.accessdata.fda.gov/scripts/cder/drugsatfda/index.cfm.
- 22.Abel S, Russell D, Whitlock LA, Ridgeway CE, Muirhead GJ. Effects of maraviroc on the pharmacokinetics of midazolam, lamivudine/zidovudine, and oral contraceptives in healthy volunteers. Br J Clin Pharmacol. 2008;65(Suppl)(1):19–26. doi: 10.1111/j.1365-2125.2008.03132.x. [DOI] [PMC free article] [PubMed] [Google Scholar]
- 23.Rowland-Yeo K, Jamei M, Yang J, Tucker GT, Rostami-Hodjegan A. Prediction of in vivo drug interactions from in vitro enzyme kinetic data: time based versus steady state simulations. [22 April 2008]. Available at http://www.simcyp.com/ResearchDevelopment/Publications/Posters/default.htm.
- 24.Hsu A, Granneman GR, Witt G, Locke C, Denissen J, Molla A, Valdes J, Smith J, Erdman K, Lyons N, Niu P, Decourt JP, Fourtillan JB, Girault J, Leonard JM. Multiple-dose pharmacokinetics of ritonavir in human immunodeficiency virus-infected subjects. Antimicrob Agents Chemother. 1997;41:898–905. doi: 10.1128/aac.41.5.898. [DOI] [PMC free article] [PubMed] [Google Scholar]
- 25.Palkama VJ, Ahonen J, Neuvonen PJ, Olkkola KT. Effect of saquinavir on the pharmacokinetics and pharmacodynamics of oral and intravenous midazolam. Clin Pharmacol Ther. 1999;66:33–9. doi: 10.1016/S0009-9236(99)70051-2. [DOI] [PubMed] [Google Scholar]
- 26.Einolf HJ. Comparison of different approaches to predict metabolic drug–drug interactions. Xenobiotica. 2007;37:1257–94. doi: 10.1080/00498250701620700. [DOI] [PubMed] [Google Scholar]
- 27.Fellay J, Marzolini C, Decosterd L, Golay KP, Baumann P, Buclin T, Telenti A, Eap CB. Variations of CYP3A activity induced by antiretroviral treatment in HIV-1 infected patients. Eur J Clin Pharmacol. 2005;60:865–73. doi: 10.1007/s00228-004-0855-8. [DOI] [PubMed] [Google Scholar]
- 28.Almond L, Rowland Yeo K, Howgate E, Tucker GT, Rostami-Hodjegan A. Mechanistic prediction of HIV drug–drug interactions in virtual populations from in vitro enzyme kinetic data: ritonavir and saquinavir. [22 April 2008]. Available at http://www.simcyp.com/ResearchDevelopment/Publications/Posters/default.htm.
- 29.Buss N, Snell P, Bock J, Hsu A, Jorga K. Saquinavir and ritonavir pharmacokinetics following combined ritonavir and saquinavir (soft gelatin capsules) administration. Br J Clin Pharmacol. 2001;52:255–64. doi: 10.1046/j.0306-5251.2001.01452.x. [DOI] [PMC free article] [PubMed] [Google Scholar]
- 30.Chinn LW, Gow JM, Tse MM, Becker SL, Kroetz DL. Interindividual variability in the effect of atazanavir and saquinavir on the expression of lymphocyte P-glycoprotein. J Antimicrob Chemother. 2007;60:61–7. doi: 10.1093/jac/dkm135. [DOI] [PubMed] [Google Scholar]
- 31.Huisman MT, Smit JW, Wiltshire HR, Hoetelmans RM, Beijnen JH, Schinkel AH. P-glycoprotein limits oral availability, brain, and fetal penetration of saquinavir even with high doses of ritonavir. Mol Pharmacol. 2001;59:806–13. doi: 10.1124/mol.59.4.806. [DOI] [PubMed] [Google Scholar]
- 32.Rautio J, Humphreys JE, Webster LO, Balakrishnan A, Keogh JP, Kunta JR, Serabjit-Singh CJ, Polli JW. In vitro p-glycoprotein inhibition assays for assessment of clinical drug interaction potential of new drug candidates: a recommendation for probe substrates. Drug Metab Dispos. 2006;34:786–92. doi: 10.1124/dmd.105.008615. [DOI] [PubMed] [Google Scholar]
- 33.Smalley J, Marino AM, Xin B, Olah T, Balimane PV. Development of a quantitative LC-MS/MS analytical method coupled with turbulent flow chromatography for digoxin for the in vitro P-gp inhibition assay. J Chromatogr B Analyt Technol Biomed Life Sci. 2007;854:260–7. doi: 10.1016/j.jchromb.2007.04.030. [DOI] [PubMed] [Google Scholar]