

Abstract
AIMS
To compare midazolam kinetics between plasma and saliva and to find out whether saliva is suitable for CYP3A phenotyping.
METHODS
This was a two way cross-over study in eight subjects treated with 2 mg midazolam IV or 7.5 mg orally under basal conditions and after CYP3A induction with rifampicin.
RESULTS
Under basal conditions and IV administration, midazolam and 1′-hydroxymidazolam (plasma, saliva), 4-hydroxymidazolam and 1′-hydroxymidazolam-glucuronide (plasma) were detectable. After rifampicin, the AUC of midazolam [mean differences plasma 53.7 (95% CI 4.6, 102.9) and saliva 0.83 (95% CI 0.52, 1.14) ng ml−1 h] and 1′-hydroxymidazolam [mean difference plasma 11.8 (95% CI 7.9, 15.7) ng ml−1 h] had decreased significantly. There was a significant correlation between the midazolam concentrations in plasma and saliva (basal conditions: r = 0.864, P < 0.0001; after rifampicin: r = 0.842, P < 0.0001). After oral administration and basal conditions, midazolam, 1′-hydroxymidazolam and 4-hydroxymidazolam were detectable in plasma and saliva. After treatment with rifampicin, the AUC of midazolam [mean difference plasma 104.5 (95% CI 74.1, 134.9) ng ml−1 h] and 1′-hydroxymidazolam [mean differences plasma 51.9 (95% CI 34.8, 69.1) and saliva 2.3 (95% CI 1.9, 2.7) ng ml−1 h] had decreased significantly. The parameters separating best between basal conditions and post-rifampicin were: (1′-hydroxymidazolam + 1′-hydroxymidazolam-glucuronide)/midazolam at 20–30 min (plasma) and the AUC of midazolam (saliva) after IV, and the AUC of midazolam (plasma) and of 1′-hydroxymidazolam (plasma and saliva) after oral administration.
CONCLUSIONS
Saliva appears to be a suitable matrix for non-invasive CYP3A phenotyping using midazolam as a probe drug, but sensitive analytical methods are required.
WHAT IS ALREADY KNOWN ABOUT THE SUBJECT
Midazolam is a frequently used probe drug for CYP3A phenotyping in plasma. Midazolam and its hydroxy-metabolites can be detected in saliva.
WHAT THIS STUDY ADDS
The concentrations of midazolam and its hydroxy-metabolites are much lower in saliva than in plasma, but the midazolam concentrations in both matrices show a significant linear correlation.
Saliva appears to be a suitable matrix for CYP3A phenotyping with midazolam, but very sensitive methods are required due to the low concentrations of midazolam and its hydroxy-metabolites.
Keywords: CYP3A, 1′-hydroxymidazolam, 4-hydroxymidazolam, LC-MS/MS, midazolam, phenotyping, saliva
Introduction
Midazolam (MDZ) is a short-acting benzodiazepine with hypnotic, anticonvulsant, muscle-relaxant and anxiolytic properties. In clinical practice, it is used for the induction of anesthesia, sedation and the treatment of generalized seizures or status epilepticus [1]. Furthermore, MDZ is a widely accepted probe drug for CYP3A phenotyping [2]. MDZ is rapidly metabolized by cytochrome P450 3A (CYP3A) to its primary, pharmacologically active metabolite 1′-hydroxymidazolam (1′-OHMDZ) and, to a smaller extent, to 4-hydroxymidazolam (4-OHMDZ) and 1,4-dihydroxymidazolam. These metabolites are conjugated and then excreted as glucuronides in the urine [3–5].
Oral fluid, consisting of saliva from the salivary glands and gingival cervical sulci, mucosal cells, bacteria and food debris, has been increasingly used as an alternative biological matrix for therapeutic drug monitoring, pharmacokinetic studies, and detection of illicit drugs [6–11]. Oral fluid testing has several advantages over more conventional biological matrices used for these purposes, such as blood or urine. Specimen collection is non-invasive and therefore less objectionable to patients, easy to perform without medical supervision and may represent a cost-effective approach for screening of large populations. Disadvantages include that people are sometimes unable to produce sufficient amounts of oral fluid for quantitative analysis and that substances tend to be detectable for shorter periods in oral fluid than in plasma [8].
The most common way of drug molecules to pass from blood to oral fluid is passive diffusion through lipid membranes, which is restricted to molecules that are lipophilic, uncharged, and not bound to plasma proteins [7, 8]. Therefore, the salivary drug concentration reflects only the free concentration of drugs in plasma. Active transport and ultrafiltration through pores in cell membranes are additional mechanisms for drugs and metabolites to reach oral fluid. Due to the extensive binding of benzodiazepines (MDZ 96%) to plasma proteins [1], their concentrations in oral fluid are generally very low compared with plasma. For this reason, highly sensitive analytical methods must be used for their detection and quantification [12].
CYP3A phenotyping with MDZ is based on the determination of MDZ clearance, necessitating serial blood sampling [13–15]. Although the more recently proposed single point methods in plasma are less invasive [16–19], non-invasive methods would be welcome, both for research and for routine use. If the kinetics of MDZ and its principal metabolites could be assessed in saliva, it might be possible to use saliva as a matrix for CYP3A phenotyping after oral or intravenous administration of MDZ. As shown recently in a single subject, using a sensitive LC-MS/MS method it appears to be possible to determine the kinetics of MDZ in saliva [12]. Based on these results, we decided to study the kinetics of MDZ in human subjects after IV or oral administration of the drug both under basal conditions and after CYP3A induction with rifampicin.
Methods
The clinical protocol was approved by the Ethics Committee of both Cantons of Basel. All subjects gave written informed consent before undergoing any study-related procedures.
Subjects
Ten healthy male volunteers (all non-smokers) were included in the study. The use of any drug, including over-the counter medication, as well as vitamins and dietary or herbal supplements known to affect CYP3A activity was prohibited at least 14 days before study start and for the entire duration of the study. Subjects had to abstain from grapefruit-containing foods or juices at least 1 week prior to the study, as well as during and between the study sessions. Subjects with clinically significant abnormalities on pre-study examination, known or suspected history of alcohol or drug abuse or known hypersensitivity to benzodiazepines or to rifampicin were excluded. Caffeine containing food and beverages, and alcohol (24 h before and during study visits) were not permitted.
Study design
This study used an open-label, randomized, two way cross-over design. In phase I, subjects were randomly assigned to receive either an oral dose of 7.5 mg midazolam (Dormicum® Hoffmann-LaRoche Ltd., Basel, Switzerland, sequence A, n = 4) with 200 ml of water in the morning or an IV infusion of 2 mg midazolam (sequence B, n = 4) to assess the pharmacokinetics of midazolam and two of its metabolites under baseline conditions (control). After the 24 h blood sample, subjects started to take 600 mg rifampicin (Rimactan®, 600 mg coated tablet, Medika AG, Aesch, Switzerland) once daily in the morning for 6 days to induce hepatic as well as intestinal CYP3A activity. One day after the last rifampicin dose, subjects received a second dose of 7.5 mg midazolam orally (sequence A) or 2 mg midazolam IV (sequence B) to assess the kinetics of MDZ and its metabolites after CYP3A induction. Phase I was followed by a wash out phase of at least 5 weeks. During this washout phase, subjects were probed weekly with oral MDZ (7.5 mg, n = 4 subjects) or with IV MDZ (2 mg, n = 4 subjects) to assess CYP3A induction. On day 43 phase II started: subjects assigned to sequence A received 2 mg midazolam IV and subjects assigned to sequence B received 7.5 mg midazolam orally and again the pharmacokinetics of midazolam and its metabolites were assessed before and 1 day after induction with rifampicin 600 mg orally once daily for 6 days. Rifampicin was provided in blister packages that were returned by the subjects for the assessment of compliance.
All subjects were asked to stay in supine position until the sedative effects of MDZ had resolved. Additionally, subjects were monitored with a pulse oximeter for 2 h after MDZ administration. Standardized meals were served 4 h and 8 h following drug administration. Subjects were permitted to drink water as desired.
Sampling
On each test day, after an overnight fast, an IV catheter was inserted into a forearm vein and blood samples were collected into heparinized tubes. For IV administration of MDZ, a second IV catheter was placed on the opposite forearm.
Blood samples (5.5 ml each) were taken before and at 10, 20, 30, 40, 60, 90, 120, 180, 240, 360, 480, 600 and 1440 min after MDZ administration. After IV midazolam administration, an additional blood sample was drawn at 5 min and the 180 min sample was skipped. For the assessment of CYP3A induction during the washout phase, blood samples were obtained before drug administration and after 30, 60, 90, 120 and 240 min. Oral fluid samples were collected by spitting into a polypropylene tube without pharmacological stimulation before and at 10, 30, 40, 60, 80, 100, 120, 150, 180, 240, 360 and 480 min after drug intake. An additional sample was drawn 20 min after IV midazolam administration. All blood and oral fluid samples were placed on ice and centrifuged within 30 min at 2500 g for 10 min at 5°C after collection. Plasma and saliva (after centrifugation of oral fluid, the supernatant was considered to be saliva) were then separated and stored at −70°C until analysis.
In order to test for MDZ contamination in the oral cavity, subjects were instructed to rinse their mouth carefully with 200 ml of water after having ingested oral MDZ and 200 ml of water. After having rinsed the mouth, a saliva sample was obtained as described above. These saliva samples were randomly analyzed for MDZ. MDZ was not detectable in any of these saliva samples, indicating that there was no carry over of orally administered MDZ into saliva.
Drug analysis
The concentrations of unconjugated MDZ, 1′-OHMDZ and 4-OHMDZ were determined in plasma and saliva by LC-MS/MS analysis as described previously [12]. In brief, 1 ml plasma or saliva were spiked with 10 µl internal standard (1.2 µg ml−1 solution of MDZ-d6, IS) and 1 ml 0.75 m glycine buffer (pH 9.2). Standards containing known amounts of MDZ and its metabolites were prepared similarly using the respective blank matrix. Liquid-liquid extraction was carried out by using n-hexane : dichlormethane (73 : 27, v : v). After centrifugation, the aqueous layer was frozen in a dry ice/acetone bath and the organic phase was transferred into a silanized glass tube. The organic fraction was evaporated to dryness under nitrogen and the remaining residue was reconstituted in 150 µl acetonitrile : water (23 : 77, v : v). 20 µl of the sample was injected into the LC-MS/MS system. Separation was performed at 40°C using a reversed-phase Luna C18 analytical column, 100 x 2.1 mm i.d., 3 µm (Phenomenex, Torrance, CA, USA) and gradient elution at a flow rate of 0.24 ml min−1. Detection was carried out using an LCQDecaion trap mass spectrometer (Thermo Fischer Scientific, Inc., Waltham, MA, USA) equipped with an electrospray ionisation (ESI) source operating in the positive ion mode (4 kV). For the quantification of MDZ and its metabolites the MS/MS product ion scan mode was chosen using a mass filter for the two must abundant product ions: MDZ, m/z 326.2→291.3, 244.2; 1′-OHMDZ, m/z 342.2→324.2, 203.2; 4-OHMDZ, 342.2→325.2, 234.2 and MDZ-d6, 332.3→297.4, 247.2. Intra- and interday coefficients of variation (CV) were determined at three different concentrations by analyzing six replicates of each quality control concentration (0.6, 3.7 and 15 ng ml−1for plasma and 0.3, 3.7 and 15 ng × ml−1 for saliva). The corresponding CV ranged from 1.2 to 7.3% for MDZ, from 1.3 to 7.4% for 1′-OHMDZ and from 2.6 to 7.6% for 4-OHMDZ, respectively, in plasma and saliva. The limit of quantification (LOQ) was determined based on the criteria that 1) the signal to noise ratio at the LOQ is at least 5 and that 2) the analyte response at LOQ can be determined with a CV of ≤20% and an accuracy of 80–120% (n = 6). For MDZ and both metabolites the LOQs were 0.05 ng ml−1 in both biological matrices with accuracies between 102.1 and 106.4% and CV between 5.4 and 10.4%. The accuracy for all compounds was between 92.1 and 102.3% in plasma and between 96.6 and 108.0% in saliva. Linear calibration curves were obtained between 0.05 to 20 ng ml−1 for midazolam and the hydroxy-metabolites in plasma and saliva (r2 > 0.998). Plasma samples with high concentrations of MDZ and metabolites were diluted up to 10-fold with drug free human plasma in order to reach the calibration range. No interference from rifampicin was noted during the analysis.
For the determination of total 1′-OHMDZ in plasma (conjugated and unconjugated) the same analytical method was used after treatment of the sample with β-glucuronidase. To 1 ml of plasma, 1 ml 0.2 m ammonium acetate buffer (pH 4.7) and 40 µl of a solution containing 20 000 U ml−1 of β-glucuronidase from Helix pomatia (G7770, Sigma, Buchs, Switzerland) were added and the mixture was incubated at 37°C. After 20 h, the reaction was stopped by adding 50 µl of aqueous ammonia (8%). IS (10 µl) and 1 ml 0.75 m glycine buffer (pH 9.2) were added and the sample was then further processed in the same manner as described above. Calibration curves, ranging from 0.05–20 ng ml−1 for all three analytes, were constructed in drug-free plasma under the same conditions. 1′-OHMDZ glucuronide concentration was determined by subtracting unconjugated 1′-OHMDZ concentrations from those obtained after treatment with β-glucuronidase. 4-OHMDZ was found to be unstable under hydrolytic conditions, with a later eluting degradation product of this metabolite (specific precursor ion m/z 343.2 and product ion m/z 315.5) being apparent in the chromatograms. [12, 20] Therefore, 4-OHMDZ glucuronide concentrations were not determined.
Plasma and saliva samples were prepared and measured once. Each subject's samples for assessing the concentration of MDZ and its metabolites at baseline and after induction of CYP3A4 were analyzed on the same day for the intravenous as well as for the oral MDZ administration.
Pharmacokinetic analysis
Plasma and saliva MDZ, 1′-OHMDZ and 4-OHMDZ data were analyzed using either non-compartmental or compartmental methods (WinNonlin, version 5.01, Pharsight Corp., Mountain View, CA, USA), depending on the model fitting the concentration vs. time data the best. The area under the drug concentration–time curves (AUC(0, ∞)) were calculated using the trapezoidal rule with extrapolation to infinity. The elimination rate constant (λz) was calculated by log-linear regression analysis after semi-logarithmic transformation of the data. The elimination half-life (t1/2) was calculated as follows:
 |
(1) |
Systemic clearances (CLiv) after IV MDZ administration were calculated as follows:
 |
(2) |
The apparent oral clearances (CL/F) were calculated as the ratio of dose administered over AUCpo. Bioavailability (Foral) was calculated as follows:
 |
(3) |
The maximum drug concentration in plasma or saliva (Cmax) and time to reach these peak concentrations (tmax) were obtained directly from the concentration–time data. The volume of distribution (Vd) was calculated as follows:
 |
(4) |
Statistics
Results are expressed as median and range. Statistical analysis was performed using the SPSS software package for Windows, version 15.0 (SPSS, Chicago, IL, USA). The nonparametric Wilcoxon signed rank test for paired data was used to analyse changes in the pharmacokinetic parameters before (baseline conditions, control) and after rifampicin administration (CYP3A induction) in both biological matrices. For relevant endpoints mean difference and corresponding 95% confidence intervals (CI) of the difference were calculated. A two-tailed P value less than 0.05 was considered to be statistically significant. Linear regression analysis was performed using least squares fitting to assess the relation between the concentrations of MDZ or 1′-OHMDZ in plasma and saliva.
Results
Ten male subjects were enrolled in the study. Eight subjects completed the study, one subject withdrew during the second induction phase (phase II) because of adverse reactions to rifampicin (headache, flu-like symptoms, abdominal pain and diarrhoea) and one subject discontinued the treatment for personal reasons unrelated to the study medication. The data of the excluded subjects were not used for analysis. Mean ± standard deviation (SD) age was 27.7 ± 9.6 years (range: 21–46 syears) and a mean weight 70 ± 6 kg (range: 60–78 kg). As expected, most subjects experienced light sedation after the administration of midazolam. No other adverse events were detected.
After IV administration of 2 mg MDZ, MDZ, 1′-OHMDZ and 4-OHMDZ could be detected in plasma and the kinetics of MDZ and its metabolites could be assessed. MDZ was rapidly hydroxylated, maximal concentrations of 1′-OHMDZ and 4-OHMDZ were reached after 22 and 42 min, respectively (Figure 1 and Table 1). The half-lives of the two hydroxy-metabolites were similar to MDZ, indicating rapid glucuronidation of the metabolites. MDZ and 1′-OHMDZ could also be detected in saliva, whereas the concentration of 4-OHMDZ was too low for reliable quantification. There was a significant linear correlation between the MDZ concentrations obtained in plasma and in saliva, both under basal conditions (r = 0.864, P < 0.0001) and after induction with rifampicin (r = 0.842, P < 0.0001, Figure 2). As expected from the extensive protein-binding of MDZ [21], the concentrations of MDZ were much lower in saliva than in plasma (Figure 1). For the same reason, Vd and clearance of MDZ in saliva were much higher compared with the values obtained in plasma, whereas the elimination half-life was lower (Table 1). The kinetics of 1′-OHMDZ could also be assessed in saliva (Figure 1). Compared with plasma, the maximal concentrations in saliva appeared clearly later (22 vs. 52 min). While the concentrations of 1′-OHMDZ were also lower in saliva than in plasma, the difference was not as large as for MDZ, compatible with lower binding to serum proteins [21].
Figure 1.
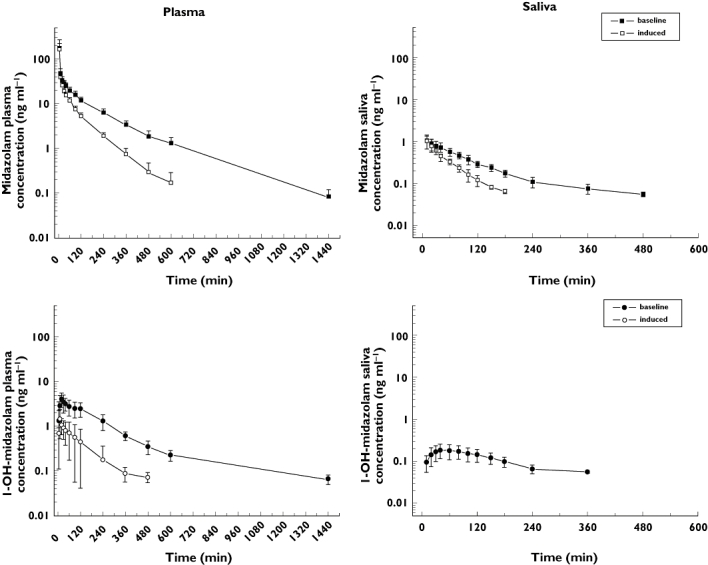
Kinetics of MDZ and 1 ′-OHMDZ in plasma (left panel) and saliva (right panel) after IV administration of 2 mg MDZ in eight healthy volunteers. CYP3A induction by rifampicin is associated with a decrease in the concentrations of MDZ (plasma and saliva) and 1′-OHMDZ (plasma). The data are presented as mean ± SD. The results of the kinetic calculations are presented in Table 1
Table 1.
Pharmacokinetic parameters of midazolam and its metabolites after intravenous administration of 2 mg midazolam before (control) and after treatment with rifampicin in eight healthy subjects
| Plasma | Saliva | |||
|---|---|---|---|---|
| Control | Rifampicin | Control | Rifampicin | |
| Midazolam | ||||
| Vd (l) | 3.53 (0.35–26.97) | 2.6 (1.2–16.8) | 1918 (943–2963) | 1793 (836–2146) |
| Vd/kg (l kg−1) | 0.05 (0.01–0.39) | 0.04 (0.02–0.23) | 28.2 (15.7–43.6) | 26.2 (13.9–29.0) |
| AUC(0, ∞) (ng ml−1 h) | 125.8 (83.7–268.7) | 82.4 (58.5–101.9)** | 1.7 (1.4–2.4) | 0.96 (0.77–1.37)** |
| t1/2 (h) | 2.9 (1.8–3.4) | 1.4 (1.1–1.8)** | 1.3 (0.7–1.6) | 0.58 (0.40–0.73)** |
| CL (l h−1) | 15.9 (7.4–23.9) | 24.4 (19.6–34.2)* | 1185 (841–1448) | 2081 (1457–2590)** |
| Cmax (ng ml−1) | 151 (89–388) | 167 (83–253) | 1.05 (0.67–2.12) | 1.12 (0.93–2.39) |
| 1′-hydroxymidazolam | ||||
| AUC(0, ∞) (ng ml−1 h) | 14.7 (8.9–21.6) | 2.0 (1.4–6.4)** | 0.68 (0.45–1.12) | na† |
| t1/2 (h) | 2.2 (1.8–4.2) | 1.4 (1.2–2.7)* | 2.1 (1.7–3.5) | na |
| Cmax (ng ml−1) | 3.5 (1.7–6.5) | 1.3 (0.59–3.54)** | 0.18 (0.11–0.31) | na |
| tmax (min) | 22.0 (20.0–47.0) | 10.5 (10.0–61.0) | 52.0 (35.0–80.0) | na |
| 4-hydroxymidazolam | ||||
| AUC(0, ∞) (ng ml−1 h) | 1.9 (1.5–2.5) | na | na | na |
| t1/2 (h) | 2.9 (2.7–3.6) | na | na | na |
| Cmax (ng ml−1) | 0.39 (0.26–0.52) | na | na | na |
| tmax (min) | 44.4 (28.05–61.30) | na | na | na |
Data are presented as median and range. Vd, volume of distribution; AUC(0, ∞), area under the concentration–time curve extrapolated to infinity; t1/2, elimination half-life; CL, clearance; Cmax, maximum plasma or saliva concentration; tmax, time to maximum plasma or saliva concentration.
P < 0.05 rifampicin vs. control in the same matrix.
P = 0.012 rifampicin vs. control in the same matrix.
na, not assessable.
Figure 2.
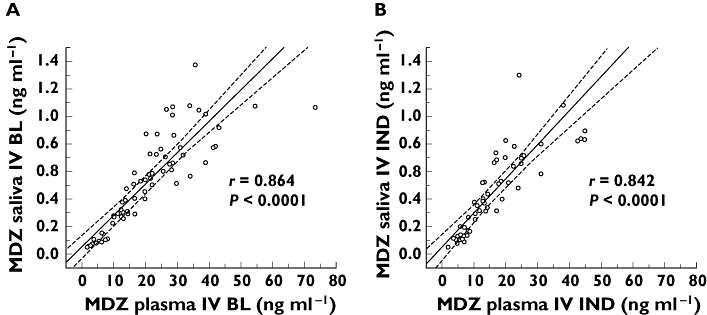
Correlation between MDZ concentrations in plasma and saliva. Single values and the 95% confidence interval are shown. After IV administration of 2 mg MDZ, there is a linear correlation between the MDZ concentrations determined in plasma and saliva both under basal conditions (left panel, r = 0.864) and after treatment with rifampicin (right panel, r = 0.842)
After induction of CYP3A by rifampicin, the AUC and the half-life of MDZ in plasma dropped significantly [mean difference for AUC 53.7 ng ml−1 h (95% CI 4.6, 102.9), P = 0.012, mean difference for half-life 1.2 h (95% CI 0.7, 1.7)], whereas the clearance increased [mean difference 8.9 l h−1 (95% CI 4.2, 13.7), P < 0.05, Figure 1, Table 1]. Unexpectedly, AUC and half-life dropped also for 1′-OHMDZ, whereas 4-OHMDZ could not be quantified reliably. In saliva, only MDZ could be quantified, but not 1′-OHMDZ or 4-OHMDZ. Similar to plasma, AUC and half-life of MDZ dropped significantly [mean difference AUC 0.83 ng ml−1 h (95% CI 0.52, 1.14), mean difference half-life 0.62 h (95% CI 0.38, 0.85), P = 0.012], whereas the clearance of MDZ increased.
In order to find the reason for the unexpected drop of the 1′-OHMDZ concentrations in plasma and in saliva after induction with rifampicin, 1′-OHMDZ-glucuronide was analyzed in both matrices. As shown in an individual subject, the reason for the fall of the plasma concentration of 1′-OHMDZ was the rapid conversion into the corresponding glucuronide (Figure 3). Accordingly, 20 and 30 min after IV administration of MDZ, the 1′-OHMDZ-glucuronide plasma concentrations were approximately doubled in subjects treated with rifampicin compared with basal conditions (Table 2). In contrast to plasma, 1′-OHMDZ-glucuronide could not be detected in saliva (data not shown).
Figure 3.
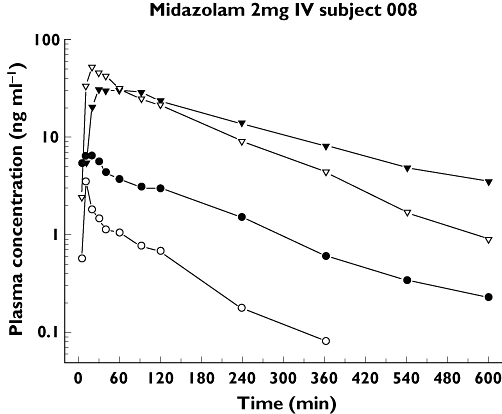
Plasma concentrations of 1′-OHMDZ and 1′-OHMDZ-glucuronide under basal conditions and after treatment with rifampicin in one subject. Surprisingly, CYP3A induction by rifampicin is associated with a decrease in the plasma concentrations of 1′-OHMDZ. The explanation for this finding is an increase in the plasma concentrations of 1′OHMDZ-glucuronide. The 1′-OHMDZ concentrations at 20 and 30 min are presented in Table 2. 1′-OH MDZ baseline, (•); 1′OH MDZ-glucuronide baseline, (▾); 1′-OH MDZ induced, (○); 1′-OH MDZ-glucuronide induced, (▿)
Table 2.
Plasma concentrations of midazolam (MDZ), 1′-hydroxymidazolam (1′-OHMDZ), 1′-hydroxymidazolam-glucuronide (1′-OHMDZ-gluc) and 1′-OHMDZ + 1′-OHMDZ-gluc (1′-OHMDZtotal) after IV administration of 2 mg midazolam before (control) and after pre-treatment with rifampicin in eight healthy subjects
| 20 min | 30 min | |||
|---|---|---|---|---|
| Control | Rifampicin | Control | Rifampicin | |
| MDZ (ng ml−1) | 32.4 (22.2–43.1) | 24.8 (19.8–31.1) | 29.2 (20.2–34.1) | 19.2 (13.2–23.9)* |
| 1′-OHMDZ (ng ml−1) | 3.52 (2.06–6.46) | 0.99 (0.59–1.81)* | 3.10 (1.47–5.54) | 0.73 (0.53–1.58)* |
| 1′-OHMDZ-gluc (ng ml−1) | 18.0 (11.9–25.2) | 40.9 (29.3–61.6)* | 22.7 (16.4–38.1) | 40.5 (31.0–55.7)* |
| 1′-OHMDZtotal (ng ml−1) | 20.9 (15.2–30.5) | 41.8 (30.0–62.6)* | 21.5 (16.4–38.1) | 39.6 (31.0–55.7)* |
| 1′-OHMDZ : MDZ | 0.136 (0.074–0.150) | 0.040 (0.024–0.073)* | 0.104 (0.069–0.169) | 0.040 (0.031–0.093)* |
| 1′-OHMDZ-gluc : MDZ | 0.497 (0.305–0.920) | 1.56 (0.94–2.55)* | 0.733 (0.446–1.16) | 2.39 (1.27–2.87)* |
| 1′-OHMDZtotal : MDZ | 0.627 (0.391–1.07) | 1.52 (0.968–2.59)* | 0.840 (0.551–1.33) | 2.34 (1.30–2.91)* |
P < 0.008 rifampicin vs. control at the same time point.
Good markers of induction with rifampicin (no overlap of the basal values with the values obtained after treatment with rifampicin) after IV administration of MDZ were in plasma the drop in the AUC of 1′-OHMDZ, the drop in the 1′-OHMDZ concentration (20 min), the increase in the 1′-OHMDZ-glucuronide concentration (20 min), the drop in the ratio 1′-OHMDZ : MDZ (20 min) and the increases in the ratios 1′-OHMDZ-glucuronide : MDZ and 1′-OHMDZtotal : MDZ (20 and 30 min) (Tables 1 and 2). Interestingly, while the AUC of MDZ in plasma showed some overlap between basal conditions and after treatment with rifampicin, there was no overlap of this ratio in saliva (Figure 4).
Figure 4.
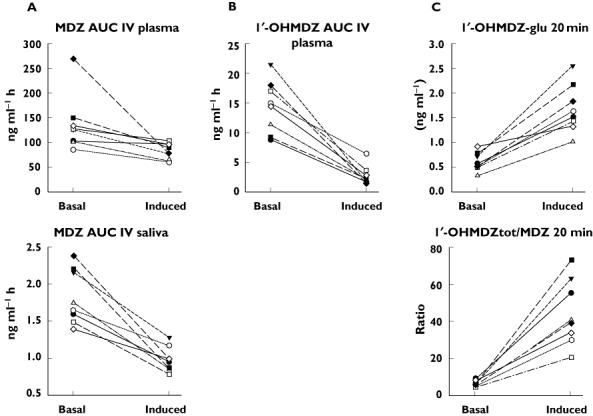
Markers of CYP3A induction after IV administration of MDZ. A) The AUC of MDZ under basal conditions and after treatment with rifampicin partially overlap in plasma, but not in saliva. B) The AUC of 1′-OHMDZ separates well between basal conditions and CYP3A induction in plasma, but could not be determined in saliva after treatment with rifampicin. C) A good separation between basal conditions and CYP3A induction in plasma was also obtained by the concentration of 1′OHMDZ-glucuronide or the ratio (1′OHMDZ + 1′-OHMDZ-glucuronide) : MDZ 20 or 30 min after administration of MDZ. (1′OHMDZ + 1′OHMDZ-glucuronide) = 1′OHMDZtot
During the washout phase, the decrease in CYP3A induction was assessed to ascertain that the probands had reached basal conditions before starting phase II of the study. After stopping the treatment with rifampicin, it lasted 3 weeks until the AUC(0,4 h) (oral and IV administration of MDZ) had reached the values before ingestion of rifampicin in every subject (data not shown).
After oral ingestion of 7.5 mg MDZ, MDZ and its hydroxy-metabolites could be detected in plasma and in saliva (Figure 5) and the respective kinetics could be assessed (Table 3). Similar to IV administration, there was a significant linear correlation between MDZ plasma and saliva concentrations (r = 0.913, P > 0.0001; data not shown). Under basal conditions, the bioavailability calculated from the plasma data was in the range of 20%, whereas the half-life was 3.2 h, a value close to that obtained after IV administration. The ratios between the AUC of 1′-OHMDZ or 4-OHMDZ to MDZ were much higher after oral compared with IV administration of MDZ, most probably reflecting intestinal metabolism of MDZ. Accordingly, the concentrations of 1′-OHMDZ and 4-OHMDZ were higher in saliva after oral compared with IV administration, whereas the MDZ concentrations in saliva were comparable with the values after IV administration. After administration of rifampicin, the AUC of MDZ in plasma decreased dramatically compared with basal conditions [mean difference 104.5 ng ml−1 h (95% CI 74.1, 134.9), P = 0.012, Figure 5]. Similar to IV administration of MDZ, the concentrations of 1′-OHMDZ and 4-OHMDZ in plasma were lower after rifampicin compared with basal conditions. Accordingly, in saliva, MDZ and 4-OHMDZ could not be detected after treatment with rifampicin, whereas the concentration of 1′-OHMDZ was lower compared with basal conditions.
Figure 5.
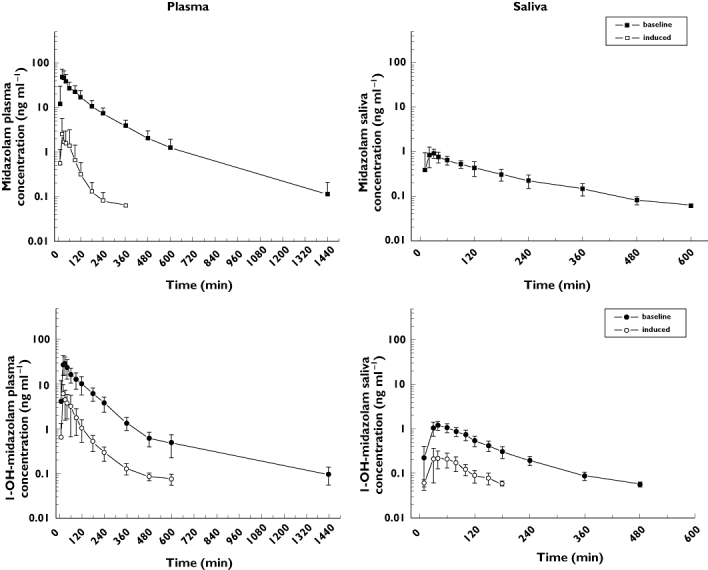
Kinetics of MDZ and 1′-OH-MDZ in plasma (left panel) and saliva (right panel) after oral administration of 7.5 mg MDZ in eight healthy volunteers. Similar to IV administration, CYP3A induction is associated with a decrease in the plasma concentrations of MDZ (plasma) and 1′-OHMDZ (plasma and saliva). In saliva, MDZ cannot be detected after CYP3A induction. The data are presented as mean ± SD. The results of the kinetic calculations are presented in Table 1
Table 3.
Pharmacokinetic parameters of midazolam and its metabolites after oral administration of 7.5 mg midazolam before (control) and after pre-treatment with oral rifampicin to eight healthy subjects
| Plasma | Saliva | |||
|---|---|---|---|---|
| Control | Rifampicin | Control | Rifampicin | |
| Midazolam | ||||
| AUC(0, ∞) (ng ml−1 h) | 102.9 (64.0–163.7) | 1.6 (1.0–7.2)** | 2.5 (1.1–3.3)§ | na† |
| t1/2 (h) | 3.2 (2.1–4.8) | 1.8 (0.98–8.21) | 6.9 (1.3–13.4) | na |
| Cmax (ng ml−1) | 63.1 (25.9–80.2) | 2.2 (0.64–10.4)** | 0.94 (0.61–1.58) | na |
| tmax (min) | 20.6 (12.9–72.4) | 29.9 (13.2–39.6) | 39.2 (12.7–86.8) | na |
| F | 0.19 (0.15–0.33) | 0.005 (0.004–0.02) | na | na |
| 1′-hydroxymidazolam | ||||
| AUC(0, ∞) (ng ml−1 h) | 56.6 (30.7–91.9) | 5.4 (3.9–13.1)** | 2.8 (1.9–3.2) | 0.44 (0.31–0.62)** |
| t1/2 (h) | 5.8 (1.8–21.8) | 3.2 (1.8–6.3) | 1.6 (1.2–2.0) | 0.91 (0.55–1.26)* |
| Cmax (ng ml−1) | 36.9 (15.0–52.6) | 4.4 (2.0–11.7)** | 1.3 (0.75–1.65) | 0.21 (0.14–0.58)** |
| tmax (min) | 24.5 (13.7–70.1) | 31.2 (18.2–39.4) | 43.5 (30.0–80.0) | 43.5 (32.0–80.0) |
| 4-hydroxymidazolam | ||||
| AUC(0, ∞) (ng ml−1 h) | 6.3 (5.4–9.8) | na | 0.37 (0.29–0.70) | na |
| t1/2 (h) | 1.8 (1.4–2.0) | na | 2.3 (1.5–3.3) | na |
| Cmax (ng ml−1) | 3.1 (1.5–3.9) | na | 0.10 (0.09–0.12) | na |
| tmax (min) | 31.5 (20.0–93.0) | na | 61.0 (42.0–100.0) | na |
Data are presented as median and range. Vd, volume of distribution; AUC(0, ∞), area under the concentration–time curve extrapolated to infinity; t1/2, elimination half-life; CL, clearance; Cmax, maximum plasma or saliva concentration; tmax, time to maximum plasma or saliva concentration.
P < 0.05 rifampicin vs. control in the same matrix.
P = 0.012 rifampicin vs. control in the same matrix.
na, not assessable.
Good markers of induction with rifampicin (no overlap of the basal values with the values obtained after treatment with rifampicin) after oral administration of MDZ were the drop in AUC and Cmax of MDZ and the drop in the AUC of 1′-OHMDZ in plasma as well as the drop in AUC and Cmax of 1′-OHMDZ in saliva (Figure 6).
Figure 6.
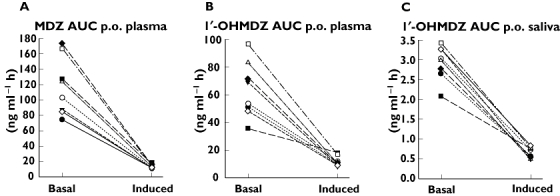
Markers of CYP3A induction after oral administration of MDZ. In plasma, the drop in the AUC of MDZ (A) and in the AUC of 1′-OHMDZ (B) separate well between basal conditions and CYP3A induction. In saliva, the drop in the AUC of 1′-OHMDZ (C) shows an excellent separation between basal conditions and CYP3A induction
Discussion
With our study, we primarily wanted to answer the following questions: i) Can the kinetics of MDZ be assessed reliably in saliva? and ii) Can saliva be used as a matrix to determine CYP3A activity with MDZ as a probe drug? If yes, is the ability of the values obtained in saliva to separate CYP3A-induced from non-induced individuals comparable to plasma values?
Regarding the good correlation between the MDZ concentrations in plasma and saliva (Figure 2), it is evident that the kinetics of MDZ can be reliably assessed also in saliva both after IV and oral administration of MDZ. However, several points have to be taken into account. Because MDZ is highly plasma protein-bound and only free MDZ distributes into saliva, the MDZ concentration is much lower in saliva than in plasma. In contrast to plasma, where we determined the kinetics of total MDZ, the kinetics of free MDZ was therefore assessed in saliva. Accordingly, the AUC of MDZ was much lower and the clearance much higher in saliva compared with plasma. Similar to MDZ, 1′-OHMDZ kinetics could be calculated in plasma as well as in saliva. Interestingly, 1′-OHMDZ reached its maximum concentration in saliva much later than in plasma, indicating a slow transport into saliva. The exact mechanism of how 1′-OHMDZ gains access to saliva is not known but may be by diffusion, depending on protein binding and lipophilicity of the compound [22]. Most probably due to the lower binding to plasma proteins compared with MDZ [21], the ratio of 1′-OHMDZ to MDZ was higher in saliva than in plasma. 1′-OHMDZ-glucuronide could not be detected in saliva, most probably reflecting low or even lacking transport into this compartment due to its hydrophilic properties. Similar findings have been reported for the glucuronides of morphine [23].
After induction with rifampicin, the clearance of MDZ was increased compared with basal values, and, accordingly, the AUC decreased both after IV and oral administration of MDZ. However, the effects of rifampicin differed in their extent between IV and oral administration, most probably reflecting both hepatic and intestinal induction of the first pass metabolism of oral MDZ. While the AUC of MDZ in plasma dropped only by 34.5% after IV administration, this drop was 98.5% after oral ingestion of MDZ. These effects of rifampicin are consistent with other reports in the literature [24, 25]. After oral administration, MDZ could therefore not be detected in saliva, precluding its use as a marker of CYP3A induction with the quantification limits of current analytical methods.
Interestingly, the plasma concentrations and AUCs of the hydroxy-metabolites of MDZ did not show the expected increase, but a decrease, after treatment with rifampicin. As evidenced by the current study for 1′-OHMDZ, the hydroxy-metabolites of MDZ undergo extensive glucuronidation, explaining our findings. Although it is well known that intestinal and hepatic metabolism of MDZ is altered significantly by induction [25] or inhibition [26] of CYP3A activity, it was less clear that induction of UDP-glucuronyltransferases exhibits such dramatic effects on the kinetics of the hydroxy-MDZ metabolites. Different authors have reported an up to three-fold increase in glucuronidation activity in humans [27], human hepatocytes [28] or rats [29] after treatment with rifampicin [27–29]. In contrast, Reinach et al. did not find a significant effect of rifampicin on AZT glucuronidation in human hepatocytes [30]. Until very recently, glucuronidation of 1′-OHMDZ was not well characterized. Recently, Zhu et al. [31] demonstrated in vitro that glucuronidation of 1′-OHMDZ was catalyzed by UGT2B4 and UGT2B7. Nakajima et al. [32] studied the effects of glucocorticoids (moderate inducers of CYP3A activity) on MDZ kinetics in humans. Although not statistically significant, a trend towards a lower AUC of MDZ and 1′-OHMDZ in plasma, and a higher cumulative excretion of 1′-OHMDZ-glucuronide in the urine compared with baseline could be observed. In addition, Eap et al. [33] studied single dose MDZ kinetics before and after induction with rifampicin in human subjects. After 4 days of treatment with 450 mg rifampicin day−1, they could demonstrate a significant decrease of MDZ and 1′-OHMDZ plasma concentrations. Interestingly, in their study, the ratio 1′-OHMDZtot : MDZ (1′-OHMDZtot represents the concentration of 1′OHMDZ plus 1′-OHMDZ-glucuronide) obtained after 30 min discriminated well (P < 0.0001) between constitutive and induced CYP3A activity. Unfortunately, they did not report specifically the pharmacokinetics of the glucuronide metabolites. In our work, the ratio 1′-OHMDZtot : MDZ showed also a significant increase after administration of rifampicin (P < 0.05) but there was a slight overlap of values obtained at baseline and after treatment with rifampicin both after 20 and 30 min (Table 2).
MDZ is a well established probe drug to assess in vivo CYP3A activity [2]. Various authors demonstrated that the AUC of MDZ, in most cases obtained by limited sampling models [14, 34], or even single point sampling strategies in plasma [16, 17] are able to discriminate between constitutive, induced, and inhibited CYP3A activity. Various authors investigated the ratio of 1′-OHMDZ : MDZ in plasma as an index for CYP3A activity, but with inconsistent results [14, 18, 19, 33]. As nicely demonstrated in our work, glucuronidation plays a major role in the kinetics of the hydroxy-MDZ metabolites, especially after induction with rifampicin. Therefore, the ratio (1′-OHMDZ + 1′-OHMDZ-glucuronide) : MDZ rather than 1′-OHMDZ : MDZ may be used to assess induction of CYP3A activity in plasma.
Whereas various limited sampling strategies to assess CYP3A activity using MDZ are simpler, less invasive and cost saving compared with the determination of the entire AUC, all techniques so far reported require invasive blood sampling. In our work, we were able to show that MDZ kinetics in saliva, an easily assessable body fluid, may be a useful tool to differentiate between constitutive and induced CYP3A activity. After IV administration of MDZ, there was no overlap in the AUCs of MDZ under basal conditions and after treatment with rifampicin in saliva, showing a better separation between these two conditions compared with the AUC in plasma. Similarly, after oral ingestion of MDZ, there was no overlap in the AUC for 1′-OHMDZ in saliva, a finding obtained also for the corresponding AUC in plasma. Saliva may therefore be suited at least as well as plasma for the determination of the CYP3A phenotype using MDZ as a probe drug. However, more work is needed regarding the use of saliva as a matrix for this purpose, for example for evaluating the most suitable sampling strategy. Furthermore, it has to be shown that inhibition of CYP3A can be assessed in saliva as well.
In conclusion, we provide evidence that MDZ and 1′-OHMDZ can be determined reliably in saliva and that the concentrations in saliva correlate well with those in plasma. Saliva may be a suitable matrix for the non-invasive determination of the CYP3A phenotype using MDZ as a probe drug.
The study was supported by a grant of the Swiss National Science Foundation to SK (310000-112483). We thank Dr Katerina Novakova and Dr Philipp Schlatter for technical support.
REFERENCES
- 1.Nordt SP, Clark RF. Midazolam: a review of therapeutic uses and toxicity. J Emerg Med. 1997;15:357–65. doi: 10.1016/s0736-4679(97)00022-x. [DOI] [PubMed] [Google Scholar]
- 2.Streetman DS, Bertino JS, Jr, Nafziger AN. Phenotyping of drug-metabolizing enzymes in adults: a review of in-vivo cytochrome P450 phenotyping probes. Pharmacogenetics. 2000;10:187–216. doi: 10.1097/00008571-200004000-00001. [DOI] [PubMed] [Google Scholar]
- 3.Bauer TM, Ritz R, Haberthur C, Ha HR, Hunkeler W, Sleight AJ, Scollo-Lavizzari G, Haefeli WE. Prolonged sedation due to accumulation of conjugated metabolites of midazolam. Lancet. 1995;346:145–7. doi: 10.1016/s0140-6736(95)91209-6. [DOI] [PubMed] [Google Scholar]
- 4.Heizmann P, Ziegler WH. Excretion and metabolism of 14C-midazolam in humans following oral dosing. Arzneimittelforschung. 1981;31:2220–3. [PubMed] [Google Scholar]
- 5.Kronbach T, Mathys D, Umeno M, Gonzalez FJ, Meyer UA. Oxidation of midazolam and triazolam by human liver cytochrome P450IIIA4. Mol Pharmacol. 1989;36:89–96. [PubMed] [Google Scholar]
- 6.Maurer HH. Advances in analytical toxicology: the current role of liquid chromatography-mass spectrometry in drug quantification in blood and oral fluid. Anal Bioanal Chem. 2005;381:110–8. doi: 10.1007/s00216-004-2774-z. [DOI] [PubMed] [Google Scholar]
- 7.Aps JK, Martens LC. Review: the physiology of saliva and transfer of drugs into saliva. Forensic Sci Int. 2005;150:119–31. doi: 10.1016/j.forsciint.2004.10.026. [DOI] [PubMed] [Google Scholar]
- 8.Choo RE, Huestis MA. Oral fluid as a diagnostic tool. Clin Chem Lab Med. 2004;42:1273–87. doi: 10.1515/CCLM.2004.248. [DOI] [PubMed] [Google Scholar]
- 9.Kidwell DA, Holland JC, Athanaselis S. Testing for drugs of abuse in saliva and sweat. J Chromatogr B Biomed Sci Appl. 1998;713:111–35. doi: 10.1016/s0378-4347(97)00572-0. [DOI] [PubMed] [Google Scholar]
- 10.Kintz P, Samyn N. Use of alternative specimens: drugs of abuse in saliva and doping agents in hair. Ther Drug Monit. 2002;24:239–46. doi: 10.1097/00007691-200204000-00006. [DOI] [PubMed] [Google Scholar]
- 11.Drummer OH. Review: pharmacokinetics of illicit drugs in oral fluid. Forensic Sci Int. 2005;150:133–42. doi: 10.1016/j.forsciint.2004.11.022. [DOI] [PubMed] [Google Scholar]
- 12.Link B, Haschke M, Wenk M, Krahenbuhl S. Determination of midazolam and its hydroxy metabolites in human plasma and oral fluid by liquid chromatography/electrospray ionization ion trap tandem mass spectrometry. Rapid Commun Mass Spectrom. 2007;21:1531–40. doi: 10.1002/rcm.2987. [DOI] [PubMed] [Google Scholar]
- 13.Lee JI, Chaves-Gnecco D, Amico JA, Kroboth PD, Wilson JW, Frye RF. Application of semisimultaneous midazolam administration for hepatic and intestinal cytochrome P450 3A phenotyping. Clin Pharmacol Ther. 2002;72:718–28. doi: 10.1067/mcp.2002.129068. [DOI] [PubMed] [Google Scholar]
- 14.Lee LS, Bertino JS, Jr, Nafziger AN. Limited sampling models for oral midazolam: midazolam plasma concentrations, not the ratio of 1-hydroxymidazolam to midazolam plasma concentrations, accurately predicts AUC as a biomarker of CYP3A activity. J Clin Pharmacol. 2006;46:229–34. doi: 10.1177/0091270005283466. [DOI] [PubMed] [Google Scholar]
- 15.Li J, Karlsson MO, Brahmer J, Spitz A, Zhao M, Hidalgo M, Baker SD. CYP3A phenotyping approach to predict systemic exposure to EGFR tyrosine kinase inhibitors. J Natl Cancer Inst. 2006;98:1714–23. doi: 10.1093/jnci/djj466. [DOI] [PubMed] [Google Scholar]
- 16.Chaobal HN, Kharasch ED. Single-point sampling for assessment of constitutive, induced, and inhibited cytochrome P450 3A activity with alfentanil or midazolam. Clin Pharmacol Ther. 2005;78:529–39. doi: 10.1016/j.clpt.2005.08.004. [DOI] [PubMed] [Google Scholar]
- 17.Lin YS, Lockwood GF, Graham MA, Brian WR, Loi CM, Dobrinska MR, Shen DD, Watkins PB, Wilkinson GR, Kharasch ED, Thummel KE. In vivo phenotyping for CYP3A by a single-point determination of midazolam plasma concentration. Pharmacogenetics. 2001;11:781–91. doi: 10.1097/00008571-200112000-00006. [DOI] [PubMed] [Google Scholar]
- 18.Rogers JF, Nafziger AN, Kashuba AD, Streetman DS, Rocci ML, Jr, Choo EF, Wilkinson GR, Bertino JS., Jr Single plasma concentrations of 1′-hydroxymidazolam or the ratio of 1′-hydroxymidazolam:midazolam do not predict midazolam clearance in healthy subjects. J Clin Pharmacol. 2002;42:1079–82. doi: 10.1177/009127002401382614. [DOI] [PubMed] [Google Scholar]
- 19.Zhu B, Ou-Yang DS, Cheng ZN, Huang SL, Zhou HH. Single plasma sampling to predict oral clearance of CYP3A probe midazolam. Acta Pharmacol Sin. 2001;22:634–8. [PubMed] [Google Scholar]
- 20.Paine MF, Shen DD, Kunze KL, Perkins JD, Marsh CL, McVicar JP, Barr DM, Gillies BS, Thummel KE. First-pass metabolism of midazolam by the human intestine. Clin Pharmacol Ther. 1996;60:14–24. doi: 10.1016/S0009-9236(96)90162-9. [DOI] [PubMed] [Google Scholar]
- 21.Bodmer M, Link B, Grignaschi N, Kummer O, Ruegg S, Haschke M, Krähenbühl S. Pharmacokinetics of midazolam and metabolites in a patient with refractory status epilepticus treated with excessive doses of midazolam. Ther Drug Monit. 2008;30:120–4. doi: 10.1097/FTD.0b013e3181626ffd. [DOI] [PubMed] [Google Scholar]
- 22.Loscher W, Frey HH. Kinetics of penetration of common antiepileptic drugs into cerebrospinal fluid. Epilepsia. 1984;25:346–52. doi: 10.1111/j.1528-1157.1984.tb04199.x. [DOI] [PubMed] [Google Scholar]
- 23.Friedrich G, Krieger A, Stritt W, Vach W. Pilot study of dose dependence in glucuronidation of morphine to morphine-3- and morphine-5-glucuronide. Beitr Gerichtl Med. 1992;50:215–20. [PubMed] [Google Scholar]
- 24.Backman JT, Olkkola KT, Neuvonen PJ. Rifampin drastically reduces plasma concentrations and effects of oral midazolam. Clin Pharmacol Ther. 1996;59:7–13. doi: 10.1016/S0009-9236(96)90018-1. [DOI] [PubMed] [Google Scholar]
- 25.Gorski JC, Vannaprasaht S, Hamman MA, Ambrosius WT, Bruce MA, Haehner-Daniels B, Hall SD. The effect of age, sex, and rifampin administration on intestinal and hepatic cytochrome P450 3A activity. Clin Pharmacol Ther. 2003;74:275–87. doi: 10.1016/S0009-9236(03)00187-5. [DOI] [PubMed] [Google Scholar]
- 26.Kupferschmidt HH, Ha HR, Ziegler WH, Meier PJ, Krahenbuhl S. Interaction between grapefruit juice and midazolam in humans. Clin Pharmacol Ther. 1995;58:20–8. doi: 10.1016/0009-9236(95)90068-3. [DOI] [PubMed] [Google Scholar]
- 27.Ebert U, Thong NQ, Oertel R, Kirch W. Effects of rifampicin and cimetidine on pharmacokinetics and pharmacodynamics of lamotrigine in healthy subjects. Eur J Clin Pharmacol. 2000;56:299–304. doi: 10.1007/s002280000146. [DOI] [PubMed] [Google Scholar]
- 28.Soars MG, Petullo DM, Eckstein JA, Kasper SC, Wrighton SA. An assessment of udp-glucuronosyltransferase induction using primary human hepatocytes. Drug Metab Dispos. 2004;32:140–8. doi: 10.1124/dmd.32.1.140. [DOI] [PubMed] [Google Scholar]
- 29.Oesch F, Arand M, Benedetti MS, Castelli MG, Dostert P. Inducing properties of rifampicin and rifabutin for selected enzyme activities of the cytochrome P-450 and UDP-glucuronosyltransferase superfamilies in female rat liver. J Antimicrob Chemother. 1996;37:1111–9. doi: 10.1093/jac/37.6.1111. [DOI] [PubMed] [Google Scholar]
- 30.Reinach B, de Sousa G, Dostert P, Ings R, Gugenheim J, Rahmani R. Comparative effects of rifabutin and rifampicin on cytochromes P450 and UDP-glucuronosyl-transferases expression in fresh and cryopreserved human hepatocytes. Chem Biol Interact. 1999;121:37–48. doi: 10.1016/s0009-2797(99)00089-7. [DOI] [PubMed] [Google Scholar]
- 31.Zhu B, Bush D, Doss GA, Vincent SH, Franklin RB, Xu S. Characterization of 1′-hydroxymidazolam glucuronidation in human liver microsomes. Drug Metab Dispos. 2008;36:331–8. doi: 10.1124/dmd.107.017962. [DOI] [PubMed] [Google Scholar]
- 32.Nakajima M, Suzuki T, Sasaki T, Yokoi T, Hosoyamada A, Yamamoto T, Kuroiwa Y. Effects of chronic administration of glucocorticoid on midazolam pharmacokinetics in humans. Ther Drug Monit. 1999;21:507–13. doi: 10.1097/00007691-199910000-00003. [DOI] [PubMed] [Google Scholar]
- 33.Eap CB, Buclin T, Cucchia G, Zullino D, Hustert E, Bleiber G, Golay KP, Aubert AC, Baumann P, Telenti A, Kerb R. Oral administration of a low dose of midazolam (75 microg) as an in vivo probe for CYP3A activity. Eur J Clin Pharmacol. 2004;60:237–46. doi: 10.1007/s00228-004-0762-z. [DOI] [PubMed] [Google Scholar]
- 34.Chainuvati S, Nafziger AN, Leeder JS, Gaedigk A, Kearns GL, Sellers E, Zhang Y, Kashuba AD, Rowland E, Bertino JS., Jr Combined phenotypic assessment of cytochrome P450 1A2, 2C9, 2C19, 2D6, and 3A, N-acetyltransferase-2, and xanthine oxidase activities with the ‘Cooperstown 5+1 cocktail. Clin Pharmacol Ther. 2003;74:437–47. doi: 10.1016/S0009-9236(03)00229-7. [DOI] [PubMed] [Google Scholar]