Abstract
The global relationship between drugs that are approved for therapeutic use and the human genome is not known. We employed graph-theory methods to analyze the Federal Food and Drug Administration (FDA) approved drugs and their known molecular targets. We used the FDA Approved Drug Products with Therapeutic Equivalence Evaluations 26th Edition Electronic Orange Book (EOB) to identify all FDA approved drugs and their active ingredients. We then connected the list of active ingredients extracted from the EOB to those known human protein targets included in the DrugBank database and constructed a bipartite network. We computed network statistics and conducted Gene Ontology analysis on the drug targets and drug categories. We find that drug to drug-target relationship in the bipartite network is scale-free. Several classes of proteins in the human genome appear to be better targets for drugs since they appear to be selectively enriched as drug targets for the currently FDA approved drugs. These initial observations allow for development of an integrated research methodology to identify general principles of the drug discovery process.
Keywords: FDA drugs, network analysis, graph-theory, Systems Biology, Orange Book, drug discovery
Introduction
Drug discovery is an empirical process. In spite of the enormous successes over the past 50 years in the discovery and use of therapeutic agents, it is often not clear why some drugs work and others have limited utility, with adverse effects that become apparent only after extensive use. Developing analytical methods that facilitate the discovery of some of the general rules for discovering targets for therapeutic agents, and the effects of drug-target interactions, both beneficial and adverse, would be valuable in moving the drug discovery process forward. For this effort, the field of Systems Biology and network sciences could be useful.
Systems Biology is an emerging interdisciplinary science that integrates biochemistry and cell-biology with genetics and physiology, as well as bioinformatics and computational biology to obtain holistic descriptions of biological systems at the cellular, tissue/organ and organismal levels. Operationally, such descriptions are obtained by tightly combining multivariable experiments and computational modeling to develop global views of dynamics at various scales of organization and across scales. Such integrated operational approaches are made possible due to advancements in experimental techniques, which allow the capture of the state of many cellular components at once. Computational methods and tools have greatly enabled advances in Systems Biology. The dramatic reduction in the cost of hardware, the continuing advances in applied mathematics that contribute to new algorithms, and the rapid pace of new software and database development, as well as the broadband networks that greatly facilitate access to the new databases and software, all contribute to the emergence of Systems Biology as a powerful new discipline. One of the promises Systems Biology brings is our ability to better understand cellular, tissue and organbehavior at the molecular level. This understanding could lead to better drug design, multidrug treatments, side-effect predictions, and rapid drug targeting and development as well as biomarker discovery.
Currently, the most comprehensive knowledge about the functional characteristics of cellular components is qualitative. Hence, graph-theory, a field of mathematics applied to, and developed within, the fields of sociology and computer-science has been used to analyze regulatory networks within cells1,2,3. Here, cellular components, such as proteins and metabolites, are represented as nodes, and their interactions represented as links. This consideration results in directed or undirected graphs (networks). These networks can be analyzed using different algorithms that provide organizational information about the system from a top-down view. Most commonly, cellular regulatory networks such as cell signaling and gene regulation systems are abstracted to directed networks. These networks, if understood from a global perspective, could, in conjunction with molecular mechanisms, help explain the origins of phenotypic behavior, and explain how this behavior changes in disease states and is restored by drug treatment. The construction of networks may allow us to see how information from initial drug-target interactions affects many components and interactions in regulatory networks within mammalian cells to alter the disease state. To construct such a network, Food and Drug Administration (FDA) approved drugs can be considered nodes and their drug-target interactions as links. At first, this bipartite network of drug-target interactions can be analyzed.
We developed a bipartite network of FDA approved drugs and their targets. We conducted statistical analyses to obtain a description of this network. Analysis of the targets using Gene Ontology indicates that certain functional classes of proteins may be “better” drug targets. This approach is a promising direct method to connect pharmacology and computational graph-theoretical Systems Biology, but it surely has limitations. For example, many drugs share the same therapeutic target but have known differential effects. These may be due to differential distribution within the body or differential interactions with as yet unidentified targets. These would not be captured easily with this approach. We summarize the limitations of graph-theoretical approaches and suggest initial metrics to handle the inherit complexity.
Analysis of the FDA’s Electronic Orange Book
The FDA Approved Drug Products with Therapeutic Equivalence Evaluations 26th Edition Electronic Orange Book (EOB)4 lists 11, 706 approved prescription drugs (RX) with therapeutic equivalence evaluations, 390 approved over-the-counter (OTC) drugs, and a list, containing 8820 approved products that have been discontinued. We excluded discontinued drugs from further analysis. Many drug products use the same active ingredients. We found 1323 unique active ingredients in all the OTC and RX drug products listed in the FDA’s Orange Book. Many drug products use multiple active ingredients. Figure 1 shows a histogram of the distribution of active ingredients in FDA approved drug products. This distribution fits an exponential with the majority of drugs containing a single active ingredient, and only three drugs containing eight active ingredients. Each entry in the EOB also lists the date of approval. Figure 2 shows the addition of new active ingredients approved by year. The rate of approval of new active ingredients has a uniform distribution with an average of 33.5 drugs per year, and a high standard deviation of 10.4. Over the past 10 years there has been more fluctuation in the approval rate with peaks in years 1996 and 2000 (66 in 1996, and 53 in 2000). Since we eliminated all discontinued drugs from the analysis, we indicate the number of approved drugs per year that are still available. Drugs approved since 1983 and subsequently discontinued will alter the distribution somewhat.
Fig 1.
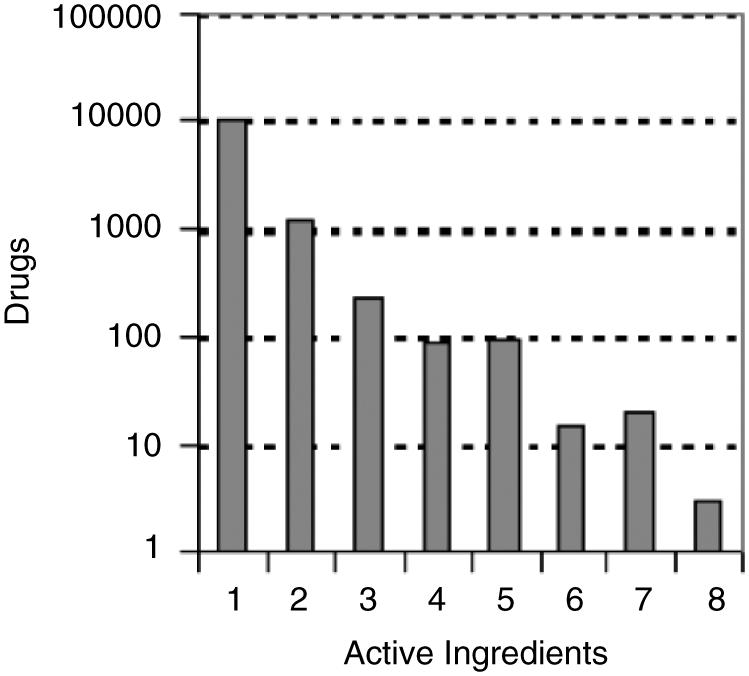
Number of active ingredients in each drug record listed in the FDA’s Orange Book.
Fig 2.
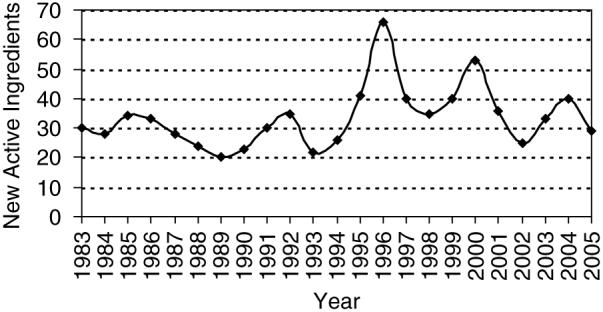
Number of newly approved active ingredients since 1983. Note that 528 were approved before 1983 but the information about their distribution is not provided in the Orange Book. Since discontinued drugs were removed from this analysis, the number of approved drugs per year is the number of those drugs that are still available.
Linking FDA approved drugs to DrugBank
Recently, Wishart et al.5 developed a web-based resource database called DrugBank, containing many FDA approved drugs and some of their known targets. Our aim was to map FDA approved drugs and their active ingredients with known human gene targets. We extracted from the DrugBank database most drug-target interactions resulting in a network made of 1052 drugs targeting 485 proteins. The resultant bipartite network (the network has only two layers made of drugs and targets) contains 1537 nodes and 1815 interactions extracted from 2240 research articles (Fig. 3). Since the network is made of presumably, isolated drug-target interactions, we wanted to see whether these interactions are linked to form high order clusters. For this we identified islands in the network. Islands are isolated clusters of connected nodes in a network separated from other parts of the network. Island analysis found that the drug-target bipartite network contained 179 islands, with a single giant connected island made of 481 nodes (drugs and targets) (Fig. 4). The connectivity distribution of this network best fits a power-law (Fig. 5). Using this database, we linked the list of active ingredients extracted from the FDA’s Orange Book to their listed molecular targets. From the list of 1471 approved unique active ingredients extracted from all the drugs listed in the FDA’s orange book, we were able to find 783 matching entries in the DrugBank database. Out of these 783 active ingredients, 710 had at least one human protein target.
Fig 3.
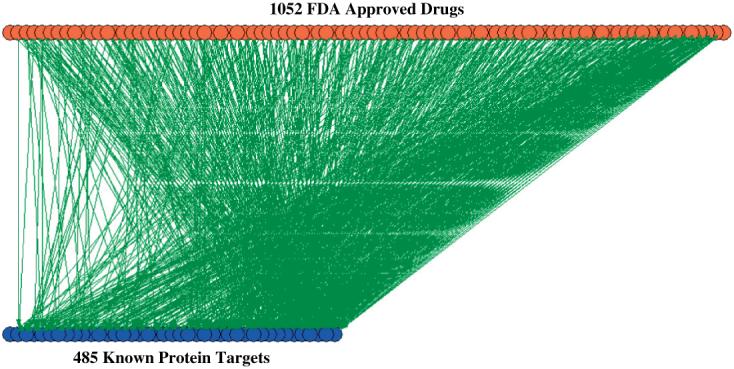
Visualization of the bipartite drug-target network extracted from DrugBank. Orange nodes represent drugs and blue nodes are known biomolecular targets. The network is made of 1537 nodes (1052 drugs and 485 targets) and 1815 interactions extracted from 2240 research articles.
Fig 4.
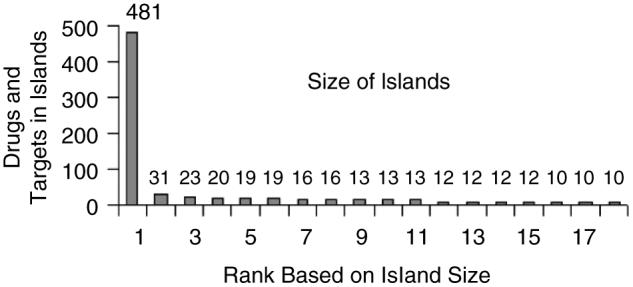
One hundred seventy nine islands were found in the drug-target bipartite network containing a single giant connected island made of 481 nodes (drugs and targets).
Fig 5.
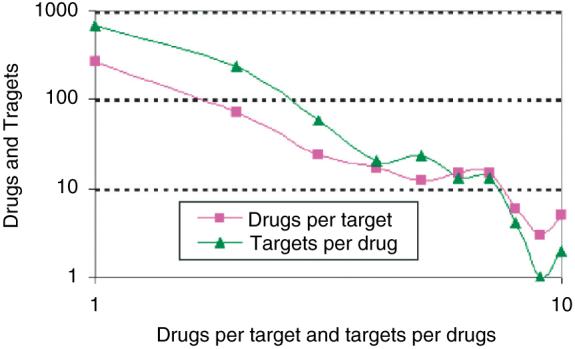
Distribution of drug-target interactions in a bipartite network created from DrugBank.
GO and Drug Category Analysis of the Targets
To understand the functional capabilities of drug targets we applied Gene Ontology analysis of the proteins constituting the drug targets group. We downloaded the reference file for human protein annotations from EMBL-EBI GOA Human version 44.0 from the following URL:ftp://ftp.ebi.ac.uk/pub/databases/GO/goa/HUMAN/gene.association.goa_human.gz and then matched the 485 target gene names extracted from DrugBank to their gene ontology6 terms using AmiGO7. The targets are enriched in GO terms for membrane proteins, receptors, transcription factors and cell signaling components (Fig. 6).
Fig 6.
Gene ontology repeated terms counted for all the drug targets versus repeated terms counted for all human proteins reveal enrichment in receptors, signal transduction components, and transcription factors.
Linking the Targets to a Consolidated Protein-protein Interaction Network
We are now developing an integrated database of mammalian interactions from several publicly available databases containing tens of thousands of interactions. From this interaction network we will identify human proteins that are drug targets. Seeing how targets and pathways are linked and interact with one another may be useful in developing further insights into the human drug-responsome.
Limitations
It is doubtful whether the graph-theory analysis and data described here can be used to predict side effects. In this qualitative analysis we used available targets, which tend to be therapeutic targets. With just that information, every member of a family of drugs with only one defined target will have indistinguishable potential effects. For example, if HMG-CoA reductase is the target, then lovastatin, pravastatin, atorvastatin, simvastatin, and rosuvastatin are nodes with arrows directed to HMGCoA reductase. From a simple graph-theory view, these different drugs will cause identical patterns. However, we need to consider a number of additional specifications such as (1) pro-drug status: the need for metabolism to activate the drug; (2) interaction parameters with the target enzyme, e.g. the Ki may be different; (3) some differences among these drugs may be due to their binding to other targets which are not currently well defined, and may not be simply due to reduction in cholesterol synthesis, e.g. lovastatin, but not pravastatin, blocks leukocyte function antigen 1-mediated lymphocyte adhesion8; (4) even when multiple drugs have the same molecular target, they might have different tissue distribution because of differences in physical properties such as lipid solubility; (5) the current analysis is most likely to involve only the parent drug or the active moiety derived from a prodrug, and not its other metabolites, which could have pharmacological actions similar to or different from the parent drug.
So while graph-theoretical analysis may potentially be able to predict some differential adverse effects of drugs working on different defined targets, it appears that within a class of drugs with the same therapeutic target simple graph-theoretical analysis will be insufficient. Quantitative modeling analysis, in conjunction with network analyses, may be required. Table 1 summarizes different combinatorial scenarios involving parent drug, metabolites, targets and tissues that may contribute to differential effects of drugs within a therapeutic class. If multiple drugs with varying potencies or efficacy interact with the same target, as is the case with the statins, then the combinatorial complexity described in Table 1 will increase. An additional problem arises in the classification of targets. For example, the DrugBank database is incomplete in terms of drug targets. In many cases the existence of multiple targets is included in descriptive material but these targets are not listed in the database. In some cases it appears that the decision was made to include only targets with presumed therapeutic actions and omit those primarily associated with adverse effects. In other cases an argument can be made that some of the omitted targets may be involved in therapeutic effects as well. For example, the listing for the tricyclic antidepressant amitriptyline, includes only the norepinephrine and serotonin transporters as targets. It does not list histamine H1 receptors, at which amitriptyline is more potent than as an uptake blocker, or muscarinic receptors, which contribute to amitriptyline’s side effect profile9. The listing for the alpha/beta adrenergic antagonist carvedilol lists alpha-1 and beta-1 receptors but not beta-2 receptors. Carvedilol is essentially a nonselective beta blocker with similar Ki for human beta-1 and beta-2 receptors10. For the anti-muscarinic drug atropine, all five muscarinic receptors are listed as targets, but for the anti-muscarinic oxybutynin only the M1 receptor is listed, although oxybutynin has similar affinity for M3 and M4 receptors11. And as a final example, the only target listed for the antiarrhythmic drug quinidine is the voltage-gated sodium channel, although this drug has long been known to block potassium-channels12. This action is a major contributor to the prolongation of cardiac action potential duration produced by quinidine, and its increased probability of producing the arrhythmia torsade de pointes compared to selective sodium channel blockers. These limitations are described not as a criticism of DrugBank, which is a very valuable initial effort for the pharmacology research community, but to highlight the complex issues that will require further reasoning to develop rules for database and network development.
Table 1. Active ingredients can cause adverse effects through 12 different scenarios. The precursor, the active drug, or drug metabolites resulting from chemical processing of the drug, can interact with the intended target but cause the target to initiate undesired effects (scenarios 1, 5 and 9). The three possible different forms of the drug can interact with other unknown or undesired targets in the same cell type (scenarios 2, 6 and 10) or different cell types (scenarios 4, 8 and 12). Also, the three possible different forms of the drugs can cause unwanted effects by targeting the intended target but in the unintended cell type (scenarios 3, 7 and 11).
| Same cell same target | Same cell different target | Different cell same target | Different cell different target | |
|---|---|---|---|---|
| Drug precursor | Scenario 1 | Scenario 2 | Scenario 3 | Scenario 4 |
| Active drug | Scenario 5 | Scenario 6 | Scenario 7 | Scenario 8 |
| Drug metabolites | Scenario 9 | Scenario 10 | Scenario 11 | Scenario 12 |
Conclusions
Our initial attempt to develop a network to understand the connectivity between FDA approved drugs and their targets, and how these targets themselves cluster, is preliminary but has many potential uses. Lamb et al.13 have recently mapped microarray signature patterns after application of FDA approved and other drugs to cancer cell-lines with the goal of identifying similarities and differences among the effects induced by the different drugs. Their approach treats cells as black boxes. The drugs are the inputs and the gene expression patterns are the output. Our ability to link drugs to their targets and the targets to a network of protein interactions and signaling networks may lead us to understand the internal configuration of the black box in between the drug target(s) and their effects, such as gene expression patterns. We hope to be able to connect phenotypes induced by different drugs to the regulatory patterns and molecular mechanisms that lead to changes in gene expression patterns. This understanding could lead to the identification of new multidrug treatments, side-effect prediction, and the discovery of new drug targets.
References
- 1.Albert R. Scale-free networks in cell biology. JCell Sci. 2005;118(Pt 21):4947–4957. doi: 10.1242/jcs.02714. [DOI] [PubMed] [Google Scholar]
- 2.Ma’ayan A, Blitzer RD, Iyengar R. Toward predictive models of mammalian cells. Annu Rev Biophys Biomol Struct. 2005;34:319–349. doi: 10.1146/annurev.biophys.34.040204.144415. [DOI] [PMC free article] [PubMed] [Google Scholar]
- 3.Ma’ayan A, Iyengar R. From components to regulatory motifs in signalling networks. Brief Funct Genomic Proteomic. 2006;5(1):57–61. doi: 10.1093/bfgp/ell004. [DOI] [PMC free article] [PubMed] [Google Scholar]
- 4.U.S. Food and Drug Administration. Center for Drug Evaluation and Research Approved Drug Products with Therapeutic Equivalence Evaluations Orange Book. http://www.fda.gov/cder/orange/default.htm.
- 5.Wishart DS, Knox C, Guo AC, et al. DrugBank: a comprehensive resource for in silico drug discovery and exploration. Nucleic Acids Res. 2006;34:D668–D672. doi: 10.1093/nar/gkj067. [DOI] [PMC free article] [PubMed] [Google Scholar]
- 6.Harris MA, Clark J, Ireland A, et al. Gene Ontology Consortium. The Gene Ontology (GO) database and informatics resource. Nucleic Acids Res. 2004;32:D258–D261. doi: 10.1093/nar/gkh036. [DOI] [PMC free article] [PubMed] [Google Scholar]
- 7.Gene Ontology Consortium The Gene Ontology (GO) project in 2006. Nucleic Acids Res. 2006;34:D322–D326. doi: 10.1093/nar/gkj021. [DOI] [PMC free article] [PubMed] [Google Scholar]
- 8.Weitz-Schmidt G, Welzenbach K, Brinkmann V, et al. Statins selectively inhibit leukocyte function antigen-1 by binding to a novel regulatory integrin site. Nat Med. 2001;7(6):687–692. doi: 10.1038/89058. [DOI] [PubMed] [Google Scholar]
- 9.Richelson E. Tricyclic antidepressants and histamine H1 receptors. Mayo Clin Proc. 1979;54(10):669–674. [PubMed] [Google Scholar]
- 10.Smith C, Teitler M. Beta-blocker selectivity at cloned human beta1- and beta2-adrenergic receptors. Cardiovasc Drugs Ther. 1999;13(2):123–126. doi: 10.1023/a:1007784109255. [DOI] [PubMed] [Google Scholar]
- 11.Moriya H, Takagi Y, Nakanishi T, et al. Affinity profiles of various muscarinic antagonists for cloned human muscarinic acetylcholine receptor (mAChR) subtypes and mAChRs in rat heart and submandibular gland. Life Sci. 1999;64(25):2351–2358. doi: 10.1016/s0024-3205(99)00188-5. [DOI] [PubMed] [Google Scholar]
- 12.Yao JA, Trybulski EJ, Tseng GN. Quinidine preferentially blocks the slow delayed rectifier potassium channel in the rested state. J Pharmacol Exp Ther. 1996;279(2):856–864. [PubMed] [Google Scholar]
- 13.Lamb J, Crawford ED, Peck D, et al. The Connectivity Map: Using Gene-Expression Signatures to Connect Small Molecules, Genes, and Disease. Science. 2006;313(5795):1929–1935. doi: 10.1126/science.1132939. [DOI] [PubMed] [Google Scholar]


