

Abstract
Advanced computational techniques including transition path sampling and free energy calculations are combined synergistically to reveal the activation mechanism at unprecedented resolution for a small signaling protein, chemotaxis protein Y. In the conventional “Y-T coupling” model for response regulators, phosphorylation induces the displacement of the conserved Thr87 residue through hydrogen-bond formation, which in turn makes it sterically possible for Tyr106 to isomerize from a solvent exposed configuration to a buried rotameric state. More than 160 unbiased activation trajectories show, however, that the rotation of Tyr106 does not rely on the displacement of Thr87 per se. Free energy calculations reveal that the Tyr106 rotation is a low-barrier process in the absence of the Thr87-phosphate hydrogen bond although the rotation is stabilized by the formation of this interaction. The simulations also find that structural change in the β4 − α4 loop does not gate the Tyr106 rotation as suggested previously; rather, the rotation of Tyr106 stabilizes the activated configuration of this loop. The computational strategy used and mechanistic insights obtained have impact on the study of signaling proteins and allosteric systems in general.
I. INTRODUCTION
Signaling proteins are often activated to perform their biological function through a localized event such as phosphorylation and ligand (ion) binding.1 Understanding how such local modifications lead to striking transitions in the structure and therefore activity of signaling proteins is evidently of great value from both fundamental and biomedical perspectives. Due to the intrinsic dynamical nature of the process, a microscopic description of signaling protein activation with structural and energetic details has been difficult to obtain.2–4 For example, recent NMR studies5 of small signaling proteins in two-component systems suggested that the structural motifs to be activated have a small but non-negligible population in the active conformation prior to phosphorylation; the role of phosphorylation is to shift this population to become the dominant one rather than inducing new conformations. Such a “population shift” framework,2 which has features of the Monod-Wyman-Changeux (MWC) model6 for allostery6–9, emphasizes the dynamical nature of signaling proteins (and allosteric systems in general) and provides a rather different picture from the “push and pull” type of description as characterized by the stereochemical model for hemoglobin.10 As discussed in details in our recent work,11 however, what is missing in the classical MWC6, KNF7 models and the more recent “population shift” rendition, is the actual mechanism for propagating the effect of ligand binding or phosphorylation over a long distance in structural and energetic terms. In the context of the “population shift” description of signaling protein activation, for example, it often remains unclear how phosphorylation shifts the population of the distant response site. For such a purpose, atomistic simulations12 are needed to complement experimental studies. Indeed, as pointed out by Kern and Zuiderweg,2 “Regretfully, experimental evidence showing the intermediates through which an allosteric protein travels has not been forthcoming to our knowledge· · ·longer-term unrestrained MD simulations will, in the near future, become feasible for the modeling of the pathways.” As they commented, due to the long time-scale (> μs – ms) of activation processes, most previous simulation studies had to use artificially accelerated molecular simulations11,13,14 and very few studies15,16 characterized the energetics of the processes involved.
To illustrate that modern computational techniques can indeed start to help reveal unbiased activation pathway of signaling proteins and provide new mechanistic insights, we study a small but representative signaling protein, the E. Coli. chemotaxis Y protein (CheY). CheY is a 129 residue prototypical response regulator in two-component signal transduction systems.17 It is activated through phosphorylation and the most important conformational change in CheY upon activation is the rotation of the Tyr106 sidechain from a solvent exposed orientation to a fully buried state (Fig.1). Tyr106 is separated from the phosphorylation site of Asp57 by nearly 10 Å and between them is Thr87. Since Thr87 is highly conserved among response regulators in two-component systems, the conventional description for CheY activation is the “Y-T coupling” model:18 phosphorylation of Asp57 displaces Thr87 due to a hydrogen-bonding interaction, which in turn allows the rotation of Tyr106. Since partial activity has been observed for the wild type CheY19 and the T87A mutant20 in the absence and presence of phosphorylation, respectively, the “Y-T coupling” model has been questioned. In particular, since the β4-α4 loop (Ala 88 to Lys 91) also undergoes a major displacement upon activation, it has been speculated11,21 that this loop in fact gates the rotation of Tyr106 and the role of phosphorylation and Thr87 is to select specific loop configuration, which is reminiscent of the “population shift” model. Due to the presence of a significant energy barrier for Tyr106 rotation, artificial bias had to be used in the simulations11 and therefore the results were instructive but inconclusive.
FIG. 1.
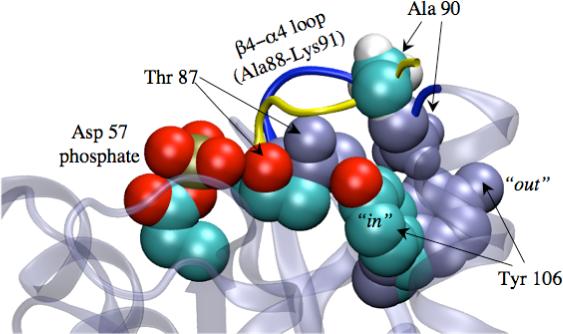
Comparison of the inactive21 and active26 structures of CheY. Overlay of key residues between the phosphorylation (Asp 57) and response sites (Tyr 106). Residues in the active structure are colored according to atom types, while those in the inactive structure are colored as ice-blue. The inactive and active configurations of the β4 − α4 loop are colored as dark-blue and yellow, respectively. The overall structure of the inactive state is shown in the transparent form as background. The steric interaction between Ala 90 and Tyr 106 in the inactive structure is clearly visible. All structural figures are made using VMD51.
Specifically, we use transition path sampling (TPS)22–24 to harvest more than 160 unbiased activation trajectories to reveal the activation mechanism of CheY. Although TPS has been successfully applied to obtain reactive trajectories between stable basins for many systems of varying degrees of complexity,16,22–24 it is difficult to reach conclusive mechanistic statements for biomolecular systems based on hundreds of reactive trajectories. Accordingly, we supplement the TPS analysis with free energy (potential of mean force, PMF) simulations for several dimensions identified as important by the TPS results. Combined together, these results help clarify the activation mechanism of CheY as a prototypical signaling protein with unprecedented resolution.
II. RESULTS
A. Transition Path Sampling
The rotation of Tyr106 sidechain is the most significant conformational change upon activation and regarded to correlate with CheY activity.25 In TPS, therefore, the sidechain dihedral angle, χ, of Tyr106 is selected as the order parameter that characterizes the two basins associated with the activation process. The length of the transition trajectories is set to ∼ 25 ps, which is determined as sufficiently long based on the analysis of τmol (see Supporting Information). As repeatedly emphasized in the literature,22–24 the time-scale of these transition trajectories should not be confused with the time span of the entire activation process, which includes the waiting time for the system to accumulate enough energy in the relevant degrees of freedom to overcome rate-limiting barriers (e.g., of Tyr106 rotation in CheY). The quality of path sampling is examined by calculating the autocorrelation function of χ at a particular time slice in the transition regions of the reactive trajectories in the path space. The results show that trajectories become uncorrelated every ∼20th trajectories (see Supporting Information), which suggests that the sampling of 163 trajectories is statistically meaningful for the current purpose.
The two relevant basins are defined by the order parameter χ between ∼30−90° and ∼150−210°, respectively. In all activation trajectories, the Tyr106 rotation is observed and the rotameric state does not change (up to ∼ 1 ns) once rotation has completed (data not included), which indicates that χ is indeed an appropriate order parameter. To illustrate the specific sequence of events associated with Tyr106 rotation, four representative configurations along a randomly chosen transition path are shown in Fig.2. At the beginning of the path (Fig.2a), CheY is in the inactive state with Tyr106 being solvent exposed and Ala 90 in the β4-α4 loop pointing down to block the rotation of Tyr106. After ∼8 ps (Fig.2b,c), Tyr106 partially rotates in, and correspondingly, Ala 90 and the β4-α4 loop move upward to allow the rotation to proceed; note, however, that the β4-α4 loop remains essentially in the inactive configuration. Finally by ∼12 ps, Tyr106 completely rotates in and becomes fully buried in the cavity under the β4-α4 loop (Fig.2d).
FIG. 2.

Four configurations along an exemplary activation trajectory. Several important residues including Tyr 106, Ala 90, Ile 95 and Val 108 are shown in the van der Waals scheme; the phosphorylated Asp 57 is shown in the licorice form; the β4-α4 loop is shown as the blue ribbon. The rest of protein is shown in cartoon and only regions close to Tyr 106 are shown.
To collectively analyze the behavior of the system during the transition, we project snapshots from all harvested transition paths to the 2-D plane of the χ angle and several variables noted in our previous simulation study.11 These variables include the position of Ala 90 (Fig.3a), which may sterically gate the rotation of Tyr106, two variables that characterize the configuration of the β4-α4 loop (Fig.3b,c), and the width of the “doorway” towards the buried site under the β4-α4 loop (Fig.3d), which is formed by Ile 95 and Val 108. All these variables show bi-modal distribution along the χ angle, which again supports the use of χ as the order parameter. As shown in Fig.3a, Ala 90 systematically deviates further from the inactive position as the Tyr106 rotates towards the buried site, which is easily explained by the observation that the inactive position of Ala 90 sterically hinders the Tyr106 rotation. Systematic variations in the β4-α4 loop configuration are also transparent. As shown in Fig.3b, the β4-α4 loop moves toward the active configuration as Tyr106 rotates in, as reflected by the decreasing ΔRMSD of backbone atoms in the β4-α4 loop with respect to χ; as defined in Materials and Methods, a smaller ΔRMSD indicates that the β4-α4 loop is closer to the active configuration. Similarly, in Fig.3c, the pseudo-dihedral angle formed by the Cα atoms of the four residues in the β4-α4 loop increases slightly (i.e., closer to the active configuration) as the Tyr106 rotates in. Regarding the doorway formed by Ile 95 and Val 108 as identified in the previous biased MD simulations,11, it's interesting that the width of the “door” in fact tends to decrease as Tyr106 rotates in (Fig.3d), such that the van der Waals interactions between these residues and Tyr106 increases (Fig.3e). Therefore, unlike the proposal based on the biased MD simulations,11 the function of these “doorway” residues is to stabilize the buried conformation of Tyr106 rather than gating its rotation; this is because the average width of the “doorway” is 7.5 Å, which does not limit the rotation of Tyr106. Finally, as shown in Fig.3f, the hydrogen-bond between Asp57-phosphate and Thr87 is unformed in all transition paths with the shortest oxygen-oxygen distance reaching about 4 Å. Therefore, it is clear that Tyr106 rotation does not rely on the formation of this hydrogen-bond.
FIG. 3.

Projection of all 163 transition paths onto the two-dimensional plane of the Tyr 106 χ angle and several variables of interest. (a) The displacement of Ala 90 sidechain from the inactivated position; (b) ΔRMSD of the β4-α4 loop relative to the inactive and active configurations; (c) the pseudo-dihedral angle of the β4-α4 loop; (d) the width of the “doorway” formed by Ile 95 and Val 108; (e) van der Waals interaction between the “doorway” residues and Tyr 106; (f) the shortest O-O distance between Thr 87 and the phosphate.
Although the TPS results are instructive, it is difficult to reach a firmly conclusive statement about the mechanism of CheY activation because the number of harvested transition trajectories is still small. Indeed, even with a minimal model for CheY activation, at least three processes are implicated: rotation of the Tyr106 sidechain, transition of the β4-α4 loop and hydrogen-bond formation between Asp57-phosphate and Thr87, which in principle can proceed in 3!=6 different sequences. Although TPS demonstrates that the sidechain rotation of Tyr106 may occur independent of the Thr87-phosphate hydrogen-bond formation, the results do not guarantee that this is the only or even the dominant pathway. Alternative transition trajectories with very different orders of events may be separated by high barriers and thus have not been sampled. Therefore, it is useful to supplement the TPS results with free energy simulations, which we turn to next.
B. Free energy simulations
Variables associated with the key structural transitions during CheY activation are chosen as the reaction coordinates in the free energy simulations: ΔRMSD of all non-hydrogen atoms of the β4-α4 loop, the sidechain dihedral angle of Tyr106, χ, and the hydrogen-bond distance Dhb between the hydroxyl oxygen of Thr87 and the phosphate oxygen of Asp57. Umbrella sampling calculations are carried out on several 2-D projections composed of two of the three reaction coordinates (Fig.4). All of the simulations are performed with Asp57 phosphorylated (see Materials and Methods).
FIG. 4.
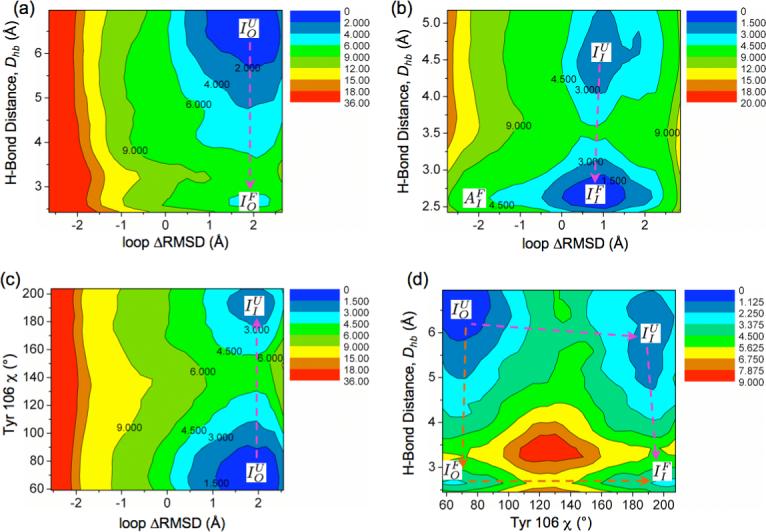
Two-dimensional potentials of mean force (in kcal/mol) for CheY for: (a) ΔRMSD of the β4-α4 loop and the Thr87-phosphate hydrogen-bond distance, Dhb, with the Tyr106 sidechain solvent exposed; (b) ΔRMSD and Dhb with the Tyr106 sidechain buried; (c) ΔRMSD and the Tyr106 sidechain dihedral angle χ with the Thr87-phosphate hydrogen-bond unformed; (d) χ and Dhb. The arrows indicate possible pathways of activation. For each plot, the lowest-energy basin is set to be the reference (0.0) of energy. The basins are labeled with notations such as , which indicates inactive (I) β4 − α4 loop, unformed (U) Thr87-phosphate hydrogen bond and out-configuration (O) of the Tyr106 sidechain. The PMFs in (b) is calculated using the 1F4V26 x-ray structure while the other three with the 1JBE21 x-ray structure.
Fig.4a shows the 2D free energy surface for ΔRMSD and Dhb with the Tyr106 sidechain “out”(solvent exposed). There are two local minima: basin with ΔRMSD > 0 (inactive) and Dhb > 5.5 Å whereas basin with ΔRMSD > 0 and Dhb < 3.0 Å. In other words, with Tyr106 “out”, the β4-α4 loop prefers to remain inactive, and the Thr87-phosphate hydrogen-bond is locally stable although formation of this hydrogen-bond is thermodynamically unfavorable (∼ 5.3 kcal/mol) with a significant barrier of ∼ 7.0 kcal/mol.
Fig.4b shows the 2D free energy surface for ΔRMSD and Dhb with Tyr106 sidechain “in” (buried under the β4 − α4 loop). There are also two local minima: basin with ΔRMSD > 0 and Dhb > 4.0 Å and basin with a broad distribution around ΔRMSD ∼ 0 and Dhb < 3.0 Å. Interestingly, with Tyr106 buried, the Thr87-phosphate hydrogen-bond formation becomes favorable by ∼ 2.0 kcal/mol with a much reduced barrier of ∼ 2.3 kcal/mol, which clearly demonstrates that Tyr106 rotation and the Thr87-phosphate hydrogen-bond formation are energetically coupled. Moreover, once this hydrogen-bond is formed, the active configurations of the β4-α4 loop become much more accessible; i.e., the energy landscape along ΔRMSD becomes much flatter with the hydrogen-bond formed
Although the comparison of Fig.4a,b clearly illustrates the energetic coupling between Tyr106 rotation and Thr87-phosphate hydrogen-bond formation, and the TPS results suggest that Tyr106 rotation does not have to rely on the displacement of Thr87, whether Tyr106 rotation is intrinsically a low-barrier process remains to be clarified. This is analyzed by the 2D free energy surface for ΔRMSD and Tyr106-χ with the Thr87-phosphate hydrogen-bond unformed (Dhb > 4.0 Å ). Fig.4c clearly shows two local minima: basin with ΔRMSD > 0 and χ < 90° (Tyr106 “in”) whereas basin with ΔRMSD > 0 and χ > 180° (Tyr106 “out”). Consistent with the TPS results, even without major displacement of Thr87, Tyr106 isomerization has only a modest barrier of ∼ 4.8 kcal/mol although it is energetically unfavorable by ∼ 2.1 kcal/mol.
Finally, to explicitly define the relationship between Tyr106 rotation and Thr87-phosphate hydrogen-bond formation, the 2D free energy is calculated for χ and Dhb, with the β4 − α4 loop in the inactive configuration (because the complete loop transition can be shown to occur last, see below). As shown in Fig.4d, there are four basins that correspond to the four expected metastable states: , , , ; the relative stabilities of the four basins are not exactly identical to those sampled in the three 2D-PMFs discussed above because the overall structure of the protein has subtle differences (see Caption of Fig.4). Nevertheless, the thermodynamic coupling between Tyr106 rotation and Thr87-phosphate hydrogen-bond formation is qualitatively captured; e.g., the Tyr106 rotation is energetically unfavorable without the Thr87-phosphate hydrogen-bond and becomes nearly thermoneutral with the hydrogen-bond formed. More importantly, the two extreme pathways (Tyr106 rotation occurs first vs. Thr87-phosphate hydrogen-bond forms first) are separated by a high barrier, which argues against a concerted mechanism, and both of them have a barrier lower than 7 kcal/mol.
The free energy results can be pieced together to explain the activation mechanism of CheY. As shown in Fig.5, the activation process can be described in terms of movement on a cube with three dimensions corresponding to the three reaction coordinates. The starting point is the inactive state with the β4-α4 loop inactive (I), Tyr106 “out” (O) and the Thr87-phosphate hydrogen-bond unformed (U). The expected ending point, labeled as with the current notation, is the active state with all key structural motifs adopting the active configuration. According to Fig.4a,b, the activation of the β4-α4 loop is energetically very unfavorable (> 9.0 kcal/mol uphill) and therefore has to occur after Tyr106 rotation and formation of the Thr87-phospate hydrogen-bond. The latter two events are thermodynamically coupled (Fig.4a,b and 4d) but, kinetically, either can proceed first due to the similar barriers (4.8 vs. 7.0 kcal/mol).
FIG. 5.

A three-dimensional scheme that illustrates the energetics and possible pathways for CheY activation. The three PMFs are based on Fig.4, with the energy reference of each plot adjusted such that the energetics in diffierent PMFs are consistent; the PMF in Fig.4d is not shown for clarity. The expected fully-active state, , is not a local free-energy minima in the simulations, presumably due to the absence of the FliM peptide in the model.
In the current simulations, even following the Tyr106 rotation and Thr87-phosphate hydrogen-bond formation, a largely inactive configuration (ΔRMSD ∼0) of the β4-α4 loop is still preferred energetically over the fully active configuration. In other words, the most active-like structure identified in the simulations ( in Fig.5) differs from the crystal structure of the fully active CheY(1F4V26) regarding the configuration of the β4-α4 loop. However, we note that the crystal structure of the active CheY is bound to the FliM peptide; it is possible that the fully active β4-α4 loop is better stabilized by the binding of the FliM peptide, which is not included in the simulation model. Nevertheless, the calculated free energy difference between states and is ∼−0.1 kcal/mol, which is very reasonable considering the absence of the FliM peptide in the simulations.
III. DISCUSSION
In this study, TPS and free energy simulations are combined synergistically to probe the activation mechanism of a prototypical signaling protein at the atomic resolution, which has been difficult to achieve with experiments.2 By themselves, a limited number of unbiased transition trajectories are not sufficient for reaching conclusive statements regarding the activation mechanism. However, even a modest number (hundreds) of unbiased activation trajectories are valuable for revealing genuinely relevant degrees of freedom during the transition and for generating configurations in the barrier region. These information can be effectively incorporated into the subsequent free energy simulations, which explicitly address the energetic coupling between different local structural changes and the likely sequences of events.
A. “Y-T coupling” vs. “population shift”
As stated in Introduction, there are two competing models for the activation of CheY and other response regulators in two-component systems upon phosphorylation: (i). the traditional “Y-T coupling” model, which assumes that the displacement of Thr87 due to hydrogen-bond formation with the phosphoryl group proceeds the Tyr106 rotation; (ii). the “population shift” model, which argues that the Tyr106 rotation may occur prior to the Thr87 displacement (or even phosphorylation) and the role of phosphorylation (and hydrogen-bonding with Thr87) is to shift the population of Tyr106 sidechain rotamers towards the active (buried) state. Our TPS results clearly show that Tyr 106 rotation may occur independent of the Thr87-phosphate hydrogen-bond formation; this is in agreement with the observation of the “meta-active” CheY x-ray structure in which the Tyr106 adopts the buried conformer without any major displacement of Thr87 or phosphorylation.21 Free energy results further confirm that Tyr106 rotation in the absence of the Thr87-phosphate hydrogen-bond is at least as kinetically competitive as a pathway in which the hydrogen-bond forms first. Therefore, our results clearly argue against the tradition “Y-T” coupling scheme in its most strict sense. The results are consistent with the “population shift” description because the Tyr106 rotation is marginally unfavorable in energy (∼2.1 kcal/mol in Fig.4c) without the Thr87-phosphate hydrogen-bond and becomes more favorable (∼5.2 kcal/mol in Fig.5 according to the thermodynamic cycle in the scheme) with that hydrogen-bond formed. As additional connection with experimental studies of CheY activation, we note that the study of Schuster et al.27 found that the coupling between phosphorylation and substrate-peptide binding in CheY is only modestly reduced in the T87A mutant, confirming that Thr 87 does not play a decisive role in CheY activation. In fact, significant coupling remains even in the Y106A mutant,27 which is consistent with the idea that Tyr 106 isomerization is only modestly stabilized by phosphorylation through Thr87. In the NMR study of NtrC,5 motion associated with the equivalent Tyr was observed independent of phosphorylation, which led the interpretation that the isomerization of Tyr is already in equilibrium prior to phosphorylation and hardly perturbed by the phosphorylation event.
B. The role of the β4-α4 loop
Our previous biased MD simulations11 and the x-ray study that revealed the “meta-active” CheY21 suggested that the β4-α4 loop may gate the Tyr 106 rotation. In this work, the free energy and TPS results show that the β4-α4 loop transition has a much higher energy cost and only minimal adjustments (mainly associated with the sidechain orientation of Ala90) are needed to leave Tyr106 rotation sufficiently low in barrier. A recent work28 statistically analyzed all CheY structures in the PDB. Their results show that Tyr 106 rotation is required for the activation of the β4-α4 loop because the hydrogen-bonding interaction between the hydroxyl group of Tyr 106 and the backbone oxygen of Glu89 can only occur when Tyr 106 is buried. In other words, rather than the β4-α4 loop gating the Tyr106 rotation, it's more likely that Tyr106 rotation facilitates the activation of the β4-α4 loop; we note that a recent equilibrium MD simulation of CheY also found that the conformation of the β4-α4 loop depends on the orientation of the Tyr106 sidechain29. Consistent with this point of view, the active configurations of the β4-α4 loop become accessible in the simulations only after both Tyr 106 rotation and the Thr87-phosphate hydrogen-bond formation are completed (Fig. 4b), and it is possible that the fully active configuration of this loop is only highly populated in the presence of the FliM peptide.
C. General implications to signaling protein activation and allostery
Although the current work focuses on a small signaling protein with relatively localized structural transitions, the results and observations have implications to the analysis of signaling protein activation and allosteric transition in general.
First, from the technical perspective, this study clearly demonstrates the advantages of combining TPS and free energy simulations over the biased MD approach or structural studies alone. Without concrete energetic information, even a collection of biased MD trajectories or a set of x-ray structures may lead to incorrect conclusion about the importance of specific structural motifs and the causal relationship between processes. For example, our previous biased MD simulations11 and a structural study21 suggested that the β4 − α4 loop and the “doorway residues” (Ile 95, Val 108) play the role of gating Tyr106 rotation. This study, by contrast, finds that the “doorway residues” are unlikely crucial for the Tyr106 rotation and the β4 − α4 loop is, in fact, activated by the Tyr106 rotation. Although such problem with the interpretation of biased MD results is often cautioned in the literature,11,13,14 this work has provided a clear illustration on how artificially accelerated molecular dynamics simulations may lead to misleading results on subtle features of structural transition processes. The combination of TPS and free energy simulations provides a powerful alternative that should find value in the study of many allosteric systems including signaling proteins.
The detailed mechanistic discussion of CheY activation also reinforces the point emphasized by the “population shift” model of allostery2–4 that the relevant structural transitions do not have to occur in a highly ordered fashion, propagating from the activation (e.g., phosphorylation) site towards the response site, as assumed in many historical model of allostery.10 In other words, energetic coupling between different transitions doesn't necessarily imply any specific sequence of events, as exemplified in CheY by the relationship between the Tyr106 rotation and the Thr87-phosphate hydrogen-bond formation. Since biomolecules are highly dynamical systems,30 local structural transitions may occur in different orders and the completion of one transition can facilitate other transitions through energetic couplings. For some transitions, such as the β4 − α4 loop displacement and Tyr106 rotation in CheY, a definite causal relationship indeed exists but difficult to unravel based on experiments alone or biased simulations. In this regard, we emphasize that the “population shift” description, which is essentially a modern version of the MWC model,6 does not, by itself, provide any mechanistic information regarding how different transitions are energetically coupled and through what causal relations. Therefore, revealing how population of the active configuration at the response site is shifted by events at the activation site is the major challenge and a key step towards developing new strategies that manipulate the function of signaling proteins and other allosteric systems. In this regard, although unbiased simulations for very large scale structural transitions remain challenging, advanced computational analysis can already complement experimental studies by bringing physical insights12 regarding the energetic and dynamic characteristics31 of these system at multiple scales.11,15,16,32,33 With further improved computational hardwares and techniques,34–36 molecular simulations will be an indispensable tool for the analysis of diverse signaling proteins and other “tunable” biomolecules.
IV. MATERIALS AND METHODS
A. Simulation Setup
Two crystal structures (PDB code 1JBE21 and 1F4V26) are taken as the structures of inactive and active CheY, respectively. The hydrogen atoms are added with HBUILD module37 in CHARMM program38 and the phosphate group and Mg2+ ions are added to Asp57 of the inactive structure to phosphorylate the inactive state in silico. The protein atoms and Mg2+ ions are described with the all-atom CHARMM2239 force field for proteins and the water molecules are described with the modified TIP3P model.40 In all simulations including TPS and free energy simulations, we start with the phosphorylated structure and set up the system with the stochastic boundary condition. CheY molecule is partitioned into a 20 Å inner region centered at the geometric center of heavy atoms of residue 87 to 106 and the remaining portion of the system as the outer region. The inner region is solvated with explicit water molecules and can be further divided into a 16 Å molecular dynamics region following Newtonian equation-of-motion and a 16 Å to 20 Å buffer region that obeys Langevin dynamics with a thermal bath of 300K.41 All the atoms in the inner region are subject to a weak GEO type of restraining potential to keep them inside the inner sphere with the MMFP module of CHARMM; the effect of restraint on most inner region atoms is negligible. All protein atoms in the buffer region are harmonically restrained with force constraints derived directly from the B-factors in the PDB file.41 Langevin atoms are updated heuristically during the simulation to consistently treat protein groups and water molecules that may switch regions during the simulation. All bonds involving hydrogen are constrained using the SHAKE algorithm42 to allow a time step of 2 fs. Non-bonded interactions within the inner sphere are treated with the extended electrostatics model, in which groups beyond 12 Å interact as multipoles.43 To account for the electrostatics between the inner and outer region and the effect of solvation, the generalized solvent boundary potential (GSBP) approach developed by Roux and co-workers is used44,45. The static field due to the outer region atoms is evaluated with the linear Poisson-Boltzmann equation using a focusing scheme that places a 70 Å cube of fine grid (0.4 Å) into a larger 120 Å cube of coarse grid (1.2 Å). The reaction field matrix in GSBP is evaluated using 256 spherical harmonics. In the Poisson-Boltzmann calculations, the protein dielectric constant of 1, the water dielectric constant of 80, and salt concentration of 0.0 M are used. The optimized radii of Roux and Nina46,47 are adopted to define the solvent-solute dielectric boundary. We note that previous studies have shown that the use of a GSBP protocol has little perturbation on processes localized at the center of the spherical region.48 Indeed, if one compares the flexibility of the β4 − α4 loop, which is of major interest in this study, the behavior found in the GSBP simulations is very similar to previous unconstrained simulations with explicit solvent11 (see Supporting Information).
B. Transition path sampling protocols
Transition path sampling employs a combination of Molecular Dynamics (MD) and Monte Carlo (MC) simulations. It samples the path phase space using MD and accepts or rejects the paths using MC procedures to obtain the transition path ensemble.22,23
Generation of an initial trajectory
To generate the initial trajectory as the input for TPS, biased MD is carried out by imposing a harmonic constraint on the backbone atoms of residue 85 to 109 and the heavy atoms of residue 105 with a force constant of 1000.0 kcal/(mol·Å2). As a result, the CheY molecule is pulled from the inactive/phosphorylated state to the active/phosphorylated state, resulting in a 20 ps non-natural activation trajectory. During this trajectory, χ angle shows a dramatic transition from the inactive basin to the active basin at around 8−9 ps. Several intermediate structures in this region are selected and 10 trial trajectories with each lasting 50 ps are carried out to roughly estimate their committor PB (the probability to reach the second basin). One intermediate structure at 8.8 ps of the biasing trajectory shows a PB =0.4 and simulations are initiated from this structure both forward and backward in time with a velocity distribution at 300K. This generates a 24.8 ps natural reactive trajectory that connects two basins and this natural trajectory is used as the initial input for the subsequent TPS shooting algorithm.
Harvest of unbiased trajectories
The shooting algorithm for stochastic dynamics as implemented24 in CHARMM is employed to harvest unbiased activation trajectories starting with the initial trajectory described above. The trajectory is regarded as reactive if it starts from one basin and ends in the other with the χ angle making transition between ∼30−90° and ∼150−210°. In total 410 trajectories are sampled and 163 reactive trajectories constituting the transition path ensemble are collected with an acceptance ratio of 39.7%. Each reactive trajectory lasts ∼24.8 ps. Based on the analysis of τmol and correlation between different reactive trajectories (see Supporting Information), these trajectories are sufficiently long for describing Tyr106 transition, which is the process of interest here. For more diffusive type of motions, such as the β4 − α4 loop transition, it is likely that substantially longer activation trajectories are needed; this once again highlights the importance of supplementing TPS studies with relevant free energy simulations.
C. Free energy simulations
Umbrella sampling is employed to explore the 2D free energy profiles composed of two of the three variables: ΔRMSD of all non-hydrogen atoms of the β4-α4 loop, the Tyr106 χ angle and the Thr87-phosphate hydrogen-bond distance, Dhb. Procedures used to generate the starting structures for the PMFs shown in Fig.4 are described in detail in Supporting Information. Altogether, there are 416, 256, 280 and 182 windows for Fig.4a-d, respectively.
For each window, the restraining potential wj on a reaction coordinate Dj (ΔRMSD, χ or Dhb) is given as:
| (1) |
where Dj,min specifies the position of the minimum of the umbrella potential in a specific window. The reaction coordinate ΔRMSD is defined as the difference between the heavy-atom-RMSD values for the β4-α4 loop in an instantaneous structure (Xt) relative to the two reference structures (Xactive and Xinactive),
| (2) |
The force constant KRMSD, KDhb, Kχ is gradually reduced from 1000 kcal/(mol·Å2), 500 kcal/(mol·Å2), 1000 kcal/(mol·rad2), to 50 kcal/(mol·Å2), 25 kcal/(mol·Å2), 50 kcal/(mol·rad2) in the 100 ps equilibration simulation for each window and then kept fixed for another 500 ps (Fig.4a-4c) or 1 ns (Fig.4d) of production simulation. The reaction coordinate values from the last 300 ps (Fig.4-4c) or 200 ps (Fig.4d) of each window are used for analysis and the 2-D Weighted histogram Analysis Method (WHAM)49,50 is employed to obtain the 2-D free energy surfaces.
Supplementary Material
Acknowledgments
This work is partially supported by a grant from the National Institutes of Health (R01-GM071428-02). Q.C. is an Alfred P. Sloan Research Fellow. Computational resources from the National Center for Supercomputing Applications at the University of Illinois are greatly appreciated.
Footnotes
Supporting Information
The details of the transition path sampling (TPS) and convergence of free energy simulations as well as the full reference for Ref.39 are included.
References
- 1.Alberts B, Bray D, Lewis J, Raff M, Roberts K, Watson JD. Mol Biol of the cell. Garland Publishing, Inc.; 1994. [Google Scholar]
- 2.Kern D, Zuiderweg ERP. Curr Opin Struct Biol. 2003;13:748. doi: 10.1016/j.sbi.2003.10.008. [DOI] [PubMed] [Google Scholar]
- 3.Gunasekaran K, Ma B, Nussinov R. Proteins. 2004;57:433. doi: 10.1002/prot.20232. [DOI] [PubMed] [Google Scholar]
- 4.Swain JF, Gierasch LM. Curr Opin Struct Biol. 2006;16:102. doi: 10.1016/j.sbi.2006.01.003. [DOI] [PubMed] [Google Scholar]
- 5.Volkman BF, Lipson D, Wemmer DE, Kern D. Science. 2001;291:2429. doi: 10.1126/science.291.5512.2429. [DOI] [PubMed] [Google Scholar]
- 6.Monod J, Wyman J, Changenux J-P. J Mol Biol. 1965;12:88. doi: 10.1016/s0022-2836(65)80285-6. [DOI] [PubMed] [Google Scholar]
- 7.Koshland JDE, Nemethy G, Filmer D. Biochemistry. 1966;1:365. doi: 10.1021/bi00865a047. [DOI] [PubMed] [Google Scholar]
- 8.Eaton WA, Henry ER, Hofrichter J, Mozzarelli A. Nat Struct Biol. 1999;6:351. doi: 10.1038/7586. [DOI] [PubMed] [Google Scholar]
- 9.Szabo A, Karplus M. J Mol Biol. 1972;72:163. doi: 10.1016/0022-2836(72)90077-0. [DOI] [PubMed] [Google Scholar]
- 10.Perutz MF. Nature. 1970;228:726. doi: 10.1038/228726a0. [DOI] [PubMed] [Google Scholar]
- 11.Formaneck MS, Ma L, Cui Q. Proteins. 2006;63:846. doi: 10.1002/prot.20893. [DOI] [PubMed] [Google Scholar]
- 12.Karplus M, Kuriyan J. Proc Natl Acad Sci USA. 2005;102:6679. doi: 10.1073/pnas.0408930102. [DOI] [PMC free article] [PubMed] [Google Scholar]
- 13.Ma J, Karplus M. Proc Natl Acad Sci USA. 1997;94:11905. doi: 10.1073/pnas.94.22.11905. [DOI] [PMC free article] [PubMed] [Google Scholar]
- 14.Ma J, Sigler PB, Xu Z, Karplus M. J Mol Biol. 2000;302:303. doi: 10.1006/jmbi.2000.4014. [DOI] [PubMed] [Google Scholar]
- 15.Banavali NK, Roux B. Structure. 2005;13:1715. doi: 10.1016/j.str.2005.09.005. [DOI] [PubMed] [Google Scholar]
- 16.Radhakrishnan R, Schlick T. Proc Natl Acad Sci USA. 2004;101:5970. doi: 10.1073/pnas.0308585101. [DOI] [PMC free article] [PubMed] [Google Scholar]
- 17.Stock AM, Robinson VL, Goudreau PN. Annu Rev Biochem. 2000;69:183. doi: 10.1146/annurev.biochem.69.1.183. [DOI] [PubMed] [Google Scholar]
- 18.Cho HS, Lee SY, Yan DL, Pan XY, Parkinson JS, Kustu S, Wemmer DE, Pelton JG. J Mol Biol. 2000;297:543. doi: 10.1006/jmbi.2000.3595. [DOI] [PubMed] [Google Scholar]
- 19.Barak R, Eisenbach M. Biochemistry. 1992;31:1821. doi: 10.1021/bi00121a034. [DOI] [PubMed] [Google Scholar]
- 20.Appleby JL, Bourret RB. J Bacter. 1998;180:3563. doi: 10.1128/jb.180.14.3563-3569.1998. [DOI] [PMC free article] [PubMed] [Google Scholar]
- 21.Simonovic M, Volz K. J Biol Chem. 2001;276:28637. doi: 10.1074/jbc.C100295200. [DOI] [PubMed] [Google Scholar]
- 22.Dellago C, Bolhuis PG, Geissler PL. Adv Chem Phys. 2002;123:1. doi: 10.1146/annurev.physchem.53.082301.113146. [DOI] [PubMed] [Google Scholar]
- 23.Bolhuis PG, Chandler D, Dellago C, Geissler PL. Annu Rev Phys Chem. 2002;53:291. doi: 10.1146/annurev.physchem.53.082301.113146. [DOI] [PubMed] [Google Scholar]
- 24.Hagan MF, Dinner AR, Chandler D, Chakraborty AK. Proc Natl Acad Sci USA. 2003;100:13922. doi: 10.1073/pnas.2036378100. [DOI] [PMC free article] [PubMed] [Google Scholar]
- 25.Zhu XY, Rebello J, Matsumura P, Volz K. J Biol Chem. 1997;272:5000. doi: 10.1074/jbc.272.8.5000. [DOI] [PubMed] [Google Scholar]
- 26.Lee SY, Cho HS, Pelton JG, Yan DL, Henderson RK, King DS, Huang LS, Kustu S, Berry EA, Wemmer DE. Nat Struct Biol. 2001;8:52. doi: 10.1038/83053. [DOI] [PubMed] [Google Scholar]
- 27.Schuster M, Silversmith RE, Bourret RB. Proc. Acad. Natl. Sci. U.S.A. 2001;98:6003. doi: 10.1073/pnas.101571298. [DOI] [PMC free article] [PubMed] [Google Scholar]
- 28.Dyer CM, Dahlquist FW. J Bacter. 2006;188:7354. doi: 10.1128/JB.00637-06. [DOI] [PMC free article] [PubMed] [Google Scholar]
- 29.Knaggs MH, Salsbury FR, Jr., Edgell MH, Fetrow JS. Biophys. J. 2007;92:2062. doi: 10.1529/biophysj.106.081950. [DOI] [PMC free article] [PubMed] [Google Scholar]
- 30.Brooks CL, III, Karplus M, Pettitt BM. Proteins: A theoretical perspective of dynamics, structure, and thermodynamics. Wiley and Sons; New York: 1988. [Google Scholar]
- 31.Jardetzky O. Prog Biophys Mol Biol. 1996;65:171. doi: 10.1016/s0079-6107(96)00010-7. [DOI] [PubMed] [Google Scholar]
- 32.Daily MD, Gray JJ. Proteins. 2007;67:385. doi: 10.1002/prot.21300. [DOI] [PubMed] [Google Scholar]
- 33.Yu H, Ma L, Yang Y, Cui Q. PLoS Comput Biol. 2007;3:214. doi: 10.1371/journal.pcbi.0030023. [DOI] [PMC free article] [PubMed] [Google Scholar]
- 34.Hamelberg D, Mongan J, McCammon JA. J. Chem. Phys. 2004;120:11919. doi: 10.1063/1.1755656. [DOI] [PubMed] [Google Scholar]
- 35.Faradjian AK, Elber R. J. Chem. Phys. 2004;120:10880. doi: 10.1063/1.1738640. [DOI] [PubMed] [Google Scholar]
- 36.Juraszek J, Bolhuis PG. Proc Natl Acad Sci USA. 2006;103:15859. doi: 10.1073/pnas.0606692103. [DOI] [PMC free article] [PubMed] [Google Scholar]
- 37.Brunger AT, Karplus M. Proteins. 1988;4:148. doi: 10.1002/prot.340040208. [DOI] [PubMed] [Google Scholar]
- 38.Brooks BR, Bruccoleri RE, Olafson BD, States DJ, Swaminathan S, Karplus M. J Comput Chem. 1983;4:187. [Google Scholar]
- 39.MacKerell AD, Jr, et al. Karplus M. J. Phys. Chem. B. 1998;102:3586. doi: 10.1021/jp973084f. [DOI] [PubMed] [Google Scholar]
- 40.Jorgensen WL, Chandrasekhar J, Madura JD, Impey RW, Klein ML. J Chem Phys. 1983;79:926. [Google Scholar]
- 41.Brooks CL, Karplus M. J Mol Biol. 1989;208:159. doi: 10.1016/0022-2836(89)90093-4. [DOI] [PubMed] [Google Scholar]
- 42.Ryckaert JP, Ciccotti G, Berendsen HJC. J Comput Phys. 1977;23:327. [Google Scholar]
- 43.Steinbach PJ, Brooks BR. J Comput Chem. 1994;15:667. [Google Scholar]
- 44.Beglov D, Roux B. J Chem Phys. 1994;100:9050. [Google Scholar]
- 45.Im W, Berneche S, Roux B. J Chem Phys. 2001;114:2924. [Google Scholar]
- 46.Nina M, Beglov D, Roux B. J Phys Chem B. 1997;101:5239. [Google Scholar]
- 47.Nina M, Im W, Roux B. Biophys Chem. 1999;78:89. doi: 10.1016/s0301-4622(98)00236-1. [DOI] [PubMed] [Google Scholar]
- 48.Riccardi D, Cui Q. J. Phys. Chem. A. 2007;(DFTB issue) In press. [Google Scholar]
- 49.Kumar S, Bouzida D, Swendsen RH, Kollman PA, Rosenberg JM. J Comput Chem. 1992;13:1011. [Google Scholar]
- 50.Kumar S, Rosenberg JM, Bouzida D, Swendsen RH, Kollman PA. J Comput Chem. 1995;16:1339. [Google Scholar]
- 51.Humphrey W, Dalke A, Schulten K. J Mol Graph. 1996;14:33. doi: 10.1016/0263-7855(96)00018-5. [DOI] [PubMed] [Google Scholar]
Associated Data
This section collects any data citations, data availability statements, or supplementary materials included in this article.