

Abstract
Rationale and Objectives: Magnetic resonance (MR) imaging is used to assess brain tumor response to therapies and a MR quality assurance program is necessary for multicenter clinical trials employing imaging. This study was performed to determine overall variability of quantitative image metrics measured with the American College of Radiology (ACR) phantom among 11 sites participating in the Pediatric Brain Tumor Consortium (PBTC) Neuroimaging Center (NIC) MR quality assurance (MR QA) program.
Materials and Methods
An MR QA program was implemented among 11 participating PBTC sites and quarterly evaluations of scanner performance for seven imaging metrics defined by the ACR were sought and subject to statistical evaluation over a 4.5 year period. Overall compliance with the QA program, means, standard deviations and coefficients of variation (CV) for the quantitative imaging metrics were evaluated.
Results
Quantitative measures of the seven imaging metrics were generally within ACR recommended guidelines for all sites. Compliance improved as the study progressed. Inter-site variabilities as gauged by coefficients of variation (CV) for slice thickness and geometric accuracy, imaging parameters that influence size and/or positioning measurements in tumor studies, were on the order of 10 % and 1% respectively.
Conclusion
Although challenging to establish, MR QA programs within the context of PBTC multi-site clinical trials when based on the ACR MR phantom program can a) indicate sites performing below acceptable image quality levels and b) establish levels of precision through instrumental variabilities that are relevant to quantitative image analyses, e.g. tumor volume changes.
Keywords: Magnetic resonance, quality assurance, pediatric brain tumor, American College of Radiology
Introduction
Among children aged 0-19 years, the incidence rate for pediatric brain tumors was 29.1 cases per 1,000,000 from 1996-2003. (1) Given these statistics, efforts to accrue sufficient numbers of patients for investigating more effective treatment strategies must hinge largely on multicenter trials, a defining feature of the NIH-funded Pediatric Brain Tumor Consortium (PBTC), established in 1999. Comprised of 10 major pediatric brain tumor research centers and the Neuro-Oncology Branch of the NCI, the PBTC broadened its mission in 2003 with the addition of the Neuroimaging Center (NIC) whose mission is three-fold: 1) to coordinate imaging research; 2) to provide imaging support for novel therapeutic trials; and 3) to develop a framework by which correlative imaging data is codified and uniformly applied to PBTC multicenter trials.
Equipped with relatively sophisticated neuroimaging capabilities and a commitment to neuroimaging research, the NIC is intensively engaged in facilitating quality assurance and promoting clinically relevant imaging research. (1) Specifically, imaging acquisition protocols aimed primarily at PET and MR must be continuously analyzed, modified, updated, and uniformly applied across institutions and within relevant trials. The importance of standardizing acquisition protocols among sites cannot be understated. Once protocols are standardized, tumor volume measurements, for example, typically calculated during most trials, can be compared reliably to those taken during similar or equivalent trials within the PBTC. In addition to standardizing imaging protocols, the NIC is assessing the variability of basic imaging metrics among the various PBTC instruments, gauging whether statistically significant differences exist, and determining whether these differences affect or skew findings within representative PBTC cohorts. An assessment of variability measures is an essential feature of any comprehensive QA program (2-7), and nowhere is this more evident than in the context of MR, in general, and in the efforts of the NIC, in particular.
In March 2003, PBTC neuroimaging specialists identified a need to develop MR imaging protocols that were at once relatively uniform, and sufficiently flexible to permit site-specific preferences. This group further reached consensus in the implementation of a MR QA program that would require participating sites to 1) scan the ACR phantom at quarterly intervals, 2) perform seven basic image analyses of ACR phantom data, and 3) report the findings to the PBTC NIC. The QA MR Program has been operational for the past 4.5 years; this report describes its implementation and results, as well as its potential to advance the overarching goals of the PBTC and NIC.
Materials and Methods
1. Overview of data collection guidelines
Eleven sites participated in the QA studies, with a collective 18, 1.5 T scanners: 11 General Electric scanners, 4 Siemens scanners, and 3 Phillips scanners. Of the eleven sites, one utilized three different vendors; five utilized two vendors; and the remaining five utilized a single vendor. Of the six sites with two or more scanners, only two sites had scanners from more than one manufacturer. The PBTC NIC chose the American College of Radiology (ACR) phantom as the primary imaging tool for the MR QA Program, procured by each site directly from the manufacturer (J.M. Specialty Parts, San Diego, CA). This phantom was scanned with site-specific T1-weighted and T2-weighted sequences according to the specifications outlined in the “Phantom Test Guidance” manual (2) and the “Site Scanning Instructions for Use of the MR Phantom for the ACR MRI Accreditation Program” manual provided by the ACR (3) Each site was instructed to scan the phantom at least quarterly with the T1-weighted spin echo sequence and T2-weighted fast spin echo (FSE) sequences used routinely for brain imaging of subjects enrolled in the PBTC. The precise sequence parameters for the T1-weighted spin echo sequence (TR/TE) and the T2-weighted fast spin echo sequence (TR/effective echo time/echo train length) were within specified ranges agreed upon by consensus at the March 2003 meeting (available on PBTC web site), varying marginally from site-so-site according to local neuroradiological practices. All site-specific sequences applied for the phantom studies did, however, conform to certain specifications described in the ACR manual for proper imaging of the ACR phantom. These included use of a field-of-view (FOV) of 25 cm2, a 256 × 256 image matrix, a slice thickness/gap combination of 5 mm/5 mm, and the prescription of 11 axial slice locations from a sagital localizer image of a properly positioned phantom. (2, 3)
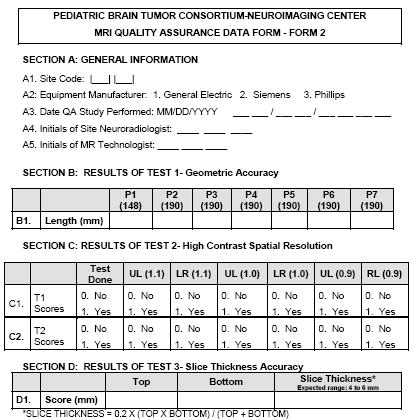
Image quality tests based on phantom data were performed with manufacturer-supplied software for measuring lengths and signal intensities from user-defined regions-of-interest within the images. Individual sites and technologists performing the ACR phantom imaging and data analysis were also encouraged to access an NIC instructional video distributed via the PBTC NIC web site (www.childrenshospital.org/research/pbtcnic). The video explained proper positioning and scanning of the phantom, presented guidelines for performing and interpreting each of the image quality tests, and provided instructions for recording quantitative findings on the MR QA data form. MR technologist(s) at each site performed the seven image quality tests which are decribed in detail in the ACR manuals (2,3) and briefly reviewed here.
1 ;Geometric accuracy test
This test involves measuring seven different lengths of high definition structures within the phantom from both an axial slice and one sagital slice. The lengths of the structures are provided in the first column of Table 1.
Table 1.
Results from the Geometric Accuracy Test from T1-weighted Images. ACR specifies that lengths should be with ± 2 mm of actual length shown in first column.
| Length (mm) | N | Mean | Standard Deviation | Min | Max | Coefficient Variation |
|---|---|---|---|---|---|---|
| P1 148 | 259 | 146.91 | 1.27 | 140.00 | 149.50 | 0.87 |
| P2 190 | 260 | 189.84 | 1.06 | 182.00 | 192.00 | 0.56 |
| P3 190 | 260 | 189.94 | 0.78 | 186.00 | 192.00 | 0.41 |
| P4 190 | 260 | 189.92 | 0.91 | 185.00 | 192.00 | 0.48 |
| P5 190 | 260 | 189.85 | 1.05 | 180.10 | 193.00 | 0.55 |
| P6 190 | 260 | 189.71 | 0.93 | 186.40 | 192.40 | 0.49 |
| P7 190 | 260 | 189.78 | 0.83 | 186.90 | 192.00 | 0.44 |
2; High contrast spatial resolution test
This test involves assessing whether small high definition bright dots can be resolved within grids in which the dots are separated by 1.1, 1.0 and 0.9 mm, respectively, as shown in Figure 1.
Figure 1.

A T1-weighted spin echo image of axial slice 1 of the ACR phantom from which three of the seven imaging tests are performed. Top arrow: Slice position test. Middle arrow: Slice thickness test. Lower arrow: High contrast spatial resolution grids.
3; Slice thickness accuracy
This test involves measurement of two lengths visible along two ramps (Figure 1) which are precisely angled through the slice selection direction and which then provide an estimate of the width of the slice selection profile.
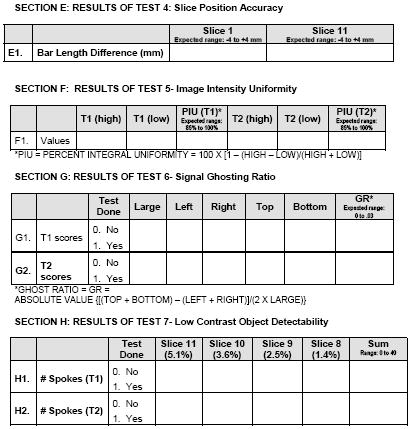
4; Slice position accuracy
This test involves measuring the length of a step between two vertical bars on slices 1 and 11 (Figure 1 showing this step gap on slice 1) which then provides an estimate of closely positioned the center of each slice is to where it has been proscribed.
5; Image intensity uniformity
This test involves measuring signal intensities from the brightest region and the darkest region within a nominally homogenous, structureless, slice of the phantom and using these measures to estimate the uniformity of the overall signal intensity.
6; Signal ghosting ratio
This test involves measuring signal intensities from regions within air outside of the phantom, along both the phase encoding and readout directions, as well as measurement of the full signal intensity from a large homogenous region with the phantom. The measurements reflect the extent of artifactual spatial signal spread, or signal “bleed” outside of the imaged object.
7; Low contrast object detectability
This test involves counting the number of spokes along 10-spoke wheels in which three low contrast circles can be visualized. There are four separate low contrast conditions in which the circles have estimated contrast values of 1.4 %, 2.5 %, 3.6 % and 5.1 % yielding a maximum number of countable spokes of 40.
2. Email Notification System for submission of MR QA Reports
It was required that the submission of MR QA data sheets to the PBTC NIC be done on a quarterly basis. To facilitate this process, the PBTC Operations & Biostatistics Center (OBC) (St. Jude’s Children’s Research Hospital) sent each site an automated weekly email reminder (over the course of six weeks at the beginning of each quarter) until the MR QA data was received by the NIC. Upon receipt, the PBTC NIC notified the OBC via an online system that a given site had sent the requested data. Once notified, the OBC removed any site that was in compliance from the email reminder list for that reporting period. This notification process automatically repeated itself for the next quarterly reporting period. Any site that was still out of compliance after the six-week notification cycle had ended was contacted by the NIC research coordinator by telephone.
3. Imaging Test Analysis
For each imaging test, the raw means and unadjusted confidence intervals are presented. Confidence intervals were included to indicate the precision of the estimate of the site mean. The distribution of each outcome, combining all sites, was examined graphically using histograms and boxplots as a summary test for normality. Approximate normality was judged by symmetry about a single mode and by the length and symmetry of the distribution tails.
An analysis of variance (ANOVA) model was used to test for overall differences between site means. ANOVA models used the GLM procedure in SAS version 9. Site, equipment manufacturer, and calendar year were treated as fixed effects since the main question of interest was whether the sites would differ significantly, controlling for any effects of year and manufacturer. An F-test was used to test the null hypothesis that the site means were identical. An F-test for a difference of site means determines whether the observed means are sufficiently different not to have occurred by chance. If the test rejects the null hypothesis (i.e. p<0.05), then at least one of the site means differs significantly from the rest. ANOVA residuals were examined for normality with histograms. Overall variability of the different image metrics was assessed using the coefficient of variation, CV in %, as calculated from the ratio of the standard deviation divided by the mean and multiplied by 100.
To access the sensitivity of the ANOVA results for differences in site means to the influence of outlier observations, all observations outside of two standard deviations from the overall mean were removed; the ANOVA models were then recomputed and compared with the results using the full dataset. The Wilcoxon rank-sums test was also used as a nonparametric method for comparing the site means.
Results
A total of 263 QA scans were performed, analyzed, and used for statistical evaluation. General Electric (GE Medical Systems, Milwaukee, Wisconsin) MR scanners were used for 70% of the scans (185 of 263); Siemens (Erlangen, Germany ) MR scanners for 21% (56 of 263); and Phillips (Phillips Medical Systems, Best, Netherlands) MR scanners for 8% (22 of 263). The number of scans per site ranged from two to 105 (mean 23.9, SD 28.3, median 14) and a compliance rate was calculated for each site based on an expectation of 18 quarterly scans per MRI scanner. The overall compliance rate for each of the 11 sites over the four and one-half year study period is shown in Figure 2, and demonstrates variable degrees of compliance with a mean of 60%. The compliance rate in the first two years of the study was lower than later in the study, 41% vs 75%, respectively.
Figure 2.

Bar graph showing the % compliance for each site as based on a perfect score of 12 scans per MRI scanner over the 4.5 year period.
Results for the geometric accuracy test are provided in Table 1. The coefficients of variation for all seven-length measurements within the phantom as made from the T1-weighted images were less than 1% and the mean lengths were within 2 mm of the true values displayed in the first column of Table 1.
Results for the high contrast spatial resolution test are provided in Table 2. Both the T1- and T2-weighted images are designed to have nominal in-plane spatial resolutions of 1.0 mm; over 94% of all tests successfully resolved the 1.0 mm grid patterns. However, success rates were substantially lower for the 0.9 mm grid patterns, with the T2-weighted image success rates (38 to 39%) being lower than the T1-weighted image success rates (54 to 58%).
Table 2.
High Contrast Spatial Resolution Results from the T1- and T2-weighted Images from the Lower Right (LR) and Upper Left (UL) Grids at the Three Separate Spatial Resolutions 1.1, 1.0 and 0.9 mm provided in the ACR Phantom. ACR specifies that a 1 mm resolution should be regularly achieved with the settings employed for this test.
| Scores | T1 Percent Test Success | T2 Percent Test Success |
|---|---|---|
| LR (1.1) | 100 | 100 |
| UL (1.1) | 100 | 100 |
| LR (1.0) | 97 | 94 |
| UL (1.0) | 98 | 98 |
| RL (0.9) | 58 | 38 |
| UL (0.9) | 54 | 39 |
Results for the slice thickness accuracy test are shown in Figure 3 and the the expected thickness of 5.00 mm is close to the overall mean value of 5.07 mm (SD 0.52) with a coefficient of variation of 10% (Table 3). Mean scores were statistically different between sites (p = 0.033).
Figure 3.

Results from the slice thickness accuracy test as measured from all 11 sites with a 5 mm thickness being the perfect score. Box plots are used to summarize the observed data for this test and the other tests described in the figures below. The boxes show the 25th, 50th, and 75th percentile of the distribution of scores. Box plot whiskers extend from each end of the box (that is, from the 25th and 75th percentiles) to the most extreme observed values within 1.5 times the box length. Observations beyond these limits may be outliers; each of these is displayed individually with dots. The box plots include reference lines for plus and minus two standard deviations from the overall mean. These lines indicate the range over which the vast majority of observations appeared.
Table 3.
MR QA Summary Statistics for the remaining five imaging tests. The ACR recommended specifications for the various test values are provided in the last column.
| Measure | N | Mean (95%CI) | Standard Deviation | Coefficient Variation | Median | Min | Max | ACR specs |
|---|---|---|---|---|---|---|---|---|
| Slice thickness accuracy | 261 | 5.07 (5.00, 5.13) | 0.52 | 10.34 | 5.05 | 3.83 | 7.97 | 5 ± 0.7 mm |
| Slice 1 position accuracy | 262 | 1.98 (1.69, 2.28) | 2.40 | 121.00 | 2.00 | -5.00 | 9.00 | < 5 mm |
| Slice 11 position accuracy | 263 | 1.69 (1.42, 1.95) | 2.17 | 128.81 | 1.60 | -6.00 | 8.00 | < 5 mm |
| T1 percent integral uniformity | 261 | 94.60 (94.22, 94.98) | 3.09 | 3.27 | 95.20 | 70.32 | 99.95 | > 87.5 % |
| T2 percent integral uniformity | 259 | 94.28 (93.94, 94.62) | 2.77 | 2.94 | 94.80 | 70.37 | 99.80 | > 87.5 % |
| T1 signal ghosting ratio | 260 | 0.0024 (0.0021, 0.0028) | 0.0030 | 125.39 | 0.0014 | -0.0018 | 0.0240 | < 0.025 |
| T2 signal ghosting ratio | 256 | 0.0054 (0.0046, 0.0063) | 0.0068 | 125.85 | 0.0036 | -0.0067 | 0.0500 | < 0.025 |
| T1 low contrast detectability | 263 | 36.62 (36.19, 37.05) | 3.53 | 9.65 | 37.00 | 13.00 | 40.00 | > 9 |
| T2 low contrast detectability | 260 | 33.68 (32.98, 34.38) | 5.75 | 17.08 | 35.00 | 1.00 | 40.00 | > 9 |
Results for the slice position accuracy tests for slices 1 and 11 are shown in Figures 4 a and b. The overall mean score for slices 1 and 11 were 1.98 mm (SD 2.40) and 1.69 mm (SD 2.17), respectively (Table 3). Site means were significantly different for each of these scores (both p<0.001).
Figure 4.


Results from the slice position accuracy test for a: slice 1 position accuracy and b: slice 11 position accuracy as from all 11 sites as summarized by box plots described in Figure 3 legend. The actual score measured in this case is twice the actual slice position offset, in mm, and a perfect score for this test is 0 mm. Measurements were made from the T1-weighted images only.
Results for the percent image intensity uniformity for T1- and T2-weighted imaging are shown in Figures 5 a and b. For T1-weighted imaging, the overall mean score was 94.60% (SD 3.09) while for T2-weighted imaging, the overall mean score was 94.28% (SD 2.77) (Table 3). Site means were significantly different for each of these scores (p<0.001). Results for the signal ghosting ratios for T1- and T2-weighted imaging are shown in Figures 6 a and b. For T1-weighted imaging, the overall mean score was 0.0024 (SD 0.0030)and for T2-weighted imaging, the overall mean score was 0.0054 (SD 0.0068) (Table 3), both below the recommended ghosting maximum levels of 0.025. Site means were not significantly different for the T1 ghosting ratio (p=.16) but were different for the T2 ratio (p=.02).
Figure 5.


Results from the percent image uniformity for a: T1-weighted images and b: T2-weighted images from all 11 sites as summarized by box plots described in Figure 3 legend. The score here is a dimensionless quantity which reflects how uniform the signal over a large FOV is with 100 % being the perfect score.
Figure 6.


Results from ghosting ratio test for a: T1-weighted images and b: T2-weighted images from all 11 sites as summarized by box plots described in Figure 3 legend. The score here is a dimensionless quantity reflecting the difference between phase and frequency encoded ghosting or signal bleed along those directions with a perfect score being 0.
Results from the low contrast detectability tests for T1- and T2-weighted imaging are shown in Figures 7 a and b. For T1-weighted imaging, the overall mean score was 36.62 (SD 3.53) and for T2-weighted imaging, the overall mean score was 33.68 (SD 5.75) (Table 3). Site means were significantly different for these scores (each p<0.001) .
Figure 7.


Results from the low contrast detectability tests for a: for T1-weighted images and b: T2-weighted images from all 11 sites as summarized by box plots described in Figure 3 legend. The score reflects the number of complete spokes out of 40 possible, which have been clearly identified.
Tables 1-3 summarize the statistics from all the imaging tests described above. As a test of sensitivity of these results to outliers, observations outside two standard deviations from the overall mean were removed from the data, which reduced the size of the data by approximately 5%. Inferences from models using the reduced data were consistent with results from the full datasets. The only exception was for T1 signal ghosting ratio, where the site means were significantly different from each other (p<0.001, respectively) when using the reduced dataset. Site means were also compared with the nonparametric rank-sum test. Means were significantly different (p<.001) for each measure in Table 3 with either the full or reduced datasets.
Discussion
Quality assurance programs (2, 3, 5-7) are important for multicenter trials with neuroimaging components, such as those incorporated by the PBTC for assessing brain tumor treatment efficacies, and by others for monitoring normal brain development (4). Results from a QA program may aid in identifying sites with inadequate imaging technologies by using, for example, established confidence limits of the imaging metrics that are being uniformly applied across center protocols. To date, we have not used the results from this study to identify underperforming sites as, generally speaking, most image metrics were within the ACR specified recommendations (Tables 1-3). Of equal importance, MR QA results can be used to place limits on the levels of precision associated with quantitative measurements of image analyses within a given trial. For example, although this study showed that all scanners acquiring data for the PBTC were typically performing within the specifications outlined by the ACR, not all scanners were necessarily performing in a strictly uniform fashion. Indeed, the ANOVA analyses suggest significant differences in site means for many of the imaging metrics being utilized within the PBTC. We now consider how the measured variability of each of the imaging metrics among the sites, as well as overall compliance with the QA program, might affect specific findings or conclusions drawn from PBTC neuroimaging trials.
1. Compliance
The extent to which participating sites comply with QA testing of multicenter trials drives our collective ability to derive meaningful values for the variability of any given imaging metric. Though no single approach can assure compliance, a mix of strategies may encourage cooperation. Sites that consistently fail to adhere to QA processes and procedures can be removed from a given study or, in situations that are more serious, dedicated funds may be withheld. Other strategies, such as the one adopted by the PBTC NIC, may entail a regular stream of automated e-mails, follow-up phone calls, and educational materials. Specifically, the NIC provided each site with customized MR QA data sheets, access to NIC MR QA staff, an educational video, and standard ACR phantom scanning manuals. With this firm but friendly approach, compliance as measured over the full 4.5 year period varied among sites, as shown by Figure 1, and was generally better in the latter half of the study than in the first half of the study (75% vs 41%). Though it is difficult to attribute improved compliance over time to any single intervention, it is reasonable to assume that familiarity with the ACR phantom testing procedures, automated e-mail reminders, the educational video and persistent communication between NIC MR QA staff and individual sites all contributed to improving overall compliance.
2. Geometric accuracy
The geometric accuracy test used for this study assesses the reliability of in-plane length measurements in T1-weighted spin-echo sequences and so places limits on the precision of, for example, how reliably a tumor volume might be measured or how accurately specific regions for stereotactic radiation treatment plans can be identified. The geometric accuracy tests among our sites were highly uniform, with coefficients of variation less than 1%. These results suggest that in-plane dimensions of sizeable, conspicuous structures can be measured down to approximately ±1 mm, the mean standard deviation of all seven measurements.
3. High Contrast
The high contrast spatial resolution tests, as performed, determine the ability of the scanners to resolve small, high contrast structures at 1.1, 1.0 and 0.9 mm separations, respectively. In the context of brain tumor imaging, high contrast spatial resolution is important for detecting small nodules associated with the primary tumor or with leptomeningeal seeding. It is also helpful in locating implanted seeds used for brachytherapy treatments and thus facilitates tissue dose estimates. With standard ACR phantom testing, the FOV and image matrix are designed to yield a nominal spatial resolution of 1.0 mm, demonstrated in over 92% of all scans performed at our 11 sites. Predictably, all sites had some difficulty in resolving the 0.9 mm separation structures using these parameters, which was particularly evident on the T2- vs the T1-weighted images. The disparity between T2- and T1-weighted images may be attributable to the degraded point spread function associated with T2-decay effects on the k-space lines of the raw data acquired with the fast spin echo sequences generally used for T2-weighted imaging. (8-10) In the event a given site reports a repeated failure to achieve the specified 1 mm high contrast spatial resolution, NIC MR Staff may recommend sequence modifications such as reducing echo train lengths to ameliorate the problem, barring an underlying hardware fault.
4. Slice Thickness
Slice thickness, like geometric accuracy, can affect the precision and accuracy of volume measurements as well as the ability to identify specific target locations and/or sizes for potential therapies. Among our sites, the slice thickness coefficient of variation averaged approximately 10%, a calculation derived solely from T1-weighted images. It is worth noting that T1 slice thickness variability, while considerably higher than that generated by the geometric accuracy test, entails not only more complex windowing of the image data, but also considerable subjective judgment on the part of the operator in selecting the actual “edges” of the signal drop along the angled wedge used for taking measurements. (2, 3) Since tumor volumes are often estimated by multiplying a circumscribed two-dimensional area on an image by the slice thickness, the slice thickness variability in our study would indicate precision limits of approximately 10% for tumor volume measurements among the sites.
5. Slice Position Accuracy
Variability of slice position accuracy, derived as ½ of the actual raw score measured in the tests (2,3), was on the order of 1 mm among all sites. Hence, submillimeter limits should not be applied when targeting tumor locations for image-guided biopsies or targeted therapies, given the current imaging protocols and established limits of the existing equipment.
6. Image Intensity Uniformity
Image intensity uniformity is an important image metric in the context of advanced brain imaging techniques. For example, contrast enhancement, as measured either quantitatively in dynamic contrast enhancement (DCE) studies of brain perfusion and/or permeability (11-13), or as qualitatively documented, is influenced by inherent non-uniformities in image signal intensity across a field-of-view. It is thus desirable for all sites to produce sufficiently high and relatively similar image intensity uniformities. Detailed knowledge of image intensity uniformity also plays an important role in calculating quantitative gel dosimetry measurements (14) utilized in radiation treatment planning. In addition, image intensity uniformity will likely be influenced by the growing use of multiple-receiver coil arrays and associated parallel imaging techniques. (15) T1- and T2-weighted imaging at our sites achieved an average image intensity uniformity of 95%; substantially exceeding the ACR suggested guideline of 87.5% for 1.5 T scanners. Significantly, at 2% to 3%, the coefficient of variation for the image intensity uniformity tests was quite small.
Achieving concordant image intensity data largely hinges on utilizing similar field strength and head coil technology—specifically, a quadrature transmit/receive coil for scanning the ACR phantom at 1.5 T. As head coil technology evolves, increasing numbers of manufacturers are producing multi-element receiver coils with higher signal-to-noise characteristics, but with less homogeneity. In fact, a number of our sites have transitioned to such “receive only” multi-element coils for brain imaging while continuing to scan the ACR phantom with the quadrature coil, representing a limitation of our study which will persist as the studies continue and is compounded by the fact that some of the newer multi-coil element configurations have diameters and/or lengths which do not accommodate the ACR phantom. Certainly the relatively high image intensity uniformity and concordance we have achieved among our sites will not be as reproducible in the setting of new coil technology and high field systems such as 3T. Hence, we must likely reconsider how this basic test is to be performed and reported in the future, perhaps even performing the image intensity uniformity tests with smaller, homogeneous signal phantoms that can be readily scanned with the newer multi-coil element arrays.
7. Ghosting Ratios
The ability to minimize artifactual masking of subtle and not-so-subtle disease hinges on achieving low ghosting ratios for primary imaging sequences. Artifactual signal ghosting could easily affect tumor volume measurements and assessments of tissue boundaries in general. ACR guidelines specify ghosting ratios of less than 0.025; over the study period reported here, our mean values for both T1 and T2-weighted ghosting ratios were well below this guideline. Ghosting ratios are generated by subtracting noise along the phase encode direction from noise along the frequency encode direction and so are, to some degree, a measure of system instability as opposed to an inverse signal-to-noise ratio (SNR). Interestingly, SNR is not an ACR-defined image metric, though it may be evaluated from the ghosting ratio raw data.
Ghosting ratios produced by T2-weighted imaging are typically higher than those generated by T1-weighted imaging—the likely byproduct of fast spin echo sequences with subsequent ghosting along the phase encode direction. (8-10) Moreover, ANOVA tests found no significant site variability for the ghosting ratio of the T1-weighted images, but did show some significant site variations for the T2-weighted imaging, no doubt attributable to the application of different sequence parameters for T2-weighted FSE imaging as well as varying echo train lengths and spacing. This variability, in retrospect, is not surprising given some flexibility permitted each site in protocol implementation. Despite this variability, mean ghosting ratios, as mentioned above, were well below the ACR suggested guideline of 0.025
8. Low Contrast Detectability
Low contrast detectability will, in many cases, play a role in assessing subtle differences in contrast between tumor and edema as well as determining marginally enhancing tissue from background. The low contrast measurements made with the ACR phantom yield a maximum score of 40 completely visualized spokes. Among our sites, values in the mid to high 30’s for both the T1- and T2-weighted images were generated. Although significant site mean differences emerged, all sites provided measurements well above the ACR-recommended value of 10 completely visualized spokes. (2, 3) However, this test is somewhat subjective as it relies on the visual acuity and perception of the individual reader. This may explain the relatively high coefficients of variation of approximately 10 and 17%, respectively, for the T1- and T2-weighted images. Interestingly, no correlation was found between the low contrast detectability scores and the slice positioning accuracy test, though poor slice positioning might affect the count of visible spokes. This finding suggests human error in slice positioning was not a major factor in the present study. In addition, no correlation was found between low contrast detectability scores and ghost ratio scores. Since significant ghosting throughout an object can reduce low contrast detectability, the fact that there is no correlation between ghost ratio and low contrast detectability is reassuring and perhaps indicative of scanners operatingat technically sufficient levels for this metric.
There are a number of limitations of the present study that are both conceptual and technical in nature. In the first category, a more sophisticated MR QA design might be envisioned to assess imaging metrics related to advanced neuroimaging studies currently available for tumor studies. For example, dynamic contrast enhancement (DCE) studies, quantitative relaxation time studies, diffusion imaging (e.g. diffusion weighted imaging, diffusion tensor imaging), functional MR imaging (fMRI), spectroscopic imaging and magnetic resonance angiography (MRA) are all of interest in the context of tumor imaging yet none of the imaging metrics evaluated with standard ACR phantom methodology are designed to assess the measurement precision associated with these types of scans during a a multi-site trial. Technical challenges in phantom and phantom material design which would address appropriate image metrics for these various types of scans are being developed but are not widely available yet. (16,17) In addition, different motion correction schemes and reduced scan times with parallel imaging approaches which rely on multiple receiver coil technology are currently being implemented by the manufacturers and again, standard ACR phantom methodology for MR QA does not appear to readily meet the needs for assessing the impact of these factors on the precision of measurements made within the context of a multi-site trial. Finally, consideration of mixed field strengths among sites, primarily 1.5T and 3T scanners was not an issue in the original design of our study but now demands consideration as 3T scanners become available for tumor studies within the PBTC fleet of scanners. The task of addressing all these issues is well beyond the scope of this work but they are certainly of interest as multi-site trials involving advanced neuroimaging MR methods for pediatric brain tumors continue to contribute to progress in the treatment of this disease.
Conclusion
The variability observed for any given imaging test from any one scanner over time will arise from both scanner instability (such as field drift, gradient miscalibration, radiofrequency inhomogeneity, receiver instabilities, etc.) as well as subjective measurement differences (such as counts of visible holes, lengths of slice profiles, etc.) intermittently made by one or more operators. These factors, taken separately and in combination, most probably account for site variability, rather than individual differences observed among the finely machined, but distinct, ACR phantoms. The primary goal of implementing a MR QA program in a multicenter trial is to establish the variability of imaging metrics used to estimate limits on the precision of quantitative measurements made within trials (i.e., tumor volume and/or locations for targeted therapies). In addition, these results can provide baseline criteria (above and beyond those set by the ACR) for establishing uniformly-applied standards of image quality for each trial, regardless of the scanner(s) being utilized.
Acknowledgments
We also wish to acknowledge the PBTC NIC neuroradiologists for their assistance in executing the MR QA program described herein: Dr. Robert Zimmerman (Children’s Hospital of Philadelphia), Dr. Soonmee Cha (University of California San Francisco), Dr. Charles Fitz (Children’s Hospital of Pittsburgh), Dr. Jill Hunter (Texas Children’s Hospital), Dr. James Provenzale (Duke University Medical Center), Dr. Dennis Shaw (Children’s Hospital Seattle) , Dr. L. Gilbert Vezina (Children’s National Medical Center), Dr. Delilah Burrowes (Children’s Memorial Hospital, Chicago), Dr. Richard Robertson (Children’s Hospital Boston), Dr. John Butman (NIH), and Dr. Fred Laningham (St. Jude Children’s Research Hospital). We thank Nancy Drinan for editorial assistance and Cynthia Dubé for manuscript preparation.
Supporting Grants This work was supported, by NIH grant U01 CA81457 for the Pediatric Brain Tumor Consortium (PBTC), the Pediatric Brain Tumor Foundation of the United States (PBTFUS), and American Lebanese Syrian Associated Charities.
Appendix
Pediatric Brain Tumor Consortium Neuroimaging Center MR Quality Assurance Form
Footnotes
Publisher's Disclaimer: This is a PDF file of an unedited manuscript that has been accepted for publication. As a service to our customers we are providing this early version of the manuscript. The manuscript will undergo copyediting, typesetting, and review of the resulting proof before it is published in its final citable form. Please note that during the production process errors may be discovered which could affect the content, and all legal disclaimers that apply to the journal pertain.
References
- 1.Ries L, Harkins D, Krapcho M. SEER Cancer Statistics Review, 1975-2003. Bethesda, MD: National Cancer Institute; 2006. [Google Scholar]
- 2.Phantom Test Guidance. 1891 Preston White Dr., Reston, VA: The American College of Radiology for the ACR MRI Accreditation Program; 2005. www.acr.org. [Google Scholar]
- 3.“Site Scanning Instructions for Use of the MR Phantom for the ACR MRI Accreditation Program”. 1891 Preston White Dr., Reston, VA: The American College of Radiology for the ACR MRI Accreditation Program; 2005. www.acr.org. [Google Scholar]
- 4.Evans AC. The NIH MRI study of normal brain development. NeuroImage. 2006;30:184–202. doi: 10.1016/j.neuroimage.2005.09.068. [DOI] [PubMed] [Google Scholar]
- 5.Lerski RA, de Certaines JD. Performance assessment and quality control in MRI by Eurospin test objects and protocols. Magnetic Resonance Imaging. 1993;11:817–833. doi: 10.1016/0730-725x(93)90199-n. [DOI] [PubMed] [Google Scholar]
- 6.Ihalainen T, Sipila O, Savolainen S. MRI quality control: six imagers studied using eleven unified image quality parameters. European Radiology. 2004;14:1859–1865. doi: 10.1007/s00330-004-2278-4. [DOI] [PubMed] [Google Scholar]
- 7.Colombo P, Baldassarri A, Del Corona M, Mascaro L, Strocchi S. Multicenter trial for the set-up of a MRI quality assurance programme. Magnetic Resonance Imaging. 2004;22:93–101. doi: 10.1016/j.mri.2003.04.001. [DOI] [PubMed] [Google Scholar]
- 8.Mulkern RV, Wong ST, Winalski C, Jolesz FA. Contrast manipulation and artifact assessment of 2D and 3D RARE sequences. Magnetic Resonance Imaging. 1990;8:557–566. doi: 10.1016/0730-725x(90)90132-l. [DOI] [PubMed] [Google Scholar]
- 9.Constable RT, Gore JC. The loss of small objects in variable TE imaging: implications for FSE, RARE, and EPI. Magn Reson Med. 1992;28:9–24. doi: 10.1002/mrm.1910280103. [DOI] [PubMed] [Google Scholar]
- 10.Melki PS, Jolesz FA, Mulkern RV. Partial RF echo planar imaging with the FAISE method. I. Experimental and theoretical assessment of artifact. Magn Reson Med. 1992;26:328–341. doi: 10.1002/mrm.1910260212. [DOI] [PubMed] [Google Scholar]
- 11.Huisman TA, Sorensen AG. Perfusion-weighted magnetic resonance imaging of the brain: techniques and application in children. European Radiology. 2004;14:59–72. doi: 10.1007/s00330-003-1972-y. [DOI] [PubMed] [Google Scholar]
- 12.Wu O, Ostergaard L, Sorensen AG. Technical aspects of perfusion-weighted imaging. Neuroimaging Clinics of North America. 2005;15:623–637. xi. doi: 10.1016/j.nic.2005.08.009. [DOI] [PubMed] [Google Scholar]
- 13.Provenzale JM, York G, Moya MG, et al. Correlation of relative permeability and relative cerebral blood volume in high-grade cerebral neoplasms. AJR. 2006;187:1036–1042. doi: 10.2214/AJR.04.0676. [DOI] [PubMed] [Google Scholar]
- 14.Magnusson P, Olsson LE. Image analysis methods for assessing levels of image plane nonuniformity and stochastic noise in a magnetic resonance image of a homogeneous phantom. Medical Physics. 2000;27:1980–1994. doi: 10.1118/1.1286593. [DOI] [PubMed] [Google Scholar]
- 15.Heidemann RM, Ozsarlak O, Parizel PM, et al. A brief review of parallel magnetic resonance imaging. European Radiology. 2003;13:2323–2337. doi: 10.1007/s00330-003-1992-7. [DOI] [PubMed] [Google Scholar]
- 16.Olsrud J, Nilsson A, Mannfolk P, Waites A, Stahlberg F. A two-compartment gel phantom for optimization and quality assurance in clinical BOLD fMRI. Magn Reson Imag. 2008;26:279–286. doi: 10.1016/j.mri.2007.06.010. [DOI] [PubMed] [Google Scholar]
- 17.Mattila S, Renvall V, Hiltunen J, et al. Phantom-based evaluation of geometric distortions in functional magnetic resonance and diffusion tensor imaging. Magn Reson Med. 2007;57:754–763. doi: 10.1002/mrm.21218. [DOI] [PubMed] [Google Scholar]