

Abstract
Purpose and Design
Mechanism(s) by which the multi-kinase inhibitor sorafenib and the histone deacetylase inhibitor vorinostat interact to kill hepatic, renal and pancreatic adenocarcinoma cells have been defined.
Results
Low doses of sorafenib and vorinostat interacted in vitro in a synergistic fashion to kill hepatic, renal and pancreatic adenocarcinoma cells in multiple short term viability (24–96h) and in long term colony formation assays. Cell killing was suppressed by inhibition of cathepsin proteases and caspase 8, and to a lesser extent by inhibition of caspase 9. Twenty four hours after exposure, the activities of ERK1/2, AKT and NFκB were only modestly modulated by sorafenib and vorinostat treatment. However, 24h after exposure, sorafenib and vorinostat- treated cells exhibited markedly diminished expression of c-FLIP-s, full length BID, BCL-2, BCLXL, MCL-1, XIAP, increased expression of BIM, and increased activation of BAX, BAK and BAD. Expression of eIF2α S51A blocked sorafenib and vorinostat –induced suppression of c-FLIP-s levels and over-expression of c-FLIP-s abolished lethality. Sorafenib and vorinostat treatment increased surface levels of CD95 and CD95 association with caspase 8. Knock down of CD95 or FADD expression significantly reduced sorafenib / vorinostat -mediated lethality.
Conclusions
These data demonstrate that combined exposure of epithelial tumor cell types to sorafenib and vorinostat diminishes expression of multiple anti-apoptotic proteins, promotes activation of the CD95 extrinsic apoptotic and the lysosomal protease pathways, and that suppression of c-FLIP-s expression represents a critical event in transduction of the pro-apoptotic signals from CD95 to promote mitochondrial dysfunction and death.
Keywords: Vorinostat, Sorafenib, CD95, c-FLIP-s, caspase 8, cathepsin, cell death
Introduction
In the United States, hepatoma is diagnosed in ~ 19,000 patients per annum with ~ 17,000 deaths from the disease, with a 5 year survival rate of less than 10%. Hepatoma is a leading cause of diagnosed cancer in Africa and Asia and represents the fifth most commonly diagnosed malignancy in the World (1, 2). In the United States, pancreatic and renal cancer are diagnosed in ~ 37,000 and ~31,000 patients per annum, respectively, with ~ 34,000 and ~13,000 deaths from each disease every year (1, 2). Pancreatic and renal cancers have 5 year survival rates of less than 5% and of 5–10%, respectively. These statistics emphasize the need to develop novel therapies against these lethal malignancies.
The Raf / mitogen-activated protein kinase (MAPK) kinase 1/2 (MEK1/2) / extracellular signal–regulated kinase 1/2 (ERK1/2) pathway is frequently dysregulated in neoplastic transformation (3–5). The MEK1/2- ERK1/2 module comprises, along with c-Jun NH2-terminal kinase (JNK1/2) and p38 MAPK, members of the MAPK super-family. These kinases are involved in responses to diverse mitogens and environmental stresses, including DNA damage, osmotic stress, and hypoxia, among others, and have also been implicated in multiple cellular functions, including proliferation, differentiation, and cell survival processes. Although exceptions exist, activation of the ERK1/2 pathway is generally associated with cell survival whereas induction of JNK1/2 and p38 MAPK pathways generally signals apoptosis. There is also evidence that the net balance of signals related to the amplitude and duration of the cytoprotective ERK1/2 and the stress-related JNK1/2 and p38 MAPK pathways determines whether a cell lives or dies following various insults (3–5). Although the mechanism(s) by which ERK1/2 activation promotes survival is not known with certainty, several downstream anti-apoptotic effector proteins have been identified, including direct inactivation of pro-apoptotic proteins such as caspase-9, BAD and BIM, and increased expression of anti-apoptotic proteins such as BCL-XL, MCL-1 and c-FLIP proteins (6–11). In view of the importance of the RAF-MEK1/2-ERK1/2 pathway in neoplastic cell survival, clinically relevant inhibitors have been developed and have now entered clinical trials, including sorafenib (Bay 43-9006, Nexavar®; a Raf kinase inhibitor) and AZD6244 (a MEK1/2 inhibitor) (12, 13).
Sorafenib is a multi-kinase inhibitor that was originally developed as an inhibitor of Raf-1, but which was subsequently shown to inhibit multiple other kinases, including platelet-derived growth factor, vascular endothelial growth factor receptors 1 and 2, c-Kit and FLT3 (14). Anti-tumor effects of sorafenib in renal cell carcinoma and in hepatoma have been ascribed to anti-angiogenic actions of this agent through inhibition of multiple growth factor receptors (15–17). However, several groups, including our own, have shown in vitro that sorafenib kills human leukemia cells at concentrations below those achievable in the plasma, e.g., a Cmax of 15–20 µM, through a mechanism involving down-regulation of the anti-apoptotic BCL-2 family member MCL-1 (18, 19). In these studies sorafenib-mediated MCL-1 down-regulation occurred through a translational rather than a transcriptional or post-translational process that was mediated by endoplasmic reticulum (ER) stress signaling (20, 21). This suggests that the previously observed anti-tumor effects of sorafenib are partially mediated by a complex combination of inhibition of Raf family kinases and the ERK1/2 pathway; receptor tyrosine kinases that signal angiogenesis; and the induction of ER stress signaling.
Histone deacetylase inhibitors (HDACI) represent a class of agents that act by blocking histone de-acetylation, thereby modifying chromatin structure and gene transcription. HDACIs, along with histone acetyl-transferases, reciprocally regulate the acetylation status of the positively charged NH2-terminal histone tails of nucleosomes. In general, HDACIs promote histone acetylation and neutralization of positively charged lysine residues on histone tails, allowing chromatin to assume a more relaxed, open conformation, which favors gene transcription (22). However, HDACIs also induce acetylation of many other non-histone targets, actions that may have plieotropic biological consequences, including inhibition of HSP90 function, induction of oxidative injury, disruption of checkpoint control, and up-regulation of death receptor expression (23–25). With respect to combinatorial drug studies with a multi-kinase inhibitor such as sorafenib, HDACIs are of particular interest in that they also down-regulate / inactivate multiple oncogenic kinases by interfering with HSP90 function, leading to proteasomal degradation of these proteins. Vorinostat (suberoylanilide hydroxamic acid, SAHA, Zolinza™)is a hydroxamic acid HDACI that has shown preliminary pre-clinical evidence of activity in hepatoma and other malignancies with a Cmax of ~9 µM (26–28). Based on the single agent activity of sorafenib in hepatoma patients, as well as its approval for treatment of patients with renal cell carcinoma and hepatocellular carcinoma, and the fact that sorafenib and vorinostat target multiple overlapping pathways implicated in tumor cell survival, the possibility arose that a combined approach might be more effective than either agent administered individually. The present studies reveal that sorafenib and vorinostat interact in a highly synergistic manner to induce cell death in hepatoma, pancreatic, and renal cell carcinoma cells through multiple interacting mechanisms, most notably enhanced activation of the extrinsic apoptotic pathway.
Materials and Methods
Materials
Sorafenib and sorafenib tosylate (Bay 43-9006 and BAY 54-9085; Bayer) as well as vorinostat (Merck) were provided by the Cancer Treatment and Evaluation Program, National Cancer Institute/NIH (Bethesda, MD). Phospho-/total- (ERK1/2; JNK1/2; p38 MAPK) antibodies, phospho-/total-AKT (T308; S473) and the total and cleaved caspase 3 antibodies were purchased from Cell Signaling Technologies (Worcester, MA). Anti-BID and anti-cathepsin B antibodies were purchased from Cell Signaling Technologies (Worcester, MA). All the secondary antibodies (anti-rabbit-HRP, anti-mouse-HRP, and anti-goat-HRP) were purchased from Santa Cruz Biotechnology (Santa Cruz, CA). Enhanced chemi-luminescence (ECL) and TUNEL kits were purchased from NEN Life Science Products (NEN Life Science Products, Boston, MA) and Boehringer Mannheim (Manheim, Germany), respectively. Trypsin-EDTA, DMEM, RPMI, penicillin-streptomycin were purchased from GIBCOBRL (GIBCOBRL Life Technologies, Grand Island, NY). HEPG2, HEP3B, HuH7, A498, CAKI-1, Mia PaCa2, PANC1 cells were purchased from the ATCC. UOK121LN cells were kindly provided by Dr. Lineham Marston (National Institutes of Health, Bethesda, MD). BAK −/−, BAK −/−, BID −/− fibroblasts were kindly provided by Dr. S. Korsmeyer (Harvard University, Boston, MA). Commercially available validated short hairpin RNA molecules to knock down RNA / protein levels were from Qiagen (Valencia, CA): CD95 (SI02654463; SI03118255) and FADD (SI00300223; SI03648911). Reagents and performance of experimental procedures were in general as described in (20, 21, 29–33).
Methods
Culture and in vitro exposure of cells to drugs
All established cell lines were cultured at 37 °C (5% (v/v CO2) in vitro using RPMI supplemented with 5% (v/v) fetal calf serum and 10% (v/v) Non-essential amino acids. For short term cell killing assays, immunoblotting and AIF/cathepsin release studies, cells were plated at a density of 3 × 10³ per cm2 (~2 × 10⁵ cells per well of a 12 well plate) and 48h after plating treated with various drugs. Unless otherwise indicated, cells were plated in triplicate, and treated with vehicle (VEH, DMSO), sorafenib (Sor, 3.0 µM), vorinostat (Vor., 500 nM) or both sorafenib and vorinostat (Sor.+Vor.). In vitro vorinostat and sorafenib treatments were from 100 mM stock solutions of each drug and the maximal concentration of Vehicle (DMSO) in media was 0.02% (v/v). Cells were not cultured in reduced serum media during any study in this manuscript.
In vitro cell treatments, microscopy, SDS-PAGE and Western blot analysis
For in vitro analyses of short-term cell death effects, cells were treated with Vehicle or vorinostat / sorafenib for the indicated times in the Figure legends. For apoptosis assays where indicated, cells were pre-treated with vehicle (VEH, DMSO), zVAD (50 µM), calpain inhibitor (Acetyl-Calpastatin (aa184-210)) (5 µM) or Cathepsin B inhibitor ([L-3-trans-(Propylcarbamoyl)oxirane-2-carbonyl]-L-isoleucyl-L-proline Methyl ester) (1 µM); cells were isolated at the indicated times, and either subjected to trypan blue cell viability assay by counting in a light microscope or fixed to slides, and stained using a commercially available Diff Quick (Geimsa) assay kit. Alternatively, the Annexin V/propidium iodide assay was carried to determine cell viability out as per the manufacturer's instructions (BD PharMingen) using a Becton Dickinson FACScan flow cytometer (Mansfield, MA). Vorinostat / sorafenib lethality, as judged by annexin-PI, was first evident ~24h after drug exposure (data not shown).
For immunohistochemistry of cells fixed in situ; fixed cells were blocked 1 h with antibody dilution buffer (2 (v/v)% rat serum, 1 (w/v)% BSA in Dulbecco’s PBS), then incubated overnight at 4°C in antibody dilution buffer with addition of anti-CD95 antibody (2 µg/ml; Abcam). Cells were then washed and incubated 1 h with a 488nm-tagged secondary antibody (Invitrogen). Cells were washed, cover-slipped and analyzed on a fluorescent microscope (X100 magnification).
For SDS PAGE and immunoblotting, cells were plated at 5 × 10⁵ cells / cm2 and treated with drugs at the indicated concentrations and after the indicated time of treatment, lysed in whole-cell lysis buffer (0.5 M Tris-HCl, pH 6.8, 2%SDS, 10% glycerol, 1% β-mercaptoethanol, 0.02% bromophenol blue), and the samples were boiled for 30 min. The boiled samples were loaded onto 10–14% SDS-PAGE and electrophoresis was run overnight. Proteins were electrophoretically transferred onto 0.22 µm nitrocellulose, and immunoblotted with various primary antibodies against different proteins. All immunoblots were visualized by ECL. For presentation, immunoblots were digitally scanned at 600 dpi using Adobe PhotoShop CS2, and their color removed and Figures generated in MicroSoft PowerPoint.
Infection of cells with recombinant adenoviruses
Cells were plated at 3 × 10³ per cm2 in each well of a 12 well, 6 well or 60 mm plate. After plating (24h), cells were infected (hepatoma and pancreatic carcinoma; at a multiplicity of infection of 50; UOK121LN renal carcinoma at a multiplicity of infection of 400) with a control empty vector virus (CMV) and adenoviruses to express CRM A, c-FLIP-s, BCL-XL, XIAP or to express dominant negative AKT / MEK1 / IκB / caspase 9 or activated MEK1 / AKT (Vector Biolabs, Philadelphia, PA). Twenty four hours after infection cells were treated with the indicated concentrations of vorinostat / sorafenib and/or other drugs, and cell survival or changes in expression / protein phosphorylation determined 0–96h after drug treatment by trypan blue / TUNEL / flow cytometry assays and immunoblotting, respectively.
Transfection of cells with siRNA or with plasmids
For Plasmids
Cells were plated as described above and 24h after plating, transfected with a variety of constructs. For mouse embryonic fibroblasts (2–5µg) or other cell types (0.5µg) plasmids expressing a specific mRNA (or siRNA) or appropriate vector control plasmid DNA was diluted in 50µl serum-free and antibiotic-free medium (1 portion for each sample). Concurrently, 2µl Lipofectamine 2000 (Invitrogen), was diluted into 50µl of serum-free and antibiotic-free medium (1 portion for each sample). Diluted DNA was added to the diluted Lipofectamine 2000 for each sample and incubated at room temperature for 30 min. This mixture was added to each well / dish of cells containing 200µl serum-free and antibiotic-free medium for a total volume of 300 µl, and the cells were incubated for 4 h at 37 °C. An equal volume of 2x medium was then added to each well. Cells were incubated for 48h, then treated with vorinostat / sorafenib and subsequently analyzed.
For NFκB promoter-luciferase assays
Cells or MEFs were plated as described above and 24h after plating, transfected with either a control luciferase plasmid (1µg) + β-galactosidase (β-Gal) plasmid (15ng), or Luciferase plasmid with 4 × NFκB consensus binding sequences (1µg) + β-Gal plasmid (15ng) were incubated for 5 min in serum-free medium, then added to Gene Juice (EMD Biosciences, 2µl / condition), and incubated 15 min together at room temperature. This mixture was added to cells and incubated at 37°C for 24 h after which cells were treated with vorinostat / sorafenib for 0–24h, then washed 2x with PBS, and harvested in cell lysis buffer (25mM Tris phosphate pH 7.8, 2mM DTT, 2mM CDTA (trans-1,2-diaminocyclohexane- N,N,N’,N’-tetra-acetic acid), 10% glycerol and 1% (v/v) Triton X-100). The lysate was centrifuged for 5 min at 13,000 × g at 4 °C to pellet debris. The luciferase assay was performed according to the manufacturer’s instructions (Promega, Madison, WI). Briefly, luciferase substrate was brought to room temperature, then added to 20µl lysate and measured immediately on a Perkin Elmer luminometer. The luciferase measurement was normalized to β-Galactosidase measurement to control for transfection efficiency; 50µl 2x β-Galactosidase reagent (200 mM Na2HPO4/NaH2PO4, pH7.4, 2mM MgCl2, 200mM β-mercaptoethanol, 1.34 mg/mL O-nitrophenyl- β-D-Galactopyranoside) was added to 50µl cell lysate and incubated at 37 °C for 10 min. The product of the assay was measured at OD405.
Transfection with siRNA
Cells were plated in 60 mm dishes from a fresh culture growing in log phase as described above, and 24h after plating transfected. Prior to transfection, the medium was aspirated and 1 ml serum-free medium was added to each plate. For transfection, 10 nM of the annealed siRNA, the positive sense control doubled stranded siRNA targeting GAPDH or the negative control (a “scrambled” sequence with no significant homology to any known gene sequences from mouse, rat or human cell lines) were used. Ten nM siRNA (scrambled or experimental) was diluted in serum-free media. Four µl Hiperfect (Qiagen) was added to this mixture and the solution was mixed by pipetting up and down several times. This solution was incubated at room temp for 10 min, then added dropwise to each dish. The medium in each dish was swirled gently to mix, then incubated at 37 °C for 2h. One ml of 10% (v/v) serum-containing medium was added to each plate, and cells were incubated at 37 °C for 48h before re-plating (50 × 103 cells each) onto 12-well plates. Cells were allowed to attach overnight, then treated with vorinostat / sorafenib (0–48h). Trypan blue exclusion / TUNEL / flow cytometry assays and SDSPAGE/immunoblotting analyses were performed at the indicated time points.
Isolation of a crude cytosolic fraction
A crude membrane fraction was prepared from treated cells. Briefly, cells were washed twice in ice cold isotonic HEPES buffer (10 mM HEPES pH 7.5, 200 mM mannitol, 70 mM sucrose, 1 µM EGTA, 10 µM protease inhibitor cocktail (Sigma, St. Louis, MO). Cells on ice were scraped into isotonic HEPES buffer and lysed by passing 20 times through a 25 gauge needle. Large membrane pieces, organelles and unlysed cells were removed from the suspension by centrifugation for 5 min at 120 × g. The crude granular fraction and cytosolic fraction was obtained from by centrifugation for 30 min at 10,000 × g, leaving the cytosol as supernatant.
In vivo exposure of carcinoma tumors to drugs
Athymic female NCr-nu/nu mice were obtained from Jackson Laboratories (Bar Harbor, ME). Mice were maintained under pathogen-free conditions in facilities approved by the American Association for Accreditation of Laboratory Animal Care and in accordance with current regulations and standards of the U.S. Department of Agriculture, Washington, DC, the U.S. Department of Health and Human Services, Washington, DC, and the National Institutes of Health, Bethesda, MD. HEP3B cells were cultured and isolated by trypsinization followed by cell number determination using a hemacytometer. Cells were resuspended in phosphate buffered saline and ten million tumor cells per 100 µl PBS were injected into the right rear flank of each mouse, and tumors permitted for form to a volume of ~150 mm3 over the following 6 weeks. The tumor take rate for HEP3B tumors was approximately 20%. Vials of vorinostat (stored in a −20°C cold room under vacuum and protected from light; ~30mg / vial) were first dissolved in 30 µl of DMSO, diluted in sterile saline, and heated to boiling for complete dissolution before injection. Mice were administered 25 mg/kg vorinostat by oral gavage based on body mass (0.2 ml total volume per 30 g mouse). Animals received two more administrations of vorinostat, 24h apart for an additional 2 days. Sorafenib was administered 30min prior to the first vorinostat administration each day. Sorafenib tosylate (BAY 54-9085) was dissolved fresh each day. The dosing volume used is 0.3 ml / 30 g body weight. The compound was dissolved in a 50% Cremophor EL / 50% ethanol mixture. The mixture was heated to 60 °C and sonicated for 20 minutes to solubilize. Once the BAY 54-9085 entered solution, the aqueous component was added gradually and with mixing to generate the 1X dosing solution. Animals were administered with BAY 54-9085 for a final concentration of 45 mg/kg. Animals received two more administrations of vorinostat, 24h apart for an additional 2 days. Each animal not receiving a dose of sorafenib or vorinostat at the time of drug treatment was administered diluent alone in a volume equal to the amount given with the drug.
Ex vivo manipulation of tumors
Animals were euthanized by CO2 and placed in a BL2 cell culture hood on a sterile barrier mat. The bodies of the mice were soaked with 70% (v/v) EtOH and the skin around the tumor removed using small scissors, forceps and a disposable scalpel. These implements were flame sterilized between removal of the outer and inner layers of skin. A piece of the tumor (~50% by volume) was removed and placed in a 10 cm dish containing 5 ml of RPMI cell culture media, on ice. In parallel the remainder of the tumor was placed in 5 ml of Streck Tissue Fixative (Fisher Scientific, Middletown VA) in a 50 ml conical tube for H&E fixation. The tumor sample that had been placed in RPMI was minced with a sterile disposable scalpel into the smallest possible pieces then placed in a sterile disposable flask. The dish was rinsed with 6.5 ml of RPMI medium which was then added to the flask. A 10x solution of collagenase (Sigma, St. Louis MO; 2.5 ml, 28 U/ml final concentration) and 10x of enzyme mixture containing DNAse (Sigma, St. Louis MO; 308 U/ml final concentration) and pronase (EMD Sciences, San Diego CA; 22,500 U/ml final concentration) in a volume of 1 ml was added to the flask. The flasks were placed into an orbital shaking incubator at 37°C for 1.5 hours at 150 rpm. Following digestion, the solution was passed through a 0.4 µM filter into a 50 ml conical tube. After mixing, a sample was removed for viable and total cell counting using a hemacytometer. Cells were centrifuged at 500 × g for 4 min, the supernatant removed, and fresh RPMI media containing 10% (v/v) fetal calf serum was added to give a final resuspended cell concentration of 1 × 10⁶ cells / ml. Cells were diluted and plated in 10 cm dishes in triplicate at a concentration of 2–6 ×10 3 cells / dish for control, sorafenib and vorinostat treatments and 4–10 × 103 / dish for combined sorafenib and vorinostat exposure.
Immunohistochemistry and staining of fixed tumor sections
Post sacrifice, tumors were fixed in OCT compound (Tissue Tek); cryostat sectioned (Leica) as 12 µm sections. Nonspecific binding was blocked with a 2 % (v/v) Rat Sera, 1 % (v/v)Bovine Sera, 0.1% (v/v) Triton X100, 0.05% (v/v) Tween-20 solution then sections were stained for cell signaling pathway markers: Cleaved Caspase 3 (rabbit IgG, 1:100; Cell Signaling); Phospho-AKT 1/2/3 S473 (mouse IgG, 1:100; Santa Cruz); Phospho-ERK1/2 (mouse IgG, 1:100; Santa Cruz). For staining of sectioned tumors, primary antibodies were applied overnight, sections washed with phosphate buffer solution, and secondary antibodies applied for detection (as indicated in the Figure): goat antirat Alexa 488/647 (1:500; Invitrogen); goat anti-mouse Alexa 488/647 (1:500; Invitrogen) secondary antibody as per the primary antibody used; or, detected by way of di-aminobenzidine (DAB) substrate Peroxidase Detection Kit (Biogenex), as per the manufacturer’s instructions. Sections were then de-hydrated, cleared and mounted with cover-slips using DAPI mounting media (Vectastain). Apoptotic cells with double stranded DNA breaks were detected using the Upstate TUNEL Apototic Detection Kit according to the manufacturer’s instructions. Slides were applied to high powered light/confocal microscopes (Zeiss LSM 510 Meta-confocal scanning microscope; Zeiss HBO 100 microscope with Axio Cam MRm camera) at the indicated magnification in the Figure / Figure legend. The proliferation zone which included both tumor and normal tissue was usually selected as the site of interest, within 2mm of, or juxtaposed to leading edge of the tumor.
Data analysis
Comparison of the effects of various treatments was performed using ANOVA and the Student’s t test. Differences with a p-value of < 0.05 were considered statistically significant. Experiments shown are the means of multiple individual points (± SEM). Median dose effect isobologram analyses to determine synergism of drug interaction were performed according to the Methods of T-C Chou and P Talalay using the Calcusyn program for Windows (BIOSOFT, Cambridge, UK). Cells are treated with agents at a fixed concentration dose. A combination index (CI) value of less than 1.00 indicates synergy of interaction between the drugs; a value of 1.00 indicates additivity; a value of > 1.00 equates to antagonism of action between the agents.
Results
Treatment of human liver, pancreatic and kidney tumor cell lines with increasing low relatively concentrations of vorinostat and sorafenib at a fixed dose ratio resulted in a synergistic enhancement in tumor cell killing as measured by median dose effect long-term colony formation assays (Figure 1A Figure S1). Re-expression of the VHL protein in 786 renal carcinoma cells did not significantly alter the synergistic interaction of vorinostat and sorafenib (not shown). Additional studies, using a variety of short term cell killing assays, examined the interaction between vorinostat and sorafenib. In HEPG2 and UOK121LN cells, TUNEL, Annexin V – propidium iodide and trypan blue exclusion viability assays generated quantitatively and qualitatively similar data i.e., greater than additive induction of cell killing following low dose vorinostat and sorafenib exposure compared to either agent individually (Figures 1B and 1C; Figure S2). Substratum attachment did not alter the sensitivity of A498 cells to vorinostat and sorafenib exposure (not shown). Based on the findings in Figure 1, the molecular mechanisms by which vorinostat and sorafenib interacted to kill cells were then investigated.
Figure 1. Sorafenib and Vorinostat interact in a synergistic fashion to kill pancreatic, liver and kidney tumor cells in colony formation assays.


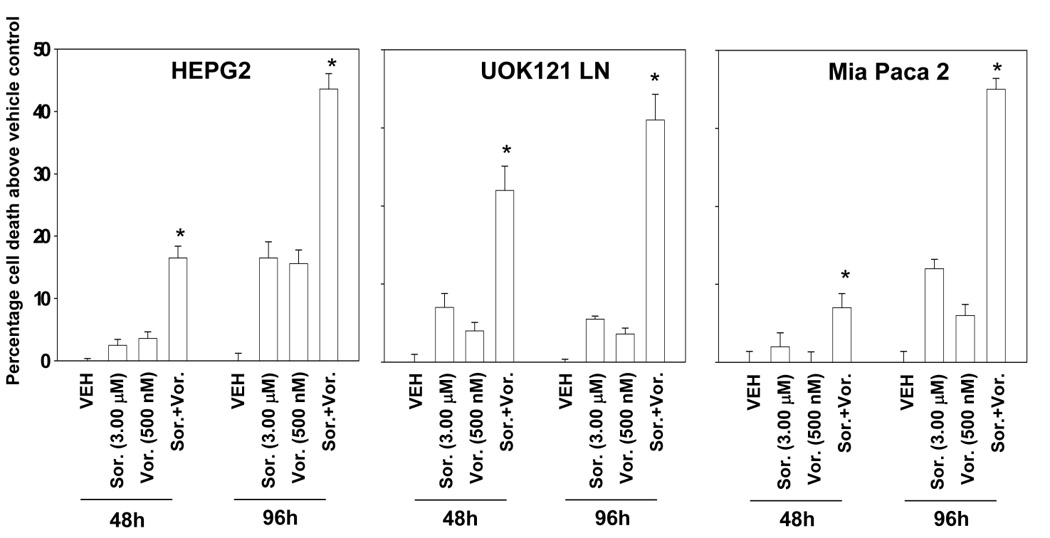
Panel A. Pancreatic (PANC-1, MiaPaca2) and hepatoma (HEP3B, HEPG2) cells were plated as single cells (250–1500 cells/well) in sextuplicate and 12h after plating treated with vehicle (VEH, DMSO), sorafenib (Sor., 3.0–6.0 µM) or vorinostat (Vor. 250–500 nM), or with both drugs combined, as indicated at a fixed concentration ratio to perform median dose effect analyses for the determination of synergy. After drug exposure (48h), the media was changed and cells cultured in drug free media for an additional 10–14 days. Cells were fixed, stained with crystal violet and colonies of > 50 cells / colony counted. The true percentage inhibition of colony formation is plotted from the means of sextuplicate plates from two separate experiments ± SEM (n = 3 total studies). * p < 0.05 greater cell killing than compared to any other treatment condition. Colony formation data were also entered into the Calcusyn program and combination index (CI) values determined. A CI value of less than 1.00 indicates synergy: CI values for PANC-1, MiaPaca2, HEP3B, HEPG2 were all below 0.70. Panel B. HEPG2 cells were plated in triplicate, treated with vehicle, sorafenib, vorinostat or both sorafenib and vorinostat. After drug exposure (48h) cells were isolated, and either: (a) spun onto glass slides and stained using established methods for double stranded DNA breaks indicative of apoptosis (TUNEL) as described in the Methods. The percentage of TUNEL positive cells ± SEM was determined. Data shown are from a representative of 3 independent studies. * p < 0.05 greater cell killing than compared to any other treatment condition; or (b) treated with annexin and propidium iodide according to manufacturer’s instructions, and stained using these established methods. Cells were subjected to flow cytometery to determine the numbers of annexin and propidium iodide positive cells ± SEM. Data shown are from a representative of 3 independent studies. * p < 0.05 greater cell killing than compared to any other treatment condition. Panel C. UOK121LN, Mia Paca2 and HEPG2 cells were plated in triplicate, treated with vehicle, sorafenib, vorinostat or both sorafenib and vorinostat. After drug exposure (48h, 96h) cells were isolated and stained using trypan blue indicative of later stages of cell death / plasma membrane disruption as described in the Methods. The percentage of trypan blue positive cells ± SEM was determined. Data shown are from a representative of 3 independent studies. * p < 0.05 greater cell killing than compared to any other treatment condition.
In HEPG2 and Mia PaCa 2 cells, pan-inhibition of caspase function using zVAD significantly reduced vorinostat and sorafenib lethality, as did inhibition of cathepsin protease function; in UOK121LN cells the relative role of caspases in the death process appeared to be greater than that of cathepsins (Figures 2A and 2B;Figure S3). Inhibition of caspase 8 function (e.g., by ectopic expression of CrmA) significantly reduced, to a greater extent than inhibition of caspase 9 (e.g. by ectopic expression of dn caspase 9), the lethality of vorinostat and sorafenib in our panel of tumor cells. Similar cell killing data after vorinostat and sorafenib treatment were obtained using the caspase 8 and caspase 9 inhibitors IETD and LEHD, respectively (not shown). Based on data showing that inhibition of caspase 8 and caspase 9 significantly reduced vorinostat and sorafenib lethality, genetically modified transformed mouse embryonic fibroblasts lacking expression of various cell survival modulator genes were employed. Combined loss of BAX and BAK function or loss of BID function significantly reduced vorinostat and sorafenib lethality in transformed fibroblasts (Figure 2C). These findings suggest that lysosomal dysfunction plays a role in the killing process and that caspase 8 signaling and the extrinsic pathway are also involved in vorinostat and sorafenib –induced transformed cell lethality.
Figure 2. Inhibition of caspase 8 and cathepsin function suppresses sorafenib and vorinostat lethality in GI tumor cells.


Panels A and B. HEPG2 and MiaPaca2 cells plated in triplicate, as indicated, were either treated with: left graphical panels, vehicle (DMSO), zVAD (25 µM), cathepsin inhibitor (1 µM) or zVAD and cathepsin inhibitor, or: right graphical panels, infected to express empty vector (CMV), dominant negative caspase 9, caspase 8 inhibitor CRM A or dominant negative caspase 9 and CRM A. Cells were treated with vehicle, sorafenib, vorinostat or both sorafenib and vorinostat. Ninety six hours after drug exposure, cells were isolated and viability determined by trypan blue assay. The percentage of trypan blue positive cells ± SEM was determined. Data shown are from the mean of 3 independent studies. # p < 0.05 less cell killing than compared to parallel condition in vehicle treatment cells. Panel C. SV40 Large T antigen transformed mouse embryonic fibroblasts lacking expression of various pro-apoptotic genes were plated in triplicate and treated with vehicle, sorafenib, vorinostat or both sorafenib and vorinostat. Forty eight hours after drug exposure, cells were isolated and viability determined by trypan blue assay. The percentage of trypan blue positive cells ± SEM was determined. Data shown are from the mean of 3 independent studies. # p < 0.05 less cell killing than compared to parallel condition in vehicle treatment cells.
To further define the processes of cell death, immunoblotting analyses in vorinostat- and sorafenib- treated HEPG2 and UOK121LN cells were performed (Figure 3). In UOK121LN cells, within 6h of combined, but not individual, drug exposure the expression of the pro-forms of BID, pro-caspase 8 and pro-caspase 3 (Figure 3A, section (i)) declined relative to vehicle control treated cells. These observations correlated with decreased expression of BCL-2 and c-FLIP-s (Figure 3A, section (ii)). The cleaved form of BID was poorly visualized by immunoblotting in all studies using this drug combination (not shown). Twenty four hours after drug exposure, the expression of BCL-2, BCL-XL, MCL-1, c-FLIP-s, BID, pro-caspase 8 and pro-caspase 3 had further declined after combined, but not individual, drug exposure (Figure 3A, sections (i) and (ii)).
Figure 3. Sorafenib and vorinostat treatment modulates the expression of c-FLIP-s, BCL-XL and MCL-1 in tumor cells.


Panel A. HEPG2 and UOK121LN cells were plated and treated 24h after plating with vehicle, sorafenib, vorinostat or both sorafenib and vorinostat. Six and 24 hours after drug exposure, cells were isolated and subjected to SDS PAGE followed by immunoblotting to determine the expression of BID, pro-caspase 8, pro-caspase 3, XIAP, BCL-2, BCL-XL, MCL-1, c-FLIP-s, P-eIF2α S51, GAPDH and ERK2. Data are from a representative study (n = 3). Panel B. HEPG2 cells infected to express empty vector (CMV), BCL-XL, XIAP or c-FLIP-s. Cells were treated with vehicle, sorafenib, vorinostat or both sorafenib and vorinostat. Ninety six hours after drug exposure, cells were isolated and viability determined by trypan blue assay. The percentage of trypan blue positive cells ± SEM was determined. Data shown are from the mean of 3 independent studies. # p < 0.05 less cell killing than compared to parallel condition in vehicle treatment cells. Inset panel upper right: HEPG2 cells were plated and treated 24h after plating with vehicle (DMSO), sorafenib (3.0 µM), vorinostat (500 nM) or both sorafenib and vorinostat. Six and 24 hours after drug exposure, cells were isolated and subjected to immunoprecipitation and/or SDS PAGE followed by immunoblotting to determine the expression of BIM, pro-caspase 8, BAD S112 phosphorylation, BAX activation, BAK activation and GAPDH. Data are from a representative study (n = 3). Panel C. UOK121LN cells were infected to express empty vector (CMV), BCL-XL, XIAP or c-FLIP-s. Cells were treated with vehicle (DMSO), sorafenib (3.0 µM), vorinostat (500 nM) or both sorafenib and vorinostat. Ninety six hours after drug exposure, cells were isolated and viability determined by trypan blue assay. The percentage of trypan blue positive cells ± SEM was determined. Data shown are from the mean of 3 independent studies. # p < 0.05 less cell killing than compared to parallel condition in vehicle treatment cells. Inset panel upper right: UOK121LN cells were plated and treated 24h after plating with vehicle, sorafenib, vorinostat or both sorafenib and vorinostat. Six and 24 hours after drug exposure, cells were isolated and subjected to immunoprecipitation and/or SDS PAGE followed by immunoblotting to determine the expression of BIM, pro-caspase 8, BAD S112 phosphorylation, BAX activation, BAK activation and GAPDH. Data are from a representative study (n = 3).
In HEPG2 cells, little obvious change in the expression of any protein was observed 6h after combined drug exposure with the exception of c-FLIP-s and pro-caspase 3, whereas 24h after combined, but not individual, vorinostat and sorafenib exposure, expression of BID, pro-caspase 8, pro-caspase 3, XIAP, BCL-2, BCL-XL, MCL-1, and c-FLIP-s were all reduced (Figure 3A, sections (i) and (ii)). In both HEPG2 and UOK121LN cells, decreased expression of pro-survival proteins correlated with increased phosphorylation of eIF2α S51; increased phosphorylation of eIF2α S51 is known to correlate with increased activity of this protein and with suppression of translation / initiation in cells (Figure 3A, section (ii)) (21). Similar immunoblotting data to that obtained in HEPG2 and UOK121LN cells in Figure 3A was obtained in MiaPaca2 cells (Figure S4). Of note, cell viability data obtained 24h after drug exposure argued that drug-treated tumor cells had just begun to display signs of cell death at this interval (e.g. time course data in Figure 1, not shown). Thus, the observed reductions in pro-survival protein expression occurred prior to significant manifestations of cell killing.
The ability of over-expression of proteins whose levels were reduced in Figure 3A to prevent cell killing was then tested. Over-expression of BCL-XL, XIAP or c-FLIP-s significantly reduced vorinostat and sorafenib lethality (Figures 3B and 3C). Whether the expression and/or activity of additional pro-apoptotic proteins correlated with increased cell killing was also determined. Treatment of cells with vorinostat and sorafenib increased the expression of BIM, including promotion of BIM dephosphorylation as well as the dephosphorylation of BAD S112 and the activation of BAX and BAK (Figures 3B and 3C, upper inset blotting panels). Based on data showing that c-FLIP-s over-expression largely abolished low dose vorinostat and sorafenib lethality, regardless of the fact that in parallel drug exposure also suppressed expression of multiple downstream pro-survival proteins and activated BAX and BAK, the possibility that vorinostat and sorafenib – induced killing was death receptor dependent, specifically CD95 (FAS receptor) –dependent, was explored.
Notably, knock down of FADD or CD95 expression significantly reduced the lethality of low dose combined vorinostat and sorafenib exposure in HEPG2 and UOK121LN cells (Figures 4A and 4B). Vorinostat and sorafenib exposure in HEPG2 and UOK121LN cells, in a cell type –dependent fashion, also enhanced expression of FAS-L and/or CD95 proteins as well (Figure S5). In addition, combined treatment of HEPG2 and UOK121LN cells with vorinostat and sorafenib promoted the rapid association of pro-caspase 8 with CD95 i.e. DISC complex formation (Figure 4C, upper section (i)). Knock down of CD95 abolished drug-induced procaspase 8 and BID cleavage in total cell lysates (not shown). Studies in primary hepatocytes treated with death-inducing natural compounds that act via CD95, such as toxic bile acids, have shown that these agents cause plasma membrane localization and clustering of CD95 as part of the receptor activation / hepatocyte killing process (34, 35). Treatment of HEPG2 cells with vorinostat and sorafenib caused increased plasma membrane localization of CD95 and the appearance of intense-staining punctate bodies containing CD95, demonstrative of CD95 clustering and its activation (Figure 4C, lower section (ii)). Note that in HEPG2 cells, CD95 activation and DISC formation occurred at time points without alteration in either total protein levels of CD95 or FAS-L / FAS-L cleavage, arguing that CD95 activation was ligand-independent. Over-expression of c-FLIP-s significantly suppressed vorinostat and sorafenib lethality as measured in TUNEL assays and markedly diminished cytochrome c release into the cytosol of HEPG2 cells (Figure S6).
Figure 4. Sorafenib and vorinostat interact to kill tumor cells via activation of CD95 and suppression of c-FLIP-s expression.


Panel A. HEPG2 cells were transfected with a non-specific scrambled control (siSCR) siRNA molecule, or molecules to knock down the expression of CD95 or FADD, according to the manufacturer’s instructions. Cells were treated 24h after transfection with vehicle, sorafenib, vorinostat or both sorafenib and vorinostat. Ninety six hours after drug exposure, cells were isolated and viability determined by trypan blue assay. The percentage of trypan blue positive cells ± SEM was determined. Data shown are from the mean of 3 independent studies. # p < 0.05 less cell killing than compared to parallel condition in vehicle treatment cells. Panel B. UOK121LN cells were transfected with a non-specific scrambled control (siSCR) siRNA molecule, or molecules to knock down the expression of CD95 or FADD, according to the manufacturer’s instructions. Cells were treated 24h after transfection with vehicle, sorafenib, vorinostat or both sorafenib and vorinostat. Ninety six hours after drug exposure, cells were isolated and viability determined by trypan blue assay. The percentage of trypan blue positive cells ± SEM was determined. Data shown are from the mean of 3 independent studies. # p < 0.05 less cell killing than compared to parallel condition in vehicle treatment cells. Panel C. Upper blotting panels: HEPG2 cells were plated and treated 24h after plating with vehicle or with sorafenib and vorinostat. Cells were isolated at the indicated time points after sorafenib and vorinostat exposure and CD95 immunoprecipitated from the cell lysate. SDS PAGE followed by immunoblotting of CD95 immunoprecipitates was performed to determine the association of pro-caspase 8 and caspase 8 with CD95. Data are from a representative study (n = 3). Lower immunohistochemistry panels: HEPG2 and UOK121LN cells were plated on glass slides and treated 24h after plating with vehicle (DMSO) or with sorafenib and vorinostat. Six hours after drug exposure, cells were fixed in situ. Fixed cells were blocked, incubated overnight with anti-CD95 antibody, then incubated with a 488nm-tagged fluorescent secondary antibody. Cells were analyzed on a fluorescent microscope (X100 mag.). The intensity of CD95 staining was determined at 50 random points per cell for a total of 5 cells ± SEM (n = 3 separate studies). Panel D. Blotting section: HEP3B cells were transfected with either an empty vector plasmid (CMV) or to express dominant negative eIF2α S51A. Twenty four hours after plating, cells were treated with vehicle (DMSO), or with sorafenib (S, 3.0 µM) and vorinostat (V, 500 nM). Cells were isolated 6h or 24h, as indicated, after drug exposure and the expression of c-FLIP-s, MCL-1 and GAPDH determined at each time point. A representative study (n = 2) is shown. Graphical Section: transformed mouse embryonic fibroblasts (wild type; expressing eIF2α S51A) were plated in triplicate and treated with vehicle, sorafenib, vorinostat or both sorafenib and vorinostat. Forty eight hours after drug exposure, cells were isolated and viability determined by trypan blue assay. The percentage of trypan blue positive cells ± SEM was determined. Data shown are from the mean of 3 independent studies. # p < 0.05 less cell killing than compared to parallel condition in vehicle treatment cells.
We next defined how low doses of combined exposure to vorinostat and sorafenib could rapidly suppress the expression of multiple pro-survival proteins. High doses of sorafenib, ≫ 3 µM as a single agent, have been shown by our laboratories to cause ER stress, translational inhibition, and reduced expression of MCL-1 that correlated with eIF2α phosphorylation (19, 21); in the present studies, lower doses of sorafenib (~3 µM) do not enhance eIF2α phosphorylation but did synergize with vorinostat to cause eIF2α phosphorylation. Expression of dominant negative eIF2α S51A abolished low dose combined sorafenib and vorinostat –induced suppression of c-FLIP-s and MCL-1 expression in HEP3B cells and expression of eIF2α S51A in transformed fibroblasts and in HEP3B cells suppressed the toxic interaction between sorafenib and vorinostat (Figure 4D; Figure S7). Over-expression of c-FLIP-s suppressed the synergistic lethality of vorinostat and sorafenib in median dose effect colony formation assays reducing the combination index (CI) value from ~0.45 to ~1.10 (Table 1). These findings argue that low doses of vorinostat and sorafenib induce activation of the extrinsic apoptotic pathway at the level of the CD95 death receptor, and that the initial rapid loss of c-FLIP-s expression with 24h occurs via activation of eIF2α, and plays a critical role in transmitting death signals from the plasma membrane to the cytosol, resulting in a plieotropic activation of multiple downstream apoptotic processes, including mitochondrial dysfunction.
Table 1. The synergy of killing by sorafenib and vorinostat is dependent upon loss of c-FLIP-s expression.
Pancreatic (MiaPaca2) and hepatoma (HEP3B) cells were infected to express empty vector (CMV) or c-FLIP-s. Twenty four hours after infection cells were plated as single cells (250–1500 cells/well) in sextuplicate and 12h after plating treated with vehicle (VEH, DMSO), sorafenib (Sor., 3.0–6.0 µM) or vorinostat (Vor. 250–500 nM), or with both drugs combined, as indicated at a fixed concentration ratio to perform median dose effect analyses for the determination of synergy. Forty eight hours after drug exposure, the media was changed and cells cultured in drug free media for an additional 10–14 days. Cells were fixed, stained with crystal violet and colonies of > 50 cells / colony counted. Colony formation data were also entered into the Calcusyn program and combination index (CI) and fraction affected (Fa) values determined. A CI value of less than 0.90–1.00 indicates synergy; a CI value of 0.90–1.10 approximates to additive interactions between the drugs; a CI value of above 1.10 indicates antagonism (n = 2 independent studies).
| MiaPaca2:CMV | Hep3B : CMV | ||||||
|---|---|---|---|---|---|---|---|
| Sor | Vor | Fa | Cl | Sor | Vor | Fa | Cl |
| (µM) | (µM) | (µM) | (µM) | ||||
| 3.00 | 0.250 | 0.34 | 0.32 | 3.0 | 0.250 | 0.43 | 0.47 |
| 4.50 | 0.375 | 0.42 | 0.40 | 4.5 | 0.375 | 0.56 | 0.58 |
| 6.00 | 0.500 | 0.50 | 0.45 | 6.0 | 0.500 | 0.74 | 0.58 |
| MiaPaca2:c-FLIP-s | Hep3B : c-FLIP-s | ||||||
| Sor | Vor | Fa | Cl | Sor | Vor | Fa | Cl |
| (µM) | (µM) | (µM) | (µM) | ||||
| 3.00 | 0.250 | 0.16 | 0.98 | 3.0 | 0.250 | 0.26 | 0.90 |
| 4.50 | 0.375 | 0.21 | 1.23 | 4.5 | 0.375 | 0.40 | 0.97 |
| 6.00 | 0.500 | 0.26 | 1.42 | 6.0 | 0.500 | 0.54 | 1.08 |
Sorafenib was originally developed as an inhibitor of Raf family protein kinases, but subsequently shown to be an inhibitor of several receptor tyrosine kinases and an inducer of ER stress signaling (12, 14, 21). Vorinostat has been shown to modulate in a concentration- and cell type- dependent manner ERK1/2, NFκB, AKT, JNK1/2 and p38 MAPK pathway signaling (23–25, 36–39). Furthermore, changes in NFκB, ERK1/2, AKT, JNK1/2 and p38 MAPK signaling have been linked to the modulation of CD95 function and that of c-FLIP-s, expression, also in a cell type dependent manner. These considerations prompted further examination of whether significant alterations in signaling pathway function occurred in vorinostat/sorafenib-treated cells and whether these changes could be related to CD95 activation, changes in apoptosis-regulatory protein expression, and overall tumor cell survival.
Twenty four hours after drug exposure, a time at which CD95 activation had occurred, eIF2α phosphorylation had occurred, and the expression of multiple pro-survival proteins such as c-FLIP-s had already declined, no profound change in the basal activities of ERK1/2, AKT, JNK1/2 or p38 MAPK were observed in HEPG2 or HEP3B cells (Figure 5A, section (i), not shown). Over the ensuing 72h, activation status of the JNK1/2 or p38 MAPK pathways did not correlate strongly with cell death induction. In contrast to signaling pathways that promote death, activities of pathways that protect against cell death began to decline in cells treated with vorinostat and sorafenib 24h–96h after drug exposure. Within 48h of exposure, ERK1/2 was inactivated in combined drug exposed cells; within 72h of exposure, AKT became inactivated. Inactivation of the ERK1/2 pathway was not due to the prior activation of CD95 or FADD, in view of the findings that knock down of CD95 or FADD suppressed cell killing but did not maintain ERK1/2 phosphorylation (Figure 5A, section (ii)). Thus, inactivation of ERK1/2 and AKT were relatively late events in cell death induction after sorafenib and vorinostat exposure, but were not causally dependent upon the primary CD95-dependent apoptotic signal.
Figure 5. Delayed inactivation of ERK1/2 and AKT correlates with profound and long-term loss of c-FLIP-s expression: delayed activation of NFκB is a toxic signal following sorafenib and vorinostat exposure.


Panel A. section (i): HEPG2 cells, 24h after plating, were treated with vehicle, sorafenib, vorinostat or both sorafenib and vorinostat. Cells were isolated 24–96h after drug exposure, subjected to SDS PAGE and immunoblotting to determine the phosphorylation of ERK1/2, JNK1/2, p38 MAPK and AKT (S473) as well as total ERK2. A representative of 3 separate studies is shown; section (ii): HEPG2 cells were transfected with a non-specific scrambled control (siSCR) siRNA molecule, or molecules to knock down the expression of CD95 or FADD, according to the manufacturer’s instructions. Cells were treated 24h after transfection with vehicle, sorafenib, vorinostat or both sorafenib and vorinostat. Forty eight hours after drug exposure cells were isolated, and subjected to SDS PAGE and immunoblotting to determine the phosphorylation of ERK1/2 as well as total ERK2 levels. A representative of 3 separate studies is shown. Panel B. Upper blotting panel to left: HEPG2 cells, 24h after plating, were infected with empty vector control virus (CMV), a virus to express constitutively active AKT, a virus to express constitutively active MEK1 EE, or both the active AKT and active MEK1 EE viruses. After infection (24h) cells were treated with vehicle, sorafenib, vorinostat or both sorafenib and vorinostat. Forty eight hours after drug exposure cells were isolated, and subjected to SDS PAGE and immunoblotting to determine the phosphorylation of ERK1/2 and AKT (S473) as well as total ERK2 levels. Upper blotting panel to right: HEPG2 cells, 24h after plating, were infected with empty vector control virus (CMV), or viruses to express constitutively active AKT and constitutively active MEK1 EE. Twenty four hours after infection cells were treated with vehicle or with sorafenib and vorinostat. Forty eight hours after drug exposure cells were isolated, and subjected to SDS PAGE and immunoblotting to determine the expression of c- FLIP-s as well as total ERK2 levels. Lower Graphical Panel: HEPG2 cells, 24h after plating, were infected with empty vector control virus (CMV), a virus to express constitutively active AKT, a virus to express constitutively active MEK1 EE, or both the active AKT and active MEK1 EE viruses. Twenty four hours after infection cells were treated with vehicle, sorafenib, vorinostat or both sorafenib and vorinostat. Ninety six hours after drug exposure cells were isolated and viability determined by trypan blue assay. The percentage of trypan blue positive cells ± SEM was determined. Data shown are from the mean of 3 independent studies. # p < 0.05 less cell killing than compared to parallel condition in vehicle treatment cells; ## p < 0.05 less cell killing than compared to parallel condition in caAKT or caMEK1 EE treatment cells. Panel C. graphical panel to the left; HEPG2 and UOK121LN cells, 24h after plating in triplicate, were transfected with NFκB-luciferase and β-galactosidase constitutive reporter constructs. Parallel control plates of cells, not shown, were transfected with NFκB-luciferase and β-galactosidase constitutive reporter constructs and co-transfected with a plasmid to express dominant negative IκB or with a plasmid to express a constitutively activated form of NFκB as internal negative and positive controls. Thirty six hours after transfection cells were treated with vehicle, sorafenib, vorinostat or both sorafenib and vorinostat. At the indicated times cells were isolated and the amount of luciferase per cell and amount of β-galactosidase per cell determined as described in the Methods (± SEM, a representative from 2 separate studies). Control studies demonstrated that over-expression of dominant negative IκB blocked vorinostat-induced activation of NFκB-luciferase activity (not shown). graphical panel to the right; HEPG2 cells, 24h after plating in triplicate, were infected with control empty vector virus (CMV) or a recombinant virus to express dominant negative IκB S32A S36A (dn IκB). Twenty four hours after infection, cells were treated with vehicle, sorafenib, vorinostat or both sorafenib and vorinostat. Forty eight hours after drug exposure, cells were isolated, spun onto glass slides and stained using established methods for double stranded DNA breaks indicative of apoptosis (TUNEL) as described in the Methods. The percentage of TUNEL positive cells ± SEM was determined. Data shown are from a representative of 2 independent studies. # p < 0.05 less cell killing than compared to the same condition in CMV infected cells. Panel D. HEP3B cells were injected (107) into the flanks of athymic mice and tumors permitted to form. The tumor take-rate was approximately 20%. Tumors were permitted to grow to ~150 mm3 after which time tumors were segregated based on volume into relatively normalized groups. Animals / tumors in triplicate were subjected to vehicle / drug administration by oral gavage once daily for three consecutive days. BAY 54-9085 was administered at a dose of 45 mg/kg. Vorinostat was administered at a dose of 25 mg/kg. Twelve hours after the final gavage dosing, the animals were humanely sacrificed, the tumors were removed and sectioned. One portion of the tumor was subjected to immunohistochemical analyses (panels to the left) to determine eIF2α phosphorylation, ERK1/2 phosphorylation, AKT (S473) phosphorylation, c-FLIP-s expression, MCL-1 expression, caspase 3 cleavage status, TUNEL positivity, and tumor morphology by H&E staining. Another portion of the tumor was macerated and digested to obtain individual tumor cells. Individual viable isolated tumor cells were plated 2,000–10,000 cells per 10 cm radius dish and colonies permitted to form over the following 10 days. Cells were fixed, stained with crystal violet and colonies of > 50 cells / colony counted. The colony formation for Vorinostat treated cells was 0.78 ± 0.04 and the colony formation for Vorinostat and Sorafenib treated cells corrected for the toxicity of sorafenib was 0.58 ± 0.06; # p < 0.05 colony formation for Vorinostat and Sorafenib treated cells corrected for the toxicity of sorafenib less than colony formation for Vorinostat treated cells.
Based on the findings in Figure 5A, attempts were made to determine whether expression of constitutively active MEK1 and/or AKT protected cells from vorinostat and sorafenib exposure. Expression of constitutively active MEK1 maintained ERK1/2 phosphorylation in HEPG2 cells treated with vorinostat and sorafenib, as did expression of constitutively active AKT in maintaining levels of AKT S473 phosphorylation (Figure 5B, upper inset panel to the left). Expression of either activated MEK1 or activated AKT almost abolished the toxicity of the individual drugs and significantly suppressed the toxicity of the drug combination (Figure 5B, lower graphical section). These findings correlated with maintenance of c-FLIP-s expression in tumor cells expressing activated MEK1 and activated AKT, and treated with vorinostat and sorafenib (Figure 5B, upper inset panel to the right). Collectively, these data further argue that maintained c-FLIP-s expression prevents CD95 signaling from activating the caspase 8 – BID pathway to induce mitochondrial dysfunction and death. These findings also argue that primary activation of eIF2α followed by the secondary inhibition of ERK1/2 and AKT represent the likely sequence of events by which low doses of sorafenib and vorinostat suppress c-FLIP-s levels, and subsequently maintain suppression of c-FLIP-s expression, in transformed cells.
Prior studies using vorinostat have shown that this agent activates the transcription factor NFκB and that this can act against the lethal actions of this drug (29, 36). Whether NFκB function plays any role in cell survival after low dose vorinostat and sorafenib treatment in our cell system was then examined. Treatment of HEPG2 and UOK121LN cells with vorinostat caused a late post-24h exposure –induced activation of NFκB, that was not significantly altered by incubation of cells with low doses of sorafenib (Figure 5C; Figure S8). As noted above, NFκB activation following vorinostat treatment has been demonstrated as a protective signal in malignant hematologic cells, we determined whether genetic inhibition of NFκB function via expression of the super repressor IκB S32A S36A altered the survival response of drug treated carcinoma cells. Expression of IκB S32A S36A inhibited vorinostat –induced activation of NFκB did not significantly alter the lethality of vorinostat as a single agent (Figure 5C; Figure S8, data not shown). However, inhibition of NFκB function significantly suppressed the death of cells treated with sorafenib and vorinostat. Our findings argue that hyperactivation of ERK1/2 and AKT can suppress killing that may be due to maintained expression of c-FLIP-s, and that the observed late phase activation of NFκB induced by vorinostat treatment is, surprisingly, a toxic signal.
Finally, we performed in vivo analyses using established ~150 mm3 HEP3B flank tumors to determine whether sorafenib and vorinostat interacted in a toxic manner in vivo. We noted that unselected clones of HEP3B and HEPG2 cells are poorly tumorigenic in the flanks of athymic mice and form tumors that rapidly become necrotic upon growth beyond > 200 mm3, potentially due to a relatively low CD31 staining (data not shown). As such, we chose an in vivo treatment, ex vivo colony formation assay approach to assess tumor cell killing and long-term survival. A 3 day treatment of animals with either vorinostat or sorafenib caused little alteration in the cleavage status of caspase 3 or the TUNEL positivity of flank tumor sections (Figure 5D, sections to the left). Combined exposure of animals/tumors to vorinostat and sorafenib caused a large increase in both the number of apoptotic TUNEL positive cells and a large increase in immunoreactivity for the cleaved form of caspase 3. Combined, but not individual, exposure of animals/tumors to vorinostat and sorafenib caused a large increase in eIF2α phosphorylation and large decreases in the expression of c-FLIP-s and MCL-1 and phosphorylation of AKT (S473). Of particular note, at the in vivo concentrations of sorafenib used as a single agent in our study, we observed near total inhibition of ERK1/2 phosphorylation by the drug; but this inhibition of ERK1/2 phosphorylation did not correlate with the cleavage of caspase 3, enhanced TUNEL positivity or lower c-FLIP-s or MCL-1 levels. In ex vivo colony formation assays using viable cells isolated from treated tumors after cessation of drug treatment, and with cells cultured in the absence of any drug in vitro, combined exposure of animals/tumors to sorafenib and vorinostat caused a greater reduction in cell survival of the explanted tumor cells growing ex vivo than was observed in the cells that had been exposed to either drug individually (Figure 5D, graph to the right). Collectively, these findings argue that our molecular defined markers for sorafenib and vorinostat lethality are observed in vitro and also in drug treated tumors, and that these effects correlate with an increase in both short-term and long-term tumor cell killing.
Discussion
Previous studies from our laboratories have shown that sorafenib and vorinostat interact in vitro in a greater than additive fashion to kill malignant hematologic cells. In chronic myelogenous leukemia cells sorafenib and vorinostat –induced cell killing correlated with decreased expression of the mitochondrial protective protein MCL-1 and the cyclin kinase inhibitor p21Cip-1/WAF1/mda6 (20). The present studies attempted to determine whether sorafenib and vorinostat also interacted to kill malignant epithelial cells attached to a substratum and if so, to elucidate the mechanism responsible for this phenomenon.
The results of the present study indicate that low clinically relevant concentrations of sorafenib and vorinostat interact in a synergistic manner to kill liver, kidney and pancreatic tumor cells in vitro. In vitro, the enhanced lethality of the regimen toward transformed cells was blocked by inhibition of CD95 or FADD function and abolished by over-expression of c-FLIP-s. Significantly, the protective effect of c-FLIP-s over-expression was observed despite the fact that sorafenib and vorinostat, but not the drugs individually, suppressed expression of multiple downstream mitochondrial protective proteins including BCL-2, BCL-XL and MCL-1 and increased the expression/activity of multiple downstream mitochondrial toxic proteins including BAX, BAK, BIM, BID and BAD, events thought to act independently of CD95 and c-FLIP-s to also lower cell viability. These findings suggest that one central mechanism of sorafenib and vorinostat lethality in epithelial tumor cells involves primary activation of the extrinsic apoptosis pathway, resulting in diminished c-FLIP-s levels, which in turn facilitate secondary activation of a destabilized intrinsic apoptosis pathway (Figure S9).
Inhibition of cathepsin B protease function also suppressed the toxicity of sorafenib and vorinostat. Cathepsin proteases are secreted enzymes as well as localized in the cell within acidic endosomes, and in some studies cathepsins have been shown to promote cell death by cleaving the caspase 8 substrate BID independently of caspase 8, thereby causing mitochondrial dysfunction (e.g. 31). In the present studies, over-expression of the caspase 8 specific inhibitor, c-FLIP-s, abolished drug-induced cell killing in liver, kidney and pancreatic tumor cells, arguing that for cathepsin proteases to act as apoptotic mediators in sorafenib and vorinostat treated cells first requires activation of caspase 8. The expression and activity of cathepsin proteases is frequently, increased in malignant cells and the secreted forms of these enzymes have been shown to play a key role in promoting invasion and angiogenesis, two critical characteristic features of the malignant phenotype (40, 41). Death receptor signaling (the extrinsic apoptosis pathway) is generally viewed as a pathway that proceeds via caspase 8 signaling, to induce both BID cleavage and mitochondrial dysfunction or directly to pro-caspase 3 cleavage in both cases culminating in cell death (4–6). However, cathepsin proteases have also been shown to play a dynamic role in TNFα and FAS –stimulated cell death processes wherein cathepsin proteases cooperate with caspase 8 to cause mitochondrial dysfunction and cell death (40, 41). Palacios et al. recently demonstrated that the cyclin-dependent kinase inhibitor flavopiridol (100 nM) potentiated the lethality of TRAIL in MDA-MB-231 mammary tumor cells and that this effect was due to the suppression of c-FLIP-s/l expression by flavopiridol (42). Analogously, interactions between much higher concentrations of sorafenib and TRAIL in malignant hematopoietic cells have been related to inhibition of c-FLIP protein translation (43). Others, also using much higher concentrations of sorafenib have observed c-FLIP and MCL-1 expression suppression by this agent, which is also likely due to profound suppression of transcription and translation (44). Inasmuch as cathepsins play a pro-apoptotic role in sorafenib and vorinostat treated cancer cells, such findings raise the possibility that tumor cells which survive exposure to these agents may do so by down-regulating cathepsin expression, which may result in diminished angiogenesis and a less invasive tumor. It also argues that inhibition of CDK9 function, or suppression of protein translation by sorafenib (cf our data showing increased eIF2α phosphorylation) (see also ref. 18, ref. 19, ref. 21), events which induce c-FLIP-s/l down-regulation, may represent a common mechanism by which vorinostat lethality is enhanced by sorafenib in carcinoma cells.
Prior studies from this group have shown that sorafenib in the ~10–15 µM range, which are within pharmacologically achievable concentrations induced cell death in human leukemic cells by promoting ER stress and diminishing expression of MCL-1 rather than by inhibiting either Raf family kinases or receptor tyrosine kinases (14–16, 20, 21). The present results in epithelial cancer cells demonstrated that much lower concentrations of sorafenib (~3 µM) as a single agent did not significantly alter MCL-1 levels or increase the phosphorylation of eIF2α, as was also was the case for vorinostat exposure. However, treatment of carcinoma cells with both sorafenib and vorinostat resulted in a large increase in the phosphorylation of PERK (Unpublished observation), as well as its substrate eIF2α. Collectively, these findings are suggestive of induction of ER stress. Moreover, to our surprise, during submission of this manuscript we have found that PERK and eIF2α activation are CD95 dependent; CD95 activation was acidic sphingomyelinase dependent (Unpublished observation). Findings in malignant hematologic cells argued strongly that down-regulation of the short-lived protein (half-life 2–4 hrs) MCL-1 by translational inhibition played an important functional role in the lethality of the sorafenib and vorinostat drug combination. MCL-1 is a multi-domain anti-apoptotic member of the BCL-2 family that acts through several mechanisms, including cooperation with BCL-XL, to block mitochondrial outer membrane permeabilization by BAK and BAX, and to prevent apoptosis (18). Translation inhibition of MCL-1 expression was independent of ERK1/2 inactivation. Notably, MCL-1 down-regulation was also observed in sorafenib/vorinostat-treated epithelial tumor cells in an eIF2α –dependent fashion. Additional studies will be required to define the functional roles of ER stress signaling and the unfolded protein response in sorafenib and vorinostat lethality; and relationship between these events, the activation of CD95 and enhanced CD95 / FAS-L expression which occurred shortly following CD95 activation / DISC formation, and the rapid suppression of pro-survival protein expression, e.g. MCL-1 and c-FLIP-s, in malignant epithelial cells.
HDACIs such as vorinostat kill tumor cells through highly diverse mechanisms, including blocking histone deacetylation, and have been proposed to down-regulate / inactivate multiple oncogenic kinases by interfering with HSP90 function, leading to proteasomal degradation of these proteins. Prior studies in breast cancer cells have established that low (e.g., 500 nM) concentrations of vorinostat, which are substantially below the 9 µM Cmax of this agent, promoted activation of caspase 8, and that cleavage of BID was involved in drug lethality, in agreement with the present data involving liver, kidney and pancreatic tumor cells (29). Disruption of signal transduction pathway function, reducing the activities within the Raf-MEK-ERK and PI3K-PDK1-AKT pathways, will exert plieotropic actions in tumor cells including destabilization of c-FLIP-s and BCL family member proteins. Inhibition of these pathways, was not readily measurable by immunoblotting over the initial 24h after drug exposure, but could, nevertheless, significantly contribute at later times to diminished expression of pro-survival molecules such as BCL-XL and MCL-1 and to increased expression of pro-death molecules such as BIM (3–6). Hence whilst the initial insult of vorinostat and sorafenib exposure caused CD95 activation and translational repression, shifting the apoptotic rheostat of a cell towards cell death and away from cell survival; the secondary destabilization of Raf-MEK-ERK and PI3K-PDK1-AKT pathway function, whether by changes in HSP90 activity or other unknown factors, likely prevented any form of compensatory survival response being mounted by the tumor cell resulting in the death response becoming “locked in place.”
Studies in leukemia and lymphoma cells have demonstrated that vorinostat can enhance cell killing in these cells particularly when vorinostat-induced NFκB activation has been suppressed via expression of a dominant negative IκB protein, e.g. (45–47). In leukemic cells, the actions of the extrinsic pathway in vorinostat lethality were not noted as a primary effector in the actions of vorinostat, although they could possibly play a role. We were surprised to discover however in hepatoma, renal and pancreatic tumor cells that low dose vorinostat – induced activation of NFκB had little effect on cell survival, as previously observed in breast cancer cells, and that when combined with sorafenib, NFκB activation facilitated the cell killing process (29). Activation of NFκB in some cell systems has been linked to cell death processes, and NFκB can increase the expression of death receptor ligands such as TNFα at a transcriptional level (48, 49). Whether low doses of vorinostat increase TNFα expression in epithelial tumor cells, and whether this represents a portion of its toxic biology via activation of the extrinsic pathway independently of CD95 are beyond the scope of the present manuscript.
In conclusion, the results of the present study indicate that sorafenib and vorinostat interact in a highly synergistic manner to kill liver, kidney and pancreatic tumor cells in vitro. They also demonstrate that this effect translates into an in vivo model system using hepatoma cells growing in the flanks of athymic mice. They indicate that a variety of signaling perturbations which cooperate to engage the extrinsic apoptotic pathway play a critical role in this phenomenon, in contrast to findings in malignant hematopoietic cells. On going in vitro and further animal studies with these agents are presently defining in greater detail the mechanism(s) of action of these drugs.
Supplementary Material
Acknowledgements
This work was funded; to P.D. from PHS grants (R01-DK52825, P01-CA104177, R01-CA108520); to S.G. from PHS grants (R01-CA63753; R01-CA77141) and a Leukemia Society of America grant 6405-97. These studies were also funded in part by The Jimmy V Foundation. A portion of Dr. Yacoub’s funding is from the Department of Radiation Oncology, Virginia Commonwealth University and PD is the holder of the Universal Inc. Professorship in Signal Transduction Research. PD thanks Dr. S. Lin for assisting Dr. G. Zhang in these studies and thanks Dr. O. Korchinsky for assistance with NFκB luciferase assays and the training of Dr. M.A. Park for these assays. This manuscript is dedicated to the corresponding author’s Great Aunt Vera in her continued fight against Renal Cell Carcinoma.
Abbreviations
- Vor.
Vorinostat
- Sor.
Sorafenib
- ERK
extracellular regulated kinase
- MEK
mitogen activated extracellular regulated kinase
- EGF
epidermal growth factor
- PARP
poly ADP ribosyl polymerase
- PI3K
phosphatidyl inositol 3 kinase
- −/−
null / gene deleted
- ERK
extracellular regulated kinase
- MAPK
mitogen activated protein kinase
- MEK
mitogen activated extracellular regulated kinase
- R
receptor
- JNK
c-Jun NH2-terminal kinase
- dn
dominant negative
- P
phospho-
- ca
constitutively active
- WT
wild type
References
- 1.Parkin DM, Bray F, Ferlay J, Pisani P. Global cancer statistics 2002. CA Cancer J Clin. 2005;55:74–108. doi: 10.3322/canjclin.55.2.74. [DOI] [PubMed] [Google Scholar]
- 2.Akriviadis EA, Llovet JM, Efremidis SC, et al. Hepatocellular carcinoma. Br J Surg. 1998;85:1319–1331. doi: 10.1046/j.1365-2168.1998.00865.x. [DOI] [PubMed] [Google Scholar]
- 3.Dent P. MAP kinase pathways in the control of hepatocyte growth, metabolism and survival. In: Dufour JF, Clavien P-A, editors. Signaling Pathways in Liver Diseases. Springer Press; 2005. pp. 223–238. Chapter 19. [Google Scholar]
- 4.Dent P, Yacoub A, Fisher PB, Hagan MP, Grant S. MAPK pathways in radiation responses. Oncogene. 2003;22:5885–5896. doi: 10.1038/sj.onc.1206701. [DOI] [PubMed] [Google Scholar]
- 5.Valerie K, Yacoub A, Hagan MP, et al. Radiation-induced cell signaling: inside-out and outside-in. Mol Cancer Ther. 2007;6:789–801. doi: 10.1158/1535-7163.MCT-06-0596. [DOI] [PubMed] [Google Scholar]
- 6.Grant S, Dent P. Kinase inhibitors and cytotoxic drug resistance. Clin Cancer Res. 2004;10:2205–2207. doi: 10.1158/1078-0432.ccr-0001-4. [DOI] [PubMed] [Google Scholar]
- 7.Allan LA, Morrice N, Brady S, Magee G, Pathak S, Clarke PR. Inhibition of caspase-9 through phosphorylation at Thr 125 by ERK MAPK. Nat Cell Biol. 2003;5:647–654. doi: 10.1038/ncb1005. [DOI] [PubMed] [Google Scholar]
- 8.Mori M, Uchida M, Watanabe T, et al. Activation of extracellular signal-regulated kinases ERK1 and ERK2 induces Bcl-xL up-regulation via inhibition of caspase activities in erythropoietin signaling. J Cell Physiol. 2003;195:290–297. doi: 10.1002/jcp.10245. [DOI] [PubMed] [Google Scholar]
- 9.Ley R, Balmanno K, Hadfield K, Weston C, Cook SJ. Activation of the ERK1/2 signaling pathway promotes phosphorylation and proteasome-dependent degradation of the BH3-only protein Bim. J Biol Chem. 2003;278:18811–18816. doi: 10.1074/jbc.M301010200. [DOI] [PubMed] [Google Scholar]
- 10.Wang YF, Jiang CC, Kiejda KA, Gillespie S, Zhang XD, Hersey P. Apoptosis induction in human melanoma cells by inhibition of MEK is caspase-independent and mediated by the Bcl-2 family members PUMA, Bim, and Mcl-1. Clin Cancer Res. 2007;13:4934–4942. doi: 10.1158/1078-0432.CCR-07-0665. [DOI] [PubMed] [Google Scholar]
- 11.Qiao L, Han SI, Fang Y, et al. Bile acid regulation of C/EBPbeta, CREB, and c-Jun function, via the extracellular signal-regulated kinase and c-Jun NH2-terminal kinase pathways, modulates the apoptotic response of hepatocytes. Mol Cell Biol. 2003;23:3052–3066. doi: 10.1128/MCB.23.9.3052-3066.2003. [DOI] [PMC free article] [PubMed] [Google Scholar]
- 12.Li N, Batt D, Warmuth M. B-Raf kinase inhibitors for cancer treatment. Curr Opin Investig Drugs. 2007;8:452–456. [PubMed] [Google Scholar]
- 13.Davies BR, Logie A, McKay JS, et al. AZD6244 (ARRY-142886), a potent inhibitor of mitogen-activated protein kinase/extracellular signal-regulated kinase kinase 1/2 kinases: mechanism of action in vivo, pharmacokinetic/pharmacodynamic relationship, and potential for combination in preclinical models. Mol Cancer Ther. 2007;6:2209–2219. doi: 10.1158/1535-7163.MCT-07-0231. [DOI] [PubMed] [Google Scholar]
- 14.Flaherty KT. Sorafenib: delivering a targeted drug to the right targets. Expert Rev Anticancer Ther. 2007;7:617–626. doi: 10.1586/14737140.7.5.617. [DOI] [PubMed] [Google Scholar]
- 15.Rini BI. Sorafenib. Expert Opin Pharmacother. 2006;7:453–461. doi: 10.1517/14656566.7.4.453. [DOI] [PubMed] [Google Scholar]
- 16.Strumberg D. Preclinical and clinical development of the oral multikinase inhibitor sorafenib in cancer treatment. Drugs Today (Barc) 2005;41:773–784. doi: 10.1358/dot.2005.41.12.937959. [DOI] [PubMed] [Google Scholar]
- 17.Gollob JA. Sorafenib: scientific rationales for single-agent and combination therapy in clear-cell renal cell carcinoma. Clin Genitourin Cancer. 2005;4:167–174. doi: 10.3816/CGC.2005.n.028. [DOI] [PubMed] [Google Scholar]
- 18.Rahmani M, Davis EM, Bauer C, Dent P, Grant S. Apoptosis induced by the kinase inhibitor BAY 43-9006 in human leukemia cells involves down-regulation of Mcl-1 through inhibition of translation. J Biol Chem. 2005;280:35217–35227. doi: 10.1074/jbc.M506551200. [DOI] [PubMed] [Google Scholar]
- 19.Rahmani M, Nguyen TK, Dent P, Grant S. The multikinase inhibitor sorafenib induces apoptosis in highly imatinib mesylate-resistant bcr/abl+ human leukemia cells in association with signal transducer and activator of transcription 5 inhibition and myeloid cell leukemia-1 down-regulation. Mol Pharmacol. 2007;72:788–795. doi: 10.1124/mol.106.033308. [DOI] [PubMed] [Google Scholar]
- 20.Dasmahapatra G, Yerram N, Dai Y, Dent P, Grant S. Synergistic interactions between vorinostat and sorafenib in chronic myelogenous leukemia cells involve Mcl-1 and p21CIP1 down-regulation. Clin Cancer Res. 2007;13:4280–4290. doi: 10.1158/1078-0432.CCR-07-0835. [DOI] [PubMed] [Google Scholar]
- 21.Rahmani M, Davis EM, Crabtree TR, et al. The kinase inhibitor sorafenib induces cell death through a process involving induction of endoplasmic reticulum stress. Mol Cell Biol. 2007;27:5499–5513. doi: 10.1128/MCB.01080-06. [DOI] [PMC free article] [PubMed] [Google Scholar]
- 22.Gregory PD, Wagner K, Horz W. Histone acetylation and chromatin remodeling. Exp. Cell Res. 2001;265:195–202. doi: 10.1006/excr.2001.5187. [DOI] [PubMed] [Google Scholar]
- 23.Marks PA, Miller T, Richon VM. Histone deacetylases. Curr Opin Pharmacol. 2003;3:344–351. doi: 10.1016/s1471-4892(03)00084-5. [DOI] [PubMed] [Google Scholar]
- 24.Bali P, Pranpat M, Swaby R, et al. Activity of suberoylanilide hydroxamic Acid against human breast cancer cells with amplification of her-2. Clin Cancer Res. 2005;11:6382–6389. doi: 10.1158/1078-0432.CCR-05-0344. [DOI] [PubMed] [Google Scholar]
- 25.Kwon SH, Ahn SH, Kim YK, et al. Apicidin, a histone deacetylase inhibitor, induces apoptosis and Fas/Fas ligand expression in human acute promyelocytic leukemia cells. J Biol Chem. 2002;277:2073–2080. doi: 10.1074/jbc.M106699200. [DOI] [PubMed] [Google Scholar]
- 26.Pang RW, Poon RT. From molecular biology to targeted therapies for hepatocellular carcinoma: the future is now. Oncology. 2007;72 Suppl 1:30–44. doi: 10.1159/000111705. [DOI] [PubMed] [Google Scholar]
- 27.Venturelli S, Armeanu S, Pathil A, et al. Epigenetic combination therapy as a tumor-selective treatment approach for hepatocellular carcinoma. Cancer. 2007;109:2132–2141. doi: 10.1002/cncr.22652. [DOI] [PubMed] [Google Scholar]
- 28.Wise LD, Turner KJ, Kerr JS. Assessment of developmental toxicity of vorinostat, a histone deacetylase inhibitor, in Sprague-Dawley rats and Dutch Belted rabbits. Birth Defects Res B Dev Reprod Toxicol. 2007;80:57–68. doi: 10.1002/bdrb.20104. [DOI] [PubMed] [Google Scholar]
- 29.Mitchell C, Park MA, Zhang G, Yacoub A, Curiel DT, Fisher PB, Roberts JD, Grant S, Dent P. Extrinsic pathway- and cathepsin-dependent induction of mitochondrial dysfunction are essential for synergistic flavopiridol and vorinostat lethality in breast cancer cells. Mol Cancer Ther. 2007;6:3101–3112. doi: 10.1158/1535-7163.MCT-07-0561. [DOI] [PubMed] [Google Scholar]
- 30.Mitchell C, Kabolizadeh P, Ryan J, Roberts JD, Yacoub A, Curiel DT, Fisher PB, Hagan MP, Farrell NP, Grant S, Dent P. Low-dose BBR3610 toxicity in colon cancer cells is p53-independent and enhanced by inhibition of epidermal growth factor receptor (ERBB1)-phosphatidyl inositol 3 kinase signaling. Mol Pharmacol. 2007;72:704–714. doi: 10.1124/mol.107.038406. [DOI] [PubMed] [Google Scholar]
- 31.Park MA, Yacoub A, Rahmani M, et al. OSU-03012 stimulates PERK-dependent increases in HSP70 expression, attenuating its lethal actions in transformed cells. Mol Pharm. 2007 doi: 10.1124/mol.107.042697. In Press. [DOI] [PMC free article] [PubMed] [Google Scholar]
- 32.Yacoub A, Gupta P, Park MA, et al. Regulation of GST-MDA-7 toxicity in human glioblastoma cells by ERBB1, ERK1/2, PI3K and JNK1-3 pathway signaling. Mol Cancer Ther. 2008 doi: 10.1158/1535-7163.MCT-07-2150. In Press. [DOI] [PubMed] [Google Scholar]
- 33.Mitchell C, Park MA, Zhang G, Han SI, Harada H, Franklin RA, Yacoub A, Li PL, Hylemon PB, Grant S, Dent P. 17-Allylamino-17-demethoxygeldanamycin enhances the lethality of deoxycholic acid in primary rodent hepatocytes and established cell lines. Mol Cancer Ther. 2007;6:618–632. doi: 10.1158/1535-7163.MCT-06-0532. [DOI] [PubMed] [Google Scholar]
- 34.Gupta S, Natarajan R, Payne SG, Studer EJ, Spiegel S, Dent P, Hylemon PB. Deoxycholic acid activates the c-Jun N-terminal kinase pathway via FAS receptor activation in primary hepatocytes. Role of acidic sphingomyelinase-mediated ceramide generation in FAS receptor activation. J Biol Chem. 2001;279:5821–5828. doi: 10.1074/jbc.M310979200. [DOI] [PubMed] [Google Scholar]
- 35.Qiao L, Studer E, Leach K, et al. Deoxycholic acid (DCA) causes ligand-independent activation of epidermal growth factor receptor (EGFR) and FAS receptor in primary hepatocytes: inhibition of EGFR/mitogen-activated protein kinase-signaling module enhances DCA-induced apoptosis. Mol Biol Cell. 2001;12:2629–2645. doi: 10.1091/mbc.12.9.2629. [DOI] [PMC free article] [PubMed] [Google Scholar]
- 36.Yu C, Subler M, Rahmani M, et al. Induction of apoptosis in BCR/ABL+ cells by histone deacetylase inhibitors involves reciprocal effects on the RAF/MEK/ERK and JNK pathways. Cancer Biol Ther. 2003;2:544–551. doi: 10.4161/cbt.2.5.454. [DOI] [PubMed] [Google Scholar]
- 37.Jung JW, Cho SD, Ahn NS, et al. Ras/MAP kinase pathways are involved in Ras specific apoptosis induced by sodium butyrate. Cancer Lett. 2005;225:199–206. doi: 10.1016/j.canlet.2004.11.029. [DOI] [PubMed] [Google Scholar]
- 38.Spiller SE, Ditzler SH, Pullar BJ, Olson JM. Response of preclinical medulloblastoma models to combination therapy with 13-cis retinoic acid and suberoylanilide hydroxamic acid (SAHA) J Neurooncol. 2007 doi: 10.1007/s11060-007-9505-1. Epub ahead of print. [DOI] [PubMed] [Google Scholar]
- 39.Gillenwater AM, Zhong M, Lotan R. Histone deacetylase inhibitor suberoylanilide hydroxamic acid induces apoptosis through both mitochondrial and Fas (Cd95) signaling in head and neck squamous carcinoma cells. Mol Cancer Ther. 2007;6:2967–2975. doi: 10.1158/1535-7163.MCT-04-0344. [DOI] [PubMed] [Google Scholar]
- 40.Taha TA, Kitatani K, Bielawski J, Cho W, Hannun YA, Obeid LM. Tumor necrosis factor induces the loss of sphingosine kinase-1 by a cathepsin B-dependent mechanism. J Biol Chem. 2005;280:17196–17202. doi: 10.1074/jbc.M413744200. [DOI] [PubMed] [Google Scholar]
- 41.Fehrenbacher N, Gyrd-Hansen M, Poulsen B, et al. Sensitization to the lysosomal cell death pathway upon immortalization and transformation. Cancer Res. 2004;64:5301–5310. doi: 10.1158/0008-5472.CAN-04-1427. [DOI] [PubMed] [Google Scholar]
- 42.Palacios C, Yerbes R, López-Rivas A. Flavopiridol induces cellular FLICE-inhibitory protein degradation by the proteasome and promotes TRAIL-induced early signaling and apoptosis in breast tumor cells. Cancer Res. 2006;66:8858–8869. doi: 10.1158/0008-5472.CAN-06-0808. [DOI] [PubMed] [Google Scholar]
- 43.Rosato RR, Almenara JA, Coe S, Grant S. The multikinase inhibitor sorafenib potentiates TRAIL lethality in human leukemia cells in association with Mcl-1 and cFLIPL down-regulation. Cancer Res. 2007;67:9490–9500. doi: 10.1158/0008-5472.CAN-07-0598. [DOI] [PubMed] [Google Scholar]
- 44.Ricci MS, Kim SH, Ogi K, et al. Reduction of TRAIL-induced Mcl-1 and cIAP2 by c-Myc or sorafenib sensitizes resistant human cancer cells to TRAIL-induced death. Cancer Cell. 2007;12:66–80. doi: 10.1016/j.ccr.2007.05.006. [DOI] [PubMed] [Google Scholar]
- 45.Rosato RR, Almenara JA, Kolla SS, et al. Mechanism and functional role of XIAP and Mcl-1 down-regulation in flavopiridol/vorinostat antileukemic interactions. Mol Cancer Ther. 2007;6:692–702. doi: 10.1158/1535-7163.MCT-06-0562. [DOI] [PubMed] [Google Scholar]
- 46.Gao N, Dai Y, Rahmani M, Dent P, Grant S. Contribution of disruption of the nuclear factor-kappaB pathway to induction of apoptosis in human leukemia cells by histone deacetylase inhibitors and flavopiridol. Mol Pharmacol. 2004;66:956–963. doi: 10.1124/mol.104.002014. [DOI] [PubMed] [Google Scholar]
- 47.Pei XY, Dai Y, Grant S. The small-molecule Bcl-2 inhibitor HA14-1 interacts synergistically with flavopiridol to induce mitochondrial injury and apoptosis in human myeloma cells through a free radical-dependent and Jun NH2-terminal kinase-dependent mechanism. Mol Cancer Ther. 2004;3:1513–1524. [PubMed] [Google Scholar]
- 48.Steer JH, Kroeger KM, Abraham LJ, Joyce DA. Glucocorticoids suppress tumor necrosis factor-alpha expression by human monocytic THP-1 cells by suppressing transactivation through adjacent NF-kappa B and c-Jun-activating transcription factor-2 binding sites in the promoter. J Biol Chem. 2000;275:18432–18440. doi: 10.1074/jbc.M906304199. [DOI] [PubMed] [Google Scholar]
- 49.Yao J, Mackman N, Edgington TS, Fan ST. Lipopolysaccharide induction of the tumor necrosis factor-alpha promoter in human monocytic cells. Regulation by Egr-1, c-Jun, and NF-kappaB transcription factors. J Biol Chem. 1997;272:17795–17801. doi: 10.1074/jbc.272.28.17795. [DOI] [PubMed] [Google Scholar]
Associated Data
This section collects any data citations, data availability statements, or supplementary materials included in this article.