

Abstract
Membrane proteins are key targets for pharmacological intervention because they are vital for cellular function. Here, we analyze recent progress made in the understanding of the structure and function of membrane proteins with a focus on rhodopsin and development of atomic force microscopy techniques to study biological membranes. Membrane proteins are compartmentalized to carry out extra- and intracellular processes. Biological membranes are densely populated with membrane proteins that occupy approximately 50% of their volume. In most cases membranes contain lipid rafts, protein patches, or paracrystalline formations that lack the higher-order symmetry that would allow them to be characterized by diffraction methods. Despite many technical difficulties, several crystal structures of membrane proteins that illustrate their internal structural organization have been determined. Moreover, high-resolution atomic force microscopy, near-field scanning optical microscopy, and other lower resolution techniques have been used to investigate these structures. Single-molecule force spectroscopy tracks interactions that stabilize membrane proteins and those that switch their functional state; this spectroscopy can be applied to locate a ligand-binding site. Recent development of this technique also reveals the energy landscape of a membrane protein, defining its folding, reaction pathways, and kinetics. Future development and application of novel approaches during the coming years should provide even greater insights to the understanding of biological membrane organization and function.
I. Introduction
Lipid bilayers formed by a thin layer of amphipathic molecules that protect cellular contents from dilution prevent access of toxins and avert uncontrolled mixing of genetic material. The bilayer also provides protection from oxidation and maintains electrochemical gradients. Moreover, the separation provided by a bilayer allows signal transduction systems to greatly amplify an incoming stimulus. Membrane lipid components spontaneously arrange themselves, sequestering their hydrophobic tail regions within the bilayer core and exposing their hydrophilic head regions to the extracellular, cytosolic, and intracellular organelle spaces. Lipid bilayers together with membrane proteins form biological membranes essential for life. Indeed, it is hardly surprising that approximately one-third of all proteins encoded by eukaryotic genomes become part of these structures (Lodish, 2007; Alberts, 2008; Wilson and Hunt, 2008).
Differences in membrane structure and particularly lipid composition will affect the structure and function of proteins embedded within or peripherally attached to membranes. But progress in understanding the structure of biological membranes and their protein components has been hampered by technical inadequacies of current methods developed primarily to characterize soluble proteins. Although notable advances have been made during the last decade with the invention of high-resolution imaging techniques and crystallography of membrane proteins (for current progress see (http://blanco.biomol.uci.edu/Membrane_Proteins_xtal.html or http://www.rcsb.org/pdb/home/home.do), an understanding of native membrane structures still lags because of a paucity of suitable analytical/imaging methods to analyze them at high resolution in their native states. Determining membrane protein structures is key in understanding their molecular functions; however, how membrane proteins assemble in native membranes is still largely unknown. The protein assembly is clearly fluid and adapts to the functional state of the cell. Such assembly is achieved in part by changes in the functional state of plasma membrane proteins during residence in intracellular compartments. Most current drugs target integral membrane proteins, often of unknown structure (Dahl and Sylte, 2005). The question is how do we address these complex architectural and trafficking issues and, ultimately, use the acquired knowledge to gain a pharmacological advantage? Evolving techniques and approaches support the hope that biological membranes will be amenable to molecular investigations that will foster rational drug design aimed at remediation of membrane protein malfunction in predisease and pathological states.
In this review we will not catalog published results on all aspects of membrane biology. To provide different examples of the interaction and relationship of membrane proteins to the membrane itself, we focus on the structures of six vertebrate membrane proteins: bovine rhodopsin, rat voltage-dependent K+ (Kv1.2K+) channel, bovine aquaporin 0, rabbit Ca2+-ATPase, human leukotriene C4 synthase (LTC4S1), and human 5-lipoxy-genase-activating protein (FLAP) (Table 1; Fig. 1). More specifically and where appropriate we will emphasize new techniques and progress made in the understanding the molecular basis of rhodopsin action in retinal photoreceptor cells. By focusing on a limited number of proteins and especially on rhodopsin, which is one of the best studied membrane proteins, we hope to highlight progress in understanding of membrane protein structure and function in general. We will also emphasize the progress made on a technological front, in particular on atomic force microscopy, which has a potential to be a leading technique to study membrane proteins, and several applications of this method to study membrane proteins will be discussed in details.
TABLE 1. Summary of the crystal structures of six mammalian membrane proteins.
| Namea | Isolation | Number of Transmembrane Helices | Possible Functional Oligomerization |
|---|---|---|---|
| Bovine rhodopsin | Bovine rod photoreceptor outer segment | 7/monomer | Dimer |
| Rat Kv1.2K+ channel | Coexpressed with β subunit in yeast | 7/monomer | Tetramer |
| Bovine aquaporin 0 | Fresh bovine eye lens | 8/monomer | Tetramer |
| Rabbit Ca2+-ATPase | Rabbit hind leg muscle | 10/monomer | Monomer |
| Human LTC4S | Expressed in fission yeast | 4/monomer | Homotrimer |
| Human FLAP | Expressed in E. coli | 4/monomer | Homotrimer |
Structures were from the following: bovine rhodopsin from Palczewski et al. (2000), rat Kv1.2K+ channel from Long et al. (2005a), bovine aquaporin 0 from Harries et al. (2004), rabbit Ca2+-ATPase from Toyoshima and Mizutani (2004) and Toyoshima and Nomura (2002), human LTC4S from Molina et al. (2007), and human FLAP from Ferguson et al. (2007).
Fig. 1.

Ribbon representations of six mammalian membrane protein crystal structures (top view from extracellular side; each color represents one monomer). A, bovine rhodopsin (PDB code: 2I36). B, bovine aquaporin 0 (PDB code: 1YMG) with bound water molecules shown as yellow spheres. C, rat voltage-gated Kv1.2K+ channel (PDB code: 2A79) with bound K+ ion shown as a blue sphere. D, rabbit Ca2+-ATPase (PDB code: 1SU4) with two bound Ca2+ ion shown as a green sphere. E, human LTC4S (PDB code: 2UUH) with bound GSH shown as a sphere. The orientation of LTC4S by Ago et al. (2007) is opposite to that reported by Martinez Molina et al. (2007). We think that the second structure, shown here, is in a correct membrane orientation that places the C and N termini inside the lumen, because of a significant homology of LTC4S with FLAP that has this topology. F, human FLAP (PDB code: 2Q7R). Bovine rhodopsin forms a head-to-head dimer as shown in this crystal form (A). Aquaporin 0 and the Kv1.2K+ channel form tetramers in crystals and function as tetramers. The Ca2+-ATPase exists as monomer in most crystal forms. Both human LTC4S and FLAP exit as homotrimers.
II. Overview of Vertebrate Membranes
Biological membranes come in different flavors. Bacteria surround their cytoplasm with a capsule. In Gram-negative bacteria, this capsule is a relatively thin inner wall composed of peptidoglycan and teichoic acids covered on the external face with complex lipopolysaccharides, an intermembrane gelatinous periplasmic space and a plasma membrane composed of a typical phospholipid bilayer. Gram-positive bacteria possess a much thicker cell wall containing multiple layers of peptidoglycans and teichoic acids, again with a periplasm and typical phospholipid bilayer below the cell wall (Koch, 2003). Unicellular yeasts are more complex, featuring a cell wall, periplasm, plasma membrane, invaginations, bud scars, a cytosol, nucleus, mitochondria, endoplasmic reticulum, Golgi apparatus, secretory vesicles, vacuoles, and peroxisomes. The plasma membrane (5–7 nm thick) is composed primarily of phosphatidylcholine and phosphatidylethanolamine with low levels of phosphatidylinositol (PI), phosphatidylserine and phosphatidylglycerol in addition to sterols (ergosterol and zymosterol) (Arnold, 1981; Kurtzman and Fell, 2000). The hallmark of eukaryotic cells is the presence of mitochondria, organelles originally derived from endosymbiotic Gram-negative bacteria. Mitochondria contain an outer membrane, intermembrane space, inner membrane, cristae space, and matrix essentially replicating the cell wall and membrane of a Gram-negative bacterium, albeit with a somewhat different outer membrane composition. The outer membrane has a protein/phospholipid ratio similar to that of the eukaryotic plasma membrane (~1:1 by weight), whereas the inner membrane has a higher protein/phospholipid ratio (>3:1 by weight) and is rich in cardiolipin (McMillin and Dowhan, 2002; Henze and Martin, 2003; Alberts, 2008).
Bacteria, protists, and multicellular eukaryotes differ significantly in composition and types of lipids that form the bilayer. Moreover, internal membranes within a eukaryotic cell differ from the plasma membrane in both lipid and protein compositions. Highly differentiated cells, especially neurons, often have specialized unique membrane structures. One example is a specialized part of the rod cell of the retina called the rod outer segment, containing proteins needed to convert and amplify light signals (Polans et al., 1996). Vertebrate rod outer segments consist of pancake-like stacks of 1000 to 2000 distinct double-membrane disks enclosed by a plasma membrane (Nickell et al., 2007). Rhodopsin is virtually unique in that it serves a vital function in visual transduction and accounts for ~90% of all internal disk membrane proteins and much smaller fraction in the plasma membranes (Palczewski, 2006). Cryoelectron tomography was used to obtain three-dimensional morphological information about this important structure. Tomograms revealed the characteristic, highly organized arrangement of disk membranes stacked on top of one another with a surrounding plasma membrane. The disks maintained the proper distance between each other and between disk stacks and the plasma membrane, the latter by a spacer structure yet to be biochemically characterized (Nickell et al., 2007). The main protein of the bilayered disk membranes is light-sensitive rhodopsin (>90% of the membrane’s proteins). Approximately 50% of the disk membrane area is occupied by rhodopsin, whereas the remainder is composed of phospholipids and cholesterol. Phospholipids, primarily phosphatidylcholine and phosphatidylethanolamine but with an unusually high abundance (15%) of phosphatidylserine, represent ~95% of all lipids in the rod outer segments. The remaining ~5% is cholesterol. In addition, the phospholipids of these specialized membranes have an unusual fatty acid composition comprising 65% unsaturated docosahexanoic and 20% steric acid (reviewed in Giusto et al., 2000).
A. Properties of Plasma and Endoplasmic Reticulum Membranes
Cellular membranes consist primarily of three classes of amphipathic lipids: phospholipids, glycolipids, and steroids. The main lipid components include phosphatidylcholine (~50%), phosphatidylethanolamine (~10%), phosphatidylserine (~15%), sphingolipids (~10%), cholesterol (~10%), and phosphatidylinositol (1%). The proportions of each vary among different cell and membrane types. In addition, each class of lipid has a high degree of heterogeneity because nonspecific fatty acyltransferases catalyze the attachment of different fatty acids. The most common are myristic, palmitic, palmitoleic, stearic, oleic, linoleic, linolenic, arachidonic, and docosahexaenoic fatty acids. There is a preference for unsaturated fatty acid groups in the SN2 position of glycerides. The basic structure and composition of plasma, endoplasmic reticulum, and nuclear membranes are similar. Each membrane is held together via noncovalent interaction of hydrophobic fatty acid tails that exclude water from the interior of the membrane bilayer. Phospholipids and other lipids in plasma membranes are organized across the bilayer in an asymmetric manner, and enzymes generally termed as phospholipid flippases help maintain this asymmetric gradient (Daleke, 2007). In the endoplasmic reticulum, there is a relative abundance of certain glycerophospholipids on the cytoplasmic face of the membrane with sphingolipids being predominantly located on the lumenal surface. A similar distribution applies to the plasma membrane so that sphingolipids and sterols predominate on the extracellular face of the bilayer. Thus, the cytoplasmic surface of plasma membranes is enriched in phosphatidylinositol, phosphatidylethanolamine, phosphatidylserine, and phosphatidic acid, which provide a slightly negative electrostatic environment that allows binding of membrane-associated and transmembrane proteins (McIntosh and Simon, 2006). The extracytoplasmic leaflet and the topologically equivalent lumenal surface of internal organelles are enriched in choline-based lipids such as phosphatidylcholine, sphingo-myelin, and glycosphingolipids. The plasma membrane but not most intracellular membranes is rigidified by the presence of cholesterol. Its presence immobilizes the first few hydrocarbon groups of the adjacent phospholipid molecules. The asymmetric distribution of cholesterol and the various glycerophospholipids also contributes to the lipid curvature needed to maintain cell structure and to sustain the noncrystalline state by limiting the ability to phase shift to a more rigid structure (Lodish et al., 1981; Benedetti et al., 2005; Maxfield and Tabas, 2005; Lodish, 2007). The curvature is necessary for intracellular membrane trafficking that, in addition to specific lipid insertions, can be achieved by other mechanisms as well (reviewed in McMahon and Gallop, 2005; Hanzal-Bayer and Hancock, 2007).
Hydrophobic proteins that readily incorporate into a lipid bilayer are key components of biological membranes. By weight, the ratio of proteins to lipids in most membranes is ~1:1. Thus, an average protein of molecular mass of 40,000 Da is surrounded by approximately 50 to 55 lipid molecules, assuming an average molecular mass of 750 Da/phospholipid. For example, at the average density of rhodopsin, a ratio of 54 to 86 phospholipids per rhodopsin has been estimated (Stone et al., 1979; Calvert et al., 2001). Moreover, rod photoreceptor cell simulations of a rod disk membrane without rhodopsin revealed 3.16 × 10⁶ phospholipids (both sides)/1 μm 2 (Liang et al., 2004). On the basis of atomic force microscopic (AFM) measurements for the rhodopsin paracrystal, a maximal number of 63,000 rhodopsin molecules/1 μm2 has been calculated (Fotiadis et al., 2003; Liang et al., 2003). Simulations of a membrane with rhodopsin resulted in 1.36 × 10⁶ phospholipids/1 μm2. Thus, rhodopsin molecules in their densest form can displace 1.80 × 10⁶ phospholipids/1 μm2. If rhodopsin were freely mobile, each molecule would be surrounded by less than two layers of phospholipid based on a simple weight ratio. Therefore, membranes can be crowded, but there also are data to suggest that portions of a given membrane can be virtually empty of (embedded) proteins (Hasty and Hay, 1978; Nickell et al., 2007). Knowledge attained over the last two to three decades has invalidated the widely held “fluid mosaic” model of membrane structure that assumed membrane proteins to be distributed randomly and diffuse freely within their boundaries. Instead, biological membranes are organized structures composed of lipids and proteins (Engelman, 2005). A specific structure of lipids such as lipid rafts, a cholesterol-enriched microdomain in cell membranes, might even extrude a subset of proteins or, conversely, organize them into specific oligomeric structures (Simons and Toomre, 2000). Whereas high fluidity is observed for individual lipids and proteins in the plane of the membrane, movement is highly restricted for most components (Kusumi et al., 2005), and specific associations of proteins and lipids are common. Moreover, lipids may guide insertion of proteins into membranes (Lagüe et al., 2001; Hunte, 2005). Clearly biological membranes do not contain randomly distributed proteins and lipids (Singer and Nicolson, 1972).
Lipids in the bilayer also are involved in signaling. For example, hydrolysis and subsequent phosphorylation of inositol derived from the headgroup of phosphatidylinositol produce multiple products used in signaling such as inositol-1,4,5-triphosphate, diacylglycerol, and phosphatidylinositol-3,4,5-triphosphate (McLaughlin et al., 2002; Behnia and Munro, 2005; McLaughlin and Murray, 2005). Inositol-1,4,5-triphosphate can be processed further by subsequent dephosphorylation and phosphorylation reactions to various active agents (Fukuda and Mikoshiba, 1997; Barker et al., 2002; Raboy and Bowen, 2006; Shears, 2007). Additional examples of biologically active lipids are arachidonic and docosahexaenoic acids, ω-6 C20:4 and C22:6 fatty acids, present mostly in phosphatidylethanolamine, phosphatidylcholine, and phosphatidylinositol, which can be liberated by activated phospholipases A2. When oxidized, these fatty acids produce the prostanoid and leukotriene families of compounds, most of which activate members of the G protein-coupled receptor (GPCR) family (Narumiya et al., 1999; Mukherjee et al., 2004). For example, the highest concentration of docosahexaenoic acid is found in photoreceptors. The derived prostanoid neuroprotectin 1 protects retinal pigment epithelial cells against apoptosis induced by byproducts of phototransduction (Mukherjee et al., 2007a,b). Leukotrienes involved in respiratory and cardiovascular diseases are proinflammatory products of arachidonic acid derived from oxidation by 5-lipoxygenase (Funk, 2001).
The role of lipids in all aspects of membrane structure and function only recently has been the subject of significant study, in part because of the paucity of suitably sensitive methods to study lipids, in contrast to classic aqueous chemical methodology. Nonetheless, although knowledge of the structural and signaling roles of membrane lipids will expand, the role of specific phospholipids in different membrane types would seem to be the area most ripe for exploration. Obviously, the brief outline of membrane lipid structure and function presented here is incomplete so this topic deserves more extensive review.
B. Membrane Proteins
Membrane proteins are water-insoluble proteins that reside in lipid bilayers. They can span a membrane once in a single pass such as guanylate cyclase or up to 19 times as documented for voltage-dependent Ca2+ channels (Remm and Sonnhammer, 2000). The most frequent are proteins with a single transmembrane spanning segment followed by those with two to seven such segments (Remm and Sonnhammer, 2000). Membrane proteins confer function on biological membranes, allowing cells to communicate with each other and to detect changes in their environment. For example, membrane proteins can serve as transporters whose functions include creating and/or maintaining concentration gradients of electrolytes, water, nutrients, metabolic cofactors, and other essential molecules; extruding toxic substances; and recapturing neurotransmitters and many other substances. Dynamic rearrangement of membrane and cellular structure via processes such as endocytosis, exocytosis, and phagocytosis all require specific membrane proteins in conjunction with a large number of membrane-associated accessory proteins. Membrane proteins can function as receptors for extracellular ligands that bind to their extracellular or transmembrane domains and transmit signals across the bilayer that are sensed intracellularly (chemical signal sending and receiving). Two of the largest protein families in this category are GPCRs and growth factor receptors such as the insulin receptor or fibroblast growth factor receptor. Membrane proteins also act as recognition molecules of the immune system and as adhesion molecules that allow formation of tight junctions and attachment of cells to each other. Membrane proteins may serve as energy transducers that use electrochemical gradients to generate high energy compounds such as ATP. Many membrane proteins, such as proteases, dehydrogenases and reductases, kinases, and phosphatases exhibit classic enzyme catalytic activity. Such activities can occur on the surface of the bilayer or deep within it. Membrane proteins also serve as structural molecules maintaining the polarity, shape, and size of cells and conferring unique features essential for their physiological function, e.g., allowing membrane fusion and separation. These are only a few of the many functions of membrane proteins.
Approximately 30% of all active genes encode membrane proteins of which approximately one-third are GPCRs (von Heijne, 2007). However, these estimates are not completely reliable (Remm and Sonnhammer, 2000; Ahram et al., 2006; Elofsson and Heijne, 2007) because of the use of algorithms based on incomplete datasets that are limited to a relatively small number of protein classes. Nonetheless, this ambiguity does not detract from the fact that membrane proteins are encoded by a vast number of genes.
Transmembrane segments of membrane proteins predictably contain largely hydrophobic residues such as Leu, Ile, and Val and aromatic residues such as Tyr, Phe, and Trp that are compatible with the hydrophobicity of the lipid bilayer. Only two structural elements have been described to date for the intramembrane portions of membrane-embedded proteins: β-barrels and α-helices. These structural motifs maximize protein stability through hydrogen bonding and exclude the bulk of water from the interior of membrane proteins. Thus, further structural characterization will add to the currently existing data and expand our understanding of the variations of these prevalent forms of structure used by membrane proteins. In the future new folds of membrane proteins are likely to be discovered. Moreover, membrane proteins often oligomerize, because exposure of hydrophobic regions to water incurs a large energy penalty. This penalty can be minimized by the ability of some proteins to influence the thickness of the membrane, a process known as protein-lipid mismatch (Engelman, 2005). In contrast, the functional portion of membrane proteins can be highly hydrated and shielded from the lipid phase in which they are embedded.
Knowledge of the folding and membrane insertion of membrane proteins is still rudimentary, but recent concepts and problems requiring future research have been delineated (Bowie, 2005). The current model suggests two stages of membrane protein folding. The first is insertion of the independent helices into the membrane bilayer and the second is the folding and/or oligomerization of these helices (Popot and Engelman, 1990; White et al., 2001; Engelman et al., 2003). However, none of these folding models consider the fact that the membrane must be water impermeable all the time. Thus, the complex of protein polypeptide with bound lipids perhaps is critical for achieving a mature conformation without membrane disruption during initial insertion or later during fusion of small vesicles with the (plasma) membranes. Interaction between α-helices can be so strong that functional proteins can be assembled from protein fragments cleaved between membrane segments as shown for bacteriorhodopsin (Popot and Engelman, 2000) and rhodopsin (Ridge et al., 1995; Ridge and Abdulaev, 2000). Frequently and primarily in eukaryotes, assembly is followed primarily by “maturation” of membrane proteins. This process is directed by an initial specific glycosylation of proteins in the endoplasmic reticulum. Correct glycosylation is proofread by the lectin chaperones calnexin and calreticulin before vesicular transport to the Golgi apparatus and later transfer to the plasma membrane (Trombetta and Parodi, 2003). Also, the stability of membrane proteins can be enhanced by disulfide bridges formed before and after membrane insertion, a motif frequently found in GPCRs (Mirzadegan et al., 2003) and other proteins. A further aspect of proper folding, particularly in mutant proteins, is appropriate interaction with a prosthetic group (Brady and Limbird, 2002; Chapple and Cheetham, 2003; Rader et al., 2004; Klein-Seetharaman, 2005; Janovick et al., 2007; Maudsley et al., 2007; Robben et al., 2007) (reviewed in Conn et al., 2007). For example, cis-retinal is important for proper folding of the P23H mutant of rhodopsin (Chapple et al., 2001; Saliba et al., 2002; Noorwez et al., 2003), the most frequent mutation found to be associated with retinitis pigmentosa (Dryja et al., 1990). However, wild-type opsin folds correctly even without chromophore and is incorporated into rod outer segments (Redmond et al., 1998). Further knowledge of these pathways and interactions is essential because misassembly of membrane proteins is clearly associated with several human diseases (Sanders and Myers, 2004).
III. Interactions of Proteins with Membranes
A. Dynamic Nature of Membrane Proteins
An X-ray structure provides only a static snapshot of the true molecular structure of a protein. However, dynamic fluctuations are essential for membrane and protein functions such as membrane fusion and repulsion between membrane bilayers, interactions between proteins, formation of cellular shapes, and mixing of lipids and membrane proteins in biological membranes (Helfrich, 1973, 1978; Deuling and Helfrich, 1976; Evans and Parsegian, 1983, 1986; Brannigan and Brown, 2006, 2007). At physiological temperatures, lipid bilayer and membrane proteins display thermal fluctuations/motion with an average kinetic energy ~0.6 kcal/mol. This amount of energy is minuscule compared with the amount needed to break a covalent bond (50–120 kcal/ mol) or even a hydrogen bond (4–5 kcal/mol), but these minor fluctuations can lead to productive catalytic events (Vendruscolo and Dobson, 2006). Structural dynamics can contribute to conformational protein entropy and also to more complex protein function and modulation such as allostery (Cooper and Dryden, 1984; Frederick et al., 2007). The dynamic nature of GPCRs in solution has been demonstrated experimentally by nuclear magnetic resonance analysis of rhodopsin (Klein-Seetharaman, 2002; Klein-Seetharaman et al., 2004). Molecular dynamic simulations reveal differences in membrane receptors occupied by or free of ligands (Spijker et al., 2006), and events leading to these differences can be monitored by single-molecule fluorescence spectroscopy (Peleg et al., 2001).
The inherent flexibility of macromelecules permits conformational changes to be triggered by ligand binding, post-translational modification such as phosphorylation, absorption of light, or changes in pH and temperature among other factors. The energy for such a transformation provided by ligand binding is typically between 8 and 12 kcal/mol. Only part of this energy is used to change the structure, and the rest is disseminated. Glutamate binding to the extracellular domain of the glutamate receptor provides a good example of large conformational changes induced by ligand binding. The bilobed architecture of this receptor exhibits the flexibility to change domain arrangements so as to form an “open” or “closed” conformation upon ligand binding (Kunishima et al., 2000). For membrane proteins with multiple transmembrane spanning α-helices, conformational changes could be restricted to translocation of the helices, leading to oligomerization, to piston-like up and down movement in relation to each helix, and to pivot movement through rotation parallel to membranes and/or by movement perpendicular to the membranes (Hulko et al., 2006). All of these types of movements would be possible only if the interacting elements of a bundle of helices constrained in one conformation can be rearranged by ligand binding to a new conformation via an energetically permissive scheme. As exemplified by photoactivated rhodopsin, metastable photointermediates of the activated receptor can be differentiated in part from one another on the basis of protonation state. The spectrally and functionally distinct Meta II intermediate is capable of activating the heterotrimeric G protein and differs from precursor photointermediates by uptake of a proton from the bulk solvent, leading to increased conformational flexibility (Salom et al., 2006b). These examples show that even though embedding a protein in a lipid bilayer imposes several restrictions on conformation and movement, membrane proteins also retain considerable flexibility and mobility, both of which are intimately connected to their function.
The motion of a protein can be assessed from crystallographic data by estimating the B factor, also known as the “temperature factor” or “Debye-Waller factor.” This number can be applied to the X-ray scattering term and describes the degree to which the electron density is spread out (Blundell and Johnson, 1976). It can also indicate where there are errors in model building. Because the B factor can be calculated in slightly different ways, comparing B factors among a class of proteins must be done with caution. Nonetheless, use of this analysis for our six model membrane proteins suggests some interesting conclusions about the flexibility of structural segments (Fig. 2).
Fig. 2.

Ribbon diagrams of six mammalian proteins including the monomer of bovine rhodopsin (A), bovine aquaporin 0 (B), the rat Kv1.2K+ channel (C), rabbit Ca2+-ATPase (D), human LTC4S (E), and human FLAP (F). The molecules are colored according to their B factors using a spectrum of colors (blue to red for low to high B factors). The orange rectangle represents the putative membrane. The two helices in bovine aquaporin 0 with the lowest B factors form the surface for tetramer formation. The transmembrane helices of LTC4S and FLAP exhibit low B factors owing to extensive intersubunit contacts in the trimer.
Rhodopsin is the predominant membrane protein of disk membranes in rod outer segments of retinal rod cells, the specialized neurons that detect photons and communicate with secondary neurons about the presence of light. Rhodopsin, a member of the GPCR superfamily, is composed of a membrane-embedded chromophore, 11-cis-retinal, that is covalently bound to the apoprotein opsin at Lys296 (in bovine opsin) located in transmembrane helix VII via a protonated Schiff base linkage. Upon absorption of a photon, isomerization of the chromophore to an all-trans-retinylidene conformation induces changes in the rhodopsin structure, ultimately converting it from an inactive to an activated signaling state that allows it to signal intracellularly through heterotrimeric G proteins. Activation of rhodopsin relays the activating changes to the retinal G protein, transducin, initiating the biochemical cascade of reactions in a process termed phototransduction (Palczewski, 2006; Ridge and Palczewski, 2007). Rhodopsin crystallizes as a homodimer, either in an antiparallel orientation (Palczewski et al., 2000; Teller et al., 2001) or in the putatively physiologically relevant parallel orientation (Salom et al., 2006b) (Fig. 1A). Helix I forms part of the dimer interface for both types of crystals. Neither the transmembrane portion of rhodopsin, which houses the covalently linked 11-cis-retinylidene, nor the solvent-exposed extracellular domain interacts with any other proteins. Both domains have low B factors suggesting rigidity of these regions (Fig. 2A). In contrast, the cytoplasmic region is highly unstructured. This region is involved in an interaction with transducin and must undergo a conformational change to propagate the receptor activation by light (Salom et al., 2006b). Thus, a large portion of rhodopsin is relatively stable whereas the functional site is flexible to accommodate structural changes needed to increase the affinity of photoactivated rhodopsin for G protein transducin.
Aquaporins are transmembrane pores involved either exclusively in water transport or in transfer of other small neutral solutes (aquaglyceroporins) (Fu et al., 2000). Aquaporin 0 is the major constituent of lens fiber cell membranes, in which it accounts for 60% of total membrane proteins. Its water transfer activity is much lower than that of other water channels. The large number, at least 13, and diversity of aquaporins in the genome reflect the strict control of permeation through these pores required for the regulation of homeostasis in different cells and organs (Gonen et al., 2005).
Aquaporin 1 from bovine red cells (Sui et al., 2001) and bovine aquaporin 0 (Harries et al., 2004) were crystallized as tetramers with each monomer showing a water pore (Fig. 1B). All aquaporins share same basic topology consisting of two tandem repeats of three-transmembrane α-helices (Agre, 2006). Helices II and VI are the interfaces for tetramer formation and therefore are more rigid than the other transmembrane helices as reflected by having the lowest B factors in the crystal structure (Fig. 2B). The entire transmembrane domain of aquaporins is relatively stable so that it can hold together tightly to maintain a 20-Å long and narrow filter channel that only allows water molecules to pass through in single file; the narrowest center point of this channel is approximately 2.8 Å in diameter (Sui et al., 2001). In contrast, the extracellular and intracellular ends of this molecule possess higher B factors, indicating a more flexible nature. These two regions contain the interhelical loops that form the extracellular and intracellular vestibules of the selective filter channel. Understandably, they have the flexibility needed to accommodate the bulk volume of water molecules entering and leaving the channel. Great water selectivity over ions is the most important characteristic of aquaporin water channels. As proposed by Tajkhorshid et al. (2002) in their molecular dynamics simulation study, water molecules change to an opposite orientation in the center of the channel to fit in the local electrical environment and thus prevent the conduction of ions. Other than its selectivity for water transport, aquaporin 0 serves another function in the lens by forming the thin junction between fiber cells. According to the electron crystallographic structure of junctional aquaporin 0 (Gonen et al., 2005), fiber cells become buried more deeply in the lens during differentiation and aging. Both the cytoplasmic N and C termini of aquaporin 0 might become truncated, altering the conformation of extracellular loop A to trigger junction formation. This observation may provide another possible explanation of why the extracellular and intracellular surfaces of aquaporin 0 are flexible.
Kv1.2K+ channels are members of the voltage-dependent cation channel family that includes voltage-dependent K+, Na+, and Ca2+ channels (Armstrong, 2003; Long et al., 2005b; Bean, 2007). Kv1.2K+ channels conduct K+ ions across the cell membrane in response to changes in membrane voltage, thereby regulating neuronal excitability by modulating the shape and frequency of action potentials. Kv1.2K+ channels typically are tetramers consisting of four identical subunits that each have a selective pore, a voltage sensor, and a gate (Fig. 1C). Each subunit has six transmembrane helices (Long et al., 2005a). The four transmembrane helices comprising the voltage sensor have few contacts with neighboring molecules and thus are relatively free to move, generating a correspondingly high B factor (Fig. 2C). Two transmembrane helices that form the pore in the tetrameric protein also have a high B factor. This observation can be explained largely by the architecture of the pore in which the internal half consists of a 10-Å wide aqueous hole that clearly would allow the transmembrane segments a fair degree of flexibility. In contrast, the occurrence of the high B factor, which indicates a certain flexibility of the outer half of the pore, is harder to explain given that the postulated mechanism of K+ permeation through the pore would not involve significant movement of the membrane helices in that region of the pore (Long et al., 2005b).
Ca2+ ATPase is a member of the P-type ATPase superfamily that transports inorganic ions across membranes generally against a concentration gradient (Fig. 1D). The transmembrane region comprises 10 α-helices with a clear separation between helices M1 to M6 and M7 to M10 (Toyoshima et al., 2000). This ATPase pumps Ca2+ ions that are released inside muscle cells during contraction back into the sarcoplasmic reticulum by using ATP as the energy source, thereby allowing muscle relaxation. Two Ca2+ ions are transported per ATP hydrolyzed, and two or three H+ ions are countertransported (Kubala, 2006). The name P-type ATPase derives from the fact that during the reaction cycle the enzyme become autophosphorylated on a canonical Asp residue located in the P (phosphorylation) domain. Active transport of Ca2+ is achieved, according to the E1-E2 model, by changing the affinity of Ca2+-binding sites from high (E1) to low (E2) (Scarborough, 2003). Release of “occluded” Ca2+ in the transmembrane binding sites occurs during the transition from E1P to E2P (“P” indicating that the enzyme is phosphorylated). The Ca2+-free (E2) state of this protein shows large conformational differences from the Ca2+-bound (E1) state. In the E2 state, compared with E1, three cytoplasmic domains have moved to form more of a single headpiece as a result of the phosphorylation-induced conformational shift. Initially, this conformational change is propagated from the P domain into the membrane domain through helices IV and V, but overall 6 of the 10 transmembrane helices exhibit large-scale rearrangements (Toyoshima and Nomura, 2002; Toyoshima and Mizutani, 2004; Toyoshima et al., 2004; Obara et al., 2005). The whole molecule of Ca2+ ATPase shows a relatively high B factor, indicating global flexibility. Unlike rhodopsin and aquaporin 0 in which the transmembrane domains are more stable than the extracellular and intracellular domains, there is no major difference in flexibility between the transmembrane helices and the cytoplasmic headpieces of Ca2+ ATPase (Fig. 2D). The structure reflects its function, i.e., the ATPase transports its substrate across a membrane. Examination of the crystal structure shows the absence of large vestibules on either surface of the membrane or a clear channel inside the membrane.
LTC4S and FLAP are two important proteins involved in the biosynthesis of LTC4 from arachidonic acid (Fig. 1, E and F). Each belongs to a superfamily of membrane-associated proteins responsible for both eicosanoid and glutathione metabolism. The primary sequences of the human LTC4S and FLAP share ~28% identity, and the crystal structures of these two proteins align with each other with an root mean square deviation of 1.64 Å. However, FLAP is different from other members of this family in that it is not an enzyme and is not regulated by glutathione. Instead it mediates the association of arachidonic acid with 5-lipoxygenase. The lipoxygenase is the enzyme that catalyzes the reaction to produce 5-monohydroperoxy-eicosatetraenoic acids, which LTC4S then converts to leukotriene A4. LTC4S also conjugates glutathione to leukotriene A4 to form leukotriene C4, the physiologically relevant molecule involved in smooth muscle constriction and inflammation. Electron microscopic studies have shown that FLAP distributes almost equally on the inner and outer nuclear membrane. In contrast, LTC4S distributes only on the outer nuclear membrane and peripheral endoplasmic reticulum but is excluded from the inner nuclear membrane (Christmas et al., 2002). There are two entries in the PDB for LTC4S published by two groups: 2PNO (Ago et al., 2007) and 2UUH/2UUI (Martinez Molina et al., 2007). These presented opposite orientations in the outer nuclear membrane. Based on examination of their function and comparison with FLAP, we chose to review 2UUH, which shares the same orientation with FLAP.
Crystal structures of both LTC4S and FLAP are homotrimers, with each monomer having four transmembrane helices. Both the N and C termini of these two proteins reside within the lumenal space of the nuclear membrane. Overall B factors for the transmembrane helices are low presumably indicating a relative lack of flexibility that is explained by extensive contacts between the trimers (Fig. 2, E and F). For example, the intersubunit contacts bury approximately 4900 Å2 of each monomer in FLAP (Ferguson et al., 2007), compared with approximately 1000 Å2 buried for the dimer of rhodopsin (Salom et al., 2006b). Thus, the trimeric structure with extensive intrasubunit interactions of the transmembrane portions is likely to rigidify both LTC4S and FLAP.
Overall, these examples show that the B factors reflect the flexibility of those regions of the membrane proteins that are thought to require flexibility for their specific function. The correlation is not absolute; however, so caution must be used when equating B factors and flexibility either with each other or with a proposed mechanism of action.
B. Interactions of Membrane Proteins with Phospholipids
Structural analysis of membrane proteins reveals that Leu, Ala, Val, Ile, and Phe prefer exposure to a lipid phase rather than the interior of a protein (Tables 2 and 3). Different amino acid residues have a unique distribution along the helices. Val and Leu are also often found to point toward the center of the lipid bilayer (Nyholm et al., 2007). The aromatic amino acids, Phe, Tyr, and Trp (Tables 2 and 3), exhibit a special distribution in that they are frequently enriched at membrane-water interfaces (White and Wimley, 1999; Elofsson and Heijne, 2007). Trp residues have a propensity to localize at the membrane interface where their indole ring has a specific orientation to the vector perpendicular to the membrane (Esbjörner et al., 2007). Electrons of their aromatic rings can accommodate a more hydrophilic environment, thereby preventing the thermodynamic penalty if a Leu, for example, were at the interface. Interfacial aromatic residues contribute to the thermodynamic stability of the Escherichia coli outer membrane protein OmpA in lipid bilayers by −2.0 kcal/ mol for Trp, −2.6 kcal/mol for Tyr, and −1.0 kcal/mol for isolated interfacial Phe (Hong et al., 2007). Furthermore, clustering of aromatic amino acids at membrane interfaces provides an additional driving force for the folding and stability of integral membrane proteins because favorable interactions between aromatic rings become significant when separated by less than 7 Å (Hong et al., 2007). For example, a stack of Phe18, Phe22, Phe25, and Phe26 and a ring formed of Phe198, Phe189, Trp202, and Trp205 add to the stability of aquaporin 0 (Fig. 3A).
TABLE 2. Distribution of lipid-facing (out) and non-lipid-facing (in) amino acid residues in transmembrane helices.
The oligomeric structure (Table 1) of each protein was viewed. Residues exposed to the surface of the protein within the transmembrane domains were considered lipid-facing (out) and those buried between helices were considered non-lipid-facing (in). The numbers of each residue were counted.
| Protein | G | A | P | V | L | I | M | C | F | Y | W | H | K | R | E | D | Q | N | T | S | Total Residues |
|---|---|---|---|---|---|---|---|---|---|---|---|---|---|---|---|---|---|---|---|---|---|
| Rho in | 6 | 14 | 5 | 11 | 9 | 6 | 7 | 4 | 7 | 3 | 1 | 1 | 1 | 1 | 4 | 1 | 0 | 6 | 7 | 3 | 97 |
| Rho out | 4 | 5 | 4 | 10 | 14 | 14 | 5 | 0 | 14 | 8 | 2 | 2 | 0 | 1 | 1 | 0 | 2 | 1 | 5 | 2 | 94 |
| Kv1.2K+ ina | 4 | 7 | 2 | 7 | 2 | 6 | 1 | 2 | 4 | 0 | 2 | 0 | 2 | 2 | 4 | 1 | 0 | 0 | 3 | 4 | 53 |
| Kv1.2K+ outa | 1 | 2 | 1 | 4 | 13 | 7 | 1 | 0 | 9 | 1 | 1 | 0 | 0 | 4 | 0 | 1 | 0 | 0 | 1 | 1 | 47 |
| AQP0 in | 12 | 22 | 5 | 12 | 15 | 1 | 1 | 1 | 9 | 7 | 0 | 2 | 0 | 2 | 2 | 2 | 5 | 2 | 7 | 6 | 113 |
| AQP0 out | 3 | 3 | 0 | 7 | 12 | 6 | 1 | 2 | 7 | 1 | 3 | 0 | 0 | 1 | 0 | 0 | 0 | 0 | 1 | 2 | 49 |
| ATPase in | 6 | 14 | 4 | 14 | 17 | 13 | 5 | 3 | 2 | 1 | 2 | 1 | 3 | 2 | 7 | 3 | 5 | 8 | 4 | 10 | 124 |
| ATPase out | 6 | 6 | 1 | 9 | 22 | 10 | 2 | 1 | 8 | 1 | 6 | 0 | 3 | 3 | 3 | 1 | 3 | 0 | 3 | 2 | 90 |
| LTC4S in | 4 | 10 | 3 | 5 | 8 | 1 | 0 | 1 | 3 | 5 | 1 | 0 | 0 | 3 | 1 | 0 | 2 | 0 | 2 | 3 | 52 |
| LTC4S out | 2 | 8 | 0 | 4 | 15 | 1 | 0 | 1 | 3 | 2 | 1 | 0 | 0 | 3 | 0 | 0 | 2 | 0 | 0 | 2 | 44 |
| FLAP in | 3 | 6 | 1 | 7 | 2 | 0 | 1 | 0 | 0 | 5 | 1 | 0 | 0 | 1 | 0 | 1 | 2 | 3 | 3 | 3 | 39 |
| FLAP out | 3 | 4 | 1 | 6 | 8 | 4 | 1 | 1 | 8 | 0 | 0 | 1 | 3 | 1 | 1 | 0 | 1 | 1 | 0 | 0 | 44 |
| Total in | 35 | 73 | 20 | 56 | 53 | 27 | 15 | 11 | 25 | 21 | 7 | 4 | 6 | 11 | 18 | 8 | 14 | 19 | 26 | 29 | 478 |
| Total out | 19 | 28 | 7 | 40 | 84 | 42 | 10 | 5 | 49 | 13 | 13 | 3 | 6 | 13 | 5 | 2 | 8 | 2 | 10 | 9 | 368 |
Rho, bovine rhodopsin; AQP, bovine aquaporin 0; ATPase, rabbit Ca2+-APTase.
S1 and S3 transmembrane helices are poly-Ala chains in the crystal structure so they were excluded from analysis; the molecule was analyzed as a tetramer.
TABLE 3. Percentile distribution of amino acid residues facing lipid (out) or not facing lipid (in) in transmembrane helices.
The structure of each protein was viewed. Residues exposed to the surface of the protein within the transmembrane domains were considered lipid-facing (out) and those buried in between helices were considered non-lipid-facing (in). The numbers of each residue were counted. The number for each amino acid residue was calculated as follows: the sum number of each amino acid residue for six nonmitochondrial proteins was divided by the total number of all 20 amino acid residues for either in or out. The same calculation was done for the four mitochondrial proteins. The top two rows are the sum of amino acid residues from bovine rhodopsin, bovine aquaporin 0, rat Kv1.2 channel, rabbit Ca2+-ATPase, LTC4S, and FLAP. The bottom two rows are the sum of four mitochondrial respiratory chain proteins.
| G | A | P | V | L | I | M | C | F | Y | W | H | K | R | E | D | Q | N | T | S | |
|---|---|---|---|---|---|---|---|---|---|---|---|---|---|---|---|---|---|---|---|---|
| % | ||||||||||||||||||||
| In | 7.3 | 15.3 | 4.2 | 11.7 | 11.1 | 5.6 | 3.1 | 2.3 | 5.2 | 4.4 | 1.5 | 0.8 | 1.2 | 2.3 | 3.8 | 1.7 | 2.9 | 4.0 | 5.4 | 6.1 |
| Out | 5.2 | 7.6 | 1.9 | 10.9 | 22.8 | 11.4 | 2.7 | 1.3 | 13.3 | 3.5 | 3.5 | 0.8 | 1.6 | 3.5 | 1.3 | 0.5 | 2.2 | 0.5 | 2.7 | 2.4 |
| In | 10.2 | 10.3 | 2.0 | 7.1 | 10.2 | 6.2 | 5.8 | 1.0 | 7.3 | 4.1 | 3.0 | 4.1 | 1.9 | 2.8 | 1.9 | 2.5 | 2.0 | 2.4 | 7.4 | 7.5 |
| Out | 4.7 | 10.3 | 2.7 | 10.7 | 22.8 | 10.3 | 2.7 | 0.8 | 11.1 | 3.9 | 3.3 | 0.9 | 1.9 | 1.9 | 0.6 | 0.2 | 1.4 | 1.2 | 5.8 | 2.7 |
Fig. 3.
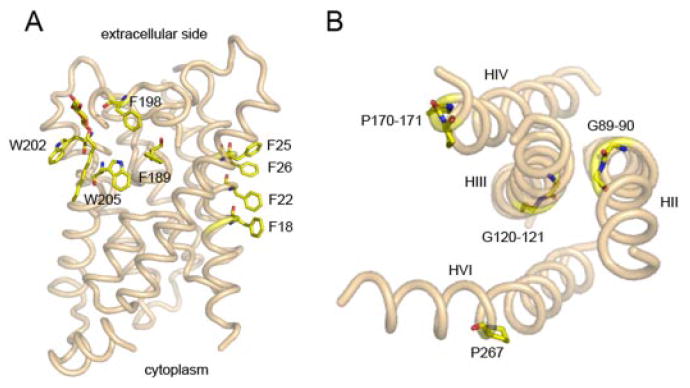
Location of aromatic and α-helical breaking residues within the structure of membrane proteins. A, π-electron interactions between aromatic residues in transmembrane helices of aquaporin 0. There are two types of aromatic residue organization in the transmembrane regions, i.e., stack and cluster. In bovine aquaporin 0 (PDB code: 1YMG) Phe18, Phe22, Phe25, and Phe26 on helix I form a nice stack. This structure is the main contributor to tetramer formation of this water channel. Phe189, Phe198, Trp202, and Trp205 form a cluster in a cleft on the surface near the extracellular side to accommodate the lipid molecule. B, effect of Gly and Pro on the torsion of transmembrane helices in rhodopsin. Shown here are four transmembrane helices (HII, HIII, HIV, and HVI) of bovine rhodopsin (PDB code: 1F88) viewed from the extracellular side. These helices have kinks caused by either double Gly or Pro residues. P267 and G89–90 cause significant bends in H6 and H2, respectively, while the double Gly (G120–G121) on H3 and double Pro (P170–P171) residues on H4 result in only small twists in the affected helices.
For the more polar and hydrophilic amino acids, distribution generally follows the relative hydrophobicity of the environment. For example, hydrophilic residues often project toward the interior of proteins where they can form hydrogen bonds or salt bridges with other hydrophilic residues or face the relatively aqueous pore of transporters and channels (Table 2). Glu, Asp, Lys, and Arg stabilize membrane proteins by interacting with lipid head groups at membrane-water interfacial regions. In addition, positively charged residues have a tendency to locate on the cytoplasmic side of membranes, the so-called “positive-inside rule” (von Heijne, 1992). Their function may be to provide a “stop signal” for the insertion of a particular helix into the membrane and/or to provide a positive charge to partially counter the intrinsic negative charge of the cytoplasmic membrane face derived from the presence of phosphatidylserine.
Specific interactions between side chains, hydrogen bonding, sequestration of hydrophobic residues, aromatic stacking, and other interactions are the underlying forces that stabilize and produce the active forms of membrane proteins. Assuming the orthogonal direction, membrane-spanning α-helices must be ~20 residues long or more to completely traverse the hydrophobic core of lipid bilayers (Nyholm et al., 2007). To accommodate functional and stability requirements, helical segments are not geometrically arranged with the greatest symmetry. Instead, helices that form transmembrane segments of these proteins may be bent and tilted away from the vector perpendicular to the membrane. For example, rhodopsin tilting and bending of helices is predominantly accomplished by incorporation of Gly and Pro residues (Fig. 3B). Gly and Pro are α-helix breakers, and additionally Pro creates a slight bend. Even energetically unfavorable helical disruption can be compensated for by internal hydrogen bonding of surrounding residues, and transmembrane segments often contain two of these residues on a row, i.e., Gly-Gly, Pro-Pro, or Gly-Pro segments, thus assuring that the ideal helical structure is interrupted (Fig. 3B). In general, the calculated tilt angle for a transmembrane helix is 22 ± 12° (Nyholm et al., 2007).
Thus, the interaction of membrane proteins with lipids is critical for their structure and function. Lipids may organize themselves into specific structures because of phase separation. Biophysical approaches that use model peptide partition without three-dimensional structural knowledge are too rudimentary to provide specific insights into the details of lipid and protein organization at a density of 1 molecule of protein/50 molecules of lipid (White and Wimley, 1999). The intricacies of biological membrane systems consisting of specific lipids and proteins may generate new thermodynamic conditions that are not suitably mimicked by pure homogeneous lipids. Moreover, lipid-protein combinations are just as diverse as proteins and lipids themselves. Such diversity can be another reason that makes it extremely difficult to generalize about the formation of specific structures. Crystallography, however, does provide initial insights into the interactions of proteins and lipids, as many crystals contain tightly bound lipids (reviewed in Palsdottir and Hunte, 2004).
C. Sequestration of Charges within Membrane Proteins
Intramembrane charged residues often form a network of ionic interactions, both for charge compensation and for functionality. In virtually every membrane protein structure solved to date, intramembrane charged residues are directly relevant to the protein’s function. Examples of these arrangements are briefly outlined below for some of the protein models described here. More about the role of intramembrane charged residues is included in the legend to Fig. 4.
Fig. 4.
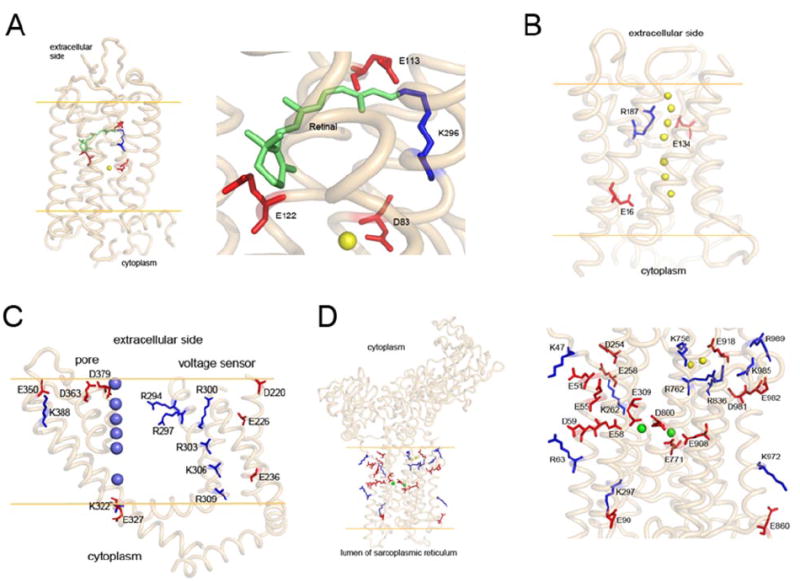
Charge distributions in the transmembrane portions of four mammalian membrane proteins (side view). Orange lines represent the putative membranes. A, charged residues in transmembrane helices of bovine rhodopsin. The right inset shows a close-up of the selected area in the left panel. One positively charged residue (K296, blue stick) in the transmembrane region forms a Schiff base with the bound chromophore, 11-cis-retinal (green). E113 serves as the counterion for K296. Two other negatively charged residues (E122 and D83) are located nearby; D83 forms an H bond with a water molecule (yellow sphere). B, side view of bovine aquaporin 0 (PDB code: 1YMG). Water molecules in the channel are shown as yellow spheres. Side chains of all three charged residues point to the transport channel. C, side view of the voltage sensor and electric pore of the rat Kv1.2K+ channel (PDB code: 2A79). There are seven positively charged residues (blue) and seven negatively charged residues (red) in the transmembrane region. K+ ions are shown as blue spheres. D, side view of rabbit Ca2+-ATPase (PDB code: 1SU4). The inset, on the right-hand side is a close up of the left panel. Five negatively charged residues (E58, E309, E771, D800, and E908) are coordinated with two bound Ca2+ ions (green spheres). The positively charged residues are paired with negatively charged residues: K47 with E51, K262 with E258, K297 with E90, K972 with E860, and R63 with D59. In the top right corner of the right panel is a cluster of five positively charged residues (K758, R762, R836, K985, and R989), three negatively charged residues (E918, D981, and E982), and two water molecules (yellow spheres).
One example of the role of intramembrane charged residues is Lys296 in bovine rhodopsin. This residue is located in the middle of the membrane on transmembrane helix VII (Fig. 4A) and is covalently linked to the chromophore, 11-cis-retinal, via a protonated Schiff base. A nearby negatively charged residue, Glu113, serves as the counterion for this base (Filipek et al., 2003a; Palczewski, 2006).
Aquaporin 0 has one positively charged residue, Arg187, located at the narrowest part of the water channel (Fig. 4B). It is part of a conserved A/R selective filter composed of an Arg residue on helix V and an aromatic residue on helix II (Phe48 in bovine aquaporin 0) plus a nearby His. This arrangement together with the close by Asn-Pro-Ala motif, local positive charges, and the H-bonding environment of the filter enable this water channel to exclude ions selectively while simultaneously transporting a high flux of water molecules (Agre, 2006).
The Kv1.2K+ channel has only one positively charged Lys residue on helix VI near the extracellular membrane surface, which is countered by a negatively charged Glu residue on helix V (Fig. 4C). The K+ pathway in the pore is lined by a conserved (T/S)XG(Y/F)G motif, considered the selectivity filter (Valiyaveetil et al., 2002). In contrast to the single Lys-Glu interaction within the helices forming the pore, the S4 helix has an abundance of positively charged residues. These residues are evenly distributed to span the entire lipid bilayer. It is unclear how this positive charge is compensated for to be included in the transmembrane domain. In the crystal structures of these channels, most of the positively charged residues appear to be buried within the transmembrane hydrophobic domain and are not completely countered by negatively charged residues (Fig. 4C). S4 is thought to be the voltage sensor that detects the change in membrane electric potential (Bezanilla, 2000). This voltage sensor is extremely sensitive to changes in membrane potential presumably because of the unfavorable energy cost associated with incorporating positively charged residues within the membrane interior. Repositioning of these charges in S4 induced by a change in membrane potential opens and closes the pore via conformational changes induced by electric charge repositioning and dipole reorientation in S5 and S6.
In the P-type Ca2+-ATPase, there are many charged residues present in its 10 transmembrane helices (Fig. 4D). Most of the positively charged residues are near membrane surfaces and are paired with negatively charged residues. For rabbit Ca2+-ATPase (Fig. 4D), the charged pairs are Lys47:Glu51, Arg63:Asp59, Lys262:Glu258, Lys297:Glu90, Lys758:Asp918, Lys972:Glu860, Lys985:Asp981, and Arg989:Glu982. Two additional positively charged residues, Arg762 and Arg836, are coordinated with two water molecules (yellow spheres in Fig. 4D). Five negatively charged residues coordinate the two bound Ca2+ ions (green spheres in Fig. 4D): Glu58, Glu309, Glu771, Asp800, and Glu908. Among these, Asp800 in the middle of the membrane is the key residue, coordinating both bound Ca2+ ions. This residue rotates almost 90° clockwise accompanying the dissociation of Ca2+ ions (Toyoshima and Nomura, 2002). Thus, in the Ca2+-ATPase, charge within the membrane is accommodated by multiple structural elements: salt bridges, water coordination, and exposure to the cation channel for interactions with both cation and water.
Overall, these examples show that the membrane proteins can accommodate hydrophilic charged amino acid residues in the hydrophobic milieu of the lipid bilayer. These residues typically are key residues for the function of these proteins. In many cases positively charged side chains are engaged in ionic interactions with negatively charged counterion residues. However, for the Kv1.2K+ channel additional experiments are required to answer how the charges are stabilized in one of the domains.
D. Forces Driving the Assembly of Membrane Proteins
Many and probably most plasma membrane proteins are known to organize in submicrometer-sized clusters. Their structure and the dynamics of their formation are still unknown. How much the transmembrane segments and how much charged extra- and intracellular loops and termini participate in dimeric/oligomeric assembly is probably specific to individual proteins. Structural complementation between transmembrane proteins could be one driving force that establishes hydrophobic, hydrogen, and ionic bonding. Another force might be sequestration of more polar residues away from the hydrophobic interior of the lipid bilayer. Clearly, transmembrane helices can be stabilized by interhelical interactions (Israelachvili, 1985; Haltia and Freire, 1995; White and Wimley, 1999; Howard, 2001; Engelman, 2005). Using several biophysical approaches to study the assembly of the protein syntaxin 1, Sieber et al. (2007) have recently proposed an interesting concept that would appear to simplify the principles involved in self-assembly. They applied basic physical principles to explain the self-association of syntaxin 1 by weak protein-protein interactions between syntaxin 1 monomers. These interactions were assumed to affect the conformation of the individual proteins and most probably their interaction with membrane lipids, especially cholesterol. The immobilization and conformational constraints on the proteins that are induced by their oligomerization provide a stabilizing factor. Conversely, steric repulsion induced by crowding is suggested to be a counterforce to protein-protein interactions. Together, these two biophysical concepts appear largely adequate to explain both the size and formation dynamics of syntaxin 1 oligomers. In addition, the physicochemical properties of membrane lipids must affect protein assembly, both because of possible protein association with specific individual lipids and for the inevitable alteration of the properties of the phospholipid bilayer by oligomer formation. Phospholipid interaction with self-assembly of rhodopsin illustrates well this idea (Periole et al., 2007). Development of coarse-grain molecular dynamic models of phospholipid bilayers and rhodopsin suggested that the rate, extent, and intramembrane orientation of protein assemblies is governed to a significant extent by local deformation of the phospholipid bilayer. These limited principles and derived ideas are unlikely to provide a complete explanation for all clustering and oligomerization of membrane proteins, but it seems highly likely that these concepts can be broadly applied to assembly of other membrane protein complexes.
Membrane proteins have the propensity to self-assemble, forming dimers or higher-order oligomers. Even though the driving forces that lead to oligomerization are unknown, three factors are likely to promote oligomerization. First, membrane proteins can form specific homo- and hetero-oligomers, because they have an intrinsic affinity for each other, and second, the energetically unfavorable exposure to an aqueous environment will favor their oligomerization. This aggregation would be prevented only if the thermal energy (0.8–1 kcal/mol at physiological temperatures) is higher than the energetic gain resulting from the association. Association of membrane proteins is enhanced by orders of magnitude relative to that of soluble proteins, because the degrees of freedom for movement are reduced by the cellular membrane. Restriction by the pseudo-two dimensionality of membranes and the specific lipid organization around membrane proteins will further increase this intrinsic affinity. It was calculated that the probability of forming dimers increases 106 fold compared with that of soluble proteins and is many orders of magnitude greater for higher oligomers (Grasberger et al., 1986). Even transient self-association of membrane proteins will guarantee that sufficient time required for catalysis or signaling is archived. Consequently, single-membrane proteins moving freely without continuous exposure to energetic traps are unlikely to exist in biological membranes. This concept is supported by high-speed, single-molecule trafficking observations of membrane lipids and proteins (Kusumi et al., 2005).
Higher-order structures of membrane proteins derived from clustering have important functional consequences. In some cases, protein assembly appears to be required for intracellular transport and post-translational maturation. This assembly could also increase the stability of proteins and modulate signaling in a more global sense. Moreover, binding would sequester a ligand for a longer period of residence time in a specific region of the cell if its receptors are clustered, thereby extending signaling duration and increasing its intensity. Clustering of receptors may function in the olfactory system wherein the association of an individual ligand at a receptor is brief and yet a reproducible, albeit small, signal is generated (Bhandawat et al., 2005).
Studies of the oligomerization of GPCR have generated special interest and passionate controversy (Chabre et al., 2003; Park et al., 2004; James and Davis, 2007). Much of the latter results from technical difficulties inherent to the study of such processes, especially in cell culture conditions wherein these receptors are overexpressed. Organization of GPCRs into oligomeric clusters has been inferred from studies using several different methods including radioligand binding, coimmunoprecipitation, and energy transfer microscopy. Each of these methods has its own significant limitations that lead to difficulties with experimental interpretation. However, an overwhelming amount of data accumulated over many years support the concept that GPCRs function as oligomeric rather than monomeric receptors (Milligan, 2004; Park et al., 2004; Terrillon and Bouvier, 2004). But even though there is far less evidence for the existence of GPCR monomers, their possible physiological functions cannot be ruled out for all GPCRs (Chabre and le Maire, 2005). Indeed some, but not all, monomeric GCPRs can activate G proteins; consequently functional assays do not answer this question (Jastrzebska et al., 2006; Bayburt et al., 2007).
A number of examples unambiguously support the functional oligomerization of GPCRs. In the case of the mGluR family of receptors, the activation mechanism involves a change in quaternary structure of the two monomers coupled to each other by a disulfide bridge (Kunishima et al., 2000; Tateyama et al., 2004). The functional unit of the GABAB receptor is an obligate hetero-oligomer composed of GABAB1 and GABAB2 subunits (Jones et al., 1998; Kaupmann et al., 1998; White et al., 1998). Similarly, taste receptors for sweet and umami responses exist as obligate hetero-oligomers (Chandrashekar et al., 2006; Huang et al., 2006). These observations are among several examples providing definitive evidence that GCPR hetero-oligomers can be physiologically relevant. Another intriguing property of this combinatorial oligomerization is that it permits a more diverse signaling repertoire from a limited pool of gene products (Park and Palczewski, 2005).
AFM images of rhodopsin in native rod outer segment disk membranes demonstrated the oligomeric arrangement of a GPCR in the most native and physiologically relevant state (Fotiadis et al., 2003; Liang et al., 2003, 2004). Cryo-electron tomography images of murine reactive oxygen species display a highly concentrated heterogeneous distribution of rhodopsin in disk membranes, supporting the oligomeric arrangement observed by AFM (Nickell et al., 2007). AFM images were also a foundation to develop a three-dimensional model of a rhodopsin oligomer (Fotiadis et al., 2004a). This model indicates that the rhodopsin dimer offers a geometrically compatible platform for the binding of partner proteins, transducin or arrestin molecule, each of which exhibit a “footprint” larger than that of a rhodopsin monomer (Filipek et al., 2004; Modzelewska et al., 2006). Recent crystallographic studies constitute a major step in understanding the molecular basis of GPCR activation. By extension, they can have significant implications for understanding how other GPCRs organize as oligomers (Salom et al., 2006a,b; Cherezov et al., 2007) (Fig. 5). The rhodopsin-G protein (transducin in rod cells)-induced fit model implies that activation may simply involve the relaxation of the somewhat more rigid structure constituting the inactive state. This process can occur within GPCR monomers or could be accommodated by an activating rearrangement of an oligomeric structure or both.
Fig. 5.
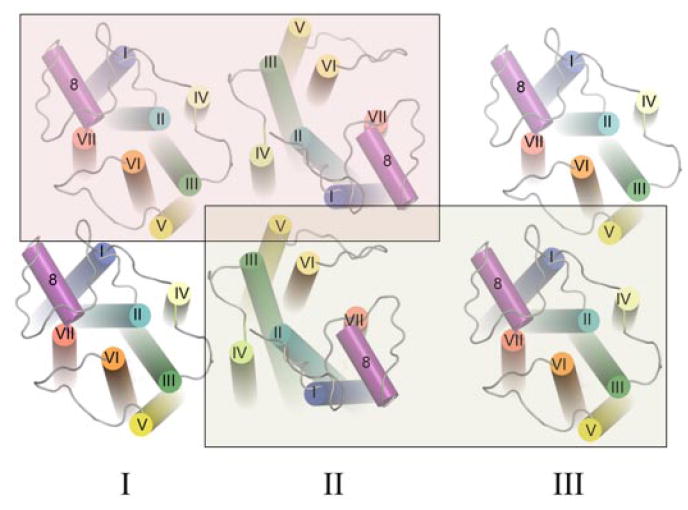
Model for the higher-order organization of rhodopsin in the native disk membrane. The view from the cytoplasmic surface shows a rhodopsin dimer that forms as a result of contacts between transmembrane (TM) helices IV and V (I). Rows of dimers form through contacts between TM helix IV (I and II, shaded red box). Adjacent rows of dimers assemble through contacts on the extracellular surface of TM helices I and II as well as H8 (II and III, shaded yellow box). The arrangement of rhodopsin monomers is based upon PDB code 1N3M from AFM data on murine rhodopsin in the disk membrane and the inactive, dark-state crystal structure of bovine rhodopsin.
Oligomerization is an important feature of membrane proteins that requires further studies to understand thermodynamic and structural principles. This property can also be exploited to produce pharmacologically relevant allosteric regulators (Park et al., 2008).
E. Modulation of Membrane Protein Function by Lipids
Although integral membrane proteins are surrounded by lipids, these proteins often must be studied outside their natural lipid environment to determine their physical and chemical properties. Such in vitro studies rely on the successful solubilization or reconstitution of membrane proteins in detergents and/or detergent/lipid mixtures. There are copurified or added lipid molecules in the crystal structures of some membrane proteins and these lipids have been shown to be critical for the function or stabilization of these proteins. For example, 13-phytanyl lipids were found in crystals of bacteriorhodopsin formed in a lipid cubic phase that in turn formed a bilayer structure (Luecke et al., 1999). In the two-dimensional crystal of sheep aquaporin 0, lipid molecules were found only at the boundary of the tetramer and not within it (Gonen et al., 2005). The presence of a correct lipid/protein ratio was found to be critical for the crystallization of the rat Kv1.2K+ channel protein (Long et al., 2005a). Finally, between 5 and 13 lipid molecules per protein molecule were essential for crystal formation of the human erythrocyte anion-exchanger membrane domain (Lemieux et al., 2002). Other examples are summarized in a recent review (Tamm, 2005).
Because lipid and protein components of membranes interact with each other, changes in lipid composition should affect membrane proteins and vice versa. Lipid modifications of integral membrane proteins may relieve hydrophobic mismatches between transmembrane helices and the lipid bilayer and thereby cause proteins to concentrate in certain areas of the membrane (Haucke and Di Paolo, 2007). Although it is not easy to establish a requirement for a specific lipid for the activity of a membrane protein, some evidence exists for this supposition. For example, choline head groups are required for the function of β-hydroxybutyrate dehydrogenase, cholesterol is needed for the activity of Na+,K+-ATPase and the acetylcholine receptor, and phosphatidylethanolamine promotes Ca2+ pump function (reviewed in Yeagle, 1989). The function of the highly studied GPCR rhodopsin has been shown to be regulated by various lipids such as cholesterol that alter the membrane hydrocarbon environment (Albert and Boesze-Battaglia, 2005). Docosahexaenoic acid, the dominant fatty acid in retina membrane (Feller and Gawrisch, 2005), and ω-3 long-chain polyunsaturated fatty acids may be involved in rhodopsin regeneration (SanGiovanni and Chew, 2005). Hofmann’s group found that in the dark, phosphatidylserine was distributed asymmetrically, favoring the outer leaflet of the disk membranes in the rod outer segments (Hessel et al., 2001). Illumination of rhodopsin caused lipid head group-specific reorganization, suggesting specific interactions between lipids and rhodopsin that are state-dependent. This observation is consistent with earlier studies showing that lipids influence the Meta I to Meta II transition kinetics of rhodopsin (the activation process) according to the level of associated phospholipid (e.g., Litman et al., 1981). Composition of the lipid bilayer appears to be critical also for the assembly of rhodopsin into oligomeric states (Periole et al., 2007).
Lipids influence the transport function of a water channel as modulated via hydrophobic matching conditions of lipid and membrane protein (Jensen and Mouritsen, 2004). Ion channels are a major family of integral membrane proteins that play pivotal roles in cell function and signal transduction (Tillman and Cascio, 2003). The functions of ion channels have long been linked with membrane lipids. For example, breakdown of inositol lipids may be involved in the activation of Ca2+ channels (Putney, 2007); both membrane potential and PI levels are efficient functional regulators of transient receptor potential channels (Nilius et al., 2007) and transient receptor potential channels are also reported to be regulated by phosphatidylinositols (Rohacs, 2007).
Conversely, membrane proteins are capable of regulating lipid distribution within the membrane. It is critical for biological membranes to maintain lipid asymmetry with phosphatidylcholine located mainly in the extracytosolic leaflet and phosphatidylethanolamine and phosphatidylserine together with minor lipids such as PI and phosphatidic acid distributed abundantly in the cytosolic leaflet (Ikeda et al., 2006). At the same time, relocation of lipid within membranes is also required for functions such as cell cycle progression, cellular apoptosis, and platelet coagulation. Several types of membrane proteins such as P-type ATPase and the ATP-binding cassette transporter are considered to play important roles in the regulation and maintenance of membrane lipid asymmetry.
Therefore, the composition of lipids must be considered when membrane proteins are investigated and experimental settings are devised. Optimally, selected lipids should closely resemble those found in native tissues containing these proteins, because artificial membranes may distort the in vivo properties of the proteins investigated.
F. Energy Landscape Determines Reaction Pathways and Kinetics (Dynamics) of Membrane Proteins
Folding of membrane proteins and their conformation and function all involve cascades of inter- and intramolecular interactions. These interactions depend on alterations in the environment such as those induced by changes in pH, electrolyte and ion concentrations, temperature, lipids, other proteins, and critical chemicals. The complexity in the number and order of interactions is specific to the membrane protein and its environment. Oversimplified texts presently indicate that only one key intramolecular interaction drives the structure and function of a protein. But in many cases multiple interactions that can take place in different sequences determine protein structure and function (Tsai et al., 1999; Oliveberg and Wolynes, 2005; Boehr et al., 2006). The concept of biomolecular interactions funneling a protein along the energy landscape was conceived only a few years ago (Onuchic et al., 1995; Wolynes et al., 1995) and has revolutionized our understanding of protein folding (Dill and Chan, 1997). Most importantly it describes how protein folding progresses via several routes rather than through a single pathway to achieve a lower energy state (Fig. 6A). Reminiscent of the authors’ favorite activity, this energy landscape can be visualized as many skiers on a mountain top taking many different routes with their ups and downs and intermediate stopping points to reach a lodge at the bottom. The ruggedness of the energetic funnel bottom is characterized by the depths, widths, and shapes of the energy minima separating conformational substates. From this picture it is clear that a more flexible protein with a large ensemble of substates will show many energy minima with only small barriers separating them. The energy landscape model also can be used to describe protein function. Actually the energy landscape walls of the funnels and their crevices, bumps, and roughness relate to the complexity and dynamics of protein function. For example, in designing ligands for membrane protein targeting it is important not only to know the mechanisms by which a ligand recognizes specific binding sites but also the conformational changes of the membrane protein that occur. Interactions at conformational binding sites can reveal alternative binding sites for ligands to modulate membrane protein function (Lacapère et al., 2007). These alternative conformational substates and their populations are described by the energy landscape (Fig. 6B). Consequently, induced conformational entropy changes can contribute significantly to the free energy of the protein-ligand association (Frederick et al., 2007). Importantly, the funneling concept describes in detail the multiple steps required to change protein function, beginning with ligand binding and ending with the final switch that determines the protein’s functional state. Moreover, the energy landscape reveals detailed insights into the molecular mechanisms required to modulate membrane protein function (Ma et al., 1999; Tsai et al., 1999; Kumar et al., 2000). Once understood, it should be possible to tune the functional state of a target protein more precisely (Boehr et al., 2006).
Fig. 6.
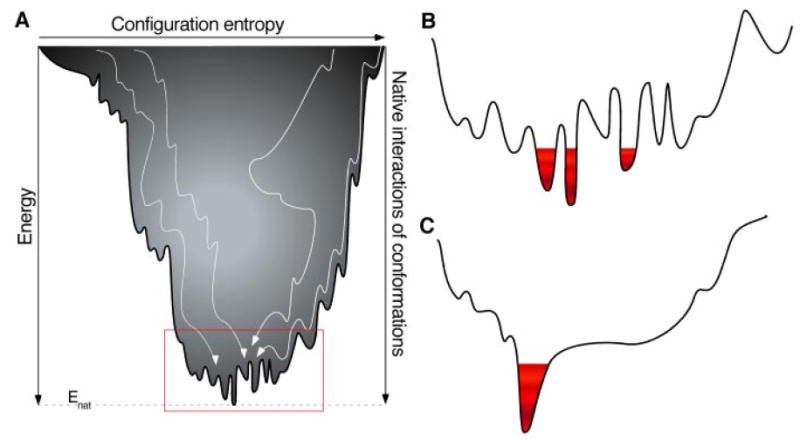
Energy landscape (A) describes a peptide folding into the native protein structure as a funnel of interactions and structural conformations. The width of the funnel describes the entropy and the depth of the funnel, the energy. Coexisting discrete folding pathways (white lines) describe possible transitions of the folding peptide increasing the intermediate conformations and number of native interactions. At the bottom of the energy landscape the native protein is stabilized by Enat. A rugged bottom of the energy landscape (red rectangle zoomed out in B) indicates that the energetic contributions cannot be simultaneously minimized by a single conformation. Such a frustrated protein can adopt many alternate conformational substates. B, each conformational substate described by the rugged energy landscape has a certain probability of occupation (indicated by red colors). C, a smooth landscape indicates that the different interactions contributing to the conformation at the bottom are minimally frustrated.
Membrane proteins, like other molecules in vivo and in vitro, function through their interactions with the environment. These interactions shape the energy landscape with their nadirs representing energetically stable states for a membrane protein. If the energetic contributions of the native protein state can be minimized simultaneously, then all interactions are considered “minimally frustrated” and probably represent a simplified case of a very stable membrane protein. In general, proteins exhibiting minimally frustrated interactions establish rigid and robust structures. In such a case the protein adopts only a few or one conformational substate. Because in each substate the protein has the potential to bind a different molecule, proteins showing fewer substates can be considered to show highly selective binding. In an extreme case, a protein showing only one conformational state shows only one lock-and-key type binding. The part of the energy landscape stabilizing this rigid conformation can be viewed as having a smooth bottom with a single or very few minima (Fig. 6C). Formation of robust protein domains has been evolutionarily favored by development of selected sequences wherein interactions present in the native protein are mutually supportive and cooperatively lead to a low energy structure (Oliveberg and Wolynes, 2005). However, there are many more “frustrated” than minimally frustrated proteins. How much “frustration” is compatible with biological function is an important question with the answer leading directly to an understanding of the molecular mechanisms of malfunction, destabilization, and misfolding diseases (Dobson, 2003; Sanders and Myers, 2004). In contrast to a minimally frustrated protein, the energy landscape of a frustrated protein shows a rugged bottom with rather low energy barriers separating multiple valleys (Fig. 6B). Such structurally flexible proteins can potentially bind nonselectively to a wide range of potential ligands (Ma et al., 1999; Kumar et al., 2000). Thus, the ensemble of conformational substates around the bottom of an energy landscape implicitly replaces long-held notions about binding, such as “lock-and-key” (Fischer, 1894) and “induced fit” (Koshland, 1958), crystal packing effects, hinge bending motions, domain swapping, and misfolding (Bennett et al., 1994, 1995). The ruggedness of the energetic funnel bottom is characterized by the depths, widths, and shapes of the energy minima separating conformational substates. From this picture it becomes clear that a more flexible protein with a large ensemble of substates will show many energy minima with only small barriers separating them.
Accordingly, the interaction of a membrane protein with a ligand will modify its energy landscape (Fig. 7) and the conformational substate of a protein that binds a complementary ligand will shift the equilibrium toward this conformer (Foote and Milstein, 1994; Boehr et al., 2006). In certain cases ligand binding may guide the transition of a flexible (high entropy) to a more ordered protein (lower entropy) (Spolar and Record, 1994). However, such changes in protein conformational entropy can also contribute significantly to the free energy of protein-ligand association (Frederick et al., 2007). From the energetics of a binding perspective, it makes no difference whether the ligand is a peptide, protein, or another molecule. In the example illustrated in Fig. 7, ligand-binding changes the relative stabilities between conformational substates. But in other examples ligand binding may affect only the heights of the barriers and thus smooth the energy landscape. Such smoothing of the energy landscape is mediated by the interaction of chaperones with misfolded proteins (Hartl and Hayer-Hartl, 2002). Dynamic energy landscapes with altered shapes and populations show that the concept of reaction pathways can provide an understanding of how membrane proteins function. Such an approach may assist in future attempts to target membrane proteins by ligand interactions (Tsai et al., 1999; Boehr et al., 2006).
Fig. 7.

Energy landscape changes upon ligand binding. A, rugged energy landscape of a structurally flexible protein showing many energy minima assigned to conformational substates. Each substate is populated differently. In principle, each of these substates may bind certain specific ligands. B, interactions occurring upon ligand binding change the energy landscape. In some cases new substates may be created and conformational substates that bind the ligand will be favored over substates. Such changes in substates and their populations may modulate protein function and also may lead to protein destabilization and malfunction.
It is important to distinguish between the dynamics of the energy landscape and the dynamics term used for molecular dynamics simulations. Current molecular dynamic simulations only calculate snapshots of dynamically changing conformations simulated under a set of constant conditions. In contrast, dynamic changes in the energy landscape result from environmental changes whether physical (e.g., electrolyte, temperature, pH, and others) or functional (e.g., interaction with other proteins and molecules).
IV. Imaging Membrane Proteins
A. Membrane Proteins in Two-Dimensional Crystals
Crystallographic techniques used for solving membrane protein structure do not differ much from those used for soluble proteins. A protein is purified in detergent solution, and crystals are formed by concentrating the protein with ammonium sulfate or other salts, organic solvents, or polyethylene glycols. Usually only limited amounts of lipids are present and bound to the protein. Throughout this process, it is imperative that membrane proteins are well characterized by enzymatic and other assays to prove that they retain their physiological function. There is also concern that detergents poorly mimic membrane bilayers because of the relaxed and hydrated structure around headgroups in detergent compared with the more orderly tight packing around phospholipid headgroups in membranes (Matthews et al., 2006). Considering that lipid headgroups span about the same distance as the side chains of lipids, this fact is a concern that should be taken seriously. If a vesicle is too small, its curvature can profoundly affect protein properties. Thus, detergent substitution for specific lipids might reveal different steps in protein activation or catalysis than would otherwise occur in natural membranes. More examples of high-resolution protein structures in membranes and in crystals are needed to determine whether this concern is valid.
Any structural determination, aside from single particle analysis, requires high symmetry of the sample. For membrane-embedded proteins, symmetry can be obtained by formation of two-dimensional crystals. Electron crystallography in principle allows the building of atomic models, not only for these proteins but also for their surrounding lipid bilayers. This analysis further allows better descriptions of lipid-protein interactions (reviewed in Renault et al., 2006) than are possible from X-ray crystallography. However, electron crystallography has its own limitations and should be viewed as an important complement and only in some case superior to X-ray crystallography. For example, the extent to which proteins embedded in the narrow gaps separated by few lipid molecules forming two-dimensional crystals show the same structural and functional behavior as proteins surrounded by lipids in native membranes remains to be determined. Obviously, interpretation of electron crystallography can also be suspect because the proteins viewed are maximally crowded in membranes. Another technical caveat is that three-dimensional crystals allow electrons to penetrate only through short distances; consequently, direct comparisons of the same sample by X-ray and electron crystallography are impossible. Because electrons interact more strongly with atoms than X-rays, two-dimensional crystals can be sufficient for structural determinations. Whereas X-rays penetrate through a thin two-dimensional crystal composed of one or two layers of proteins without diffracting significantly, electrons may interact too strongly with proteins in the crystal. Electrons also produce much more sample damage than X-rays, which limits the resolution and hence the amount of molecular details that can be observed. Radiation damage from electrons can be reduced by conducting cryo-crystallography at liquid nitrogen or, more recently, at liquid helium temperatures. Similarly, at present, X-ray cryo-crystallography is a prerequisite to avoid radiation damage that is prevalent at Synchrotron sources. However, conducting experiments at cryo-temperatures is far from physiological.
Regardless of the possible limitations, about a dozen medium resolution membrane protein structures revealed by electron crystallography have been deposited. The aquaporin 0 structure was determined by both X-ray and electron crystallography, and the structures appear to be compatible (Gonen and Walz, 2006), reinforcing the idea that these approaches are complementary. The same holds true for many other membrane proteins such as aquaporin 1, bacteriorhodopsin, the glycerol facilitator protein of E. coli, and proteins of the photosynthetic apparatus (Liao et al., 2000).
B. Membrane Proteins Observed by Atomic Force Microscopy
The atomic force microscope belongs to the family of scanning probe microscopes (Gerber and Lang, 2006). Scanning probe microscopy (SPM) has the advantage that multifunctional probes can be used to measure various different physical and chemical properties of a given object. The great potential of both imaging membrane proteins at high resolution and simultaneously specifically mapping their properties has begun to be explored (Frederix et al., 2003). With continuous adaptation of SPM techniques to characterize biological samples, hitherto unanswered questions can be addressed. A schematic representation of the multifunctional imaging of membrane proteins using SPM techniques is displayed in Fig. 8.
Fig. 8.

Multimodal AFM imaging of membrane proteins. A and B, the probe of a contact mode AFM contours the surface of a loaded with protein membrane. C, In the case of localized electrostatic interactions (negative charges indicated), the AFM probe contours the protein and simultaneously detects the electrostatic potential (Philippsen et al., 2002). The resulting topograph (red line) is a result of structural and electrostatic interactions. D, the proteins (a′ and (a0) show structural changes that are contoured individually. Such changes can be related, for example, to protein flexibility (Müller et al., 1998) or conformational alterations (Scheuring et al., 2002). E, a conducting AFM probe contours a membrane protein and simultaneously detects a channel current I (Frederix et al., 2005).
AFM functions like a blindman’s stick (Binnig et al., 1986). A sharp stylus, mounted at the very end of a 30-to 200-μm-long cantilever raster, scans the surface of a biological object. Applying a constant force kept constant by a feedback loop bends the cantilever. The sharpness of the AFM stylus determines the resolution achieved. When adjusted properly, AFM has revealed single-membrane proteins embedded in their native membranes at a subnanometer resolution (Engel et al., 1997; Müller et al., 2006). Although a vertical resolution up to ±0.1 to 0.2 nm can be achieved, lateral resolution is only approximately 1 nm. Advantageously, AFM does not require labeling or fixation of biological samples and can be performed over a wide temperature range with various buffer solutions (Drake et al., 1989). Upon introduction of AFM for biological studies, the initial challenge was to demonstrate that it was indeed possible to contour the surface of native proteins at a resolution approaching that observed in solid-state materials (Binnig et al., 1987; Giessibl, 1995). This problem was not an easy task because, unlike solid-state materials, biological samples are flexible and can easily be (ir)reversibly deformed by an AFM cantilever that is approximately 30,000 to 200,000 times longer and approximately 500 to 1000 times thicker than the sample. After sample preparation (Müller et al., 1997; Amrein and Müller, 1999) and imaging conditions (Möller et al., 1999; Müller et al., 1999a) were developed for native membrane proteins (Müller and Engel, 2007), it was possible to demonstrate that AFM was indeed suitable for imaging single-membrane proteins and their substructures in their native conformations with a spatial resolution <1 nm (Müller et al., 1995b, 1999b, 2002b, 2006; Schabert et al., 1995; Engel et al., 1997; Müller and Engel, 1999).
Membrane proteins initially imaged by high-resolution AFM were primarily crystallized two-dimensionally in lipid membranes. Although some membrane proteins such as bacteriorhodopsin and the major intrinsic protein of the eye lens naturally assemble into two-dimensional lattices, such self-organization does not occur for most membrane proteins. Highly ordered assemblies of membrane proteins are required to determine three-dimensional structures by electron crystallography (Levy et al., 2001; Stahlberg et al., 2001a; Rémigy et al., 2003). Nonetheless, two-dimensional assembly of membrane proteins clearly retains their functionally important lipid environment. Thus, initial approaches applying AFM to two-dimensional crystals of membrane proteins did allow structural comparisons and the development of reproducible procedures to achieve high resolution. High-resolution AFM has been used to image many two-dimensional crystallized membrane proteins, most from plants or bacteria (Mou et al., 1995; Müller et al., 1995a, 1996; Czajkowsky et al., 1998, 1999; Fotiadis et al., 1998, 2004b; Müller and Engel, 1999; Scheuring et al., 1999) but some of vertebrate (Fotiadis et al., 2000, 2002; Reviakine et al., 2000; Müller et al., 2002a) origin.
The exceptionally high signal/noise ratio of AFM does not require two-dimensional assemblies to observe single-membrane proteins. This advantage become evident only after appropriate sample preparation and high-resolution AFM imaging conditions were established (Shao et al., 1996; Amrein and Müller, 1999; Müller and Engel, 2008). Within the last decade, several densely packed assemblies of membrane proteins were imaged at sufficiently high resolution that allowed substructures of single-membrane proteins to be observed at spatial resolutions of ~1 nm (Seelert et al., 2000; Stahlberg et al., 2001b; Fotiadis et al., 2003; Pogoryelov et al., 2005, 2007; Scheuring et al., 2005; Gonçalves et al., 2007; Hoogenboom et al., 2007). Thus, high-resolution AFM has the potential to determine the oligomeric state of many native membrane proteins without the need for crystallization. This capability has provided new opportunities to study structural and functional relationships of proteins as summarized in the following sections.
1. Observing Diffusion and Assembly of Membrane Proteins
The transmembrane ion-driven rotors from the F0F1 ATP synthase of Ilyobacter tartaricus have been studied by AFM after reconstitutioen into a lipid bilayer at a density covering 50 to 60% of the membrane surface (Müller et al., 2003). As noted above, this density is typical of that found in many cellular membranes. AFM images of membrane proteins in this densely packed assembly had a spatial resolution of ~1 nm. Repeated imaging of the same area allowed tracking of the diffusion of single proteins in the assembly. Subsequent analysis of time-lapse AFM topographs allowed the determination of individual membrane protein trajectories. It was observed that individual rotors could switch from “hindered” to “obstacled” diffusion modes, thereby exhibiting different diffusion constants. High-resolution AFM topographs also permitted the association of the membrane proteins into complexes to be followed, and with a given membrane protein structure it was possible to model the dynamics of its assembly with atomic precision.
Using high-resolution AFM, Scheuring et al. (2005, 2006) characterized the assembly of membrane proteins in native photosynthetic membranes. They observed the assembly of the different membrane proteins involved in the photosynthetic apparatus and, along with available atomic models, fit the assembly of light-harvesting complexes and reaction centers with nanometer precision. Moreover, these investigators recently showed how the composition and arrangement of photosynthetic membrane proteins changes in response to light (Scheuring and Sturgis, 2005).
2. Imaging Native Membranes of Vertebrates
Precisely how assembly of rhodopsin occurs in native disk membranes of photoreceptor rod outer segments has been a long-standing question. AFM topographs recorded from native murine rod outer segment disk membranes revealed the structural arrangement of unbleached rhodopsin molecules (Fotiadis et al., 2003). More than 90% formed dimers that assembled into paracrystalline arrays and raft-like membrane patches. The density of rhodopsin in these fully packed patches ranged from 30,000 to 55,000 monomers/mm2. The average distance and orientation of rhodopsin molecules forming dimers could be used to fit atomic rhodopsin models into a dimeric structure. Information about the paracrystalline array of dimers could then be used to model the higher-order oligomeric assembly of rhodopsin dimers. The resulting packing arrangement model of rhodopsin molecules in native disk membranes inferred by AFM was later confirmed by biochemical cross-linking studies (Liang et al., 2003, 2004; Suda et al., 2004; Fotiadis et al., 2006), crystallography (Salom et al., 2006a,b), and fluorescence spectroscopy (Kota et al., 2006; Mansoor et al., 2006).
C. Changes in the Structure of Membrane Proteins Observed by Atomic Force Microscopy
The first conformational change of a membrane protein observed by AFM was in the light-driven proton pump bacteriorhodopsin from Halobacterium salinarum. This change induced by the scanning AFM stylus demonstrated flexibility of the cytoplasmic loop connecting transmembrane α-helices E and F (Müller et al., 1995a). Whereas this EF loop fully protruded from the membrane surface at forces of ≤100 pN applied to the AFM stylus, it reversibly bent the membrane surface at applied forces of 300 pN and ruptured the membranes at applied forces greater than ~500 pN (Müller et al., 1995a, 1999b). This experiment suggested that the AFM imaging forces had to be minimized and controlled precisely to prevent structural deterioration of an imaged membrane protein. Subsequent development of standard sample preparation and imaging protocols allowed improved control of these parameters and prevented unwanted structural alterations of imaged membrane proteins.
The suitability of AFM to observe functionally related conformational changes of membrane proteins was demonstrated later for the channel protein OmpF porin from E. coli (Müller and Engel, 1999; Engel and Müller, 2000). Lowering the pH from 7.0 to 3.0 or applying a critical voltage potential across the protein membrane induced the large extracellular loops of porin to reversibly collapse onto the OmpF channel entrance. This conformational change was unexpected because until then it was assumed that a constriction loop folding into the channel switches the functional state of the porin. However, shortly after the AFM experiments it could be shown that other porins of the same family are gated by conformational changes of their extracellular domains as well (Andersen et al., 2002; Yildiz et al., 2006).
The first functionally related conformational change of a human membrane protein was noted for gap junction hemichannels from HeLa cells (Hand et al., 2002; Müller et al., 2002a). These channels regulate cell-cell communication by transferring metabolites, ions, and signaling molecules. AFM was used to first image the cytoplasmic surface of isolated gap junction plaques. Then the AFM stylus was used as a nanotweezer to dissect the upper membrane leaflet of the gap junction and to image the extracellular surface of the gap junction hemichannels (Fig. 9A). The structural arrangement of individual connexin 26 (Cx26) molecules forming hexameric hemichannels (connexons) was clearly resolved. In the absence of Ca2+, these hemichannels were completely open (Fig. 9B, top) and addition of Ca2+ closed them (Fig. 9B, middle). This closure was fully reversible because the connexon pores opened again after removal of Ca2+. High-resolution topographs of this Ca2+-induced closure of the channel entrance suggested that the subunits moved toward the central pore (Fig. 9B, bottom).
Fig. 9.

AFM imaging of the conformational states of gap junction hemichannels. A, high-resolution AFM topography of the extracellular surface of Cx26 gap junction hemichannels. Channels from rat liver epithelial cells were embedded in their functionally important cell membrane. AFM topography was recorded at pH 7.6 in buffer solution. In the presence of aminosulfonate compounds, these hemichannels reversibly gate their pores from the closed state at pH 6.0 to the open state at pH 7.6 or higher. Insets at the bottom left show correlation averages of the closed (pH 6.0) and fully open (pH 7.6) conformations. The difference map (red inset) of both conformational states indicates that the subunits of the hemichannel surface rotate like an iris-like shutter. B, Ca2+ acts as a ligand to close gap junctions at neutral pH. In the absence of CaCl2, channels are wide open (top) but become fully closed in the presence of 0.5 mM CaCl2 (middle). These gap junctions open reversibly in the absence of Ca2+. The difference map of both conformational states (bottom) shows that the Ca2+-induced conformational change shifts the subunits centrally to close the channel entrance.
Gap junction channels also close upon acidification. Lowering intracellular pH decreased junctional electrical coupling in cardiomyocytes and in Purkinje fibers (Reber and Weingart, 1982; Burt, 1987; Noma and Tsuboi, 1987; Spray and Burt, 1990) as well as in teleost and amphibian embryos (Spray et al., 1981). Bevans and Harris (1999) characterized the functional pore size of Cx26 connexons and found that they became pH gated only in the presence of aminosulfonate compounds such as taurine. High-resolution AFM topographs first revealed the pH-induced gating mechanism of Cx26 hemichannels (Fig. 9A, bottom). This conformational change also was fully reversible and seen only in the presence of an aminosulfonate buffer (e.g., HEPES). In the absence of such compounds the channel remained open. The difference map calculated from the open and the closed state (red-colored image ΔpH of Fig. 9A) shows that aminosulfonate binding and the pH shift twisted the connexon subunits to close the channel like the iris of an eye. This closure mechanism differed from that indicted by Ca2+, which caused the connexons to move radially.
The oligomeric states, assembly, and conformational changes directly observed by AFM can be regarded as a new technological approach to characterize the structure and function relationship of native membrane proteins. However, until recently it was possible only to image static conformations, e.g., open and closed channels. Technological developments such as improved cantilevers and fast scanning AFMs (Ando et al., 2003; Humphris et al., 2005), capable of recording up to 200 topographs a second, will soon be available commercially. Thus, high-speed AFMs shortly will be used to observe membrane proteins at work in real time. Continuing improvement of AFM sample preparation and imaging conditions will provide direct and easy access toward characterizing membrane proteins in their native environment.
D. Membrane Proteins Observed by Near-Field Scanning Optical Microscopy and Single-Molecule Fluorescence Microscopy
Near-field scanning optical microscopy (NSOM) is microscopy without a lens (Edidin, 2001) wherein the illuminating light is brought in close proximity (a few nanometers) to a sample surface through an aperture with a diameter far less than the wavelength used (Fig. 10). This technique enables the illuminating light to reach the sample surface before it is diffracted or lost in the far-field spectrum, thereby generating an image with a resolution much higher than that for traditional light microscopy that has a resolution limit of approximately λ/2. There are four requirements for a NSOM: a light source, a feedback technique that allows the stylus to remain at a fixed distance from the sample surface, the capability to scan a sample in both x and y directions, and a photosensor (Marchese-Ragona and Haydon, 1997). NSOM found its roots nearly 80 years ago when Synge (1928) suggested the theoretical concept, and its utility was demonstrated by Ash and Nicholls (1972) using microwave radiation. Rapid development of this technique started around 1984 when visible light could be used for illumination (Marchese-Ragona and Haydon, 1997). Because of its nature, NSOM not only provides a nanometer-sized optical image but it also generates a high-resolution image, albeit not as high as that by AFM, of sample surface topography.
Fig. 10.

Schematic drawing of an aperture near-field scanning optical microscope. A typical microscope has an aluminum-coated optical fiber with an aperture of 25 to 100 nm diameter at the point to generate a subwavelength light source used as the scanning probe. The probe will scan at a height of a few nanometers above the sample surface. With the NSOM technique, illumination of the sample can be done within the near-field of the light source. Therefore, it overcomes the diffraction limit of traditional microscopy and achieves a higher resolution (>100 nm).
NSOM can be used for a variety of purposes such as single-molecule detection, fluorescence lifetime measurements, single-molecule diffusion at interfaces, and thin film analyses. Its biological applications include investigations of the photosynthetic system, protein localization, chromosome mapping, and membrane microstructure (reviewed in Dunn, 1999). Enderle et al. (1997) used NSOM to study protein interactions in biological membranes by mapping the colocalization of parasite malaria proteins and host skeletal proteins. NSOM also was used to observe changes in membrane protein clusters such as erbB2 upon activation (Nagy et al., 1999), clusters of Ca2+ ion channels in cardiac myocyte membranes (Ianoul et al., 2004), the distribution, mobility, and association of membrane clusters containing transferrin and other cell surface receptors (Nagy et al., 2001), and the domains of β-adrenergic receptor complexes on the surface of cardiac myocytes (Ianoul et al., 2005). NSOM has been used to detect the dynamics of both the membrane and membrane proteins associated with the cellular cytoskeleton (Brown et al., 2000). NSOM can also be used together with other microscopic methods such as AFM (Rieti et al., 2004) and confocal laser microspectrofluorometry (Qiao et al., 2005) to investigate biological systems.
Although NSOM can achieve resolutions <100 nm, it is difficult for an aperture-based instrument to attain molecular level resolutions owing to the size limit of the aperture. Therefore, apertureless NSOM was designed to overcome this limitation. Two main categories of apertureless NSOM exist, i.e., metal stylus and fluorescent probe. In metal stylus NSOM, the light probe with aperture is replaced by a metal stylus of atomic dimensions. The stylus locally perturbs the field at the sample surface and the response to this perturbation is detected (Richards, 2003). Fluorescence-based NSOM uses a nano-scopic fluorescent light source located at the stylus to scan the sample. The distance between the light probe and sample surface in NSOM meets the Förster radius R0 requirement for fluorescence resonance energy transfer so fluorescence-based NSOM can be further developed into fluorescence resonance energy transfer-NSOM, in which the donor and acceptor fluorophores are located on the light stylus and the sample surface, respectively (Sekatskii et al., 2001).
Originally NSOM could only be used for fixed samples because it needed a feedback mechanism from the sample surface to keep the probe at a fixed distance from the sample. Thus, sample preparation could be problematic for liquid samples. However, various adaptations of NSOM to examine samples in an aqueous milieu have recently been reported. For example, unlabeled human endothelial cells attached to polished titanium disks have been analyzed with hydrophobically coated optical biosensors mounted on a NSOM (Sommer and Franke, 2002). Rothery et al. (2003) developed a novel light source based on a nanopipette whose distance from the sample surface is controlled by scanning ion conductance microscopy. Höppener et al. (2005) were able to visualize single nuclear pore complexes under physiological conditions by using a new distance control method,and Koopman et al. (2004) reported the high-resolution image of single molecules in dendritic cells under liquid conditions. Therefore, NSOM, together with other microscopic techniques, constitutes a major advance in investigating the properties and functions of membrane proteins in nearly physiological states.
Cellular membranes dynamically reorganize into compartments with different lipid and membrane protein compositions (Miaczynska et al., 2004; Pelkmans et al., 2004; Parton and Simons, 2007). These compartments reflect the functional state of cells hosting membrane proteins that are functionally modulated by their continuous interactions with lipids and other proteins. Thus, it is of particular interest to observe the dynamic assembly of membrane proteins. Single-molecule fluorescence microscopy techniques have the potential to track the movement of an individual membrane protein in cellular membranes (Weiss, 1999; Hell, 2007).
Single-molecule fluorescence microscopy has several advantages over AFM, but there are also disadvantages. Most cellular membranes have more of their surface occupied by membrane proteins than by lipids (Engelman, 2005; Takamori et al., 2006). Additionally, thousands of different membrane proteins continuously move and rearrange in complex cellular membranes. To trace a single fluorophore labeling an individual membrane protein by this technique requires that the light emission by adjacent fluorophores does not overlap. Thus, labeled membrane proteins must be highly diluted to permit their unambiguous detection (Weiss, 1999). Current fluorescence microscopic techniques enable the simultaneous observation of up to six colors. Consequently, single-molecule fluorescence microscopy of membrane proteins in native densely packed cellular membranes provides much valuable information for understanding how individual proteins work. The ultimate goal, however, must be to observe the assembly of all membrane proteins in their native cellular membranes (Engelman, 2005; Takamori et al., 2006) and to track how these proteins rearrange to change the functional state of these structures.
Clearly the power of advanced optical microscopic techniques complement AFM. Imaging cellular processes at molecular resolution is an exciting development of the past 20 years. But how the power of these techniques will be harnessed remains an open biological question.
V. Detecting Intramolecular Interactions of Membrane Proteins by Single-Molecule Force Spectroscopy
A. Description of Single-Molecule Force Spectroscopy
Besides imaging conformations of membrane proteins, AFM can also be used to detect their intra- and intermolecular interactions. In single-molecule force spectroscopy (SMFS) experiments the polypeptide end of a membrane protein is tethered to the AFM stylus while the protein initially is embedded in the lipid membrane (Fig. 11, A–C). This tether can be attached nonspecifically by forced adsorption of the protein polypeptide end to the AFM stylus or by specific binding of a modified peptide end to a functionalized AFM stylus (Oesterhelt et al., 2000). Withdrawing the AFM stylus applies a pulling force that stretches the polypeptide and causes the cantilever to deflect. Sufficiently high forces initiate the sequential unfolding of structural regions of the membrane protein (Oesterhelt et al., 2000). The first membrane protein unfolded by SMFS was the light-driven proton pump, bacteriorhodopsin, from native purple membrane patches of H. salinarum. Force-distance (F-D) spectra recorded upon unfolding this protein show sawtooth-like patterns of force peaks occurring at distances ≤70 nm (Fig. 11D). Each peak represents the stretching of an unfolded polypeptide chain with the height of the force peak reflecting the strength of an interaction established within the membrane protein. The length of the stretched polymer chain is revealed by fitting the force peak to a worm-like chain (WLC) model that describes the stretching of a polymer chain (Rief et al., 1997; Janshoff et al., 2000). Subtracting the stretched polymer length from the terminus locates the structural region that established a barrier to unfolding, an unfolding barrier domain we termed a “structural segment” (Janovjak et al., 2004). Overcoming the stability of each structural segment induces its unfolding. The unfolded polypeptide is extended until the next structural segment establishes another unfolding barrier. Fitting every peak that occurs reproducibly in the F-D spectra with the WLC model locates all major structural segments within the membrane protein (Fig. 11D). The average force required to unfold each structural segment denotes the strength of the interactions stabilizing it.
Fig. 11.
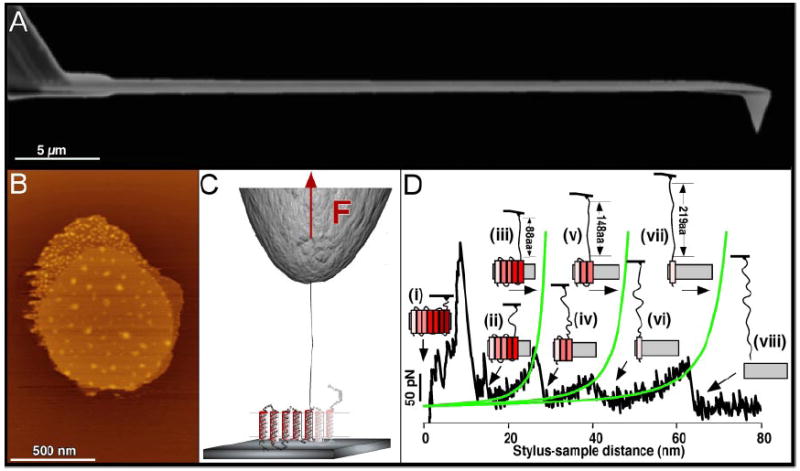
A, a soft AFM cantilever features a molecularly sharp probe that can be applied to a membrane in buffer solution to image a membrane protein. B, cytoplasmic surface of a purple membrane from H. salinarum. After the AFM probe is pushed onto the protein membrane at a force of ~1 nN for ~1 s, adsorption of the terminal end links the protein to the AFM probe. This link is used to apply a pulling force (C) that induces the stepwise unfolding of individual secondary structural segments of the protein while a F-D spectrum (D) is recorded. The force peaks of the F-D spectrum reflect interactions established by the membrane protein. Whereas the force measures the strength of these interactions, the pulling distance locates the amino position at which these interactions occur. This measurement allows the mapping of these interactions onto the primary, secondary, or tertiary structure of the membrane protein. The schematic drawing (i–viii) reflects the stepwise unfolding process of a single bacteriorhodopsin molecule embedded in its native purple membrane. In the unfolding pathway shown, six of the seven transmembrane α-helices unfold in pairs, whereas the seventh α-helix unfolds in a single step.
SMFS attaches the terminus of a membrane protein to a cantilever and applies a mechanical force. This mechanical process induces the stepwise unfolding of the membrane protein. The force required to initiate each unfolding step is a measure of the interactions stabilizing the unfolding intermediates of the protein.
B. Direct Detection and Localization of Interactions
Repeated unfolding of single bacteriorhodopsin molecules produces certain force peaks that are routinely detected in the F-D curve, whereas others occur only occasionally. Statistical analysis of several hundred F-D curves prevents misinterpretation of irrelevant events or artifacts (Kuhn et al., 2005; Mueller et al., 2006; Marsico et al., 2007). Figure 12A shows a superimposition of multiple F-D curves. The relative gray level given to each F-D curve reveals the common interaction patterns among all superimposed F-D curves. Interaction patterns occurring with high probability (>95%) are densely scattered (thick red lines) whereas the ones detected at lower probability show less dense scattering (thin red lines). Fitting each of these force peaks to the WLC model (red lines) reveals portions of the unfolded and stretched polypeptide. Whereas the average unfolding force reveals the strength of the interactions detected, the length of the stretched polypeptide locates the interaction on the protein structure (Oesterhelt et al., 2000; Müller et al., 2002c). These localized interactions stabilize individual structural segments within the protein, which then can be mapped on its primary, secondary, or tertiary structure (Fig. 12B). In general, this approach provides information about the force required to remove either a single or paired transmembrane segments and thus the strength of both membrane-protein and intramolecular protein-protein interactions.
Fig. 12.
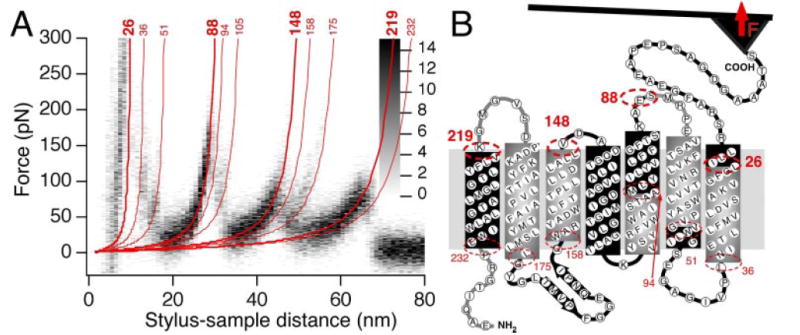
Mapping interactions detected by SMFS onto the membrane protein structure. A, superimposition of 15 F-D curves, each one recorded upon unfolding a single bacteriorhodopsin molecule from its native purple membrane. Superimposition enhances common unfolding patterns recorded among the F-D spectra. Red lines represent WLC fits, revealing the number of amino acids unfolded by each unfolding step. WLC fits of unfolding peaks recorded with a probability of >90% are shown as bold red lines; others occurring at a probability between 10 and 90% are depicted by thin red lines. B, each number of stretched amino acids allows location of an unfolding barrier (red dashed lines) stabilizing a stable structural segment within the protein (equally gray shadowed areas). To locate unfolding barriers within the membrane or opposite to the pulling AFM tip, a factor was applied to compensate for the unfolded polypeptide spanning this region.
In contrast to water-soluble proteins, SMFS induces the sequential unfolding of structural segments of a membrane protein. The applied forces required to initiate the unfolding reflect the strength of the interactions stabilizing the structural segments of the membrane protein. Simply fitting the force peaks detected in the F-D curves by using the WLC model locates the interactions to the structural segments.
C. Unfolding and Folding Pathways
Although some unfolding events are observed in almost every F-D spectrum, others appear with much lower probabilities (≤10%). Every force peak denotes the unfolding of a structural segment within the membrane protein, whereas the sequence of all force peaks measured within one F-D spectrum denote the entire unfolding pathway taken by the membrane protein examined (Fig. 11D). Because individual force peaks reflect unfolding intermediates and exhibit certain probabilities of occurrence, a similar situation holds for all unfolding pathways of membrane proteins. Individual unfolding pathways and probabilities of their occurrence were first observed by SMFS upon unfolding single bacteriorhodopsin molecules (Oesterhelt et al., 2000; Müller and Engel, 2002; Müller et al., 2002c). Interactions within a membrane protein react sensitively to both aqueous and membranous environments (Haltia and Freire, 1995; White and Wimley, 1999). SMFS can trace the extent to which changes in the temperature (Janovjak et al., 2003), buffer solutions (Kedrov et al., 2005; Park et al., 2007), mutations (Sapra et al., 2008), interactions between membrane proteins (Sapra et al., 2006a), and interactions with ligands (Kedrov et al., 2006b; Park et al., 2007) alter interactions established within a membrane protein. Even subtle changes in these interactions can alter the population of unfolding pathways exhibited by a membrane protein (Janovjak et al., 2003; Sapra et al., 2008).
Historically, protein folding was thought to proceed by a series of sequential steps between increasingly native-like structures until the native functional conformation was achieved. Similarly protein unfolding was thought to follow well-defined sequential steps toward denatured conformations. Our observations strongly support the evolving energy landscape model in which the unfolded (folded) protein is funneled by several pathways toward the folded (unfolded) state (Onuchic et al., 1995; Wolynes et al., 1995; Dill and Chan, 1997). Thus, there is not a single but multiple pathways leading to the native or to the denatured state (Fig. 6A). It is assumed that a protein forced toward its unfolded conformation passes through several partially folded structural conformations. The ruggedness of the energy landscape defines the number of possible coexisting conformational substates (Onuchic et al., 1995; Wolynes et al., 1995; Jahn and Radford, 2005; Oliveberg and Wolynes, 2005). In agreement with this model all membrane proteins unfolded thus far by SMFS, such as human aquaporin 1 from erythrocytes (Möller et al., 2003), bacteriorhodopsin (Müller et al., 2002c), halorhodopsin (Cisneros et al., 2005), sensory rhodopsin from H. salinarum (D. A. Cisneros, L. Oberbarnscheidt, A. Pannier, J. P. Klare, J. Helenius, M. Engelhard, F. Oesterhelt, and D. J. Müller, manuscript in preparation), bovine rhodopsin (Sapra et al., 2006b), and the Na+/H+ antiporters NhaA from E. coli (Kedrov et al., 2004) and MjNhaP1 from Methanococcus jannaschii (Kedrov et al., 2007), have shown multiple unfolding pathways, each occurring with different probabilities. We also have shown that the NhaA polypeptide folds into a membrane bilayer via multiple pathways (Kedrov et al., 2006a).
SMFS traces the single unfolding steps of a membrane protein toward its unfolded structure. In contrast with conventional unfolding experiments in which the denatured state merely denotes a nonfunctional protein, the unfolded protein in the SMFS experiment is well defined. SMFS describes the unfolded membrane protein as a fully stretched chain of a polymer. But, this ability to trace the unfolding and folding pathways of single molecules shows the coexistence of multiple unfolding and folding pathways. SMFS detects the probability that a single-membrane protein selects a certain pathway among others. But what are the mechanisms that cause a membrane protein to select a particular pathway among others? The following sections will provide initial insights into these mechanisms that have been revealed.
D. Mapping Intramolecular Interactions of a G Protein-Coupled Receptor
Similar to the case of bacteriorhodopsin (Fig. 11), SMFS was used to detect and locate the interactions established within bovine rhodopsin in the native disk membrane of rod outer segments (Sapra et al., 2006b). Detecting the strength and location of interactions established within the GPCR, the F-D curves allowed us to map these interactions onto the structural segments they stabilized within intact rhodopsin molecules in the dark state (Fig. 13, top row). These stable structural segments are thought to stabilize the native rhodopsin structure. However, it was found that ~80% of highly conserved residues among GPCRs were located in the interior of these structural segments. This arrangement suggested that structural segments stabilized by interactions have another important role, namely to position and maintain highly conserved residues at their functionally important loci.
Fig. 13.
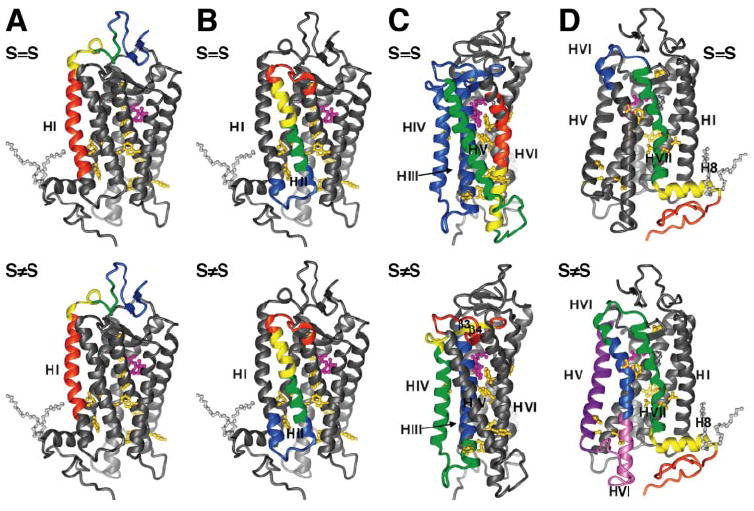
Mapping interactions of bovine rhodopsin as detected by SMFS. Force peaks detected by SMFS are a direct measure of established interactions, and their position in the spectrum permits mapping of these interactions on the tertiary structure of bovine rhodopsin (accession number 1U19 in the PDB). SMFS experiments were conducted on single rhodopsin molecules embedded in native disk membranes of bovine rod outer segments. Each panel highlights a subset of structural segments indicated by different colors. Retinal is colored in magenta and palmitate groups in gray. Highly conserved residues (>80%) among GPCRs are represented in ball and stick form and colored gold. α-Helices are indicated by their number. Interactions of rhodopsin were measured in the presence (S=S) and absence (S≠S) of the stabilizing Cys110–Cys187 disulfide bond. A, interactions in both forms of rhodopsin stabilize similar structural segments of the N terminus, N1 (green) and N2 (yellow). However, the stable structural segment HI (red) established by the transmembrane α-helix I is one α-helical turn shorter in S≠S than in S=S rhodopsin. B, the structural segment C1 (blue) is a little longer in S≠S rhodopsin, but the structural segments HII.1 (green) and HII.2 (yellow) of α-helix 2 and E1 (red) do not change. C, the structural segment formed by HIII, HIV, C2, and E2 (blue) is stabilized by the S=S bond. Other structural segments stabilized by intramolecular interactions are HV and C3 (green), HVI.1 (yellow), and HVI.2 (red). Without a S–S bond, interactions redistribute to stabilize a different set of structural segments: α-helix III (blue) forms one structurally stable unit, C2 and HIV (green) form a single unit, and loop E2 now forms two units, E2.1 (yellow) and E2.2 (red). D, structural segments E3 (blue), HVII (green), H8 (yellow), and CT (red) form a stable unit in the presence of the S=S bond. Without the S=S bond, interactions within rhodopsin E3 and HVII (green) form a different stable structural segment whereas structural segments consisting of HV (purple), C3 and HVI.1 (pink), HVI.2 (blue), H8 (yellow), and CT (red) are mainly essentially the same. H-I, α-helix I; C1, cytoplasmic loop 1; HII.1, cytoplasmic part of α-helix II;HII.2, extracellular part of α-helix II; E1, extracellular loop 1; HIII/IV, α-helices III and IV including their connecting loop; HV*, α-helix V including its cytoplasmic loop; HVI.1, cytoplasmic part of α-helix VI; HVI.2, extracellular part of α-helix VI; HVII, α-helix VII; H8, α-helix 8; CT, C-terminal region. Image adapted from Sapra et al. (2006b).
Single-point mutations of GPCRs, leading to their destabilization and misfolding, are the cause of a number of diseases (Bockaert et al., 2002; Spiegel and Weinstein, 2004; Thompson et al., 2005). Learning how interactions stabilize or destabilize GPCRs is fundamental to our understanding of their function. Most destabilizing mutations in rhodopsin lead to the neurodegenerative disease retinitis pigmentosa (Dryja and Li, 1995; Liu et al., 1996; Rader et al., 2004) and involve a misfolding of GPCRs by replacing the highly conserved Cys110–Cys187 disulfide bond (S=S) with an abnormal disulfide bond established between Cys185 and Cys187. SMFS indicated that interactions within this membrane protein changed their strength and location in the absence of the Cys110–Cys187 bond. Structural segments noted in the absence of this bond stabilized different regions of the protein and failed to center highly conserved residues (Fig. 13, bottom row).
Apparently, interactions stabilizing structural segments within membrane proteins can not only have various origins but also play multiple roles. Aside from stabilizing the secondary and tertiary structure of the membrane protein, they hold highly conserved residues at the place required for the proper function of the membrane protein.
E. Detecting How Intramolecular Interactions of a G Protein-Coupled Receptor Change within a Physiologically Relevant Range
As mentioned, interactions established between and within membrane proteins can react sensitively to the environment. But to what extent do physiologically relevant variations change interactions of a GPCR? And can such changes favor the destabilization of this receptor? To approach these questions, SMFS was used to characterize the interactions within rhodopsin and its dependence on zinc ions. Zn2+ occurs at high concentrations in the retina (Grahn et al., 2001) and zinc deficiency in humans can lead to vision-related disorders such as poor dark adaptation, night blindness, and retinal degeneration (Ugarte and Osborne, 2001). The role of Zn2+ in vision probably relates to rhodopsin because it directly associates with this receptor (Shuster et al., 1992; Stojanovic et al., 2004) and increases its phosphorylation (Shuster et al., 1996). Furthermore, the presence and absence of Zn2+ changes the pattern of thermal bleaching and regeneration of rhodopsin by 11-cis-retinal (del Valle et al., 2003; Stojanovic et al., 2004). To screen for the role of Zn2+ as opposed to other divalent ions, SMFS experiments were conducted on rhodopsin embedded into its native disk membrane and exposed to a buffer that contained different concentrations and types of divalent ions (Park et al., 2007). Under these conditions it was shown that increasing the Zn2+ concentration stepwise from 0 to 100 μM increased the strength of those interactions, stabilizing the secondary structure elements of rhodopsin. Concentrations of Zn2+ greater than 100 μM did not strengthen these interactions further. Zn2+ exhibited differential effects on single structural segments because some were stabilized more than others (Fig. 14). In addition, Zn2+ showed a pronounced stabilizing effect on the highly conserved C110–C187 bond whose absence destabilizes rhodopsin and leads to neurodegenerative diseases. Zn2+ stabilized almost all structural segments of rhodopsin compared with the divalent ions Ca2+, Cd2+, and Co2+ (Fig. 14). The result suggest a specific interaction between this cation and rhodopsin.
Fig. 14.

Zn2+ binding changes interactions stabilizing the structural segments of bovine rhodopsin in native disk membrane. The specific interaction of Zn2+ compared with that of other divalent ions in stabilizing secondary structures of rhodopsin is shown (Park et al., 2007). Forces stabilizing the structural segments were determined by SMFS. HI, α-helix I; C1, cytoplasmic loop 1; HII.1, cytoplasmic part of α-helix II; HII.2, extracellular part of α-helix II; E1, extracellular loop 1; HIII/IV, α-helices III and IV including their connecting loop; HV*, α-helix V including its cytoplasmic loop; HVI.1, cytoplasmic part of α-helix II; HVI.2, extracellular part of α-helix VI; HVII, α-helix VII; H8, α-helix 8; CT, C-terminal region.
Many membrane proteins show specific interactions with ions, and SMFS is capable of detecting the specific interactions of ions with membrane proteins. Thus, SMFS allows screening of the complex interactions of ions with a membrane protein and at the same time locates the ionic interactions to structural regions and quantifies their strength.
F. Detecting and Locating Ligand-Binding That Modulates the Functional State of Single-Membrane Proteins
Forces measured by SMFS reflect interactions of many different origins (Israelachvili, 1985; Haltia and Freire, 1995; White and Wimley, 1999; Howard, 2001). Aside from determining elastic or inelastic properties of the membrane, such complex interactions can ultimately be traced back to electrostatic, hydrophobic, van der Waals, steric, and other types of interactions. Thus, such interactions can not only stabilize a membrane protein structure but, for example, also guide the binding of a ligand to a receptor and the subsequent ligand-induced switching of its functional state. The capacity of SMFS to detect interactions mediated by the binding of different ligands that switch the functional state of a membrane protein was first demonstrated with the H+/Na+ antiporter NhaA (Kedrov et al., 2005, 2006b).
Secondary active transport, driven by the electrochemical potential difference created by pumping ions out of the cell rather than by ATP, is mediated by the uniport, symport, or antiport of ions or small molecules. These transporters play a central role in human health and disease because they facilitate solute accumulation and toxin removal against concentration gradients by using energy supplied by ion gradients across cell membranes. Regulation of proton and Na+ gradients is involved in virtually every physiological process. Na+/H+ antiporters regulate intracellular pH, cellular Na+ concentration, and cell volume of eukaryotic and prokaryotic organisms. In E. coli, two antiporters, NhaA and NhaB, specifically exchange Na+ and Li+ ions for H+, allowing the cell to adapt to high environmental salinity and to grow at an alkaline pH (Padan et al., 2001). The activity of NhaA is highly dependent on intracellular pH and increases 2000-fold upon changing of the pH from 7 to 8 (Taglicht et al., 1991). Structural analysis of NhaA revealed that the NhaA polypeptide folds into 12 transmembrane α-helices (Hunte et al., 2005).
Unfolding a single NhaA embedded in a lipid membrane by SMFS revealed a characteristic F-D spectrum (Kedrov et al., 2004, 2005). Superimposition of many unfolding spectra revealed their common force peaks (Fig. 15A, left). Each force peak represents an interaction of the protein that has been ruptured. Whereas the force exerted reflects the strength of the interaction, the position of the peak can be used to locate and to map the interaction on the NhaA structure (Fig. 15A, right). NhaA shows an almost 2000-fold decrease in activity between pH 7 and 3.7. Intramolecular interactions detected under these conditions thus map interactions of the inactive transporter. At pH values ranging between 7 and 8 the transporter is fully active. Detecting the intramolecular interactions of fully active NhaA showed an additional force peak (Fig. 15B, left) (Kedrov et al., 2005). Fitting this force peak with the WLC model located the intramolecular interactions that established this particular force within the transporter (Fig. 15B, right). This interaction occurred at the functionally relevant amino acids Asp164 and Asp165 of α-helix V forming the ligand-binding site (Fig. 16A). Moreover, this interaction at the ligand-binding pocket was established only in the presence of the ligand, a single Na+ ion. It disappeared in absence of Na+ independently of the buffer pH. Thus, it was shown that SMFS is sufficiently sensitive to detect the binding of a ligand to a membrane protein and to locate this binding to functionally important amino acids in the ligand-binding pocket.
Fig. 15.
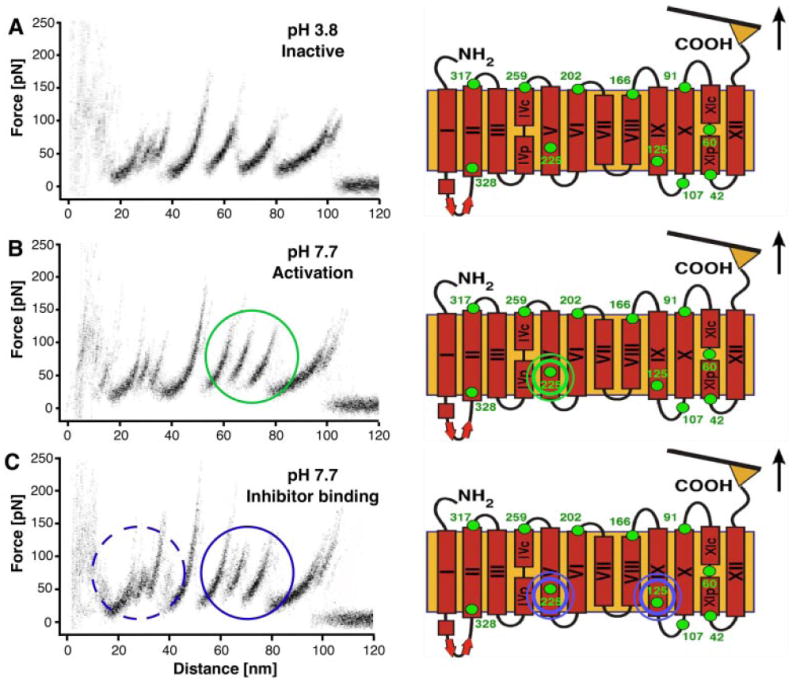
SMFS provides a functional fingerprint of membrane proteins. A, Superimposed F-D spectrum recorded upon unfolding of a single inactive NhaA in the absence of ligand (Na+). This superimposition identifies interactions reproducibly detected among antiporters. By fitting each of the force peaks to the WLC model, the distance from the polypeptide end (here the C-terminal end) at which the interaction occurred could be calculated (Kedrov et al., 2004). These interactions then could be located and mapped onto the protein structure (green dots) (Hunte et al., 2005). B, Superimposed F-D spectra recorded upon unfolding of a single active NhaA in the presence of its ligand (Na+). An additional force peak (green circle) occurred at amino acid position 225 from the C-terminal end. This measurement locates an interaction established at the center of transmembrane α-helix V hosting the ligand-binding sites, Asp164 and Asp165. C, The inhibitor AP establishes interactions at the ligand-binding site of α-helix V and at α-helix IX. SMFS experiments showed that AP competes with the ligand and binds at the ligand-binding pocket of NhaA. The additional interaction established by AP at α-helix IX reduces the functionally important flexibility of this α-helix that leads to inactivation of this antiporter (Kedrov et al., 2006b).
Fig. 16.
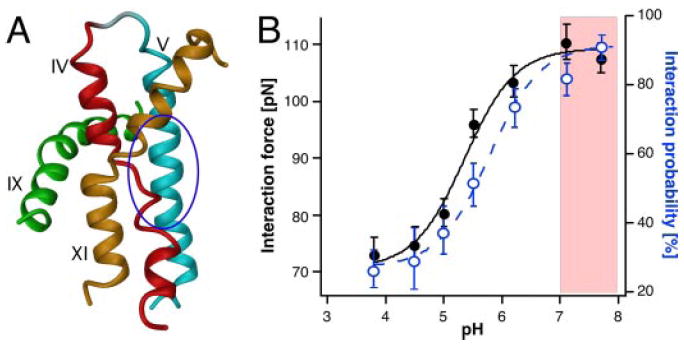
Detecting ligand-binding to a transporter by SMFS. Ligand (Na+)-binding to the Na+/proton antiporter NhaA from E. coli establishes an additional interaction within the membrane protein. SMFS detects this interaction force and allocates it to the ligand-binding site formed by Asp164 and Asp165 of α-helix V (A, blue ellipse). The structure shows 4 of 12 transmembrane α-helices that establish the ligand-binding pocket of NhaA (Hunte et al., 2005). B, pH dependence of the average interaction force established due to ligand binding. At pH >7 the interaction force due to ligand-binding is fully developed. In this region biochemical bulk experiments suggest that NhaA is fully active. The curve showing the probability of detecting the occurrence of ligand-binding as a function of pH (blue data points) is slightly shifted to the right relative to that depicting the interaction forces. This relationship suggests that although the full activity of all NhaA molecules is reached between pH 7 and 8, some NhaA molecules are activated at lower pH values (Kedrov et al., 2005).
SMFS experiments could further unravel details of interactions established upon ligand-binding that functionally activate the transporter (Fig. 16). Whereas in the inactive state the average interaction force established at the ligand-binding site was slightly greater than 70 pN, this force approached almost 110 pN when the activated transporter was fully occupied by ligand (pink-shaded region of Fig. 16B). The probability of a ligand binding and activating the transporter showed a slow pH-dependent transition from the inactive to the active state. Following this transition allowed a determination of the percentage of transporters that became activated at each pH value. Full saturation of activated transporters with ligand was reached at pH values between 8 and 9, a result that is reasonably compatible with bulk experiments suggesting full activity of the entire population of NhaA transporters between pH 7 and 8.
In further experiments conducted on the same transporter, SMFS was applied to characterize the interactions established upon inhibitor binding (Kedrov et al., 2006b). Biochemical studies had previously shown that 2-aminoperimidine inhibits NhaA, with an IC50 of ~1 mM (Dibrov et al., 2005). SMFS detected 2-aminoperimidine interactions at the ligand-binding site of this transporter (Fig. 17A). These could be suppressed at high concentrations of ligand (Na+), implying that 2-aminoperimidine targets the same binding site as the ligand and thus competes with it. However, the inhibitor induced an additional interaction located at transmembrane helix IX, a location different from that established for ligand binding and functional activation of NhaA (Fig. 15, B and C). The strength of this additional interaction established with inhibitor binding was almost 2-fold higher (~140 pN) compared with the interaction stabilizing this helix in the absence of the inhibitor. A histogram of the unfolding forces directly reflecting the strength of these interactions revealed two populations of NhaA molecules (Fig. 17, B and C). One class of NhaA molecules showed no enhanced interaction at α-helix IX, whereas the other class showed enhanced interactions at this site upon AP binding. Without knowing the activated NhaA structure, it is difficult to understand the inactivation mechanism triggered upon AP binding. Presumably the flexibility of α-helix IX plays a key role in activating the protein (Hunte et al., 2005). SMFS experiments suggest that AP directly interacts with the ligand-binding pocket of NhaA, establishing a competitive inhibition mechanism in the presence of the ligand. But in contrast to ligand-binding, inhibitor binding established additional interactions at α-helix IX of the antiporter-binding pocket (Fig. 17, B and C). A plausible interpretation of these results is that the enhanced interactions established upon inhibitor binding further stabilized α-helix IX thereby altering its functionally important flexibility and leading to inhibition of the transporter. This result would be similar to that observed by X-ray crystallography for the structurally related Na+ transporter LeuTAa (Yamashita et al., 2005).
Fig. 17.

Inhibitor binding to a transporter examined by SMFS. A, similar to a ligand, the inhibitor AP binds to the ligand-binding pocket of NhaA, thereby establishing an interaction in close proximity to Asp164 and Asp165 of transmembrane α-helix V (blue dotted ellipse). But in contrast to the ligand, AP binding to the ligand-binding pocket establishes an enhanced interaction at α-helix IX (green ellipse). Presumably this interaction decreases the functionally relevant flexibility of this α-helix (Kedrov et al., 2006b). B and C, interaction strengths established in the absence (red curve) and in the presence of AP (yellow curve). With increasing AP concentrations the antiporter molecules having established the inhibiting interaction (yellow curve in C) increase.
The possibility of detecting and locating interactions established between a membrane protein and a given molecular compound opens up new avenues for functional and structural characterization. Moreover, because F-D spectra reflect the interactions determining the functional state, the membrane protein SMFS can be, in principal, applied to detect the interaction and the functional impact of pharmacological compounds on membrane proteins in their native membranes.
G. Energy Landscape of Membrane Protein Unfolding and Thermodynamic Considerations
Forces detected by SMFS that measure the interactions of membrane proteins are commonly expressed in terms of energetic parameters such as energy barriers, lifetimes, or energy differences. The first quantitative understanding of the relationship between interaction forces and their underlying energy landscapes was provided by dynamic SMFS, which forces molecular bonds to break at different force-loading rates (Evans and Ritchie, 1997; Hummer and Szabo, 2003). Dynamic SMFS has found numerous applications for water-soluble proteins and various noncovalent biological bonds (Evans, 2001; Bustamante et al., 2004). In the simplest model, the two states describing a low-energy intact and high-energy broken biological bond are confined by a single energy barrier. The peak of this barrier describes the transition state separated from the bond state by a characteristic distance, xu, that describes the reaction coordinate in the two-state potential. In the absence of an externally applied force, the thermally activated transition rate over this barrier, ku, is given by an Arrhenius-type equation (eq. 1)
| (1) |
following Kramers’s theory of overdamped reaction kinetics (Kramers, 1940; Hanggi et al., 1990). τD reflects the relaxation time of the molecular bond, gives the height of the energy barrier (the free energy of activation), kB is the Boltzmann constant and T is the temperature. As first shown by Bell (1978), the height of the energy barrier is lowered under an externally applied force, F, given by eq. 3, where
| (2) |
xβ = xu cos θ projects the barrier along the direction of the applied force. The angle θ describes deviations between the naturally occurring reaction coordinate from the reaction forced into the pulling direction (Evans and Ritchie, 1997; Evans, 2001). Considering this alteration of the energy landscape by an externally applied force, dynamic SMFS measures the most probable rupture force as a function of the pulling velocity or force-loading rate, rf (i.e., the rate at which force is applied to the bond in units of newtons per second) (Fig. 18). Accordingly, the most probable unfolding force of a molecular bond, F* (Fig. 18C), is affected by the force-loading rate according to eq. 3 (Evans and Ritchie, 1997; Evans, 2001). Applying eq. 3 to a dynamic SMFS plot (Fig. 18) reveals the distance of the projected energy barrier to the transition state, xβ, and the dissociation rate, ku, describing an intact bond stabilizing a defined structural configuration by a two-state energy landscape:
Fig. 18.

Two-state energy potential for the interpretation of dynamic SMFS unfolding experiments. A, the two-state landscape is characterized by one sharp potential barrier separating the folded state from the unfolded state. represents the activation energy for unfolding, ΔGu (ku, respectively) the stability (lifetime) of the folded structure, and xu (the width of the potential barrier) the distance along the reaction coordinate from the folded state to the transition state (‡). Extension of the folded state by the width of the potential barrier triggers the unfolding process. A Gaussian-distributed, position-independent root mean square scale, ε, describes the roughness of the energy surface. B, unfolding forces measured at different force loading rates as a function of temperature. This example shows forces measured for the pairwise unfolding of transmembrane α-helices B and C of bacteriorhodopsin. For a single potential barrier, plotting the most probable force against the logarithm of the loading rate yields a single linear pattern. Fitting the data using eq. 3 (solid lines) reveals xβ and ku. The experimental data shows the unfolding forces detected at different temperatures. Because the temperature changes the molecular interactions established within the membrane protein (Janovjak et al., 2003), it also alters the energy landscape. Accordingly, xβ and ku for α-helices B and C are 7.67 ± 0.03 Å and 2.7 × 10⁻⁵ s−1 for 18°C, 6.52 ± 1.65 Å and 7.0 × 10⁻⁴ s−1 for 27°C, and 4.11 ± 0.40 Å and 8.1 × 10⁻² s−1 for 42°C (Janovjak et al., 2007). From these temperature-dependent data it was possible to reconstruct the roughness of the energy surface of α-helices B and C to ε = 22.33 pN-nm (~5 keT). C, force histogram of the transmembrane α-helices D of bacteriorhodopsin unfolded at a loading rate of 3067 pN/s (654 nm/s pulling speed). The histogram is well described by a Gaussian fit centered at the most probable rupture force (here 77.2 ± 3.4 pN). The stochastic spread of the data with a S.D. of keT/xβ is intrinsic to forced unfolding experiments. Reprinted from Janovjak H, Sapra KT, Kedrov A, and Müller DJ (2008) From valleys to ridges: exploring the dynamic energy landscape of single membrane proteins. ChemPhysChem 9: DOI: 10.1002/cphc.200700662 with permission from Wiley-VCH.
| (3) |
Dynamic SMFS has been successfully applied to describe the two-state energy landscapes of the transmembrane α-helices of bacteriorhodopsin (Janovjak et al., 2004). These α-helices have certain probabilities of acting independently by unfolding in individual steps or acting collectively by unfolding in pairwise events. In both cases, the unfolding forces and pulling velocity show a logarithmic dependence, indicating that one sharp energy barrier is crossed during unfolding (Janovjak et al., 2004). Submitting the dynamic SMFS plots to Monte-Carlo simulations revealed energy barrier widths of ~0.5 nm (Janovjak et al., 2004, 2007). Thus, it could be inferred that extending the α-helices by less than 10% (~2 amino acids) of their length induced their cooperative unfolding (Janovjak et al., 2004). The small widths of the potential barriers further revealed that the unfolding pathways of single-membrane proteins observed in the F-D spectra indeed represent different trajectories crossing distinct energy barriers in the unfolding energy landscape. Transition rates determine the time required to cross an energy barrier. In the case of bacteriorhodopsin, the transition rates crossing these barriers were of the order of ~10−2 s−1 for single α-helices and of ~10−4 s−1 for pairs of α-helices (Janovjak et al., 2004). From these values the typical stability of a single transmembrane α-helix could be calculated as ~100 s and that of paired transmembrane α-helices as ~104 s. The magnitude of these values compares favorable with those observed for water-soluble proteins (Best et al., 2001; Williams et al., 2003), indicating that individual transmembrane α-helices form stable folding intermediates.
Dynamic force spectroscopy observes how interactions established within membrane proteins change over the externally applied force-loading rate. Theoretical models extract information about the underlying energy barriers formed. The transition rate of a barrier approximates the lifetime of a structural state, whereas the distance from the unperturbed state to the transition state estimates the stability of the state.
H. Changes in Intramolecular Interactions Alter the Energy Landscape of Membrane Proteins
The energy landscape model (Onuchic et al., 1995; Wolynes et al., 1995; Dill and Chan, 1997) suggests that protein unfolding pathways are sensitive to experimental and environmental conditions. SMFS can trace how single-membrane proteins populate unfolding pathways differently upon environmental changes (Janovjak et al., 2003, 2006; Sapra et al., 2006a; Kedrov et al., 2007; Park et al., 2007). In addition, dynamic SMFS experiments have demonstrated that the externally applied force-loading rate could reveal whether secondary structural elements unfolded separately or grouped with others. At enhanced pulling speeds, the probability of individual transmembrane α-helices of bacteriorhodopsin unfolding dominated over their groupwise unfolding. Conversely, most transmembrane helices followed pairwise unfolding pathways at low pulling speeds. This trend could be extrapolated to the equilibrium state occurring in absence of an externally applied force wherein transmembrane α-helices unfolded nearly exclusively in a pairwise manner (Janovjak et al., 2004). Thus, under equilibrium conditions, the energy barrier for pairwise unfolding was significantly smaller than that for individual unfolding of identical α-helices. Because the folding pathways of a membrane protein may not be the same as the unfolding pathways, it is not clear yet whether the energy landscape reconstructed from unfolding data, also describes the folding pathways of membrane proteins. However, if this idea is confirmed, our experimental finding would agree well with other results, suggesting that pairwise association of transmembrane α-helices plays an important role in membrane protein folding (Engelman and Steitz, 1981; Engelman et al., 2003).
Studies of the unfolding of single bacteriorhodopsin molecules at different physiological temperatures ranging from 8 to 52°C demonstrated that the overall population of unfolding pathways did not change with increasing temperature (Janovjak et al., 2003). However, the probability that a single bacteriorhodopsin would select one of many coexisting unfolding pathways was markedly affected by temperature. Increasing the temperature increased the probability of pairwise unfolding of transmembrane α-helices, whereas lowering the temperature favored the unfolding of single α-helices in individual steps. Thus, increasing the temperature changed certain energy barriers in the energy landscape more than others. This selective manipulation of energy barriers of the unfolding energy landscape (Janovjak et al., 2003) nicely traces how environmental alterations can change the general unfolding behavior of an entire membrane protein.
Interactions established within and between proteins depend on environmental changes, and changes of these interactions alter the energy landscape as well. Because the reaction pathways of membrane proteins funnel along these pathways, changes of the energy landscape can alter these pathways. As a consequence a membrane protein can choose a new pathway or populate existing pathways differently.
I. Mutations Change the Energy Landscape and Reaction Pathways of Membrane Proteins
Interactions stabilizing membrane proteins are crucial factors in determining membrane protein folding, stability, function, and energy landscapes. The great sensitivity and precision of SMFS to detect forces at piconewton resolution and to locate these forces with nanometer precision allowed detection and analysis of local changes in membrane protein intramolecular interactions. In the case of H. salinarum bacteriorhodopsin, five single-point mutations have been studied to investigate the role of Pro residues, P50A, P91A, P186A, M56A, and Y57A, on the membrane protein stability (Sapra et al., 2008). It was expected that a point mutation might insert a new interaction(s) thereby creating different stable structural segments within the membrane protein. Alternatively, a point mutation might change the mechanical stability of a specific α-helix containing a mutation or through longer range effects change the stability of other α-helices and polypeptide loops. Surprisingly, none of the five mutations investigated changed the positions of the structural segments in bacteriorhodopsin, leading to the conclusion that these point mutations neither induced a new unfolding barrier nor deleted an existing one. Presumably the possible changes induced by the mutations investigated were buffered by amino acids of the same or adjacent structural segments and thus they were not efficient in creating new unfolding barriers. Indeed, the unfolding pathways of the mutated bacteriorhodopsin molecules remained the same. However, in apparent contrast with wild-type bacteriorhodopsin, these mutations could change the population of certain unfolding pathways compared with others. In some examples, insertion of a single-point mutation could shift the population of specific unfolding pathways by several orders of magnitude (Sapra et al., 2008).
Dynamic SMFS measurements were obtained to determine the effect of the above five mutations on the values for the distance between folded and transition state, xu, and transition rate, ku, which characterize the unfolding barriers of bacteriorhodopsin. This information then was compared with the bacteriorhodopsin mutant structures and thermodynamic stabilities were estimated from chemical unfolding (Faham et al., 2004; Yohannan et al., 2004). Although in most cases xu and ku of all detected structural segments scattered around the values of wild-type bacteriorhodopsin, each of the mutations significantly changed the transition state and the unfolding rates of particular barriers of the energy landscape (Fig. 19) (Sapra et al., 2008). A point mutant could increase or decrease the transition state and the unfolding rates of a structural segment in which it was inserted. We consider such a change of the energy barrier in a stable structural segment hosting the mutant as being “localized.” However, it was observed that a point mutation could also show significant effects on unfolding barriers for structures not hosting the mutation. These latter changes in the energy barriers may be due to cooperative interactions within the membrane protein. Thus, the dynamic SMFS data can reveal both localized and “global” changes of interactions caused by point mutations within a membrane protein.
Fig. 19.

Free energy diagram of the mechanical unfolding of α-helices B and C in wild-type (WT) and mutant bacteriorhodopsin. A, activation energies ( and xu were obtained from dynamic SMFS data). We assumed that the total distance between the energy minima representing the folded (left) and unfolded stretched state (right) represent the length of the fully stretched polypeptide chain of α-helices B and C of ~71 amino acids (0.36 nm × 71 = 25.56 nm) and that all the intermediate states have a common origin. As shown, the positions of the transition state for the P50A, P91A, P186A, M56A, and Y57A were significantly shifted toward the folded state of α-helices B and C. All mutations decreased the heights of the unfolding energy barriers. B, quantitative relationship between the shift of energy barriers and the decrease in kinetic stability. The plot of Δxu/ku_WT versus Δln(ku)/ln(ku_WT) shows that in the structural segment constituted by α-helices B and C of the mutants xu increases with increasing activation energy. However, the trend followed by a structural segment of a mutant in one pathway was not the same as that in another pathway (not shown).
Whereas point mutations inserted into a membrane protein can show “local effects” affecting the energy barrier stabilizing the hosting structural segment, they also can show “global effects” affecting the energetic properties of other structural segments. Because an unfolding pathway of a membrane protein reflects its movement through the sequence of unfolding barriers, even small changes of these energetic barriers such as those introduced by a point mutation can favor definite unfolding pathways. Many human diseases are related to point mutants that lead to the destabilization and misfolding of membrane proteins (Sanders and Myers, 2004). In the future, SMFS and dynamic force spectroscopy may be used to investigate the underlying mechanisms that cause membrane protein to take certain unfavorable reaction pathways, which lead to their destabilization and malfunction.
VI. Pharmacological Challenges and Opportunities Involving Membrane Proteins
Lack of high-resolution structure for a vast majority of membrane proteins is a great handicap for rational drug design. So a select number of structures are routinely used to model other members of a particular subfamily. For example, the structure of rhodopsin (Palczewski et al., 2000) spurred great interest in modeling other GPCRs (Filipek et al., 2003b). The recent structure determination of the mutant β2-adrenergic receptor (Cherezov et al., 2007) provides a more reliable template for the GPCR prediction (Fig. 20). But how good these models really are is highly questionable or at least uncertain. One of several methods used to validate a structural model is mutagenesis. However, introducing amino acid substitutions disregards possible side chain reorganization of other amino acids caused by these perturbations and changes in the structure could readily be on a scale of the space occupied by a functional ligand. Clearly the generation of more advanced models and further molecular dynamic approaches will provide more accurate models. The question of identifying region of ligand binding in the membrane proteins could be overcome by a careful SMFS analyses (Park et al., 2007).
Fig. 20.
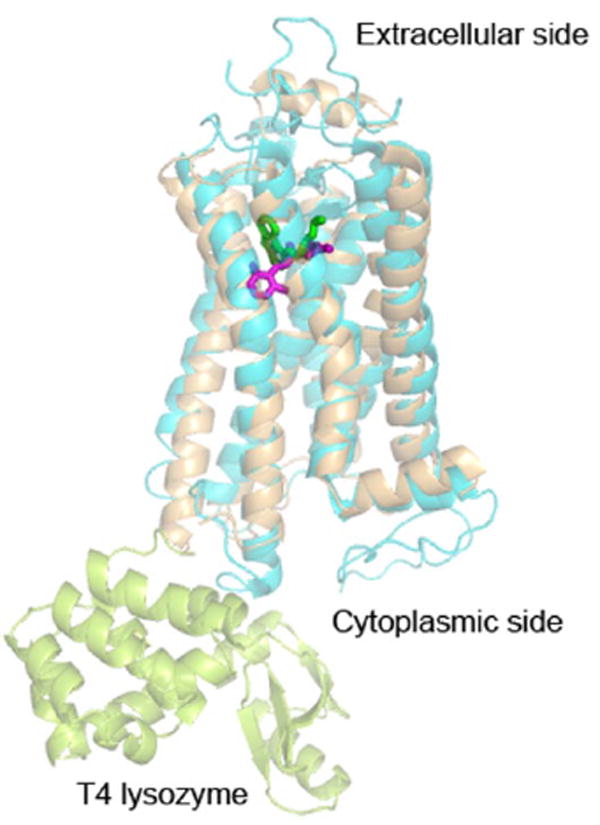
Ribbon diagram of β2-adrenergic receptor fusion protein with lysozyme (PDB code: 2RH1, light orange) superimposed on bovine rhodopsin (PDB code: 1U19, cyan). The fused T4 lysozyme to the β2-adrenergic receptor is shown in lemon. The bound ligand, carazolol, is shown in green sticks and the bound retinal in magenta sticks. The two classes of GPCRs share overlapping ligand-binding pockets.
Tissue-specific expression also influences the way membrane proteins interact with a specific subset of auxiliary proteins and lipids. To date, more emphasis has been placed on studies of heterologous cell lines such as HEK293 without developing suitable methods to study membrane proteins in native tissues. Likewise imaging of these proteins in native tissues is needed to understand their in vivo organization. Examples of several different techniques have been described in this review. One in particular is pharmacologically relevant. Using NSOM to determine relative fluorescence intensities associated with nanodomains of β-adrenergic receptor clusters in caveolae, Pezacki and colleagues estimated receptor density within the observed nanometer features and established a lower limit for the number of receptors in the cell’s signalosome (Ianoul et al., 2005). Creative investigators undoubtedly will soon provide additional innovations.
Finally, the numbers of subtypes of all major groups of membrane proteins make it difficult to explain the specificity for just one subtype or one specific complex. Typically, genetically engineered mice open the possibility of dissecting out the function of specific types of membrane proteins. Oligomerization of membrane proteins provide a great opportunity to identify inhibitors of physiologically relevant self-association processes. Such inhibitors could provide the way of overcoming the subtype specificity. Because membrane proteins are vital to cellular function, creative and rational together with brute force approaches will succeed in identifying new selective therapeutic agents.
VII. Unresolved Issues and Concluding Remarks
Despite impressive progress, there are still many unresolved issues about membrane biology to address. In our opinion, some of the most important problems that need to be addressed are the following:
Many additional high-resolution structures of membrane proteins are needed, especially those with bound ligands, such as agonists and antagonists, metal ions, or other small molecules. High-resolution structures of critically important GPCRs with their ligands and/or cognate interacting proteins would be especially desirable. Such structures, in addition to existing rhodopsin and β2-adrenergic receptor molecular models, are required not only for understanding the transduction of signals across membranes but are also a prerequisite for designing ligands that target this class of medically important membrane proteins.
The molecular and structural bases for mechanisms involved in receptor activation, ion conductance, and ligand transport need to be determined, particularly in native tissues under physiologically relevant conditions. The dynamics of protein, lipid, and lipid-protein interactions need to be extensively investigated both by direct experiments and theoretical and computational methods.
A molecular understanding of the physiological role of oligomerization and quaternary structure relevant to function needs to be achieved. Moreover, such studies need to relate to the homeostatic cycle of membrane proteins that include synthesis, intracellular transport, phagocytosis, and degradation. Factors that dictate different functional states in different locations within cells also must be identified, and their mechanisms of action must be elucidated.
Understanding the energy landscape of membrane proteins and the changes it undergoes upon binding of ligands will be important for understanding mechanisms of drug action and the design of novel therapeutics. Similar considerations apply to the understanding of protein folding, insertion into the membrane, and unfolding by mechanical forces.
Time-resolved high-resolution images of biological membranes in native tissues are needed to correlate molecular mechanisms with structural changes. And more understanding of the energy landscape is vital to describe reaction kinetics of membrane proteins; this includes changes in the energy landscape that occur upon oligomerization and either binding or passage of ligands.
Acknowledgments
We thank Drs. Leslie T. Webster Jr., Michael E. Maguire, Paul Park, Kevin D. Ridge, Chris Dealwis, and Thomas Angel and Debarshi Mustafi for extremely helpful comments on the manuscript. This work was supported by National Institutes of Health Grant R01EY008061, R03EY017004, and R01GM079191, by the Deutsche Forschungsgemeinschaft, and by the Sandler Program for Asthma Research.
Footnotes
This article is available online at http://pharmrev.aspetjournals.org.
Abbreviations: LTC4S, leukotriene C4 synthase; FLAP, 5-lipoxy-genase-activating protein; PI, phosphatidylinositol; AFM, atomic force microscopy; GPCR, G protein-coupled receptor; PDB, Protein Data Bank; SPM, scanning probe microscopy; Cx26, connexin 26; NSOM, near-field scanning optical microscopy; SMFS, single-molecule force spectroscopy; F-D, force-distance; WLC, worm-like-chain; AP, 2-aminopyrimidine.
References
- Ago H, Kanaoka Y, Irikura D, Lam BK, Shimamura T, Austen KF, Miyano M. Crystal structure of a human membrane protein involved in cysteinyl leukotriene biosynthesis. Nature. 2007;448:609–612. doi: 10.1038/nature05936. [DOI] [PubMed] [Google Scholar]
- Agre P. The aquaporin water channels. Proc Am Thorac Soc. 2006;3:5–13. doi: 10.1513/pats.200510-109JH. [DOI] [PMC free article] [PubMed] [Google Scholar]
- Ahram M, Litou ZI, Fang R, Al-Tawallbeh G. Estimation of membrane proteins in the human proteome. In Silico Biol. 2006;6:379–386. [PubMed] [Google Scholar]
- Albert AD, Boesze-Battaglia K. The role of cholesterol in rod outer segment membranes. Prog Lipid Res. 2005;44:99–124. doi: 10.1016/j.plipres.2005.02.001. [DOI] [PMC free article] [PubMed] [Google Scholar]
- Alberts B. Molecular Biology of the Cell. Garland Science; New York: 2008. [Google Scholar]
- Amrein M, Müller DJ. Sample preparation techniques in scanning probe microscopy. Nanobiology. 1999;4:229–256. [Google Scholar]
- Andersen C, Schiffler B, Charbit A, Benz R. PH-induced collapse of the extracellular loops closes Escherichia coli maltoporin and allows the study of asymmetric sugar binding. J Biol Chem. 2002;277:41318–41325. doi: 10.1074/jbc.M206804200. [DOI] [PubMed] [Google Scholar]
- Ando T, Kodera N, Naito Y, Kinoshita T, Furuta K, Toyoshima YY. A high-speed atomic force microscope for studying biological macromolecules in action. Chemphyschem. 2003;4:1196–1202. doi: 10.1002/cphc.200300795. [DOI] [PubMed] [Google Scholar]
- Armstrong CM. Voltage-gated K channels. Sci STKE. 2003;2003:re10. doi: 10.1126/stke.2003.188.re10. [DOI] [PubMed] [Google Scholar]
- Arnold WN. Yeast Cell Envelopes–Biochemistry, Biophysics, and Ultrastructure. CRC Press; Boca Raton, FL: 1981. [Google Scholar]
- Ash EA, Nicholls G. Super-resolution aperture scanning microscope. Nature. 1972;237:510–512. doi: 10.1038/237510a0. [DOI] [PubMed] [Google Scholar]
- Barker CJ, Leibiger IB, Leibiger B, Berggren PO. Phosphorylated inositol compounds in β-cell stimulus-response coupling. Am J Physiol. 2002;283:E1113–E1122. doi: 10.1152/ajpendo.00088.2002. [DOI] [PubMed] [Google Scholar]
- Bayburt TH, Leitz AJ, Xie G, Oprian DD, Sligar SG. Transducin activation by nanoscale lipid bilayers containing one and two rhodopsins. J Biol Chem. 2007;282:14875–14881. doi: 10.1074/jbc.M701433200. [DOI] [PubMed] [Google Scholar]
- Bean BP. The action potential in mammalian central neurons. Nat Rev Neurosci. 2007;8:451–465. doi: 10.1038/nrn2148. [DOI] [PubMed] [Google Scholar]
- Behnia R, Munro S. Organelle identity and the signposts for membrane traffic. Nature. 2005;438:597–604. doi: 10.1038/nature04397. [DOI] [PubMed] [Google Scholar]
- Bell GI. Models for the specific adhesion of cells to cells. Science. 1978;200:618–627. doi: 10.1126/science.347575. [DOI] [PubMed] [Google Scholar]
- Benedetti A, Bánhegyi G, Burchell A. Endoplasmic Reticulum: A Metabolic Compartment. IOS Press; Amsterdam: 2005. NATO Public Diplomacy Division. [Google Scholar]
- Bennett MJ, Choe S, Eisenberg D. Domain swapping: entangling alliances between proteins. Proc Natl Acad Sci U S A. 1994;91:3127–3131. doi: 10.1073/pnas.91.8.3127. [DOI] [PMC free article] [PubMed] [Google Scholar]
- Bennett MJ, Schlunegger MP, Eisenberg D. 3D domain swapping: a mechanism for oligomer assembly. Protein Sci. 1995;4:2455–2468. doi: 10.1002/pro.5560041202. [DOI] [PMC free article] [PubMed] [Google Scholar]
- Best RB, Li B, Steward A, Daggett V, Clarke J. Can non-mechanical proteins withstand force? Stretching barnase by atomic force microscopy and molecular dynamics simulation. Biophys J. 2001;81:2344–2356. doi: 10.1016/S0006-3495(01)75881-X. [DOI] [PMC free article] [PubMed] [Google Scholar]
- Bevans CG, Harris AL. Regulation of connexin channels by pH: direct action of the protonated form of taurine and other aminosulfonates. J Biol Chem. 1999;274:3711–3719. doi: 10.1074/jbc.274.6.3711. [DOI] [PubMed] [Google Scholar]
- Bezanilla F. The voltage sensor in voltage-dependent ion channels. Physiol Rev. 2000;80:555–592. doi: 10.1152/physrev.2000.80.2.555. [DOI] [PubMed] [Google Scholar]
- Bhandawat V, Reisert J, Yau KW. Elementary response of olfactory receptor neurons to odorants. Science. 2005;308:1931–1934. doi: 10.1126/science.1109886. [DOI] [PMC free article] [PubMed] [Google Scholar]
- Binnig G, Gerber C, Stoll E, Albrecht TR, Quate CF. Atomic resolution with atomic force microscopy. Europhys Lett. 1987;3:1281–1286. [Google Scholar]
- Binnig G, Quate CF, Gerber C. Atomic force microscope. Phys Rev Lett. 1986;56:930–933. doi: 10.1103/PhysRevLett.56.930. [DOI] [PubMed] [Google Scholar]
- Blundell TL, Johnson LN. Protein Crystallography. Academic Press; New York: 1976. [Google Scholar]
- Bockaert J, Claeysen S, Becamel C, Pinloche S, Dumuis A. G protein-coupled receptors: dominant players in cell-cell communication. Int Rev Cytol. 2002;212:63–132. doi: 10.1016/s0074-7696(01)12004-8. [DOI] [PubMed] [Google Scholar]
- Boehr DD, McElheny D, Dyson HJ, Wright PE. The dynamic energy landscape of dihydrofolate reductase catalysis. Science. 2006;313:1638–1642. doi: 10.1126/science.1130258. [DOI] [PubMed] [Google Scholar]
- Bowie JU. Solving the membrane protein folding problem. Nature. 2005;438:581–589. doi: 10.1038/nature04395. [DOI] [PubMed] [Google Scholar]
- Brady AE, Limbird LE. G protein-coupled receptor interacting proteins: emerging roles in localization and signal transduction. Cell Signal. 2002;14:297–309. doi: 10.1016/s0898-6568(01)00239-x. [DOI] [PubMed] [Google Scholar]
- Brannigan G, Brown FL. A consistent model for thermal fluctuations and protein-induced deformations in lipid bilayers. Biophys J. 2006;90:1501–1520. doi: 10.1529/biophysj.105.075838. [DOI] [PMC free article] [PubMed] [Google Scholar]
- Brannigan G, Brown FL. Contributions of Gaussian curvature and nonconstant lipid volume to protein deformation of lipid bilayers. Biophys J. 2007;92:864–876. doi: 10.1529/biophysj.106.094953. [DOI] [PMC free article] [PubMed] [Google Scholar]
- Brown FL, Leitner DM, McCammon JA, Wilson KR. Lateral diffusion of membrane proteins in the presence of static and dynamic corrals: suggestions for appropriate observables. Biophys J. 2000;78:2257–2269. doi: 10.1016/S0006-3495(00)76772-5. [DOI] [PMC free article] [PubMed] [Google Scholar]
- Burt JM. Block of intercellular communication: interaction of intracellular H+ and Ca2+ Am J Physiol. 1987;253:C607–C612. doi: 10.1152/ajpcell.1987.253.4.C607. [DOI] [PubMed] [Google Scholar]
- Bustamante C, Chemla YR, Forde NR, Izhaky D. Mechanical processes in biochemistry. Annu Rev Biochem. 2004;73:705–748. doi: 10.1146/annurev.biochem.72.121801.161542. [DOI] [PubMed] [Google Scholar]
- Calvert PD, Govardovskii VI, Krasnoperova N, Anderson RE, Lem J, Makino CL. Membrane protein diffusion sets the speed of rod phototransduction. Nature. 2001;411:90–94. doi: 10.1038/35075083. [DOI] [PubMed] [Google Scholar]
- Chabre M, Cone R, Saibil H. Biophysics: is rhodopsin dimeric in native retinal rods? Nature. 2003;426:30–31. doi: 10.1038/426030b. [DOI] [PubMed] [Google Scholar]
- Chabre M, le Maire M. Monomeric G-protein-coupled receptor as a functional unit. Biochemistry. 2005;44:9395–9403. doi: 10.1021/bi050720o. [DOI] [PubMed] [Google Scholar]
- Chandrashekar J, Hoon MA, Ryba NJ, Zuker CS. The receptors and cells for mammalian taste. Nature. 2006;444:288–294. doi: 10.1038/nature05401. [DOI] [PubMed] [Google Scholar]
- Chapple JP, Cheetham ME. The chaperone environment at the cytoplasmic face of the endoplasmic reticulum can modulate rhodopsin processing and inclusion formation. J Biol Chem. 2003;278:19087–19094. doi: 10.1074/jbc.M212349200. [DOI] [PubMed] [Google Scholar]
- Chapple JP, Grayson C, Hardcastle AJ, Saliba RS, van der Spuy J, Cheetham ME. Unfolding retinal dystrophies: a role for molecular chaperones? Trends Mol Med. 2001;7:414–421. doi: 10.1016/s1471-4914(01)02103-7. [DOI] [PubMed] [Google Scholar]
- Cherezov V, Rosenbaum DM, Hanson MA, Rasmussen SG, Thian FS, Kobilka TS, Choi HJ, Kuhn P, Weis WI, Kobilka BK, et al. High-resolution crystal structure of an engineered human β2-adrenergic g protein coupled receptor. Science. 2007;318:1258–1265. doi: 10.1126/science.1150577. [DOI] [PMC free article] [PubMed] [Google Scholar]
- Christmas P, Weber BM, McKee M, Brown D, Soberman RJ. Membrane localization and topology of leukotriene C4 synthase. J Biol Chem. 2002;277:28902–28908. doi: 10.1074/jbc.M203074200. [DOI] [PubMed] [Google Scholar]
- Cisneros DA, Oesterhelt D, Müller DJ. Probing origins of molecular interactions stabilizing the membrane proteins halorhodopsin and bacteriorhodopsin. Structure. 2005;13:235–242. doi: 10.1016/j.str.2004.12.005. [DOI] [PubMed] [Google Scholar]
- Conn PM, Ulloa-Aguirre A, Ito J, Janovick JA. G protein-coupled receptor trafficking in health and disease: lessons learned to prepare for therapeutic mutant rescue in vivo. Pharmacol Rev. 2007;59:225–250. doi: 10.1124/pr.59.3.2. [DOI] [PubMed] [Google Scholar]
- Cooper A, Dryden DT. Allostery without conformational change: a plausible model. Eur Biophys J. 1984;11:103–109. doi: 10.1007/BF00276625. [DOI] [PubMed] [Google Scholar]
- Czajkowsky DM, Iwamoto H, Cover TL, Shao Z. The vacuolating toxin from Helicobacter pylori forms hexameric pores in lipid bilayers at low pH. Proc Natl Acad Sci U S A. 1999;96:2001–2006. doi: 10.1073/pnas.96.5.2001. [DOI] [PMC free article] [PubMed] [Google Scholar]
- Czajkowsky DM, Sheng S, Shao Z. Staphylococcal α-hemolysin can form hexamers in phospholipid bilayers. J Mol Biol. 1998;276:325–330. doi: 10.1006/jmbi.1997.1535. [DOI] [PubMed] [Google Scholar]
- Dahl SG, Sylte I. Molecular modelling of drug targets: the past, the present and the future. Basic Clin Pharmacol Toxicol. 2005;96:151–155. doi: 10.1111/j.1742-7843.2005.pto960302.x. [DOI] [PubMed] [Google Scholar]
- Daleke DL. Phospholipid flippases. J Biol Chem. 2007;282:821–825. doi: 10.1074/jbc.R600035200. [DOI] [PubMed] [Google Scholar]
- del Valle LJ, Ramon E, Canavate X, Dias P, Garriga P. Zinc-induced decrease of the thermal stability and regeneration of rhodopsin. J Biol Chem. 2003;278:4719–4724. doi: 10.1074/jbc.M210760200. [DOI] [PubMed] [Google Scholar]
- Deuling HJ, Helfrich W. Red blood cell shapes as explained on the basis of curvature elasticity. Biophys J. 1976;16:861–868. doi: 10.1016/S0006-3495(76)85736-0. [DOI] [PMC free article] [PubMed] [Google Scholar]
- Dibrov P, Rimon A, Dzioba J, Winogrodzki A, Shalitin Y, Padan E. 2-Aminoperimidine, a specific inhibitor of bacterial NhaA Na+/H+ antiporters. FEBS Lett. 2005;579:373–378. doi: 10.1016/j.febslet.2004.11.098. [DOI] [PubMed] [Google Scholar]
- Dill KA, Chan HS. From Levinthal to pathways to funnels. Nat Struct Biol. 1997;4:10–19. doi: 10.1038/nsb0197-10. [DOI] [PubMed] [Google Scholar]
- Dobson CM. Protein folding and misfolding. Nature. 2003;426:884–890. doi: 10.1038/nature02261. [DOI] [PubMed] [Google Scholar]
- Drake B, Prater CB, Weisenhorn AL, Gould SA, Albrecht TR, Quate CF, Cannell DS, Hansma HG, Hansma PK. Imaging crystals, polymers, and processes in water with the atomic force microscope. Science. 1989;243:1586–1589. doi: 10.1126/science.2928794. [DOI] [PubMed] [Google Scholar]
- Dryja TP, Li T. Molecular genetics of retinitis pigmentosa. Hum Mol Genet. 1995;4:1739–1743. doi: 10.1093/hmg/4.suppl_1.1739. [DOI] [PubMed] [Google Scholar]
- Dryja TP, McGee TL, Reichel E, Hahn LB, Cowley GS, Yandell DW, Sandberg MA, Berson EL. A point mutation of the rhodopsin gene in one form of retinitis pigmentosa. Nature. 1990;343:364–366. doi: 10.1038/343364a0. [DOI] [PubMed] [Google Scholar]
- Dunn RC. Near-field scanning optical microscopy. Chem Rev. 1999;99:2891–2928. doi: 10.1021/cr980130e. [DOI] [PubMed] [Google Scholar]
- Edidin M. Near-field scanning optical microscopy, a siren call to biology. Traffic. 2001;2:797–803. doi: 10.1034/j.1600-0854.2001.21108.x. [DOI] [PubMed] [Google Scholar]
- Elofsson A, Heijne G. Membrane protein structure: prediction versus reality. Annu Rev Biochem. 2007;76:125–140. doi: 10.1146/annurev.biochem.76.052705.163539. [DOI] [PubMed] [Google Scholar]
- Enderle T, Ha T, Ogletree DF, Chemla DS, Magowan C, Weiss S. Membrane specific mapping and colocalization of malarial and host skeletal proteins in the Plasmodium falciparum infected erythrocyte by dual-color near-field scanning optical microscopy. Proc Natl Acad Sci U S A. 1997;94:520–525. doi: 10.1073/pnas.94.2.520. [DOI] [PMC free article] [PubMed] [Google Scholar]
- Engel A, Müller DJ. Observing single biomolecules at work with the atomic force microscope. Nat Struct Bio. 2000;7:715–718. doi: 10.1038/78929. [DOI] [PubMed] [Google Scholar]
- Engel A, Schoenenberger CA, Müller DJ. High resolution imaging of native biological sample surfaces using scanning probe microscopy. Curr Opin Struct Biol. 1997;7:279–284. doi: 10.1016/s0959-440x(97)80037-1. [DOI] [PubMed] [Google Scholar]
- Engelman DM. Membranes are more mosaic than fluid. Nature. 2005;438:578–580. doi: 10.1038/nature04394. [DOI] [PubMed] [Google Scholar]
- Engelman DM, Chen Y, Chin CN, Curran AR, Dixon AM, Dupuy AD, Lee AS, Lehnert U, Matthews EE, Reshetnyak YK, et al. Membrane protein folding: beyond the two stage model. FEBS Lett. 2003;555:122–125. doi: 10.1016/s0014-5793(03)01106-2. [DOI] [PubMed] [Google Scholar]
- Engelman DM, Steitz TA. The spontaneous insertion of proteins into and across membranes: the helical hairpin hypothesis. Cell. 1981;23:411–422. doi: 10.1016/0092-8674(81)90136-7. [DOI] [PubMed] [Google Scholar]
- Esbjörner EK, Caesar CE, Albinsson B, Lincoln P, Norden B. Tryptophan orientation in model lipid membranes. Biochem Biophys Res Commun. 2007;361:645–650. doi: 10.1016/j.bbrc.2007.07.135. [DOI] [PubMed] [Google Scholar]
- Evans E. Probing the relation between force–lifetime–and chemistry in single molecular bonds. Annu Rev Biophys Biomol Struct. 2001;30:105–128. doi: 10.1146/annurev.biophys.30.1.105. [DOI] [PubMed] [Google Scholar]
- Evans E, Ritchie K. Dynamic strength of molecular adhesion bonds. Biophys J. 1997;72:1541–1555. doi: 10.1016/S0006-3495(97)78802-7. [DOI] [PMC free article] [PubMed] [Google Scholar]
- Evans EA, Parsegian VA. Energetics of membrane deformation and adhesion in cell and vesicle aggregation. Ann N Y Acad Sci. 1983;416:13–33. doi: 10.1111/j.1749-6632.1983.tb35176.x. [DOI] [PubMed] [Google Scholar]
- Evans EA, Parsegian VA. Thermal-mechanical fluctuations enhance repulsion between bimolecular layers. Proc Natl Acad Sci U S A. 1986;83:7132–7136. doi: 10.1073/pnas.83.19.7132. [DOI] [PMC free article] [PubMed] [Google Scholar]
- Faham S, Yang D, Bare E, Yohannan S, Whitelegge JP, Bowie JU. Side-chain contributions to membrane protein structure and stability. J Mol Biol. 2004;335:297–305. doi: 10.1016/j.jmb.2003.10.041. [DOI] [PubMed] [Google Scholar]
- Feller SE, Gawrisch K. Properties of docosahexaenoic-acid-containing lipids and their influence on the function of rhodopsin. Curr Opin Struct Biol. 2005;15:416–422. doi: 10.1016/j.sbi.2005.07.002. [DOI] [PubMed] [Google Scholar]
- Ferguson AD, McKeever BM, Xu S, Wisniewski D, Miller DK, Yamin TT, Spencer RH, Chu L, Ujjainwalla F, Cunningham BR, et al. Crystal structure of inhibitor-bound human 5-lipoxygenase-activating protein. Science. 2007;317:510–512. doi: 10.1126/science.1144346. [DOI] [PubMed] [Google Scholar]
- Filipek S, Krzysko KA, Fotiadis D, Liang Y, Saperstein DA, Engel A, Palczewski K. A concept for G protein activation by G protein-coupled receptor dimers: the transducin/rhodopsin interface. Photochem Photobiol Sci. 2004;3:628–638. doi: 10.1039/b315661c. [DOI] [PubMed] [Google Scholar]
- Filipek S, Stenkamp RE, Teller DC, Palczewski K. G protein-coupled receptor rhodopsin: a prospectus. Annu Rev Physiol. 2003a;65:851–879. doi: 10.1146/annurev.physiol.65.092101.142611. [DOI] [PMC free article] [PubMed] [Google Scholar]
- Filipek S, Teller DC, Palczewski K, Stenkamp R. The crystallographic model of rhodopsin and its use in studies of other G protein-coupled receptors. Annu Rev Biophys Biomol Struct. 2003b;32:375–397. doi: 10.1146/annurev.biophys.32.110601.142520. [DOI] [PMC free article] [PubMed] [Google Scholar]
- Fischer E. Einfluss der configuration auf die wirkung der enzyme. Chem Ber. 1894;27:2985–2993. [Google Scholar]
- Foote J, Milstein C. Conformational isomerism and the diversity of antibodies. Proc Natl Acad Sci U S A. 1994;91:10370–10374. doi: 10.1073/pnas.91.22.10370. [DOI] [PMC free article] [PubMed] [Google Scholar]
- Fotiadis D, Hasler L, Müller DJ, Stahlberg H, Kistler J, Engel A. Surface tongue-and-groove contours on lens MIP facilitate cell-to-cell adherence. J Mol Biol. 2000;300:779–789. doi: 10.1006/jmbi.2000.3920. [DOI] [PubMed] [Google Scholar]
- Fotiadis D, Jastrzebska B, Philippsen A, Müller DJ, Palczewski K, Engel A. Structure of the rhodopsin dimer: a working model for G-protein-coupled receptors. Curr Opin Struct Biol. 2006;16:252–259. doi: 10.1016/j.sbi.2006.03.013. [DOI] [PubMed] [Google Scholar]
- Fotiadis D, Liang Y, Filipek S, Saperstein DA, Engel A, Palczewski K. Atomic-force microscopy: rhodopsin dimers in native disc membranes. Nature. 2003;421:127–128. doi: 10.1038/421127a. [DOI] [PubMed] [Google Scholar]
- Fotiadis D, Liang Y, Filipek S, Saperstein DA, Engel A, Palczewski K. The G protein-coupled receptor rhodopsin in the native membrane. FEBS Lett. 2004a;564:281–288. doi: 10.1016/S0014-5793(04)00194-2. [DOI] [PMC free article] [PubMed] [Google Scholar]
- Fotiadis D, Müller DJ, Tsiotis G, Hasler L, Tittmann P, Mini T, Jeno P, Gross H, Engel A. Surface analysis of the photosystem I complex by electron and atomic force microscopy. J Mol Biol. 1998;283:83–94. doi: 10.1006/jmbi.1998.2097. [DOI] [PubMed] [Google Scholar]
- Fotiadis D, Qian P, Philippsen A, Bullough PA, Engel A, Hunter CN. Structural analysis of the reaction center light-harvesting complex I photosynthetic core complex of Rhodospirillum rubrum using atomic force microscopy. J Biol Chem. 2004b;279:2063–2068. doi: 10.1074/jbc.M310382200. [DOI] [PubMed] [Google Scholar]
- Fotiadis D, Suda K, Tittmann P, Jeno P, Philippsen A, Müller DJ, Gross H, Engel A. Identification and structure of a putative Ca2+-binding domain at the C terminus of AQP1. J Mol Biol. 2002;318:1381–1394. doi: 10.1016/s0022-2836(02)00143-2. [DOI] [PubMed] [Google Scholar]
- Frederick KK, Marlow MS, Valentine KG, Wand AJ. Conformational entropy in molecular recognition by proteins. Nature. 2007;448:325–329. doi: 10.1038/nature05959. [DOI] [PMC free article] [PubMed] [Google Scholar]
- Frederix PL, Akiyama T, Staufer U, Gerber C, Fotiadis D, Müller DJ, Engel A. Atomic force bio-analytics. Curr Opin Chem Biol. 2003;7:641–647. doi: 10.1016/j.cbpa.2003.08.010. [DOI] [PubMed] [Google Scholar]
- Frederix PLTM, Gullo MR, Akiyama T, Tonin A, de Rooij NF, Staufer U, Engel A. Assessment of insulated conductive cantilevers for biology and electrochemistry. Nanotechnology. 2005;16:997–1005. [Google Scholar]
- Fu D, Libson A, Miercke LJ, Weitzman C, Nollert P, Krucinski J, Stroud RM. Structure of a glycerol-conducting channel and the basis for its selectivity. Science. 2000;290:481–486. doi: 10.1126/science.290.5491.481. [DOI] [PubMed] [Google Scholar]
- Fukuda M, Mikoshiba K. The function of inositol high polyphosphate binding proteins. Bioessays. 1997;19:593–603. doi: 10.1002/bies.950190710. [DOI] [PubMed] [Google Scholar]
- Funk CD. Prostaglandins and leukotrienes: advances in eicosanoid biology. Science. 2001;294:1871–1875. doi: 10.1126/science.294.5548.1871. [DOI] [PubMed] [Google Scholar]
- Gerber C, Lang HP. How the doors to the nanoworld were opened. Nat Nanotechol. 2006;1:3–5. doi: 10.1038/nnano.2006.70. [DOI] [PubMed] [Google Scholar]
- Giessibl FJ. Atomic resolution of the silicon(111)-(7×7) surface by atomic force microscopy. Science. 1995;267:68–71. doi: 10.1126/science.267.5194.68. [DOI] [PubMed] [Google Scholar]
- Giusto NM, Pasquare SJ, Salvador GA, Castagnet PI, Roque ME, Ilincheta de Boschero MG. Lipid metabolism in vertebrate retinal rod outer segments. Prog Lipid Res. 2000;39:315–391. doi: 10.1016/s0163-7827(00)00009-6. [DOI] [PubMed] [Google Scholar]
- Gonçalves RP, Buzhynskyy N, Prima V, Sturgis JN, Scheuring S. Supramolecular assembly of VDAC in native mitochondrial outer membranes. J Mol Biol. 2007;369:413–418. doi: 10.1016/j.jmb.2007.03.063. [DOI] [PubMed] [Google Scholar]
- Gonen T, Cheng Y, Sliz P, Hiroaki Y, Fujiyoshi Y, Harrison SC, Walz T. Lipid-protein interactions in double-layered two-dimensional AQP0 crystals. Nature. 2005;438:633–638. doi: 10.1038/nature04321. [DOI] [PMC free article] [PubMed] [Google Scholar]
- Gonen T, Walz T. The structure of aquaporins. Q Rev Biophys. 2006;39:361–396. doi: 10.1017/S0033583506004458. [DOI] [PubMed] [Google Scholar]
- Grahn BH, Paterson PG, Gottschall-Pass KT, Zhang Z. Zinc and the eye. J Am Coll Nutr. 2001;20:106–118. doi: 10.1080/07315724.2001.10719022. [DOI] [PubMed] [Google Scholar]
- Grasberger B, Minton AP, DeLisi C, Metzger H. Interaction between proteins localized in membranes. Proc Natl Acad Sci U S A. 1986;83:6258–6262. doi: 10.1073/pnas.83.17.6258. [DOI] [PMC free article] [PubMed] [Google Scholar]
- Haltia T, Freire E. Forces and factors that contribute to the structural stability of membrane proteins. Biochim Biophys Acta. 1995;1241:295–322. doi: 10.1016/0304-4157(94)00161-6. [DOI] [PubMed] [Google Scholar]
- Hand GM, Müller DJ, Nicholson BJ, Engel A, Sosinsky GE. Isolation and characterization of gap junctions from tissue culture cells. J Mol Biol. 2002;315:587–600. doi: 10.1006/jmbi.2001.5262. [DOI] [PubMed] [Google Scholar]
- Hanggi P, Talkner P, Borkovec M. Reaction rate theory—50 years after Kramers. Rev Mod Phys. 1990;62:251–341. [Google Scholar]
- Hanzal-Bayer MF, Hancock JF. Lipid rafts and membrane traffic. FEBS Lett. 2007;581:2098–2104. doi: 10.1016/j.febslet.2007.03.019. [DOI] [PubMed] [Google Scholar]
- Harries WE, Akhavan D, Miercke LJ, Khademi S, Stroud RM. The channel architecture of aquaporin 0 at a 2.2- Å resolution. Proc Natl Acad Sci U S A. 2004;101:14045–14050. doi: 10.1073/pnas.0405274101. [DOI] [PMC free article] [PubMed] [Google Scholar]
- Hartl FU, Hayer-Hartl M. Molecular chaperones in the cytosol: from nascent chain to folded protein. Science. 2002;295:1852–1858. doi: 10.1126/science.1068408. [DOI] [PubMed] [Google Scholar]
- Hasty DL, Hay ED. Freeze-fracture studies of the developing cell surface II Particle-free membrane blisters on glutaraldehyde-fixed corneal fibroblasts are artifacts. J Cell Biol. 1978;78:756–768. doi: 10.1083/jcb.78.3.756. [DOI] [PMC free article] [PubMed] [Google Scholar]
- Haucke V, Di Paolo G. Lipids and lipid modifications in the regulation of membrane traffic. Curr Opin Cell Biol. 2007;19:426–435. doi: 10.1016/j.ceb.2007.06.003. [DOI] [PMC free article] [PubMed] [Google Scholar]
- Helfrich W. Elastic properties of lipid bilayers: theory and possible experiments. Z Naturforsch [C] 1973;28:693–703. doi: 10.1515/znc-1973-11-1209. [DOI] [PubMed] [Google Scholar]
- Helfrich W. Determination of red cell shape from random cross-sections: a commentary. Blood Cells. 1978;4:335–337. [PubMed] [Google Scholar]
- Hell SW. Far-field optical nanoscopy. Science. 2007;316:1153–1158. doi: 10.1126/science.1137395. [DOI] [PubMed] [Google Scholar]
- Henze K, Martin W. Evolutionary biology: essence of mitochondria. Nature. 2003;426:127–128. doi: 10.1038/426127a. [DOI] [PubMed] [Google Scholar]
- Hessel E, Muller P, Herrmann A, Hofmann KP. Light-induced reorganization of phospholipids in rod disc membranes. J Biol Chem. 2001;276:2538–2543. doi: 10.1074/jbc.M009061200. [DOI] [PubMed] [Google Scholar]
- Hong H, Park S, Jimenez RH, Rinehart D, Tamm LK. Role of aromatic side chains in the folding and thermodynamic stability of integral membrane proteins. J Am Chem Soc. 2007;129:8320–8327. doi: 10.1021/ja068849o. [DOI] [PubMed] [Google Scholar]
- Hoogenboom BW, Suda K, Engel A, Fotiadis D. The supramolecular assemblies of voltage-dependent anion channels in the native membrane. J Mol Biol. 2007;370:246–255. doi: 10.1016/j.jmb.2007.04.073. [DOI] [PubMed] [Google Scholar]
- Höppener C, Siebrasse JP, Peters R, Kubitscheck U, Naber A. High-resolution near-field optical imaging of single nuclear pore complexes under physiological conditions. Biophys J. 2005;88:3681–3688. doi: 10.1529/biophysj.104.051458. [DOI] [PMC free article] [PubMed] [Google Scholar]
- Howard J. Mechanics of Motor Proteins and the Cytoskeleton. Sinauer Associates, Publishers; Sunderland, MA: 2001. [Google Scholar]
- Huang AL, Chen X, Hoon MA, Chandrashekar J, Guo W, Trankner D, Ryba NJ, Zuker CS. The cells and logic for mammalian sour taste detection. Nature. 2006;442:934–938. doi: 10.1038/nature05084. [DOI] [PMC free article] [PubMed] [Google Scholar]
- Hulko M, Berndt F, Gruber M, Linder JU, Truffault V, Schultz A, Martin J, Schultz JE, Lupas AN, Coles M. The HAMP domain structure implies helix rotation in transmembrane signaling. Cell. 2006;126:929–940. doi: 10.1016/j.cell.2006.06.058. [DOI] [PubMed] [Google Scholar]
- Hummer G, Szabo A. Kinetics from nonequilibrium single-molecule pulling experiments. Biophys J. 2003;85:5–15. doi: 10.1016/S0006-3495(03)74449-X. [DOI] [PMC free article] [PubMed] [Google Scholar]
- Humphris AD, Miles M, Hobbs JK. A mechanical microscope: High-speed atomic force microscopy. Appl Phys Lett. 2005;86:034106. [Google Scholar]
- Hunte C. Specific protein-lipid interactions in membrane proteins. Biochem Soc Trans. 2005;33:938–942. doi: 10.1042/BST20050938. [DOI] [PubMed] [Google Scholar]
- Hunte C, Screpanti E, Venturi M, Rimon A, Padan E, Michel H. Structure of a Na+/H+ antiporter and insights into mechanism of action and regulation by pH. Nature. 2005;435:1197–1202. doi: 10.1038/nature03692. [DOI] [PubMed] [Google Scholar]
- Ianoul A, Grant DD, Rouleau Y, Bani-Yaghoub M, Johnston LJ, Pezacki JP. Imaging nanometer domains of β-adrenergic receptor complexes on the surface of cardiac myocytes. Nat Chem Biol. 2005;1:196–202. doi: 10.1038/nchembio726. [DOI] [PubMed] [Google Scholar]
- Ianoul A, Street M, Grant D, Pezacki J, Taylor RS, Johnston LJ. Near-field scanning fluorescence microscopy study of ion channel clusters in cardiac myocyte membranes. Biophys J. 2004;87:3525–3535. doi: 10.1529/biophysj.104.046383. [DOI] [PMC free article] [PubMed] [Google Scholar]
- Ikeda M, Kihara A, Igarashi Y. Lipid asymmetry of the eukaryotic plasma membrane: functions and related enzymes. Biol Pharm Bull. 2006;29:1542–1546. doi: 10.1248/bpb.29.1542. [DOI] [PubMed] [Google Scholar]
- Israelachvili JN. Intermolecular and Surface Forces: with Applications to Colloidal and Biological Systems. Academic Press; Orlando, FL: 1985. [Google Scholar]
- Jahn TR, Radford SE. The yin and yang of protein folding. FEBS J. 2005;272:5962–5970. doi: 10.1111/j.1742-4658.2005.05021.x. [DOI] [PMC free article] [PubMed] [Google Scholar]
- James JR, Davis SJ. Reply to: Experimental challenge to a ‘rigorous’ BRET analysis of GPCR oligomerization. Nat Methods. 2007;4:601. doi: 10.1038/nmeth0807-599. [DOI] [PubMed] [Google Scholar]
- Janovick JA, Brothers SP, Cornea A, Bush E, Goulet MT, Ashton WT, Sauer DR, Haviv F, Greer J, Conn PM. Refolding of misfolded mutant GPCR: post-translational pharmacoperone action in vitro. Mol Cell Endocrinol. 2007;272:77–85. doi: 10.1016/j.mce.2007.04.012. [DOI] [PMC free article] [PubMed] [Google Scholar]
- Janovjak H, Kedrov A, Cisneros DA, Sapra KT, Struckmeier J, Müller DJ. Imaging and detecting molecular interactions of single transmembrane proteins. Neurobiol Aging. 2006;27:546–561. doi: 10.1016/j.neurobiolaging.2005.03.031. [DOI] [PubMed] [Google Scholar]
- Janovjak H, Kessler M, Oesterhelt D, Gaub H, Müller DJ. Unfolding pathways of native bacteriorhodopsin depend on temperature. EMBO J. 2003;22:5220–5229. doi: 10.1093/emboj/cdg509. [DOI] [PMC free article] [PubMed] [Google Scholar]
- Janovjak H, Knaus H, Müller DJ. Transmembrane helices have rough energy surfaces. J Am Chem Soc. 2007;129:246–247. doi: 10.1021/ja065684a. [DOI] [PubMed] [Google Scholar]
- Janovjak H, Struckmeier J, Hubain M, Kedrov A, Kessler M, Müller DJ. Probing the energy landscape of the membrane protein bacteriorhodopsin. Structure. 2004;12:871–879. doi: 10.1016/j.str.2004.03.016. [DOI] [PubMed] [Google Scholar]
- Janshoff A, Neitzert M, Oberdorfer Y, Fuchs H. Force spectroscopy of molecular systems-single molecule spectroscopy of polymers and biomolecules. Angew Chem Int Ed Engl. 2000;39:3212–3237. doi: 10.1002/1521-3773(20000915)39:18<3212::aid-anie3212>3.0.co;2-x. [DOI] [PubMed] [Google Scholar]
- Jastrzebska B, Fotiadis D, Jang GF, Stenkamp RE, Engel A, Palczewski K. Functional and structural characterization of rhodopsin oligomers. J Biol Chem. 2006;281:11917–11922. doi: 10.1074/jbc.M600422200. [DOI] [PMC free article] [PubMed] [Google Scholar]
- Jensen MO, Mouritsen OG. Lipids do influence protein function-the hydrophobic matching hypothesis revisited. Biochim Biophys Acta. 2004;1666:205–226. doi: 10.1016/j.bbamem.2004.06.009. [DOI] [PubMed] [Google Scholar]
- Jones KA, Borowsky B, Tamm JA, Craig DA, Durkin MM, Dai M, Yao WJ, Johnson M, Gunwaldsen C, Huang LY, et al. GABAB receptors function as a heteromeric assembly of the subunits GABABR1 and GABABR2. Nature. 1998;396:674–679. doi: 10.1038/25348. [DOI] [PubMed] [Google Scholar]
- Kaupmann K, Malitschek B, Schuler V, Heid J, Froestl W, Beck P, Mosbacher J, Bischoff S, Kulik A, Shigemoto R, et al. GABAB-receptor subtypes assemble into functional heteromeric complexes. Nature. 1998;396:683–687. doi: 10.1038/25360. [DOI] [PubMed] [Google Scholar]
- Kedrov A, Janovjak H, Ziegler C, Kuhlbrandt W, Müller DJ. Observing folding pathways and kinetics of a single sodium-proton antiporter from Escherichia coli. J Mol Biol. 2006a;355:2–8. doi: 10.1016/j.jmb.2005.10.028. [DOI] [PubMed] [Google Scholar]
- Kedrov A, Krieg M, Ziegler C, Kuhlbrandt W, Müller DJ. Locating ligand binding and activation of a single antiporter. EMBO Rep. 2005;6:668–674. doi: 10.1038/sj.embor.7400455. [DOI] [PMC free article] [PubMed] [Google Scholar]
- Kedrov A, Wegmann S, Smits SH, Goswami P, Baumann H, Müller DJ. Detecting molecular interactions that stabilize, activate and guide ligand-binding of the sodium/proton antiporter MjNhaP1 from Methanococcus jannaschii. J Struct Biol. 2007;159:290–301. doi: 10.1016/j.jsb.2007.02.010. [DOI] [PubMed] [Google Scholar]
- Kedrov A, Ziegler C, Janovjak H, Kuhlbrandt W, Müller DJ. Controlled unfolding and refolding of a single sodium-proton antiporter using atomic force microscopy. J Mol Biol. 2004;340:1143–1152. doi: 10.1016/j.jmb.2004.05.026. [DOI] [PubMed] [Google Scholar]
- Kedrov A, Ziegler C, Müller DJ. Differentiating ligand and inhibitor interactions of a single antiporter. J Mol Biol. 2006b;362:925–932. doi: 10.1016/j.jmb.2006.07.049. [DOI] [PubMed] [Google Scholar]
- Klein-Seetharaman J. Dynamics in rhodopsin. Chembiochem. 2002;3:981–986. doi: 10.1002/1439-7633(20021004)3:10<981::AID-CBIC981>3.0.CO;2-9. [DOI] [PubMed] [Google Scholar]
- Klein-Seetharaman J. Dual role of interactions between membranous and soluble portions of helical membrane receptors for folding and signaling. Trends Pharmacol Sci. 2005;26:183–189. doi: 10.1016/j.tips.2005.02.009. [DOI] [PubMed] [Google Scholar]
- Klein-Seetharaman J, Yanamala NV, Javeed F, Reeves PJ, Getmanova EV, Loewen MC, Schwalbe H, Khorana HG. Differential dynamics in the G protein-coupled receptor rhodopsin revealed by solution NMR. Proc Natl Acad Sci U S A. 2004;101:3409–3413. doi: 10.1073/pnas.0308713101. [DOI] [PMC free article] [PubMed] [Google Scholar]
- Koch AL. Bacterial wall as target for attack: past, present, and future research. Clin Microbiol Rev. 2003;16:673–687. doi: 10.1128/CMR.16.4.673-687.2003. [DOI] [PMC free article] [PubMed] [Google Scholar]
- Koopman M, Cambi A, de Bakker BI, Joosten B, Figdor CG, van Hulst NF, Garcia-Parajo MF. Near-field scanning optical microscopy in liquid for high resolution single molecule detection on dendritic cells. FEBS Lett. 2004;573:6–10. doi: 10.1016/j.febslet.2004.07.035. [DOI] [PubMed] [Google Scholar]
- Koshland DE. Application of a theory of enzyme specificity to protein synthesis. Proc Natl Acad Sci U S A. 1958;44:98–104. doi: 10.1073/pnas.44.2.98. [DOI] [PMC free article] [PubMed] [Google Scholar]
- Kota P, Reeves PJ, Rajbhandary UL, Khorana HG. Opsin is present as dimers in COS1 cells: identification of amino acids at the dimeric interface. Proc Natl Acad Sci U S A. 2006;103:3054–3059. doi: 10.1073/pnas.0510982103. [DOI] [PMC free article] [PubMed] [Google Scholar]
- Kramers HA. Brownian motion in a field of force and the diffusion model of chemical reactions. Physica (Utrecht) 1940;7:284–304. [Google Scholar]
- Kubala M. ATP-binding to P-type ATPases as revealed by biochemical, spectroscopic, and crystallographic experiments. Proteins. 2006;64:1–12. doi: 10.1002/prot.20969. [DOI] [PubMed] [Google Scholar]
- Kuhn M, Janovjak H, Hubain M, Müller DJ. Automated alignment and pattern recognition of single-molecule force spectroscopy data. J Microsc. 2005;218:125–132. doi: 10.1111/j.1365-2818.2005.01478.x. [DOI] [PubMed] [Google Scholar]
- Kumar S, Ma B, Tsai CJ, Sinha N, Nussinov R. Folding and binding cascades: dynamic landscapes and population shifts. Protein Sci. 2000;9:10–19. doi: 10.1110/ps.9.1.10. [DOI] [PMC free article] [PubMed] [Google Scholar]
- Kunishima N, Shimada Y, Tsuji Y, Sato T, Yamamoto M, Kumasaka T, Nakanishi S, Jingami H, Morikawa K. Structural basis of glutamate recognition by a dimeric metabotropic glutamate receptor. Nature. 2000;407:971–977. doi: 10.1038/35039564. [DOI] [PubMed] [Google Scholar]
- Kurtzman CP, Fell JW. The yeasts: a taxonomic study. Elsevier; Amsterdam: 2000. [Google Scholar]
- Kusumi A, Nakada C, Ritchie K, Murase K, Suzuki K, Murakoshi H, Kasai RS, Kondo J, Fujiwara T. Paradigm shift of the plasma membrane concept from the two-dimensional continuum fluid to the partitioned fluid: high-speed single-molecule tracking of membrane molecules. Annu Rev Biophys Biomol Struct. 2005;34:351–378. doi: 10.1146/annurev.biophys.34.040204.144637. [DOI] [PubMed] [Google Scholar]
- Lacapère JJ, Pebay-Peyroula E, Neumann JM, Etchebest C. Determining membrane protein structures: still a challenge! Trends Biochem Sci. 2007;32:259–270. doi: 10.1016/j.tibs.2007.04.001. [DOI] [PubMed] [Google Scholar]
- Lagüe P, Zuckermann MJ, Roux B. Lipid-mediated interactions between intrinsic membrane proteins: dependence on protein size and lipid composition. Biophys J. 2001;81:276–284. doi: 10.1016/S0006-3495(01)75698-6. [DOI] [PMC free article] [PubMed] [Google Scholar]
- Lemieux MJ, Reithmeier RA, Wang DN. Importance of detergent and phospholipid in the crystallization of the human erythrocyte anion-exchanger membrane domain. J Struct Biol. 2002;137:322–332. doi: 10.1016/s1047-8477(02)00010-2. [DOI] [PubMed] [Google Scholar]
- Levy D, Chami M, Rigaud JL. Two-dimensional crystallization of membrane proteins: the lipid layer strategy. FEBS Lett. 2001;504:187–193. doi: 10.1016/s0014-5793(01)02748-x. [DOI] [PubMed] [Google Scholar]
- Liang Y, Fotiadis D, Filipek S, Saperstein DA, Palczewski K, Engel A. Organization of the G protein-coupled receptors rhodopsin and opsin in native membranes. J Biol Chem. 2003;278:21655–21662. doi: 10.1074/jbc.M302536200. [DOI] [PMC free article] [PubMed] [Google Scholar]
- Liang Y, Fotiadis D, Maeda T, Maeda A, Modzelewska A, Filipek S, Saperstein DA, Engel A, Palczewski K. Rhodopsin signaling and organization in heterozygote rhodopsin knockout mice. J Biol Chem. 2004;279:48189–48196. doi: 10.1074/jbc.M408362200. [DOI] [PMC free article] [PubMed] [Google Scholar]
- Liao DI, Qian J, Chisholm DA, Jordan DB, Diner BA. Crystal structures of the photosystem II D1 C-terminal processing protease. Nat Struct Biol. 2000;7:749–753. doi: 10.1038/78973. [DOI] [PubMed] [Google Scholar]
- Litman BJ, Kalisky O, Ottolenghi M. Rhodopsin-phospholipid interactions: dependence of rate of the meta I to meta II transition on the level of associated disk phospholipid. Biochemistry. 1981;20:631–634. doi: 10.1021/bi00506a028. [DOI] [PubMed] [Google Scholar]
- Liu X, Garriga P, Khorana HG. Structure and function in rhodopsin: correct folding and misfolding in two point mutants in the intradiscal domain of rhodopsin identified in retinitis pigmentosa. Proc Natl Acad Sci U S A. 1996;93:4554–4559. doi: 10.1073/pnas.93.10.4554. [DOI] [PMC free article] [PubMed] [Google Scholar]
- Lodish HF. Molecular Cell Biology. W.H. Freeman; New York: 2007. [Google Scholar]
- Lodish HF, Braell WA, Schwartz AL, Strous GJ, Zilberstein A. Synthesis and assembly of membrane and organelle proteins. Int Rev Cytol Suppl. 1981;12:247–307. doi: 10.1016/b978-0-12-364373-5.50016-0. [DOI] [PubMed] [Google Scholar]
- Long SB, Campbell EB, Mackinnon R. Crystal structure of a mammalian voltage-dependent Shaker family K+ channel. Science. 2005a;309:897–903. doi: 10.1126/science.1116269. [DOI] [PubMed] [Google Scholar]
- Long SB, Campbell EB, Mackinnon R. Voltage sensor of Kv1.2: structural basis of electromechanical coupling. Science. 2005b;309:903–908. doi: 10.1126/science.1116270. [DOI] [PubMed] [Google Scholar]
- Luecke H, Schobert B, Richter HT, Cartailler JP, Lanyi JK. Structure of bacteriorhodopsin at 1.55 Å resolution. J Mol Biol. 1999;291:899–911. doi: 10.1006/jmbi.1999.3027. [DOI] [PubMed] [Google Scholar]
- Ma B, Kumar S, Tsai CJ, Nussinov R. Folding funnels and binding mechanisms. Protein Eng. 1999;12:713–720. doi: 10.1093/protein/12.9.713. [DOI] [PubMed] [Google Scholar]
- Mansoor SE, Palczewski K, Farrens DL. Rhodopsin self-associates in asolectin liposomes. Proc Natl Acad Sci U S A. 2006;103:3060–3065. doi: 10.1073/pnas.0511010103. [DOI] [PMC free article] [PubMed] [Google Scholar]
- Marchese-Ragona SP, Haydon PG. Near-field scanning optical microscopy and near-field confocal optical spectroscopy: emerging techniques in biology. Ann N Y Acad Sci. 1997;820:196–206. doi: 10.1111/j.1749-6632.1997.tb46196.x. discussion 206–207. [DOI] [PubMed] [Google Scholar]
- Marsico A, Labudde D, Sapra T, Müller DJ, Schroeder M. A novel pattern recognition algorithm to classify membrane protein unfolding pathways with high-throughput single-molecule force spectroscopy. Bioinformatics. 2007;23:e231–236. doi: 10.1093/bioinformatics/btl293. [DOI] [PubMed] [Google Scholar]
- Martinez Molina D, Wetterholm A, Kohl A, McCarthy AA, Niegowski D, Ohlson E, Hammarberg T, Eshaghi S, Haeggstrom JZ, Nordlund P. Structural basis for synthesis of inflammatory mediators by human leukotriene C4 synthase. Nature. 2007;448:613–616. doi: 10.1038/nature06009. [DOI] [PubMed] [Google Scholar]
- Matthews EE, Zoonens M, Engelman DM. Dynamic helix interactions in transmembrane signaling. Cell. 2006;127:447–450. doi: 10.1016/j.cell.2006.10.016. [DOI] [PubMed] [Google Scholar]
- Maudsley S, Martin B, Luttrell LM. G protein-coupled receptor signaling complexity in neuronal tissue: implications for novel therapeutics. Curr Alzheimer Res. 2007;4:3–19. doi: 10.2174/156720507779939850. [DOI] [PubMed] [Google Scholar]
- Maxfield FR, Tabas I. Role of cholesterol and lipid organization in disease. Nature. 2005;438:612–621. doi: 10.1038/nature04399. [DOI] [PubMed] [Google Scholar]
- McIntosh TJ, Simon SA. Roles of bilayer material properties in function and distribution of membrane proteins. Annu Rev Biophys Biomol Struct. 2006;35:177–198. doi: 10.1146/annurev.biophys.35.040405.102022. [DOI] [PubMed] [Google Scholar]
- McLaughlin S, Murray D. Plasma membrane phosphoinositide organization by protein electrostatics. Nature. 2005;438:605–611. doi: 10.1038/nature04398. [DOI] [PubMed] [Google Scholar]
- McLaughlin S, Wang J, Gambhir A, Murray D. PIP2 and proteins: interactions, organization, and information flow. Annu Rev Biophys Biomol Struct. 2002;31:151–175. doi: 10.1146/annurev.biophys.31.082901.134259. [DOI] [PubMed] [Google Scholar]
- McMahon HT, Gallop JL. Membrane curvature and mechanisms of dynamic cell membrane remodelling. Nature. 2005;438:590–596. doi: 10.1038/nature04396. [DOI] [PubMed] [Google Scholar]
- McMillin JB, Dowhan W. Cardiolipin and apoptosis. Biochim Biophys Acta. 2002;1585:97–107. doi: 10.1016/s1388-1981(02)00329-3. [DOI] [PubMed] [Google Scholar]
- Miaczynska M, Pelkmans L, Zerial M. Not just a sink: endosomes in control of signal transduction. Curr Opin Cell Biol. 2004;16:400–406. doi: 10.1016/j.ceb.2004.06.005. [DOI] [PubMed] [Google Scholar]
- Milligan G. G protein-coupled receptor dimerization: function and ligand pharmacology. Mol Pharmacol. 2004;66:1–7. doi: 10.1124/mol.104.000497.. [DOI] [PubMed] [Google Scholar]
- Mirzadegan T, Benko G, Filipek S, Palczewski K. Sequence analyses of G-protein-coupled receptors: similarities to rhodopsin. Biochemistry. 2003;42:2759–2767. doi: 10.1021/bi027224+. [DOI] [PMC free article] [PubMed] [Google Scholar]
- Modzelewska A, Filipek S, Palczewski K, Park PS. Arrestin interaction with rhodopsin: conceptual models. Cell Biochem Biophys. 2006;46:1–15. doi: 10.1385/CBB:46:1:1. [DOI] [PubMed] [Google Scholar]
- Möller C, Allen M, Elings V, Engel A, Müller DJ. Tapping-mode atomic force microscopy produces faithful high-resolution images of protein surfaces. Biophys J. 1999;77:1150–1158. doi: 10.1016/S0006-3495(99)76966-3. [DOI] [PMC free article] [PubMed] [Google Scholar]
- Möller C, Fotiadis D, Suda K, Engel A, Kessler M, Müller DJ. Determining molecular forces that stabilize human aquaporin-1. J Struct Biol. 2003;142:369–378. doi: 10.1016/s1047-8477(03)00066-2. [DOI] [PubMed] [Google Scholar]
- Mou J, Yang J, Shao Z. Atomic force microscopy of cholera toxin B-oligomers bound to bilayers of biologically relevant lipids. J Mol Biol. 1995;248:507–512. doi: 10.1006/jmbi.1995.0238. [DOI] [PubMed] [Google Scholar]
- Mueller F, Müller DJ, Labudde D. Analysis assistant for single-molecule force spectroscopy data on membrane proteins—MPTV. Bioinformatics. 2006;22:1796–1799. doi: 10.1093/bioinformatics/btl138. [DOI] [PubMed] [Google Scholar]
- Mukherjee PK, Marcheselli VL, Barreiro S, Hu J, Bok D, Bazan NG. Neurotrophins enhance retinal pigment epithelial cell survival through neuroprotectin D1 signaling. Proc Natl Acad Sci U S A. 2007a;104:13152–13157. doi: 10.1073/pnas.0705949104. [DOI] [PMC free article] [PubMed] [Google Scholar]
- Mukherjee PK, Marcheselli VL, de Rivero Vaccari JC, Gordon WC, Jackson FE, Bazan NG. Photoreceptor outer segment phagocytosis attenuates oxidative stress-induced apoptosis with concomitant neuroprotectin D1 synthesis. Proc Natl Acad Sci U S A. 2007b;104:13158–13163. doi: 10.1073/pnas.0705963104. [DOI] [PMC free article] [PubMed] [Google Scholar]
- Mukherjee PK, Marcheselli VL, Serhan CN, Bazan NG. Neuroprotectin D1: a docosahexaenoic acid-derived docosatriene protects human retinal pigment epithelial cells from oxidative stress. Proc Natl Acad Sci U S A. 2004;101:8491–8496. doi: 10.1073/pnas.0402531101. [DOI] [PMC free article] [PubMed] [Google Scholar]
- Müller DJ, Amrein M, Engel A. Adsorption of biological molecules to a solid support for scanning probe microscopy. J Struct Biol. 1997;119:172–188. doi: 10.1006/jsbi.1997.3875. [DOI] [PubMed] [Google Scholar]
- Müller DJ, Baumeister W, Engel A. Conformational change of the hexagonally packed intermediate layer of Deinococcus radiodurans monitored by atomic force microscopy. J Bacteriol. 1996;178:3025–3030. doi: 10.1128/jb.178.11.3025-3030.1996. [DOI] [PMC free article] [PubMed] [Google Scholar]
- Müller DJ, Buldt G, Engel A. Force-induced conformational change of bacteriorhodopsin. J Mol Biol. 1995a;249:239–243. doi: 10.1006/jmbi.1995.0292. [DOI] [PubMed] [Google Scholar]
- Müller DJ, Engel A. Voltage and pH-induced channel closure of porin OmpF visualized by atomic force microscopy. J Mol Biol. 1999;285:1347–1351. doi: 10.1006/jmbi.1998.2359. [DOI] [PubMed] [Google Scholar]
- Müller DJ, Engel A. Conformations, flexibility, and interactions observed on individual membrane proteins by atomic force microscopy. Methods Cell Biol. 2002;68:257–299. doi: 10.1016/s0091-679x(02)68014-8. [DOI] [PubMed] [Google Scholar]
- Müller DJ, Engel A. Atomic force microscopy and spectroscopy of native membrane proteins. Nat Protoc. 2007;2:2191–2197. doi: 10.1038/nprot.2007.309. [DOI] [PubMed] [Google Scholar]
- Müller DJ, Engel A. Strategies to prepare and characterize native membrane proteins and protein membranes by AFM. Curr Opin Coll Interf Sci. 2008 in press. [Google Scholar]
- Müller DJ, Engel A, Matthey U, Meier T, Dimroth P, Suda K. Observing membrane protein diffusion at subnanometer resolution. J Mol Biol. 2003;327:925–930. doi: 10.1016/s0022-2836(03)00206-7. [DOI] [PubMed] [Google Scholar]
- Müller DJ, Fotiadis D, Engel A. Mapping flexible protein domains at subnanometer resolution with the atomic force microscope. FEBS Lett. 1998;430:105–111. doi: 10.1016/s0014-5793(98)00623-1. [DOI] [PubMed] [Google Scholar]
- Müller DJ, Fotiadis D, Scheuring S, Müller SA, Engel A. Electrostatically balanced subnanometer imaging of biological specimens by atomic force microscope. Biophys J. 1999a;76:1101–1111. doi: 10.1016/S0006-3495(99)77275-9. [DOI] [PMC free article] [PubMed] [Google Scholar]
- Müller DJ, Hand GM, Engel A, Sosinsky GE. Conformational changes in surface structures of isolated connexin 26 gap junctions. EMBO J. 2002a;21:3598–3607. doi: 10.1093/emboj/cdf365. [DOI] [PMC free article] [PubMed] [Google Scholar]
- Müller DJ, Janovjak H, Lehto T, Kuerschner L, Anderson K. Observing structure, function and assembly of single proteins by AFM. Prog Biophys Mol Biol. 2002b;79:1–43. doi: 10.1016/s0079-6107(02)00009-3. [DOI] [PubMed] [Google Scholar]
- Müller DJ, Kessler M, Oesterhelt F, Möller C, Oesterhelt D, Gaub H. Stability of bacteriorhodopsin α-helices and loops analyzed by single-molecule force spectroscopy. Biophys J. 2002c;83:3578–3588. doi: 10.1016/S0006-3495(02)75358-7. [DOI] [PMC free article] [PubMed] [Google Scholar]
- Müller DJ, Sapra KT, Scheuring S, Kedrov A, Frederix PL, Fotiadis D, Engel A. Single-molecule studies of membrane proteins. Curr Opin Struct Biol. 2006;16:489–495. doi: 10.1016/j.sbi.2006.06.001. [DOI] [PubMed] [Google Scholar]
- Müller DJ, Sass HJ, Müller SA, Buldt G, Engel A. Surface structures of native bacteriorhodopsin depend on the molecular packing arrangement in the membrane. J Mol Biol. 1999b;285:1903–1909. doi: 10.1006/jmbi.1998.2441. [DOI] [PubMed] [Google Scholar]
- Müller DJ, Schabert FA, Buldt G, Engel A. Imaging purple membranes in aqueous solutions at sub-nanometer resolution by atomic force microscopy. Biophys J. 1995b;68:1681–1686. doi: 10.1016/S0006-3495(95)80345-0. [DOI] [PMC free article] [PubMed] [Google Scholar]
- Nagy P, Jenei A, Kirsch AK, Szollosi J, Damjanovich S, Jovin TM. Activation-dependent clustering of the erbB2 receptor tyrosine kinase detected by scanning near-field optical microscopy. J Cell Sci. 1999;112(Pt 11):1733–1741. doi: 10.1242/jcs.112.11.1733. [DOI] [PubMed] [Google Scholar]
- Nagy P, Matyus L, Jenei A, Panyi G, Varga S, Matko J, Szollosi J, Gaspar R, Jovin TM, Damjanovich S. Cell fusion experiments reveal distinctly different association characteristics of cell-surface receptors. J Cell Sci. 2001;114:4063–4071. doi: 10.1242/jcs.114.22.4063. [DOI] [PubMed] [Google Scholar]
- Narumiya S, Sugimoto Y, Ushikubi F. Prostanoid receptors: structures, properties, and functions. Physiol Rev. 1999;79:1193–1226. doi: 10.1152/physrev.1999.79.4.1193. [DOI] [PubMed] [Google Scholar]
- Nickell S, Park PS, Baumeister W, Palczewski K. Three-dimensional architecture of murine rod outer segments determined by cryoelectron tomography. J Cell Biol. 2007;177:917–925. doi: 10.1083/jcb.200612010. [DOI] [PMC free article] [PubMed] [Google Scholar]
- Nilius B, Owsianik G, Voets T, Peters JA. Transient receptor potential cation channels in disease. Physiol Rev. 2007;87:165–217. doi: 10.1152/physrev.00021.2006. [DOI] [PubMed] [Google Scholar]
- Noma A, Tsuboi N. Dependence of junctional conductance on proton, calcium and magnesium ions in cardiac paired cells of guinea-pig. J Physiol. 1987;382:193–211. doi: 10.1113/jphysiol.1987.sp016363. [DOI] [PMC free article] [PubMed] [Google Scholar]
- Noorwez SM, Kuksa V, Imanishi Y, Zhu L, Filipek S, Palczewski K, Kaushal S. Pharmacological chaperone-mediated in vivo folding and stabilization of the P23H-opsin mutant associated with autosomal dominant retinitis pigmentosa. J Biol Chem. 2003;278:14442–14450. doi: 10.1074/jbc.M300087200. [DOI] [PMC free article] [PubMed] [Google Scholar]
- Nyholm TK, Ozdirekcan S, Killian JA. How protein transmembrane segments sense the lipid environment. Biochemistry. 2007;46:1457–1465. doi: 10.1021/bi061941c. [DOI] [PubMed] [Google Scholar]
- Obara K, Miyashita N, Xu C, Toyoshima I, Sugita Y, Inesi G, Toyoshima C. Structural role of countertransport revealed in Ca2+ pump crystal structure in the absence of Ca2+ Proc Natl Acad Sci U S A. 2005;102:14489–14496. doi: 10.1073/pnas.0506222102. [DOI] [PMC free article] [PubMed] [Google Scholar]
- Oesterhelt F, Oesterhelt D, Pfeiffer M, Engel A, Gaub HE, Müller DJ. Unfolding pathways of individual bacteriorhodopsins. Science. 2000;288:143–146. doi: 10.1126/science.288.5463.143. [DOI] [PubMed] [Google Scholar]
- Oliveberg M, Wolynes PG. The experimental survey of protein-folding energy landscapes. Q Rev Biophys. 2005;38:245–288. doi: 10.1017/S0033583506004185. [DOI] [PubMed] [Google Scholar]
- Onuchic JN, Wolynes PG, Luthey-Schulten Z, Socci ND. Toward an outline of the topography of a realistic protein-folding funnel. Proc Natl Acad Sci U S A. 1995;92:3626–3630. doi: 10.1073/pnas.92.8.3626. [DOI] [PMC free article] [PubMed] [Google Scholar]
- Padan E, Venturi M, Gerchman Y, Dover N. Na+/H+ antiporters. Biochim Biophys Acta. 2001;1505:144–157. doi: 10.1016/s0005-2728(00)00284-x. [DOI] [PubMed] [Google Scholar]
- Palczewski K. G protein-coupled receptor rhodopsin. Annu Rev Biochem. 2006;75:743–767. doi: 10.1146/annurev.biochem.75.103004.142743. [DOI] [PMC free article] [PubMed] [Google Scholar]
- Palczewski K, Kumasaka T, Hori T, Behnke CA, Motoshima H, Fox BA, Le Trong I, Teller DC, Okada T, Stenkamp RE, et al. Crystal structure of rhodopsin: A G protein-coupled receptor. Science. 2000;289:739–745. doi: 10.1126/science.289.5480.739. [DOI] [PubMed] [Google Scholar]
- Palsdottir H, Hunte C. Lipids in membrane protein structures. Biochim Biophys Acta. 2004;1666:2–18. doi: 10.1016/j.bbamem.2004.06.012. [DOI] [PubMed] [Google Scholar]
- Park PS-H, Lodowski DT, Palczewski K. Activation of G protein-coupled receptors: beyond two-state models and tertiary conformational changes. Annu Rev Pharmacol Toxicol. 2008;48:107–141. doi: 10.1146/annurev.pharmtox.48.113006.094630. [DOI] [PMC free article] [PubMed] [Google Scholar]
- Park PS, Filipek S, Wells JW, Palczewski K. Oligomerization of G protein-coupled receptors: past, present, and future. Biochemistry. 2004;43:15643–15656. doi: 10.1021/bi047907k. [DOI] [PMC free article] [PubMed] [Google Scholar]
- Park PS, Palczewski K. Diversifying the repertoire of G protein-coupled receptors through oligomerization. Proc Natl Acad Sci U S A. 2005;102:8793–8794. doi: 10.1073/pnas.0504016102. [DOI] [PMC free article] [PubMed] [Google Scholar]
- Park PS, Sapra KT, Kolinski M, Filipek S, Palczewski K, Müller DJ. Stabilizing effect of Zn2+ in native bovine rhodopsin. J Biol Chem. 2007;282:11377–11385. doi: 10.1074/jbc.M610341200. [DOI] [PMC free article] [PubMed] [Google Scholar]
- Parton RG, Simons K. The multiple faces of caveolae. Nat Rev Mol Cell Biol. 2007;8:185–194. doi: 10.1038/nrm2122. [DOI] [PubMed] [Google Scholar]
- Peleg G, Ghanouni P, Kobilka BK, Zare RN. Single-molecule spectroscopy of the β2 adrenergic receptor: observation of conformational substates in a membrane protein. Proc Natl Acad Sci U S A. 2001;98:8469–8474. doi: 10.1073/pnas.151239698. [DOI] [PMC free article] [PubMed] [Google Scholar]
- Pelkmans L, Burli T, Zerial M, Helenius A. Caveolin-stabilized membrane domains as multifunctional transport and sorting devices in endocytic membrane traffic. Cell. 2004;118:767–780. doi: 10.1016/j.cell.2004.09.003. [DOI] [PubMed] [Google Scholar]
- Periole X, Huber T, Marrink SJ, Sakmar TP. G protein-coupled receptors self-assemble in dynamics simulations of model bilayers. J Am Chem Soc. 2007;129:10126–10132. doi: 10.1021/ja0706246. [DOI] [PubMed] [Google Scholar]
- Philippsen A, Im W, Engel A, Schirmer T, Roux B, Müller DJ. Imaging the electrostatic potential of transmembrane channels: atomic probe microscopy of OmpF porin. Biophys J. 2002;82:1667–1676. doi: 10.1016/S0006-3495(02)75517-3. [DOI] [PMC free article] [PubMed] [Google Scholar]
- Pogoryelov D, Reichen C, Klyszejko AL, Brunisholz R, Müller DJ, Dimroth P, Meier T. The oligomeric state of c rings from cyanobacterial F-ATP synthases varies from 13 to 15. J Bacteriol. 2007;189:5895–5902. doi: 10.1128/JB.00581-07. [DOI] [PMC free article] [PubMed] [Google Scholar]
- Pogoryelov D, Yu J, Meier T, Vonck J, Dimroth P, Müller DJ. The c15 ring of the Spirulina platensis F-ATP synthase: F1/F0 symmetry mismatch is not obligatory. EMBO Rep. 2005;6:1040–1044. doi: 10.1038/sj.embor.7400517. [DOI] [PMC free article] [PubMed] [Google Scholar]
- Polans A, Baehr W, Palczewski K. Turned on by Ca2+! The physiology and pathology of Ca2+-binding proteins in the retina. Trends Neurosci. 1996;19:547–554. doi: 10.1016/s0166-2236(96)10059-x. [DOI] [PubMed] [Google Scholar]
- Popot JL, Engelman DM. Membrane protein folding and oligomerization: the two-stage model. Biochemistry. 1990;29:4031–4037. doi: 10.1021/bi00469a001. [DOI] [PubMed] [Google Scholar]
- Popot JL, Engelman DM. Helical membrane protein folding, stability, and evolution. Annu Rev Biochem. 2000;69:881–922. doi: 10.1146/annurev.biochem.69.1.881. [DOI] [PubMed] [Google Scholar]
- Putney JW., Jr Inositol lipids and TRPC channel activation. Biochem Soc Symp. 2007;74:37–45. doi: 10.1042/BSS0740037. [DOI] [PubMed] [Google Scholar]
- Qiao W, Shang G, Lei FH, Trussardi-Regnier A, Angiboust JF, Millot JM, Manfait M. Imaging of P-glycoprotein of H69/VP small-cell lung cancer lines by scanning near-field optical microscopy and confocal laser microspectrofluorometer. Ultramicroscopy. 2005;105:330–335. doi: 10.1016/j.ultramic.2005.06.045. [DOI] [PubMed] [Google Scholar]
- Raboy V, Bowen D. Genetics of inositol polyphosphates. Subcell Biochem. 2006;39:71–101. doi: 10.1007/0-387-27600-9_4. [DOI] [PubMed] [Google Scholar]
- Rader AJ, Anderson G, Isin B, Khorana HG, Bahar I, Klein-Seetharaman J. Identification of core amino acids stabilizing rhodopsin. Proc Natl Acad Sci U S A. 2004;101:7246–7251. doi: 10.1073/pnas.0401429101. [DOI] [PMC free article] [PubMed] [Google Scholar]
- Reber WR, Weingart R. Ungulate cardiac Purkinje fibres: the influence of intracellular pH on the electrical cell-to-cell coupling. J Physiol. 1982;328:87–104. doi: 10.1113/jphysiol.1982.sp014254. [DOI] [PMC free article] [PubMed] [Google Scholar]
- Redmond TM, Yu S, Lee E, Bok D, Hamasaki D, Chen N, Goletz P, Ma JX, Crouch RK, Pfeifer K. Rpe65 is necessary for production of 11-cis-vitamin A in the retinal visual cycle. Nat Genet. 1998;20:344–351. doi: 10.1038/3813. [DOI] [PubMed] [Google Scholar]
- Rémigy HW, Caujolle-Bert D, Suda K, Schenk A, Chami M, Engel A. Membrane protein reconstitution and crystallization by controlled dilution. FEBS Lett. 2003;555:160–169. doi: 10.1016/s0014-5793(03)01105-0. [DOI] [PubMed] [Google Scholar]
- Remm M, Sonnhammer E. Classification of transmembrane protein families in the Caenorhabditis elegans genome and identification of human orthologs. Genome Res. 2000;10:1679–1689. doi: 10.1101/gr.gr-1491r. [DOI] [PMC free article] [PubMed] [Google Scholar]
- Renault L, Chou HT, Chiu PL, Hill RM, Zeng X, Gipson B, Zhang ZY, Cheng A, Unger V, Stahlberg H. Milestones in electron crystallography. J Comput Aided Mol Des. 2006;20:519–527. doi: 10.1007/s10822-006-9075-x. [DOI] [PMC free article] [PubMed] [Google Scholar]
- Reviakine I, Bergsma-Schutter W, Mazeres-Dubut C, Govorukhina N, Brisson A. Surface topography of the p3 and p6 annexin V crystal forms determined by atomic force microscopy. J Struct Biol. 2000;131:234–239. doi: 10.1006/jsbi.2000.4286. [DOI] [PubMed] [Google Scholar]
- Richards D. Near-field microscopy: throwing light on the nanoworld. Philos Transact A Math Phys Eng Sci. 2003;361:2843–2857. doi: 10.1098/rsta.2003.1282. [DOI] [PubMed] [Google Scholar]
- Ridge KD, Abdulaev NG. Folding and assembly of rhodopsin from expressed fragments. Methods Enzymol. 2000;315:59–70. doi: 10.1016/s0076-6879(00)15834-3. [DOI] [PubMed] [Google Scholar]
- Ridge KD, Lee SS, Yao LL. In vivo assembly of rhodopsin from expressed polypeptide fragments. Proc Natl Acad Sci U S A. 1995;92:3204–3208. doi: 10.1073/pnas.92.8.3204. [DOI] [PMC free article] [PubMed] [Google Scholar]
- Ridge KD, Palczewski K. Visual rhodopsin sees the light: structure and mechanism of G protein signaling. J Biol Chem. 2007;282:9297–9301. doi: 10.1074/jbc.R600032200. [DOI] [PubMed] [Google Scholar]
- Rief M, Gautel M, Oesterhelt F, Fernandez JM, Gaub HE. Reversible unfolding of individual titin immunoglobulin domains by AFM. Science. 1997;276:1109–1112. doi: 10.1126/science.276.5315.1109. [DOI] [PubMed] [Google Scholar]
- Rieti S, Manni V, Lisi A, Giuliani L, Sacco D, D’Emilia E, Cricenti A, Generosi R, Luce M, Grimaldi S. SNOM and AFM microscopy techniques to study the effect of non-ionizing radiation on the morphological and biochemical properties of human keratinocytes cell line (HaCaT) J Microsc. 2004;213:20–28. doi: 10.1111/j.1365-2818.2004.01279.x. [DOI] [PubMed] [Google Scholar]
- Robben JH, Sze M, Knoers NV, Deen PM. Functional rescue of vasopressin V2 receptor mutants in MDCK cells by pharmacochaperones: relevance to therapy of nephrogenic diabetes insipidus. Am J Physiol. 2007;292:F253–F260. doi: 10.1152/ajprenal.00247.2006. [DOI] [PubMed] [Google Scholar]
- Rohacs T. Regulation of TRP channels by PIP2. Pflugers Arch. 2007;453:753–762. doi: 10.1007/s00424-006-0153-7. [DOI] [PubMed] [Google Scholar]
- Rothery AM, Gorelik J, Bruckbauer A, Yu W, Korchev YE, Klenerman D. A novel light source for SICM-SNOM of living cells. J Microsc. 2003;209:94–101. doi: 10.1046/j.1365-2818.2003.01122.x. [DOI] [PubMed] [Google Scholar]
- Saliba RS, Munro PM, Luthert PJ, Cheetham ME. The cellular fate of mutant rhodopsin: quality control, degradation and aggresome formation. J Cell Sci. 2002;115:2907–2918. doi: 10.1242/jcs.115.14.2907. [DOI] [PubMed] [Google Scholar]
- Salom D, Le Trong I, Pohl E, Ballesteros JA, Stenkamp RE, Palczewski K, Lodowski DT. Improvements in G protein-coupled receptor purification yield light stable rhodopsin crystals. J Struct Biol. 2006a;156:497–504. doi: 10.1016/j.jsb.2006.05.003. [DOI] [PubMed] [Google Scholar]
- Salom D, Lodowski DT, Stenkamp RE, Le Trong I, Golczak M, Jastrzebska B, Harris T, Ballesteros JA, Palczewski K. Crystal structure of a photoactivated deprotonated intermediate of rhodopsin. Proc Natl Acad Sci U S A. 2006b;103:16123–16128. doi: 10.1073/pnas.0608022103. [DOI] [PMC free article] [PubMed] [Google Scholar]
- Sanders CR, Myers JK. Disease-related misassembly of membrane proteins. Annu Rev Biophys Biomol Struct. 2004;33:25–51. doi: 10.1146/annurev.biophys.33.110502.140348. [DOI] [PubMed] [Google Scholar]
- SanGiovanni JP, Chew EY. The role of ω-3 long-chain polyunsaturated fatty acids in health and disease of the retina. Prog Retin Eye Res. 2005;24:87–138. doi: 10.1016/j.preteyeres.2004.06.002. [DOI] [PubMed] [Google Scholar]
- Sapra KT, Balasubramanian GP, Labudde D, Bowie JU, Müller DJ. Point mutations in membrane proteins reshape energy landscape and populate different unfolding pathways. J Mol Biol. 2008;376:1076–1090. doi: 10.1016/j.jmb.2007.12.027. [DOI] [PMC free article] [PubMed] [Google Scholar]
- Sapra KT, Besir H, Oesterhelt D, Müller DJ. Characterizing molecular interactions in different bacteriorhodopsin assemblies by single-molecule force spectroscopy. J Mol Biol. 2006a;355:640–650. doi: 10.1016/j.jmb.2005.10.080. [DOI] [PubMed] [Google Scholar]
- Sapra TK, Park PS, Filipek S, Engel A, Müller DJ, Palczewski K. Detecting molecular interactions that stabilize native bovine rhodopsin. J Mol Biol. 2006b;358:255–269. doi: 10.1016/j.jmb.2006.02.008. [DOI] [PubMed] [Google Scholar]
- Scarborough GA. Rethinking the P-type ATPase problem. Trends Biochem Sci. 2003;28:581–584. doi: 10.1016/j.tibs.2003.08.010. [DOI] [PubMed] [Google Scholar]
- Schabert FA, Henn C, Engel A. Native Escherichia coli OmpF porin surfaces probed by atomic force microscopy. Science. 1995;268:92–94. doi: 10.1126/science.7701347. [DOI] [PubMed] [Google Scholar]
- Scheuring S. AFM studies of the supramolecular assembly of bacterial photosynthetic core-complexes. Curr Opin Chem Biol. 2006;10:387–393. doi: 10.1016/j.cbpa.2006.08.007. [DOI] [PubMed] [Google Scholar]
- Scheuring S, Levy D, Rigaud JL. Watching the components of photosynthetic bacterial membranes and their in situ organisation by atomic force microscopy. Biochim Biophys Acta. 2005;1712:109–127. doi: 10.1016/j.bbamem.2005.04.005. [DOI] [PubMed] [Google Scholar]
- Scheuring S, Müller DJ, Stahlberg H, Engel HA, Engel A. Sampling the conformational space of membrane protein surfaces with the AFM. Eur Biophys J. 2002;31:172–178. doi: 10.1007/s00249-001-0197-8. [DOI] [PubMed] [Google Scholar]
- Scheuring S, Ringler P, Borgnia M, Stahlberg H, Müller DJ, Agre P, Engel A. High resolution AFM topographs of the Escherichia coli water channel aquaporin Z. EMBO J. 1999;18:4981–4987. doi: 10.1093/emboj/18.18.4981. [DOI] [PMC free article] [PubMed] [Google Scholar]
- Scheuring S, Sturgis JN. Chromatic adaptation of photosynthetic membranes. Science. 2005;309:484–487. doi: 10.1126/science.1110879. [DOI] [PubMed] [Google Scholar]
- Seelert H, Poetsch A, Dencher NA, Engel A, Stahlberg H, Müller DJ. Structural biology: proton-powered turbine of a plant motor. Nature. 2000;405:418–419. doi: 10.1038/35013148. [DOI] [PubMed] [Google Scholar]
- Sekatskii SK, Mironov BN, Lapshin DA, Dietler G, Letokhov VS. Analysis of fiber probes of scanning near-field optical microscope by field emission microscopy. Ultramicroscopy. 2001;89:83–87. doi: 10.1016/s0304-3991(01)00102-4. [DOI] [PubMed] [Google Scholar]
- Shao Z, Mou J, Czajkowsky DM, Yang J, Yuan J-Y. Biological atomic force microscopy: what is achieved and what is needed. Adv Phys. 1996;45:1–86. [Google Scholar]
- Shears SB. Understanding the biological significance of diphosphoinositol polyphosphates (‘inositol pyrophosphates’) Biochem Soc Symp. 2007:211–221. doi: 10.1042/BSS0740211. [DOI] [PubMed] [Google Scholar]
- Shuster TA, Martin F, Nagy AK. Zinc causes an apparent increase in rhodopsin phosphorylation. Curr Eye Res. 1996;15:1019–1024. doi: 10.3109/02713689609017650. [DOI] [PubMed] [Google Scholar]
- Shuster TA, Nagy AK, Conly DC, Farber DB. Direct zinc binding to purified rhodopsin and disc membranes. Biochem J. 1992;282(Pt 1):123–128. doi: 10.1042/bj2820123. [DOI] [PMC free article] [PubMed] [Google Scholar]
- Sieber JJ, Willig KI, Kutzner C, Gerding-Reimers C, Harke B, Donnert G, Rammner B, Eggeling C, Hell SW, Grubmuller H, et al. Anatomy and dynamics of a supramolecular membrane protein cluster. Science. 2007;317:1072–1076. doi: 10.1126/science.1141727. [DOI] [PubMed] [Google Scholar]
- Simons K, Toomre D. Lipid rafts and signal transduction. Nat Rev Mol Cell Biol. 2000;1:31–39. doi: 10.1038/35036052. [DOI] [PubMed] [Google Scholar]
- Singer SJ, Nicolson GL. The fluid mosaic model of the structure of cell membranes. Science. 1972;175:720–731. doi: 10.1126/science.175.4023.720. [DOI] [PubMed] [Google Scholar]
- Sommer AP, Franke RP. Near-field optical analysis of living cells in vitro. J Proteome Res. 2002;1:111–114. doi: 10.1021/pr025501t. [DOI] [PubMed] [Google Scholar]
- Spiegel AM, Weinstein LS. Inherited diseases involving G proteins and G protein-coupled receptors. Annu Rev Med. 2004;55:27–39. doi: 10.1146/annurev.med.55.091902.103843. [DOI] [PubMed] [Google Scholar]
- Spijker P, Vaidehi N, Freddolino PL, Hilbers PA, Goddard WA., 3rd Dynamic behavior of fully solvated β2-adrenergic receptor, embedded in the membrane with bound agonist or antagonist. Proc Natl Acad Sci U S A. 2006;103:4882–4887. doi: 10.1073/pnas.0511329103. [DOI] [PMC free article] [PubMed] [Google Scholar]
- Spolar RS, Record MT., Jr Coupling of local folding to site-specific binding of proteins to DNA. Science. 1994;263:777–784. doi: 10.1126/science.8303294. [DOI] [PubMed] [Google Scholar]
- Spray DC, Burt JM. Structure-activity relations of the cardiac gap junction channel. Am J Physiol. 1990;258:C195–C205. doi: 10.1152/ajpcell.1990.258.2.C195. [DOI] [PubMed] [Google Scholar]
- Spray DC, Harris AL, Bennett MV. Gap junctional conductance is a simple and sensitive function of intracellular pH. Science. 1981;211:712–715. doi: 10.1126/science.6779379. [DOI] [PubMed] [Google Scholar]
- Stahlberg H, Fotiadis D, Scheuring S, Rémigy H, Braun T, Mitsuoka K, Fujiyoshi Y, Engel A. Two-dimensional crystals: a powerful approach to assess structure, function and dynamics of membrane proteins. FEBS Lett. 2001a;504:166–172. doi: 10.1016/s0014-5793(01)02746-6. [DOI] [PubMed] [Google Scholar]
- Stahlberg H, Müller DJ, Suda K, Fotiadis D, Engel A, Meier T, Matthey U, Dimroth P. Bacterial Na+-ATP synthase has an undecameric rotor. EMBO Rep. 2001b;2:229–233. doi: 10.1093/embo-reports/kve047. [DOI] [PMC free article] [PubMed] [Google Scholar]
- Stojanovic A, Stitham J, Hwa J. Critical role of transmembrane segment zinc binding in the structure and function of rhodopsin. J Biol Chem. 2004;279:35932–35941. doi: 10.1074/jbc.M403821200. [DOI] [PubMed] [Google Scholar]
- Stone WL, Farnsworth CC, Dratz EA. A reinvestigation of the fatty acid content of bovine, rat and frog retinal rod outer segments. Exp Eye Res. 1979;28:387–397. doi: 10.1016/0014-4835(79)90114-3. [DOI] [PubMed] [Google Scholar]
- Suda K, Filipek S, Palczewski K, Engel A, Fotiadis D. The supramolecular structure of the GPCR rhodopsin in solution and native disc membranes. Mol Membr Biol. 2004;21:435–446. doi: 10.1080/09687860400020291. [DOI] [PMC free article] [PubMed] [Google Scholar]
- Sui H, Han BG, Lee JK, Walian P, Jap BK. Structural basis of water-specific transport through the AQP1 water channel. Nature. 2001;414:872–878. doi: 10.1038/414872a. [DOI] [PubMed] [Google Scholar]
- Synge EH. Suggested method for extending microscope resolution into the ultra microscopic region. Philos Mag. 1928:356–362. [Google Scholar]
- Taglicht D, Padan E, Schuldiner S. Overproduction and purification of a functional Na+/H+ antiporter coded by nhaA (ant) from Escherichia coli. J Biol Chem. 1991;266:11289–11294. [PubMed] [Google Scholar]
- Tajkhorshid E, Nollert P, Jensen MO, Miercke LJ, O’Connell J, Stroud RM, Schulten K. Control of the selectivity of the aquaporin water channel family by global orientational tuning. Science. 2002;296:525–530. doi: 10.1126/science.1067778. [DOI] [PubMed] [Google Scholar]
- Takamori S, Holt M, Stenius K, Lemke EA, Gronborg M, Riedel D, Urlaub H, Schenck S, Brugger B, Ringler P, et al. Molecular anatomy of a trafficking organelle. Cell. 2006;127:831–846. doi: 10.1016/j.cell.2006.10.030. [DOI] [PubMed] [Google Scholar]
- Tamm LK. Protein-Lipid Interactions: from Membrane Domains to Cellular Networks. Wiley-VCH; Weinheim: 2005. [Google Scholar]
- Tateyama M, Abe H, Nakata H, Saito O, Kubo Y. Ligand-induced rearrangement of the dimeric metabotropic glutamate receptor 1α. Nat Struct Mol Biol. 2004;11:637–642. doi: 10.1038/nsmb770. [DOI] [PubMed] [Google Scholar]
- Teller DC, Okada T, Behnke CA, Palczewski K, Stenkamp RE. Advances in determination of a high-resolution three-dimensional structure of rhodopsin, a model of G-protein-coupled receptors (GPCRs) Biochemistry. 2001;40:7761–7772. doi: 10.1021/bi0155091. [DOI] [PMC free article] [PubMed] [Google Scholar]
- Terrillon S, Bouvier M. Roles of G-protein-coupled receptor dimerization. EMBO Rep. 2004;5:30–34. doi: 10.1038/sj.embor.7400052. [DOI] [PMC free article] [PubMed] [Google Scholar]
- Thompson MD, Burnham WM, Cole DE. The G protein-coupled receptors: pharmacogenetics and disease. Crit Rev Clin Lab Sci. 2005;42:311–392. doi: 10.1080/10408360591001895. [DOI] [PubMed] [Google Scholar]
- Tillman TS, Cascio M. Effects of membrane lipids on ion channel structure and function. Cell Biochem Biophys. 2003;38:161–190. doi: 10.1385/CBB:38:2:161. [DOI] [PubMed] [Google Scholar]
- Toyoshima C, Mizutani T. Crystal structure of the calcium pump with a bound ATP analogue. Nature. 2004;430:529–535. doi: 10.1038/nature02680. [DOI] [PubMed] [Google Scholar]
- Toyoshima C, Nakasako M, Nomura H, Ogawa H. Crystal structure of the calcium pump of sarcoplasmic reticulum at 2.6 A resolution. Nature. 2000;405:647–655. doi: 10.1038/35015017. [DOI] [PubMed] [Google Scholar]
- Toyoshima C, Nomura H. Structural changes in the calcium pump accompanying the dissociation of calcium. Nature. 2002;418:605–611. doi: 10.1038/nature00944. [DOI] [PubMed] [Google Scholar]
- Toyoshima C, Nomura H, Tsuda T. Lumenal gating mechanism revealed in calcium pump crystal structures with phosphate analogues. Nature. 2004;432:361–368. doi: 10.1038/nature02981. [DOI] [PubMed] [Google Scholar]
- Trombetta ES, Parodi AJ. Quality control and protein folding in the secretory pathway. Annu Rev Cell Dev Biol. 2003;19:649–676. doi: 10.1146/annurev.cellbio.19.110701.153949. [DOI] [PubMed] [Google Scholar]
- Tsai CJ, Kumar S, Ma B, Nussinov R. Folding funnels, binding funnels, and protein function. Protein Sci. 1999;8:1181–1190. doi: 10.1110/ps.8.6.1181. [DOI] [PMC free article] [PubMed] [Google Scholar]
- Ugarte M, Osborne NN. Zinc in the retina. Prog Neurobiol. 2001;64:219–249. doi: 10.1016/s0301-0082(00)00057-5. [DOI] [PubMed] [Google Scholar]
- Valiyaveetil FI, MacKinnon R, Muir TW. Semisynthesis and folding of the potassium channel KcsA. J Am Chem Soc. 2002;124:9113–9120. doi: 10.1021/ja0266722. [DOI] [PubMed] [Google Scholar]
- Vendruscolo M, Dobson CM. Structural biology: dynamic visions of enzymatic reactions. Science. 2006;313:1586–1587. doi: 10.1126/science.1132851. [DOI] [PubMed] [Google Scholar]
- von Heijne G. Membrane protein structure prediction: hydrophobicity analysis and the positive-inside rule. J Mol Biol. 1992;225:487–494. doi: 10.1016/0022-2836(92)90934-c. [DOI] [PubMed] [Google Scholar]
- von Heijne G. The membrane protein universe: what’s out there and why bother? J Intern Med. 2007;261:543–557. doi: 10.1111/j.1365-2796.2007.01792.x. [DOI] [PubMed] [Google Scholar]
- Weiss S. Fluorescence spectroscopy of single biomolecules. Science. 1999;283:1676–1683. doi: 10.1126/science.283.5408.1676. [DOI] [PubMed] [Google Scholar]
- White JH, Wise A, Main MJ, Green A, Fraser NJ, Disney GH, Barnes AA, Emson P, Foord SM, Marshall FH. Heterodimerization is required for the formation of a functional GABAB receptor. Nature. 1998;396:679–682. doi: 10.1038/25354. [DOI] [PubMed] [Google Scholar]
- White SH, Ladokhin AS, Jayasinghe S, Hristova K. How membranes shape protein structure. J Biol Chem. 2001;276:32395–32398. doi: 10.1074/jbc.R100008200. [DOI] [PubMed] [Google Scholar]
- White SH, Wimley WC. Membrane protein folding and stability: physical principles. Annu Rev Biophys Biomol Struct. 1999;28:319–365. doi: 10.1146/annurev.biophys.28.1.319. [DOI] [PubMed] [Google Scholar]
- Williams PM, Fowler SB, Best RB, Toca-Herrera JL, Scott KA, Steward A, Clarke J. Hidden complexity in the mechanical properties of titin. Nature. 2003;422:446–449. doi: 10.1038/nature01517. [DOI] [PubMed] [Google Scholar]
- Wilson JH, Hunt T. Molecular Biology of the Cell: A Problems Approach. 5. Garland Science; New York: 2008. [Google Scholar]
- Wolynes PG, Onuchic JN, Thirumalai D. Navigating the folding routes. Science. 1995;267:1619–1620. doi: 10.1126/science.7886447. [DOI] [PubMed] [Google Scholar]
- Yamashita A, Singh SK, Kawate T, Jin Y, Gouaux E. Crystal structure of a bacterial homologue of Na+/Cl−-dependent neurotransmitter transporters. Nature. 2005;437:215–223. doi: 10.1038/nature03978. [DOI] [PubMed] [Google Scholar]
- Yeagle PL. Lipid regulation of cell membrane structure and function. FASEB J. 1989;3:1833–1842. [PubMed] [Google Scholar]
- Yildiz O, Vinothkumar KR, Goswami P, Kuhlbrandt W. Structure of the monomeric outer-membrane porin OmpG in the open and closed conformation. EMBO J. 2006;25:3702–3713. doi: 10.1038/sj.emboj.7601237. [DOI] [PMC free article] [PubMed] [Google Scholar]
- Yohannan S, Yang D, Faham S, Boulting G, Whitelegge J, Bowie JU. Proline substitutions are not easily accommodated in a membrane protein. J Mol Biol. 2004;341:1–6. doi: 10.1016/j.jmb.2004.06.025. [DOI] [PubMed] [Google Scholar]