

Abstract
In this paper we present a method for the multi-resolution comparison of biomolecular electrostatic potentials without the need for global structural alignment of the biomolecules. The underlying computational geometry algorithm uses multi-resolution attributed contour trees (MACTs) to compare the topological features of volumetric scalar fields. We apply the MACTs to compute electrostatic similarity metrics for a large set of protein chains with varying degrees of sequence, structure, and function similarity. For calibration, we also compute similarity metrics for these chains by a more traditional approach based upon 3D structural alignment and analysis of Carbo similarity indices. Moreover, because the MACT approach does not rely upon pairwise structural alignment, its accuracy and efficiency promises to perform well on future large-scale classification efforts across groups of structurally-diverse proteins. The MACT method discriminates between protein chains at a level comparable to the Carbo similarity index method; i.e., it is able to accurately cluster proteins into functionally-relevant groups which demonstrate strong dependence on ligand binding sites. The results of the analyses are available from the linked web databases http://ccvweb.cres.utexas.edu/MolSignature/ and http://agave.wustl.edu/similarity/. The MACT analysis tools are available as part of the public domain library of the Topological Analysis and Quantitative Tools (TAQT) from the Center of Computational Visualization, at the University of Texas at Austin (http://ccvweb.csres.utexas.edu/software). The Carbo software is available for download with the open-source APBS software package at http://apbs.sf.net/.
Keywords: electrostatic, contour tree, similarity, clustering, Poisson-Boltzmann
Introduction
Structural genomics has led to a dramatically increased rate of biomolecular 3D structure determination, but relatively few methods have been developed for analyzing and interpreting all these structural data in terms of potential physiological functions and biochemical properties. Effective biomolecular comparison and classification methods are important for the understanding of their structural and functional properties. Typical protein comparison methods are usually based on the similarities of sequences [17] or the three-dimensional structures of biomolecular chains [11]. While such methods have proven to be very powerful for geometric comparison of protein structures, they lack a description of the chemical features in atomistic detail because some functions may arise from chemical heterogeneity that gives (in part) a particular protein structure its unique molecular function. An alternative method of comparing biomolecules is to quantitatively calculate volumetric functions of their important properties and match those 3D functions. The two most commonly used functions are molecular shape and electrostatic potential although other properties have also been used [20].
The electrostatic potential is an important characteristic of biomolecules and plays a critical role for interactions within and among biological structures. The electrostatic potential of a biomolecule is generally computed from the atomic charges, radii, and dielectric characteristics of the biomolecule and solvent via numerical solutions of partial differential equations such as the Poisson-Boltzmann (PB) equation [4]. Electrostatic properties, especially those obtained by solution of the PB equation, have found a wide range of uses in the interpretation of biomolecular structure and functions [4].
Some effort has also been made to pursue more “informatics”-based approaches to the interpretation of electrostatic properties. Much of this work includes identification of functionally-relevant residues in biomolecules by looking at electrostatic destabilization of conserved residues [18], highly shifted pKa values [44], clusters of charged residues [59], protein-membrane interactions [40], and other structural characteristics [55]. Other research has focused on comparisons of electrostatic potentials including global analyses of the biomolecular structure [38, 9, 40, 51, 37, 30, 36, 47, 43, 8, 53, 34, 46, 35, 52] both in three-dimensional space over the entire biomolecular structure and at localized regions such as active sites [52, 6, 22]. While the past characterization of electrostatic properties of biomolecules has provided insight into a variety of biomolecular properties, previous applications focused only on a few quantitative measures of electrostatic properties and, with a few exceptions [8, 57], limited their studies to relatively small numbers of biomolecules. However, with the proliferation of protein structures elucidated by structural genomics efforts and the burgeoning interest in understanding biomolecular interactions in a proteomics context, tools to facilitate the analysis of electrostatic properties across thousands of biomolecular structures will become increasingly important.
In this paper, we present a new “MACT” method to align local regions of similar electrostatic potential and molecular structure through local matching of topological features instead of global structural alignment. While electrostatics and molecular shape are not the sole determinants of chemical specificity, we believe the current methods show promise for identifying regions of similar electrostatic potential between structurally-distinct biomolecules. Before presenting this new method, we will review some of the existing techniques for electrostatic comparison.
Similarity index methods
A standard method for comparing functions in numerical analysis is the application of various norms and inner products. Many methods use the fact that solutions to the PB equation away from the location of point charges are square-integrable [26] implying finite inner products:
| (1) |
and norms:
| (2) |
Similarity indices have been popular in QSAR studies [12, 13, 24] and the study of biomolecular electrostatics [53, 8]. The most popular metrics were introduced by Hodgkin et al [24, 12]
| (3) |
and Carbo SC (u,v) [13]:
| (4) |
As can be seen from their definitions, these indices only differ by their choice of normalization; the Hodgkin index offers the advantage of distinguishing between functions which differ by a constant multiple, while the Carbo index provides a natural measure of the extent of orthogonality between two functions. In both cases, these indices are essentially modified L2(Ω) inner products which return 1 for identical functions, -1 for functions which are different only by a constant multiple of 1, and 0 for orthogonal (i.e., unrelated) functions. To prevent numerical instability due to the singular nature of the electrostatic potential near atomic point charges, the domain of integration (Ω) is often chosen to be some space outside the union of biomolecular volumes [8, 53, 54].
Topology-based methods
The Carbo/Hodgkin metrics are not invariant under transformations such as rigid body rotation or translation, and are therefore dependent on an initial accurate structural alignment. While there are a number of tools available for structural alignment [11], including some based on electrostatics [52], the task of structural alignment is still computationally demanding. Furthermore, the reliance of similarity index methods on structural alignment severely limits their applicability to the comparison of electrostatic properties for structurally-similar biomolecules.
Contour trees
Another approach to developing comparison metrics is to exploit the topological signatures of volumetric functions in the form of the contour spectrum [3] and dual contour trees (DCTs) [58]. DCTs are assembled by partitioning function domains into connected subdomains called interval volumes. These interval volumes represent regions of the domain where the function values lie between two specific isovalues. The distribution of the connected interval volumes can represented by a dual contour tree (DCT) in which every connected interval volume becomes a node and two nodes are connected by an edge if the corresponding interval-volumes are adjacent (sharing the same contour at their boundaries). The construction of a simple DCT is depicted in Figure 1 and described in more detail in Reference [58] and the Appendix of this manuscript.
Figure 1.
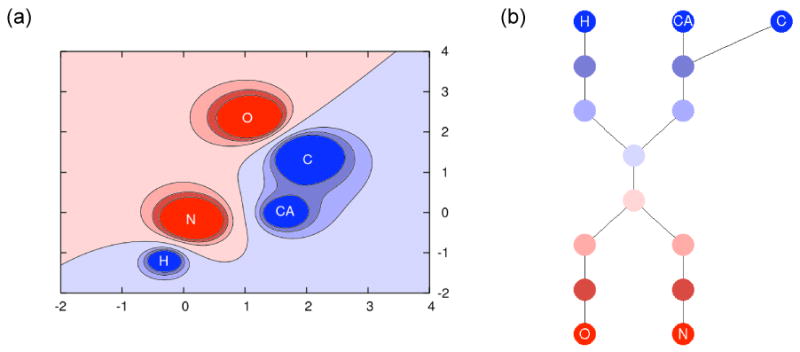
A simple example of a potential-based DCT. (a) A fictitious 2D electrostatic potential a model amino acid; colors correspond to potential value from deep red (very negative) to deep blue (very positive). (b) The DCT constructed from connected sub-domains of the potential; DCT nodes are color-coded to correspond with the appropriate potential sub-domains in (a).
The DCT structure can be simplified by restricting it to a smaller functional range associated with a particular region of interest. Often, only certain feature regions of the 3D volume are important for comparing molecular structures, e.g. solvent-accessible regions near the surfaces of biomolecules which might influence the binding properties of other molecules. As with the similarity indices, using a sub-range outside of the molecular surface removes instabilities due to divergence of the electrostatic potential near atomic charge positions. DCTs can be further simplified by representation in a hierarchical multi-resolution form. This multi-resolution form is constructed from a DCT by merging adjacent functional intervals (collapsing tree edges) such that each node corresponds to a larger range of the functional value. Details are again available from a previous paper [58].
In order to quantitatively measure the similarities of multi-resolution DCTs, numerical attributes need to be defined for the DCT nodes. In a previous paper [58], Zhang et al describe several affine-invariant geometrical, topological, and functional attributes which can be computed and saved in the DCT nodes. When combined with the multi-resolution approach described above, these attributed DCTs form the Multi-resolution Attributed Contour Tree (MACT) data structure. For the current application, MACTs are assembled from DCTs constructed on solvent accessibility functions representing biomolecular shape. In the present work, the numerical attributes for the nodes of the MACT include information about the size and shape of the functional interval as well as local electrostatic potential multipole moments. More information about these attributes is given the Appendix.
The MACTs are used to compute a similarity measure (score) for various biomolecules in an efficient manner described in Ref. [58] and summarized in the Appendix. The MACTs facilitate the finding of matched node pairs in a hierarchical fashion based on their multi-resolution structures [58]. The similarity between two MACTs is evaluated as the average of the similarity scores of DCTs at all levels, except for the coarsest one. This score is then used to measure the similarity between molecular structures with properties.
Methods
Biomolecular test set selection
The Carbo and MACT similarity scores described above were calculated for a total of 494 protein chains (full list are available from the linked web databases http://ccvweb.csres.utexas.edu/MolSignature/ and http://agave.wustl.edu/similarity/ based on the sequence-, structure-, and function-based subsets described below.
Group I: Structure-based subset
The ASTRAL database [15] was the starting point for this dataset. In particular, we obtained a non-redundant set of approximately 5,400 chains from the ASTRAL database indexed based on SCOP [25] assignments and containing less than 40% sequence identity between all pairs. Three SCOP superfamilies were chosen from this set of 5,400 chains for the present analysis: P-loop containing nucleotide triphosphate hydrolases (SCOP c.37.1; 112 members used), NAD(P)-binding Rossmann-fold domains (SCOP c.2.1, 108 members used), and immunoglobins (SCOP b.1.1, 75 members used). Together, these superfamilies formed a structure-based subset of 295 proteins used in the current analysis.
Group II. Sequence- and function-based subset
The second group of calculations was performed on a set of 199 protein chains assembled from several protein families. First, sets of cholinesterase-like proteins (acetylcholinesterases, lipases, cholesterol esterases, haloalkane dehalogenases) and kinases (including titin, twitchin, mitogen-activated, tyrosine, cyclin-dependent, casein, phosphorylase, and cAMP-dependent) were taken from the CE database [49, 10, 48]. Additionally, we assembled sets of structures corresponding to the enolase, ferritin, and superoxide dismutase families studied by Livesay et al [35].
Structure preparation and potential calculations
Structures were compared at the chain level, thus allowing individual subunits of multi-subunit proteins to be analyzed. The PDB2PQR service (http://agave.wustl.edu/pdb2pqr/) [16] was used to prepare each structure for electrostatics calculations by repairing missing atoms, optimizing H-bonding networks [41], and assigning protonation states. Charges and radii were assigned to each atom using the AMBER force field [50]. Of the 1557 original structures, 1415 (91%) were parameterized into formats acceptable for subsequent electrostatics calculations; the remaining 142 encountered various problems, including 19 entries with errors in the PDB format or unknown/unspecified residue types, 33 entries with unknown post-translational modifications or covalently bound ligands, 31 entries with identical atom positions, and 59 entries with errors in residue composition (missing atoms) or numbering/labeling.
Successfully parameterized structures were then processed by an input generation script to set-up the APBS electrostatics calculations. The electrostatic potentials of the sample protein chains were computed using the freely-available APBS software package (http://apbs.sf.net/) [5] version 0.3.2 with a protein dielectric of 2, solvent dielectric of 80, ionic strength of 150 mM (NaCl), and grid spacing chosen for each protein system such that the grid was always finer than 0.5 Å.
Similarity score calculations
Carbo index calculations
We used the implementation of the Carbo similarity index provided with APBS 0.3.2 [5]. Carbo similarity index calculations were preceded by structural alignment of all chains using CE [49]. The resulting alignment translation and rotation information was used to superimpose the potentials and calculate the Carbo similarity index (see above) [13] using all potential values on the PB calculation grid outside the molecular surface. A total of 243,911 non-unique pairs of chains were generated from this analysis. Since the Carbo analysis provides symmetric similarity scores (e.g., comparing chain A to chain B gives the same result as comparing B to A), only the 122,266 unique similarity pairs (including self-comparisons) were used in the analyses described below. A subset of the biomolecules was analyzed with the Hodgkin similarity index; the results were indistinguishable from the Carbo metric (data not shown).
MACT calculations
The implementation of the above MACT scoring and matching algorithms as described by Zhang et al [58] are available as part of the public domain library of the Topological Analysis and Quantitative Tools (TAQT) from the Center of Computational Visualization, at the University of Texas at Austin (http://ccvweb.csres.utexas.edu/software). Unlike the Carbo indices, no alignment of the chains was necessary for this analysis. For these calculations, the solvent accessibility was represented by a cubic spline function [27] with a window of 0.3 Å around the standard van der Waals surface. The van der Waals surface was defined by the union of atomic radii. Unlike the electrostatic calculations, we used AMBER radii [50] inflated by 1.4 Å (roughly a water molecule radius) to focus comparison of electrostatic potentials on the region immediately outside the molecular surface, which is selected as the volume spanned by spline-based solvent accessibility values between 0.3 (more internal) to 0.7 (more external). A total of 250,722 pairs were generated from the MACT analysis. The MACT scores are not necessarily symmetric; therefore, the results were symmetrized by averaging (A,B) and (B,A) pair results. This averaging provided a total of 126,254 unique pairs; the average deviation between (A,B) and (B,A) pairs was 0.01 ± 0.02.
Results
The results of these electrostatic comparison analyses are summarized here. All of the calculation data, analysis, and classification results, including visualization of structures, are available on-line as cross-linked web-accessible databases at http://ccvweb.csres.utexas.edu/MolSignature/ and http://agave.wustl.edu/similarity/.
Classification
Several databases were used to provide classification of the chains during analysis of the results. Enzyme Commission (EC) classes [42] were assigned to all chains using annotation from PDBsum [33] and UniProt [2]. These EC classes were also used to infer ligands for each chain using the KEGG database [28]. Ligands were identified for all biomolecules using annotation in the PDBsum database [33] and classified via their ChEBI ID [19] using the ChEBI chemical ontology. To provide a more flexible mechanism for comparison, ChEBI IDs were clustered at the fifth level of the chemical ontology; e.g., at levels such as “nucleosides”, “monocarboxylic acids”, “lactones”, etc. Gene Ontology (GO) “molecular function” classes [21] were assigned using entries from the InterPro database [39]. Like the ChEBI IDs, these GO classes were clustered based on the fifth level of the molecular function ontology to provide a more general level of comparison; e.g. at descriptive levels such as “purine nucleotide binding”, “oxidoreductase activity, acting on…”, “transferase activity, transferring…”, etc.
Score normalization
Different numbers of score pairs were available for the Carbo and MACT similarity analyses due to the inability to align some protein chains with CE. Therefore, the following analyses are limited to the 122,265 unique pairs of chains for which both MACT and Carbo results are available. Scores from the Carbo and MACT similarity analyses had very different distributions; the Carbo scores had a mean value of 1.69 × 10⁻² and a standard deviation of 3 × 10⁻⁴. The MACT scores had a mean value of 3.076 × 10⁻¹ and a standard deviation of 9 × 10⁻⁴. To facilitate comparison of the results, raw scores were transformed into the following quantities:
P(S): the observed probability of choosing a score that is greater than the given similarity score S
E(S)= −log(1 − P(S)): the expectation value of the given score
Z(S)= (S − S̄): the number of standard deviations σS a given score S deviates from the mean score S̄
Overall comparison
There was very little correlation between the Carbo and MACT scores, even after transformation to the above scoring schemes; Pearson correlation coefficients were 0.47 for S and Z, 0.53 for P, and 0.36 for E. However, strong correlation between the scores should not be expected, as these two methods represent and compare global and local features of the electrostatic potentials in fundamentally different ways. With a few exceptions [52], the Carbo method is used to provide a global comparison of potentials and therefore relies on the structural alignment of two chains. As such, the Carbo-based analysis is expected to correlate strongly with CE scores (see Figure 2). On the other hand, MACT performs a more local analysis of the surface shape and potential and does not rely on external alignment methods and therefore does not necessarily correlate with CE score (see Figure 2).
Figure 2.
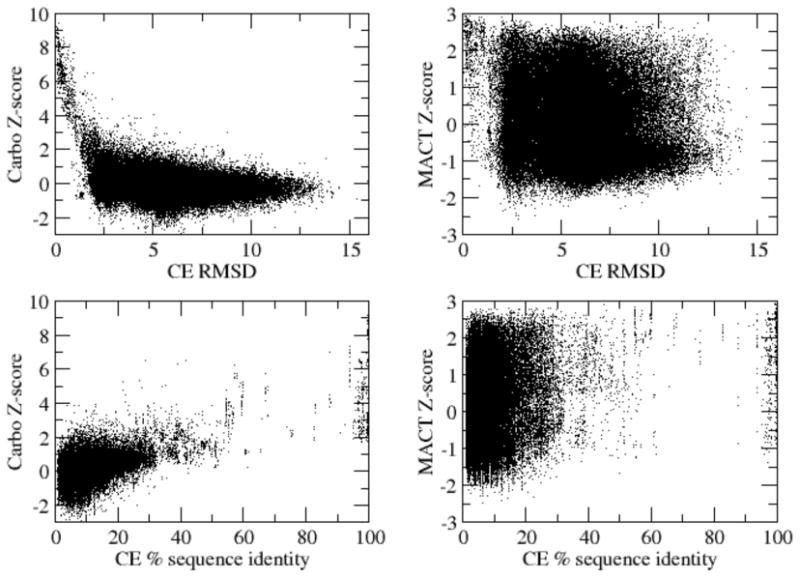
Dependence of Carbo and MACT Z-scores on CE alignment RMSD and alignment sequence identity; please see text for more details on these comparisons.
Clustering
The protein chains were clustered using the CLUTO software package [29] using direct k-way clustering to divide the Carbo- and MACT-scored datasets into 5, 10, 20, 30, and 40 clusters. The detailed clustering results are provided on the website (http://agave.wustl.edu/similarity/). As expected, increasing k gave clusters of better internal similarity and external dissimilarity; this behavior is demonstrated in Table 1.
Table 1.
Statistics for k-way clustering of Carbo and MACT similarity scores. “Internal similarity” is the average similarity between pairs of data within a cluster; “external similarity” is the average similarity between data inside and outside of a cluster.
| Cluster Size | ||||||
|---|---|---|---|---|---|---|
| k | Internal similarity | External similarity | Max | Min | Avg | |
| Carbo | 5 | 0.84 ± 0.06 | 0.60 ± 0.06 | 145 | 47 | 99 ± 3 |
| 10 | 0.89 ± 0.03 | 0.56 ± 0.03 | 86 | 2 | 49 ± 4 | |
| 15 | 0.90 ± 0.02 | 0.56 ± 0.03 | 92 | 2 | 33 ± 4 | |
| 20 | 0.92 ± 0.01 | 0.60 ± 0.03 | 48 | 2 | 24.7 ± 0.5 | |
| 30 | 0.94 ± 0.01 | 0.63 ± 0.02 | 34 | 2 | 16.5 ± 0.5 | |
| 40 | 0.95 ± 0.01 | 0.64 ± 0.02 | 22 | 2 | 12.4 ± 0.7 | |
| MACT | 5 | 0.94 ± 0.02 | 0.84 ± 0.04 | 209 | 42 | 99 ± 3 |
| 10 | 0.95 ± 0.02 | 0.85 ± 0.03 | 106 | 15 | 49 ± 6 | |
| 15 | 0.96 ± 0.01 | 0.84 ± 0.02 | 72 | 2 | 32.9 ± 0.5 | |
| 20 | 0.96 ± 0.01 | 0.85 ± 0.03 | 54 | 2 | 25 ± 2 | |
| 30 | 0.97 ± 0.01 | 0.86 ± 0.01 | 42 | 2 | 16.5 ± 0.3 | |
| 40 | 0.98 ± 0.01 | 0.86 ± 0.02 | 34 | 2 | 12.35 ± 0.06 | |
The purpose of clustering based on electrostatic similarity is to attempt to derive classes of similar proteins without prior knowledge of their functional role. As such, we analyzed the clustering results in terms of the ChEBI, GO, and EC classes described above by calculating p-values for the appearance of each class in a cluster; these p-values represent the probability of randomly finding a cluster of the same size with the same or greater occurrences of the class. In particular, the hypergeometric distribution [56] was used to describe the probability of sampling a certain number of class instances in a cluster without replacement. The results of this analysis are also provided on the website (http://agave.wustl.edu/similarity/) and summarized in Table 2. As this table demonstrates, each cluster has a substantial number of classes with significant representation (p < 0.05). Additionally, each cluster has a somewhat smaller number of unique classes – those which were not found in any other electrostatic cluster. Although there is significant variation in the number of assignments, most clusters were uniquely associated 2-3 EC categories, 1-2 GO IDs, and 1-2 ChEBI IDs.
Table 2.
Classification statistics (based on the EC, GO, and ChEBI classification schemes described in the text) within clusters for Carbo and MACT similarity scores. All entries represent the number of hits. Significant hits are classes with p-values less than 0.05 (see text). Unique significant hits are classes with p-values less than 0.05 that are not present in any other cluster. Shared hits are classes with p-values less than 0.05 which are shared by more than one cluster. In total, there were 31 EC, 48 GO, and 54 ChEBI classes with assignments to at least one chain.
| OVERALL | EC | GO | ChEBI | ||||||||||||||||||
|---|---|---|---|---|---|---|---|---|---|---|---|---|---|---|---|---|---|---|---|---|---|
| Sig. hits per cluster | Uniq. sig. hits per cluster | Shared hits |
Sig. hits per cluster | Uniq. sig. hits per cluster | Shared hits |
Sig. hits per cluster | Uniq. sig. hits per cluster | Shared hits |
Sig. hits per cluster | Uniq. sig. hits per cluster | Shared hits |
||||||||||
| k | Max | Avg | Max | Avg | Max | Avg | Max | Avg | Max | Avg | Max | Avg | Max | Avg | Max | Avg | |||||
| Carbo | 5 | 13 | 7 ± 8 | 8 | 4 ± 5 | 5 | 3 | 2 ± 2 | 2 | 1 ± 2 | 1 | 4 | 2 ± 3 | 4 | 2 ± 2 | 2 | 8 | 3 ± 4 | 6 | 2 ± 3 | 2 |
| 10 | 11 | 6 ± 6 | 7 | 3 ± 4 | 10 | 2 | 1 ± 1 | 1 | 0.6 ± 0.7 | 2 | 4 | 2 ± 2 | 4 | 1 ± 2 | 5 | 8 | 3 ± 4 | 6 | 2 ± 3 | 3 | |
| 15 | 12 | 5 ± 6 | 5 | 3 ± 3 | 15 | 3 | 1 ± 2 | 2 | 0.4 ± 0.8 | 4 | 4 | 2 ± 2 | 3 | 1 ± 1 | 5 | 7 | 2 ± 3 | 3 | 2 ± 2 | 6 | |
| 20 | 12 | 5 ± 6 | 7 | 2 ± 3 | 20 | 3 | 1 ± 2 | 2 | 1 ± 1 | 5 | 4 | 2 ± 2 | 3 | 1 ± 1 | 7 | 7 | 2 ± 3 | 3 | 2 ± 2 | 8 | |
| 30 | 10 | 5 ± 5 | 9 | 2 ± 3 | 25 | 2 | 1 ± 1 | 2 | 0.4 ± 0.8 | 5 | 7 | 2 ± 2 | 7 | 1 ± 2 | 7 | 5 | 2 ± 3 | 4 | 1 ± 1 | 13 | |
| 40 | 10 | 4 ± 5 | 10 | 2 ± 3 | 28 | 3 | 1 ± 1 | 2 | 0.5 ± 0.8 | 8 | 7 | 2 ± 2 | 7 | 1 ± 2 | 8 | 5 | 2 ± 2 | 4 | 1 ± 1 | 12 | |
| MACT | 5 | 11 | 7 ± 8 | 8 | 5 ± 5 | 6 | 3 | 2 ± 2 | 3 | 1 ± 2 | 2 | 4 | 2 ± 3 | 2 | 1 ± 2 | 2 | 6 | 2 ± 3 | 4 | 2 ± 2 | 2 |
| 10 | 10 | 6 ± 6 | 6 | 3 ± 3 | 12 | 2 | 1 ± 1 | 2 | 1 ± 1 | 2 | 4 | 2 ± 2 | 2 | 1 ± 1 | 2 | 8 | 3 ± 4 | 3 | 1 ± 2 | 8 | |
| 15 | 10 | 5 ± 6 | 7 | 3 ± 4 | 13 | 2 | 1 ± 2 | 2 | 1 ± 1 | 3 | 5 | 2 ± 3 | 3 | 1 ± 2 | 2 | 8 | 2 ± 3 | 4 | 1 ± 2 | 8 | |
| 20 | 10 | 5 ± 6 | 9 | 3 ± 4 | 13 | 2 | 1 ± 1 | 2 | 1 ± 1 | 3 | 6 | 2 ± 2 | 5 | 1 ± 2 | 3 | 8 | 2 ± 3 | 4 | 1 ± 2 | 7 | |
| 30 | 10 | 5 ± 6 | 8 | 3 ± 3 | 23 | 3 | 1 ± 1 | 3 | 1 ± 1 | 4 | 6 | 2 ± 2 | 5 | 1 ± 2 | 5 | 8 | 2 ± 3 | 4 | 1 ± 1 | 14 | |
| 40 | 10 | 4 ± 5 | 8 | 2 ± 3 | 25 | 3 | 1 ± 1 | 3 | 1 ± 1 | 4 | 6 | 2 ± 3 | 5 | 1 ± 2 | 7 | 7 | 2 ± 2 | 4 | 1 ± 1 | 14 | |
Subset comparison
In addition to performing analysis on the entire set of results, we also analyzed subsets of protein chains based on sequence and structure similarity.
High sequence and structure similarity
As an initial positive control, we compared Carbo and MACT scores for a subset of protein chains with greater than 60% sequence identity and less than 5 Å RMSD upon structural alignment. Ignoring chain identities†, this resulted in a subset of 100 pairs of 55 unique protein chains. Using these sequence and structural criteria, each chain was paired with an average of 3 ± 3 other chains. The results of this analysis are shown in Table 3 (“SeqStr” group). Carbo scores were large and significant while MACT scores were largely non-discriminating. This conclusion is supported by the global analysis above; Carbo scores were much more strongly correlated with RMSD and sequence identity than the MACT results.
Table 3.
Carbo and MACT score results for subset comparison: SeqStr, protein chains with greater than 60% sequence identity and less than 5 Å RMSD upon structural alignment; Str, non-identical protein chains with less than 5 Å structural RMSD; Carbo Sig, pairs with Carbo score p-values less than or equal to 0.05; MACT Sig, pairs with MACT score p-values less than or equal to 0.05; Carbo SigLow, proteins in the Carbo Sig set with structural RMSD greater than 4.0 Å and sequence identity less than 60%; MACT SigLow, proteins in the Carbo Sig set with structural RMSD greater than 4.0 Å and sequence identity less than 60%. Standard error in last digit is shown in parentheses.
| Cluster | Carbo scores | MACT scores | ||||||
|---|---|---|---|---|---|---|---|---|
| Raw (×101) | Z | P (×102) | E (×102) | Raw (×101) | Z | P (×102) | E (×102) | |
| SeqStr | 2.6(2) | 2.6(2) | 1.68(9) | 1.7(1) | 5.4(1) | 1.01(5) | 26(2) | 4.3(3) |
| Str | 3.67(3) | 0.217(4) | 38.0(2) | 73.8(5) | 3.48(1) | 0.179(6) | 44.5(2) | 86.4(4) |
| Carbo Sig | 5.34(2) | 9.90(8) | 23.5(1) | 36.27(1) | ||||
| MACT Sig | 0.734(5) | 6.18(6) | 23.7(3) | 33.2(4) | ||||
| Carbo SigLow | 5.4(1) | 1.01(4) | 21.7(7) | 28.1(9) | ||||
| MACT SigLow | 4.027(6) | 2.559(7) | 31.9(1) | 46.2(3) | ||||
High structural similarity
As a second control, the sequence-similarity constraint was removed to generate a larger subset of 494 (all) non-identical protein chains (36,983 unique pairs) with less than 5 Å structural RMSD. Using this structural criterion, each chain was paired with an average of 150 ± 70 others. The results of this analysis are shown in Table 3 (“Str” group). When the constraint of high sequence identity was removed, both Carbo and MACT scores were relatively non-discriminating.
Significant similarity scores – all chains
Subsets of “significant” similarity scores were generated from pairs of non-identical chains with p-values less than or equal to 0.05.
For Carbo scores, this criterion resulted in a set of 452 unique protein chains with 5,117 significant pairs. The average structural RMSD was (3.50±0.02) and sequence identity (%) was (1.99±0.02)×101. MACT scores for this group are presented in Table 3 (group “Carbo Sig”). Each of the chains in the subset was assigned GO, EC, and ChEBI classes based on its partners' low p-value values. The unions of these assignments were taken as “predictions” of the true GO, EC, and ChEBI classes of the chain. Each predicted class was also assigned a probability p based on the frequency of the class assignment in the database; classes with larger frequencies have greater chances of spurious association. The results of predictions with p < 0.05 are given in Table 4 (“Carbo Sig”). The accuracy of each prediction was assessed by the size of the intersection between the predicted classes and the actual assignments. The false positive rate was defined as α = 1−m/N and the coverage rate was defined as β = n/N, where m is the number of predictions, n the size of the intersection, and N the number of actual classes. False positive and coverage rates are shown in Table 4 (“Carbo Sig”). Carbo-based predictions resulted in a fairly high false positive rate for all assignments; however, the predictions also had a high coverage, indicating the answer was usually in the predicted results.
Table 4.
Functional prediction (based on the EC, GO, and ChEBI classification schemes described in the text) performance for subset comparisons: SeqStr, protein chains with greater than 60% sequence identity and less than 5 Å RMSD upon structural alignment; Str, non-identical protein chains with less than 5 Å structural RMSD; Carbo Sig, pairs with Carbo score p-values less than or equal to 0.05; MACT Sig, pairs with MACT score p-values less than or equal to 0.05; Carbo SigLow, proteins in the Carbo Sig set with structural RMSD greater than 4.0 Å and sequence identity less than 60%; MACT SigLow, proteins in the Carbo Sig set with structural RMSD greater than 4.0 Å and sequence identity less than 60%.
| Carbo Sig | MACT Sig | Carbo SigLow | MACT SigLow | ||
|---|---|---|---|---|---|
| ChEBI | Predicted | 11 ± 9 | 11 ± 6 | 9 ± 8 | 9 ± 5 |
| True | 3 ± 2 | 2 ± 1 | 2 ± 1 | 2 ± 1 | |
| False positive | 0.7 | 0.8 | 0.8 | 0.8 | |
| Coverage | 1 | 0.5 | 0.5 | 0.5 | |
| EC | Predicted | 4 ± 4 | 4 ± 3 | 4 ± 4 | 4 ± 3 |
| True | 0.5 ± 0.5 | 0.5 ± 0.5 | 0.6 ± 0.5 | 0.6 ± 0.5 | |
| False positive | 0.8 | 0.9 | 0.9 | 0.9 | |
| Coverage | 1 | 1 | 0.5 | 0.5 | |
| GO | Predicted | 6 ± 4 | 6 ± 3 | 4 ± 4 | 5 ± 3 |
| True | 1 ± 1 | 1 ± 1 | 1 ± 1 | 1 ± 1 | |
| False positive | 0.8 | 0.8 | 0.8 | 0.8 | |
| Coverage | 1 | 1 | 0.4 | 0.6 |
For MACT scores, the significant similarity scores criterion resulted in a set of 474 unique protein chains with 5,352 significant pairs. Average pair-wise values for these significant pairs included: structural RMSD (5.18±0.03) and sequence identity (%) (1.252±0.002)×101. Carbo scores for this group are presented in Table 3 (group “MACT Sig”). As described above, each of the chains in the subset of significant MACT scores were assigned GO, EC, and ChEBI classes. The predictions, true assignments, false positive rates, and coverage values are given in Table 4 (group “MACT Sig”). As with the Carbo-based predictions, this method generally obtained the correct result; albeit with a high false positive rate.
Note that the information in Table 4 cannot be directly compared with scatter plots of Z-scores in Figure 2. In particular, Table 4 compares Carbo and MACT classification for subsets of protein pairs with known E.C., GO, or ChEBI classifications while Figure 2 compares Carbo and MACT scores for all possible pairs of proteins. In particular, Figure 2 demonstrates the strong correlation of Carbo scores with RMSD and sequence identity but does not indicate the fidelity of matching by either algorithm.
Significant similarity scores – low sequence and structure identity
The previous analysis demonstrated that low p-value Carbo and MACT scores could accurately reproduce E.C., GO, and ChEBI classification. However, it should be noted that such classification could have probably been determined without electrostatic analysis through sequence analysis via Pfam [7], PSI-BLAST [1], etc. or structural analysis via services such as CE [49], SCOP [25], or CATH [45]. Therefore, it is important to assess the ability of the Carbo and MACT electrostatic analyses to classify the properties of the protein chains in the absence of significant sequence or structure identity. As such, we defined subsets of “significant” similarity scores with p-values less than or equal to 0.05 and further filtered these subsets to include only chains with structural RMSD greater than 4.0 Å and sequence identity less than 60%.
For Carbo scores, this criterion resulted in a set of 298 protein chains with 974 unique pairs. Average pair-wise values for these significant pairs included: structural RMSD (6.25±0.02) and sequence identity (%) (7.42±0.02). MACT scores for this group are presented in Table 3 (group “Carbo SigLow”). As described above, each of the chains in the subset of significant MACT scores were assigned “predicted” functional classes. These predictions, true assignments, false positive rates, and coverage values are given in Table 4 (group “Carbo SigLow”). This group showed a high false positive rate while only capturing 40-50% of the true assignments in the predictions.
For MACT scores, this criterion resulted in a set of 462 protein chains in 2,875 unique pairs. The large increase over the Carbo set is due to the lack of structural alignment as a step in the MACT analysis. Average pair-wise values for these significant pairs included: structural RMSD (6.853±0.006) and sequence identity (%) (6.73±0.08). Carbo scores for this group are presented in Table 3 (group “MACT SigLow”). As described above, each of the chains in the subset of significant MACT scores were assigned “predicted” functional classes. These predictions, true assignments, false positive rates, and coverage values are given in Table 4 (group “MACT SigLow”). Like the Carbo method, this group showed a high false positive rate while only capturing 40-60% of the true assignments in the predictions.
Discussion and Conclusions
The above results demonstrate that MACT similarity metrics provide a complement to Carbo similarity methods and show potential for future work comparing biomolecules with very different structures where existing structural alignment methods may be insufficient. While both methods have very different overall dependences on structural RMSD and sequence identity, they were both sufficient to cluster protein chains into functionally-relevant groups. Furthermore, analysis of chains with statistically-significant similarity scores revealed pairings which had a number of functional attributes (GO, E.C., and ChEBI IDs) in common.
However, MACT methods provide two very important benefits which are not available with the Carbo methods. First, the MACT method is affine-invariant – it does not require the structural alignment of biomolecules before electrostatic comparison. Second, as a related benefit, MACT methods can potentially match electrostatic potentials at a local level – as such, they can detect locally-similar electrostatic motifs in the absence of global similarity. These aspects of the MACT method suggest future work detecting electrostatic motifs across structurally-diverse protein families; e.g. resolving ligand binding sites and other electrostatic features shared by proteins with different global structural characteristics.
We have described the initial application of MACT methods to demonstrate the ability of these new methods to correctly cluster protein chains based on electrostatic and biomolecular surface properties without the need for prior structural alignment. The goal of this initial work was to demonstrate that these methods could provide a level of robustness equivalent to traditional Carbo or Hodgkin measures for comparison of electrostatic properties for biomolecules with very different structures. While the current results of MACT methods were obtained in regions near the biomolecular surface defined by solvent accessibility functions, we are also implementing new algorithms to automatically construct volumetric functions representing potential binding sites (e.g., pockets). We shall continue to explore ways to further improve the results by using these pocket functions to specifically compare the electrostatic potential and other features at binding sites. Furthermore, there are numerous possibilities for other applications of this pattern recognition methodology, including automated identification of ligand binding sites and incorporation of this information into docking algorithms.
Acknowledgments
The authors would like to thank Andy McCammon and Phil Bourne for their support, useful discussions, and advice in the initial stages of this work. The authors additionally acknowledge helpful discussions with Dr. Cameron Mura, and the data presentation help provided by Rido Park (RP), Bong-Soo Sohn (BSS) and Zaiqing Xu (ZX). The research of CLB, BK, and XZ at the Center for Computational Visualization, University of Texas, was supported in part by NSF grants ITR-ACI-022003, ITR-EIA-0325550, grants from NIH 0P20 RR020647, 1 R01 GM074258-021, and a subcontract from UCSD 1018140 as part of the NSF-NPACI project (Molecular Sciences Thrust). NAB and TJD were supported by the NIH (GM069702), Alfred P. Sloan Foundation, the NSF-NPACI project (Molecular Sciences Thrust) and the National Biomedical Computation Resource (NIH RR08605).
Appendix
This appendix describes the MACT matching algorithm used in this paper. Interested readers may refer to [58] for more details. The major steps of the algorithm are outlined below.
1. Compute a contour tree (CT) for volumetric functions representing molecular shapes, e.g. solvent accessibility functions
The contour tree (CT) [32, 14] was introduced to find the connected contours of level sets of volumetric functions. The topology of a level set changes only at the critical points of the function. The CT captures these topological changes of the level sets for the entire range of the function of interest. Each node of the CT corresponds to a critical point of the function and each arc corresponds to a contour class connecting two critical points. A cut on an arc (v1,v2) of the tree by an isovalue v1 ≤ w ≤ v2 corresponds to a connected contour of the level set L(w). Due to the large number of critical points in biomolecular solvent accessibility and electrostatic potential functions, CTs are usually too complex to be compared directly.
2. Construct the finest level dual contour tree (DCT) from the CT in Step 1
A dual contour tree (DCT) can be constructed by partitioning arcs of a CT into sets of connected segments, each of which corresponds to a connected interval volume of the function domain. These interval volumes represent regions of the domain where the function values lie between two specific isovalues. The distribution of the connected interval volumes contains important topological information about the original function. Each connected interval volume becomes a node in a DCT and two nodes are connected by an edge if the corresponding interval volumes are adjacent (sharing the same contour at their boundaries). A DCT can be constructed from a given CT as following:
Divide the functional range [fmin, fmax] of a scalar function f into N intervals, which cut the CT arcs into segments in N ranges.
For all cut arc segments of CT in range i (1 ≤ i ≤ N), we use a Union Find data structure to assign them into disconnected sets. Each set of connected arc segments becomes a node of DCT at level i.
If there exists in a node n at level i, one arc segment that is connected to that of another DCT node m at level i − 1, a DCT edge is insert between n and m.
The DCT provides a simpler representation of the original function than the CT by eliminating small undulations in the function while preserving potentially-significant features like high mounds and deep pits are preserved in the DCT. Additionally, analysis can be focused on the important regions of molecular structures by restricting the DCT to a smaller functional range of particular interest, e.g. solvent-accessible regions near the surfaces of biomolecules.
3. Compute the geometrical, topological, and functional attributes for the nodes in the DCT
In order to quantitatively measure the similarities of DCTs, we define some geometrical, topological, and functional attributes for the DCT nodes. The function (e.g., solvent accessibility) used to represent the molecule shapes and construct the DCT is called shape function. Additional volumetric functions, such as electrostatic potentials, can be treated as properties defined on the shapes and used for computing functional attributes of the DCT nodes. Each node m of the DCT is assigned a set of attributes based on the geometry and topology of its corresponding connected interval volume: the normalized size of the interval volume, V(m); the principal values of the moments of inertia of the interval volume, I(m); and the Betti numbers [23] of the interval volume boundaries, B(m). Additionally, the interval volume is then used to compute additional electrostatic potential attributes for the DCT, namely the local potential monopole P(m); dipole (m); and quadrupole moments Q(m).
4. Build a multi-resolution hierarchy of the attributed dual contour tree (MACT) by merging adjacent functional intervals
In order to facilitate the comparison of attributed DCTs, they can be further organized in a hierarchical multi-resolution form. This Multi-resolution Attributed Contour Tree (MACT) is constructed from a fine DCT by merging its adjacent functional intervals. Without loss of generality, we assume that the finest DCT D has N = 2k intervals. The DCT at the next coarser resolution would have N / 2 intervals, each of which is merged from two of the finer DCT. A set S of connected DCT nodes in the two combined intervals are merged into a single node n in the coarser DCT. This can be achieved again by using a “Union Find” data structure [31]. The node n is called the parent of nodes in the set S, which are the children of n. The merging process can be recursively applied to the coarser DCTs until there is only a single interval spanning the entire functional range under consideration. If a DCT is constructed using a restricted functional range, there may be multiple nodes even in the coarsest DCT because the regions of interest may have many disconnected components. However, most of those nodes are very small in size and can often be pruned as noise. The attributes of a node in the coarser level of the hierarchy can be easily evaluated from the attributes of its children.
5. Match two MACTs and compute their similarity score
The MACT matching algorithm is applied from the coarsest to the finest level of the hierarchies, where we assume that the MACTs to be compared have the same number of levels. The matching algorithm attempts to find the maximal set of matched MACT node pairs between two MACTs M and M′. The MACT nodes m ∈ M and n ∈ M′ of a matched pair must satisfy following conditions:
The nodes m and n don't belong to any other pairs.
m and n must belong to the DCTs of the same resolution, i.e. m ∈ Di ⊂ M and n ∈ D′i ⊂ M′, where Di and D′i have the same number of functional intervals.
m and n must belong to the same functional interval of Di and D′i.
The parents p(m) of m and p(n) of n are also a matched pair (p(m), p(n)) in the coarser DCTs. The only exception is level 0, at which nodes have no parents.
We use a greedy algorithm to find the maximal set of matched node pairs, starting from level 0 of the hierarchies. The steps to match the DCT Di { M and { M′ at resolution level i (i = 0,…,k) are as follows:
Add all nodes of the DCT Di into a priority queue Q, in which the nodes are ranked by their volumes.
Remove the node m with the highest priority from Q. Search for the best matched node n from possible candidates in the other DCT , constrained by the conditions mentioned above. The best match should have the highest score similarity 〈m,n〉 (defined below) weighted by their average volumes.
If a node n is found, the pair (m,n) is added to the set of matched pairs at resolution level i and n is also removed from future consideration.
Repeat step 2 and 3 until the queue Q is empty or no more candidates in D′i.
Calculate the similarity score 〈Di, 〉 by using the pairs of matched nodes in level i.
Repeat the steps 1 to 5 from level i = 0 to k. Calculate the similarity score 〈M,M′〉 as the similarity score of two biomolecules.
For two nodes m and n in a matched pair, the similarity score is the weighted average of the similarities of individual attributes defined before:
where the weights satisfying 0 ≤ wi ≤ 1 and wi = 1 control the relative importance of different attributes for comparison. As expected, the maximum similarity score between two nodes is 1, which is achieved when they have exactly the same attributes. Additionally, the similarity score can also become negative when opposite electrostatic potential moments are encountered. In this work, the weights were estimated by maximizing MACT scores for pairs of similar proteins (members of the same family and/or different X-ray structures) in a small subset of 20 proteins. Specifically, the weights were chosen to maximize the ratio of the total similarity scores of sample pairs within the same families to that of different families. The results presented in this paper were calculated with weights w1 = 0.03, w2 = 0.08, w3 = 0.21, w4 = 0.44, w5 = 0.1, and w6 = 0.14, where the electrostatic weights (w4, w5, w6) dominate the overall metric.
The individual terms in the equation above are computed as follows:
: the similarity score of the volumes.
: the similarity of the Betti numbers of lower and upper boundaries.
: the similarity of the moment of inertia.
: the similarity of the integrals of properties.
: the similarity of the dipole moments.
: the similarity of the quadrupole moments.
The maximum similarity score between two nodes is 1, which is achieved when they have exactly the same attributes. Additionally, the similarity score may also become negative when opposite electrostatic potential moments are encountered. The similarity score between the DCTs D and D′ is computed as weighted average of scores of matched node pairs:
where (mi,ni), mi ∈ D and ni ∈ D′ is a matched pair and the weights are the sum of their normalized volumes. As a result of this weighting, larger interval volumes have bigger contributions to the score. The similarity between MACTs M and M′ is evaluated as the average of the similarity scores of DCTs from resolution level 1 to k:
The similarity score 〈M,M′〉, which clearly satisfies 〈M,M′〉 ≤ 1, is used to measure the similarity between the molecular structures with properties and compute the results presented in this paper.
Footnotes
Defined for the purposes of this work as pairs with greater than 98% sequence identity or less than 1 Å RMSD
AMS classification: 92E10 (Molecular structure), 78M20 (Finite difference methods), 35Q60 (Equations of electromagnetic theory), 68U99 (Computing methods)
Contributor Information
Xiaoyu Zhang, Department of Computer Science, California State University San Marcos, 333 S. Twin Oaks Valley Road, San Marcos, CA 92096. Phone: (760) 750-4187, Fax: (760) 750-3439, E-mail: xiaoyu@csusm.edu.
Chandrajit L. Bajaj, Center for Computational Visualization, Department of Computer Sciences, Institute of Computational Engineering and Sciences, University of Texas at Austin, 201 East 24th Street, ACES 2.324A, 1 University Station, C0200, Austin, TX 78712. Phone: (512) 471-8870, Fax: (512) 471-0982, E-mail: bajaj@cs.utexas.edu
Bongjune Kwon, Center for Computational Visualization, Department of Computer Sciences, Institute of Computational Engineering and Sciences, University of Texas at Austin, 201 East 24th Street, ACES 2.324A, 1 University Station, C0200, Austin, TX 78712. Phone: (512) 471-8870, Fax: (512) 471-0982, E-mail: junenim@cs.utexas.edu.
Todd J. Dolinsky, Center for Computational Biology, Department of Biochemistry and Molecular Biophysics, Washington University in St. Louis, 700 S. Euclid Ave., Campus Box 8036, St. Louis, MO 63110. Phone: (314) 362-2017, Fax: (314) 362-0234, E-mail: todd@ccb.wustl.edu
Jens E. Nielsen, School of Biomolecular and Biomedical Science, Centre for Synthesis and Chemical Biology, Conway Institute, University College Dublin, Belfield, Dublin 4, Ireland, Phone: +353 1 716 6724, Fax: +353 1 283 7211, E-mail: Jens.Nielsen@ucd.ie
Nathan A. Baker, Center for Computational Biology, Department of Biochemistry and Molecular Biophysics, Washington University in St. Louis, 700 S. Euclid Ave., Campus Box 8036, St. Louis, MO 63110. Phone: (314) 362-2040, Fax: (314) 362-0234, Web: http://agave.wustl.edu/, E-mail: baker@biochem.wustl.edu
Literature Cited
- 1.Altschul SF, Madden TL, Schaffer AA, Zhang J, Zhang Z, Miller W, Lipman DJ. Gapped BLAST and PSI-BLAST: a new generation of protein database search programs. Nucleic Acids Res. 1997;25:3389–402. doi: 10.1093/nar/25.17.3389. [DOI] [PMC free article] [PubMed] [Google Scholar]
- 2.Apweiler R, Bairoch A, Wu CH, Barker WC, Boeckmann B, Ferro S, Gasteiger E, Huang H, Lopez R, Magrane M, Martin MJ, Natale DA, O'Donovan C, Redaschi N, Yeh LSL. UniProt: the Universal Protein knowledgebase. Nucleic Acids Research. 2004;32:D115–D119. doi: 10.1093/nar/gkh131. [DOI] [PMC free article] [PubMed] [Google Scholar]
- 3.Bajaj C, Pasucci V, Schikore D. The contour spectrum. Proceedings of the 1997 IEEE Visualization Conference; 1997. [Google Scholar]
- 4.Baker NA. Poisson-Boltzmann Methods for Biomolecular Electrostatics. Methods in Enzymology. 2004;383:94–118. doi: 10.1016/S0076-6879(04)83005-2. [DOI] [PubMed] [Google Scholar]
- 5.Baker NA, Sept D, Joseph S, Holst MJ, McCammon JA. Electrostatics of nanosystems: Application to microtubules and the ribosome. Proceedings of the National Academy of Sciences of the United States of America; 2001. pp. 10037–10041. [DOI] [PMC free article] [PubMed] [Google Scholar]
- 6.Bate P, Warwicker J. Enzyme/Non-enzyme Discrimination and Prediction of Enzyme Active Site Location Using Charge-based Methods. Journal of Molecular Biology. 2004;340:263–76. doi: 10.1016/j.jmb.2004.04.070. [DOI] [PubMed] [Google Scholar]
- 7.Bateman A, Coin L, Durbin R, Finn RD, Hollich V, Griffiths-Jones S, Khanna A, Marshall M, Moxon S, Sonnhammer EL, Studholme DJ, Yeats C, Eddy SR. The Pfam protein families database. Nucleic Acids Res. 2004;32:D138–41. doi: 10.1093/nar/gkh121. [DOI] [PMC free article] [PubMed] [Google Scholar]
- 8.Blomberg N, Gabdoulline RR, Nilges M, Wade RC. Classification of protein sequences by homology modeling and quantitative analysis of electrostatic similarity. Proteins-Structure Function and Genetics. 1999;37:379–387. doi: 10.1002/(sici)1097-0134(19991115)37:3<379::aid-prot6>3.0.co;2-k. [DOI] [PubMed] [Google Scholar]
- 9.Botti SA, Felder CE, Sussman JL, Silman I. Electrotactins: a class of adhesion proteins with conserved electrostatic and structural motifs. Protein Eng. 1998;11:415–20. doi: 10.1093/protein/11.6.415. [DOI] [PubMed] [Google Scholar]
- 10.Bourne PE, Shindyalov IN. A database of pairwise aligned 3-D structures for the acetylcholinesterases, lipases and other homologous proteins. In: Doctor DP, Quinn DM, Rotundo RL, Taylor P, editors. Proceedings of AChE-98; New York: Plenum Press; 1998. pp. 455–460. [Google Scholar]
- 11.Bourne PE, Shindyalov IN. Structure comparison and alignment. In: Bourne PE, Weissig H, editors. Structural Bioinformatics. John Wiley & Sons, Inc.; Hoboken, NJ: 2003. pp. 321–37. [PubMed] [Google Scholar]
- 12.Burt C, Richards WG, Huxley P. The application of molecular similarity calculations. Journal of Computational Chemistry. 1990;11:1139–46. [Google Scholar]
- 13.Carbo R, Leyda L, Arnau M. How similar is a molecule to another? An electron density measure of similarity between two molecular structures. International Journal of Quantum Chemistry. 1980;17:1185–9. [Google Scholar]
- 14.Carr H, Snoeyink J, Axen U. Computing contour trees in all dimensions, SODA 2000. 2000:918–926. [Google Scholar]
- 15.Chandonia JM, Hon G, Walker NS, Lo Conte L, Koehl P, Levitt M, Brenner SE. The ASTRAL Compendium in 2004. Nucleic Acids Research. 2004;32:D189–D192. doi: 10.1093/nar/gkh034. [DOI] [PMC free article] [PubMed] [Google Scholar]
- 16.Dolinsky TJ, Nielsen JE, McCammon JA, Baker NA. PDB2PQR: an automated pipeline for the setup, execution, and analysis of Poisson-Boltzmann electrostatics calculations. Nucleic Acids Research. 2004;32:W665–W667. doi: 10.1093/nar/gkh381. [DOI] [PMC free article] [PubMed] [Google Scholar]
- 17.Durbin R, Eddy S, Krogh A, Mitchinson G. Biological Sequence Analysis: Probabilistic Models of Proteins and Nucleic Acids. Cambridge University Press; New York: 1998. [Google Scholar]
- 18.Elcock AH. Prediction of functionally important residues based solely on the computed energetics of protein structure. Journal of Molecular Biology. 2001;312:885–896. doi: 10.1006/jmbi.2001.5009. [DOI] [PubMed] [Google Scholar]
- 19.European Bioinformatics Institute. Chemical Entitites of Biological Interest. 2005 [Google Scholar]
- 20.Ferrè F, Ausiello G, Zanzoni A, Helmer-Citterich M. SURFACE: a database of protein surface regions for functional annotation. Nucleic Acids Research. 2004;32:D240–D244. doi: 10.1093/nar/gkh054. [DOI] [PMC free article] [PubMed] [Google Scholar]
- 21.Gene Ontology Consortium. The Gene Ontology (GO) database and informatics resource. Nucleic Acids Research. 2004;32:D258–D261. doi: 10.1093/nar/gkh036. [DOI] [PMC free article] [PubMed] [Google Scholar]
- 22.Greaves R, Warwicker J. Active Site Identification through Geometry-based and Sequence Profile-based Calculations: Burial of Catalytic Clefts. Journal of Molecular Biology. 2005;394:547–57. doi: 10.1016/j.jmb.2005.04.018. [DOI] [PubMed] [Google Scholar]
- 23.Hocking JG, Young GS. Topology. Addison-Wesley Pub Co.; Reading, Mass.: 1961. [Google Scholar]
- 24.Hodgkin EE, Richards WG. Molecular similarity based on electrostatic potential and electric field. 1987:105–10. [Google Scholar]
- 25.Holm L, Sander C. Protein folds and families: sequence and structure alignments. Nucleic Acids Research. 1999;27:244–7. doi: 10.1093/nar/27.1.244. [DOI] [PMC free article] [PubMed] [Google Scholar]
- 26.Holst M, Baker N, Wang F. Adaptive multilevel finite element solution of the Poisson-Boltzmann equation I. Algorithms and examples. Journal of Computational Chemistry. 2000;21:1319–1342. [Google Scholar]
- 27.Im W, Beglov D, Roux B. Continuum solvation model: electrostatic forces from numerical solutions to the Poisson-Boltzmann equation. Computer Physics Communications. 1998;111:59–75. [Google Scholar]
- 28.Kanehisa M, Goto S, Kawashima S, Okuno Y, Hattori M. The KEGG resource for deciphering the genome. Nucleic Acids Research. 2004;32:D277–D280. doi: 10.1093/nar/gkh063. [DOI] [PMC free article] [PubMed] [Google Scholar]
- 29.Karypis G, Kumar V. A fast and high quality multilevel scheme for partitioning irregular graphs. Siam Journal on Scientific Computing. 1998;20:359–392. [Google Scholar]
- 30.Kinoshita K, Furui J, Nakamura H. Identification of proteins functions from a molecular surface database, eF-site. Journal of Structural and Functional Genomics. 2002;2:9–22. doi: 10.1023/a:1011318527094. [DOI] [PubMed] [Google Scholar]
- 31.Knuth DE. The Art of Computer Programming. Volume 1. Fundamental Algorithms. Addison-Wesley; Boston: 1997. [Google Scholar]
- 32.Kreveld MV, Oostrum RV, Bajaj C, Schikore D, Pasucci V. Contour trees and small seed sets for isosurface traversal. Proceedings: Thirteenth ACS Symposium on Computational Geometry; ACM Press; 1997. pp. 212–219. [Google Scholar]
- 33.Laskowski RA, Chistyakov VV, Thornton JM. PDBsum more: new summaries and analyses of the known 3D structures of proteins and nucleic acids. Nucleic Acids Research. 2005;33:D266–D268. doi: 10.1093/nar/gki001. [DOI] [PMC free article] [PubMed] [Google Scholar]
- 34.Lee LP, Tidor B. Optimization of binding electrostatics: Charge complementarity in the barnase-barstar protein complex. Protein Science. 2001;10:362–377. doi: 10.1110/ps.40001. [DOI] [PMC free article] [PubMed] [Google Scholar]
- 35.Livesay DR, Jambeck P, Rojnuckarin A, Subramaniam S. Conservation of Electrostatic Properties within Enzyme Families and Superfamilies. Biochemistry. 2003;42:3464–3473. doi: 10.1021/bi026918f. [DOI] [PubMed] [Google Scholar]
- 36.Lo Conte L, Chothia C, Janin J. The atomic structure of protein-protein recognition sites. J Mol Biol. 1999;285:2177–98. doi: 10.1006/jmbi.1998.2439. [DOI] [PubMed] [Google Scholar]
- 37.Ma B, Elkayam T, Wolfson H, Nussinov R. Protein-protein interactions: Structurally conserved residues distinguish between binding sites and exposed protein surfaces. Proceedings of the National Academy of Sciences of the United States of America; 2003. pp. 5772–7. [DOI] [PMC free article] [PubMed] [Google Scholar]
- 38.McCoy AJ, Chandana Epa V, Colman PM. Electrostatic complementarity at protein/protein interfaces. J Mol Biol. 1997;268:570–84. doi: 10.1006/jmbi.1997.0987. [DOI] [PubMed] [Google Scholar]
- 39.Mulder NJ, Apweiler R, Attwood TK, Bairoch A, Barrell D, Bateman A, Binns D, Biswas M, Bradley P, Bork P, Bucher P, Copley RR, Courcelle E, Das U, Durbin R, Falquet L, Fleischmann W, Griffiths-Jones S, Haft D, Harte N, Hulo N, Kahn D, Kanapin A, Krestyaninova M, Lopez R, Letunic I, Lonsdale D, Silventoinen V, Orchard SE, Pagni M, Peyruc D, Ponting CP, Selengut JD, Servant F, Sigrist CJ, Vaughan R, Zdobnov EM. The InterPro Database, 2003 brings increased coverage and new features. Nucleic Acids Res. 2003;31:315–8. doi: 10.1093/nar/gkg046. [DOI] [PMC free article] [PubMed] [Google Scholar]
- 40.Murray D, Honig B. Electrostatic control of the membrane targeting of C2 domains. Molecular Cell. 2002;9:145–154. doi: 10.1016/s1097-2765(01)00426-9. [DOI] [PubMed] [Google Scholar]
- 41.Nielsen JE, Andersen KV, Honig B, Hooft RWW, Klebe G, Vriend G, Wade RC. Improving macromolecular electrostatics calculations. Protein Engineering. 1999;12:657–662. doi: 10.1093/protein/12.8.657. [DOI] [PubMed] [Google Scholar]
- 42.Nomenclature Committee of the International Union of Biochemistry and Molecular Biology (NC-IUBMB) Enzyme Supplement 5. FEBS Journal. 1999;264:610–50. [PubMed] [Google Scholar]
- 43.Novotny J, Sharp K. Electrostatic fields in antibodies and antibody/antigen complexes. Prog Biophys Mol Biol. 1992;58:203–24. doi: 10.1016/0079-6107(92)90006-r. [DOI] [PubMed] [Google Scholar]
- 44.Ondrechen MJ, Clifton JG, Ringe D. THEMATICS: a simple computational predictor of enzyme function from structure. Proc Natl Acad Sci U S A. 2001;98:12473–8. doi: 10.1073/pnas.211436698. [DOI] [PMC free article] [PubMed] [Google Scholar]
- 45.Orengo CA, Michie AD, Jones S, Jones DT, Swindells MB, Thornton JM. CATH--a hierarchic classification of protein domain structures. Structure. 1997;5:1093–108. doi: 10.1016/s0969-2126(97)00260-8. [DOI] [PubMed] [Google Scholar]
- 46.Richard AM. Quantitative comparison of molecular electrostatic potentials for structure-activity studies. Journal of Computational Chemistry. 1991;12:959–69. [Google Scholar]
- 47.Roberts VA, Freeman HC, Olson AJ, Tainer JA, Getzoff ED. Electrostatic orientation of the electron-transfer complex between plastocyanin and cytochrome c. Journal of Biological Chemistry. 1991;266:13431–41. [PubMed] [Google Scholar]
- 48.Shindyalov IN, Bourne PE. An alternative view of protein fold space. Proteins. 2000;38:247–60. [PubMed] [Google Scholar]
- 49.Shindyalov IN, Bourne PE. Protein structure alignment by incremental combinatorial extension (CE) of the optimal path. Protein Eng. 1998;11:739–47. doi: 10.1093/protein/11.9.739. [DOI] [PubMed] [Google Scholar]
- 50.Sitkoff D, Sharp KA, Honig B. Accurate Calculation of Hydration Free Energies Using Macroscopic Solvent Models. Journal of Physical Chemistry. 1994;98:1978–1988. [Google Scholar]
- 51.Sulea T, Purisima EO. Profiling charge complementarity and selectivity for binding at the protein surface. Biophys J. 2003;84:2883–96. doi: 10.1016/S0006-3495(03)70016-2. [DOI] [PMC free article] [PubMed] [Google Scholar]
- 52.Ullmann GM, Hauswald M, Jensen A, Knapp EW. Structural alignment of ferredoxin and flavodoxin based on electrostatic potentials: Implications for their interactions with photosystem I and ferredoxin-NADP reductase. Proteins. 2000;38:301–9. [PubMed] [Google Scholar]
- 53.Wade RC, Gabdoulline RR, De Rienzo F. Protein interaction property similarity analysis. International Journal of Quantum Chemistry. 2001;83:122–127. [Google Scholar]
- 54.Wade RC, Gabdoulline RR, Ludemann SK, Lounnas V. Electrostatic steering and ionic tethering in enzyme-ligand binding: Insights from simulations. Proceedings of the National Academy of Sciences of the United States of America; 1998. pp. 5942–5949. [DOI] [PMC free article] [PubMed] [Google Scholar]
- 55.Watson JD, Laskowski RA, Thornton JM. Predicting protein function from sequence and structural data. Current Opinion in Structural Biology. 2005;15:275–84. doi: 10.1016/j.sbi.2005.04.003. [DOI] [PubMed] [Google Scholar]
- 56.Weisstein EW. The CRC Concise Encyclopedia of Mathematics. CRC Press LLC; New York: 1999. [Google Scholar]
- 57.Winn PJ, Religa TZ, Battey JND, Banerjee A, Wade RC. Determinants of Functionality in the Ubiquitin Conjugating Enzyme Family. Structure. 2004;12:1563–74. doi: 10.1016/j.str.2004.06.017. [DOI] [PubMed] [Google Scholar]
- 58.Zhang X, Bajaj C, Baker NA. Affine Invariant Comparison of Molecular Shapes with Properties, Computer Science Technical Report. University of Texas at Austin; Austin, TX: 2004. [Google Scholar]
- 59.Zhu ZY, Karlin S. Clusters of charged residues in protein three-dimensional structures. Proceedings of the National Academy of Sciences of the United States of America; 1996. pp. 8350–5. [DOI] [PMC free article] [PubMed] [Google Scholar]