

Abstract
The lateral posterior (LP) nucleus is a higher order thalamic nucleus that is believed to play a key role in the transmission of visual information between cortical areas. Two types of cortical terminals have been identified in higher order nuclei, large (type II) and smaller (type I), which have been proposed to drive and modulate, respectively, the response properties of thalamic cells (Sherman and Guillery [1998] Proc. Natl. Acad. Sci. U. S. A. 95:7121–7126). The aim of this study was to assess and compare the relative contribution of driver and modulator inputs to the LP nucleus that originate from the posteromedial part of the lateral suprasylvian cortex (PMLS) and area 17. To achieve this goal, the anterograde tracers biotinylated dextran amine (BDA) or Phaseolus vulgaris leucoagglutinin (PHAL) were injected into area 17 or PMLS. Results indicate that area 17 injections preferentially labelled large terminals, whereas PMLS injections preferentially labelled small terminals. A detailed analysis of PMLS terminal morphology revealed at least four categories of terminals: small type I terminals (57%), medium-sized to large singletons (30%), large terminals in arrangements of intermediate complexity (8%), and large terminals that form arrangements resembling rosettes (5%). Ultrastructural analysis and postembedding immunocytochemical staining for γ-aminobutyric acid (GABA) distinguished two types of labelled PMLS terminals: small profiles with round vesicles (RS profiles) that contacted mostly non-GABAergic dendrites outside of glomeruli and large profiles with round vesicles (RL profiles) that contacted non-GABAergic dendrites (55%) and GABAergic dendritic terminals (45%) in glomeruli. RL profiles likely include singleton, intermediate, and rosette terminals, although future studies are needed to establish definitively the relationship between light microscopic morphology and ultrastructural features. All terminals types appeared to be involved in reciprocal corticothalamocortical connections as a result of an intermingling of terminals labelled by anterograde transport and cells labelled by retrograde transport. In conclusion, our results indicate that the origin of the driver inputs reaching the LP nucleus is not restricted to the primary visual cortex and that extrastriate visual areas might also contribute to the basic organization of visual receptive fields of neurons in this higher order nucleus.
Indexing terms: thalamus, pulvinar, glomerulus, GABA, RS, RL, type I cortical terminals, type II cortical terminals, PMLS
The cat lateral posterior (LP) and pulvinar nuclei receive input from a wide array of cortical areas concerned with vision or visuomotor control. These areas include cortical areas 17, 18, 19, 20, and 21 as well as the variety of visual areas that surround the lateral suprasylvian and ectosylvian sulci (Niimi and Sprague, 1970; Jones and Powell, 1971; Berson and Graybiel, 1978, 1983; Graybiel and Berson, 1980; Robertson and Cunningham, 1981; Updyke, 1981; Tong et al., 1982; Olson and Graybiel, 1983; Raczkowski and Rosenquist, 1983; Reinoso-Suarez and Roda, 1985). However, despite the quantity of detailed information regarding these corticothalamic projections, the function of these massive inputs remains enigmatic.
The first hints of the complexity of the cortical innervation of the LP-pulvinar complex were revealed in ultrastructural studies of the monkey and the squirrel (Mathers, 1972a,b; Robson and Hall, 1977a,b; Ogren and Hendrickson, 1979). Two types of corticopulvinar terminals were observed in these studies, which used either autoradiography or degeneration techniques. One type was small, contained densely packed synaptic vesicles, and contacted small-caliber dendrites (RS profiles); the other was large, contained more loosely packed synaptic vesicles, and contacted larger-caliber dendrites in complex arrangements known as glomeruli (RL profiles). At that time, it was proposed that these terminals originated from two different types of cortical cells. However, this was not demonstrated definitively until individual axons were traced from the cortex to their thalamic targets in the rat (Bourassa and Deschênes, 1995). This study showed that large corticothalamic terminals (type II) originate from large cells in cortical layer V and that small corticothalamic terminals (type I) originate from smaller cells in layer VI. More recently, it has been demonstrated that two distinct types of excitatory postsynaptic potentials are elicited by stimulation of layer V and layer VI corticothalamic axons in LP nucleus (Li et al., 2003).
In the cat, ultrastructural studies of the corticothalamic terminals labelled from areas 17 and 18 are consistent with the idea that corticothalamic terminals originating from layers V and VI not only are morphologically distinct but target different sites within the neuropil. Tracer injections confined to areas 17 and 18 label type II corticothalamic terminals in the LP nucleus that originate from layer V cells and type I corticothalamic terminals in the dorsal lateral geniculate nucleus (dLGN) that originate from layer VI cells (Ojima et al., 1996). In the LP nucleus, area 17 corticothalamic terminals are RL profiles that participate in glomeruli (Vidnyánszky et al., 1996; Feig and Harting, 1998), whereas, in the dLGN, area 17 corticothalamic terminals are RS profiles that contact small caliber dendrites outside of glomeruli (Jones and Powell, 1969; Vidnyánszky and Hamori, 1994; Vidnyánszky et al., 1996; Erisir et al., 1997).
The recognition that corticothalamic terminals originating from layers V or VI of the striate cortex may serve different functions within the thalamus has led to a renewed interest in the cortical inputs to the LP-pulvinar complex (Rockland, 1994, 1996, 1998; Bourassa and Deschênes, 1995; Vidnyánszky et al., 1996; Anderson et al., 1998; Feig and Harting, 1998; Li et al., 2003). Because the synaptic connections of large type II corticothalamic terminals in the LP-pulvinar nucleus are similar to the synaptic connections of retinal terminals in the dLGN, it has been suggested that the type II corticothalamic terminals may provide the primary or driving input to the LP-pulvinar complex (Guillery, 1995; Rodrigo-Angulo and Reinoso-Suarez, 1995; Sherman and Guillery, 1996; Feig and Harting, 1998). Because a major target of the striate-recipient zone of the LP nucleus is area PMLS (Graybiel, 1970; Graybiel and Berson, 1980; Raczkowski and Rosenquist, 1983), it has been speculated that the corticothalamocortical circuitry of the LP nucleus may provide a route for the transfer of visual information from area 17 to extrastriate areas (Kato, 1990; Sherman and Guillery, 1996; Feig and Harting, 1998). However, insofar as extrastriate corticothalamic projections to the LP nucleus originate from both layer V and layer VI cortical cells (Abramson and Chalupa, 1985), it remains to be determined how PMLS corticothalamic terminals participate in the circuitry of the LP-pulvinar complex. If the morphology and synaptic targets of PMLS terminals are comparable to those of corticogeniculate terminals, their function may be similar; i.e., the extrastriate projections to the LP nucleus may provide feedback modulation of primary inputs from area 17. Alternatively, if the morphology and synaptic targets of PMLS corticothalamic terminals are similar to those of retinogeniculate terminals, they may provide an additional source of primary or driving input to the LP nucleus. To address this issue, we examined the morphology and synaptic targets of corticothalamic terminals labelled by the anterograde transport of neuroanatomical tracers placed within area PMLS. Part of this work was previously presented in abstract form (Bickford et al., 1998; Huppé-Gourgues et al., 2004a,b).
MATERIALS AND METHODS
Animal preparation
The protocols were approved by both the Université de Montréal comité de déontologie d’expérimentation sur les animaux and the University of Louisville Animal Care and Use Committee in accordance with the regulations of the Canadian Council for the Protection of Animals and NIH guidelines for the care and use of laboratory animals. Twelve normal pigmented adult cats were used in this study. Animals were divided into two groups: a biotinylated dextran amines (BDA) injection group for light microscopy analysis (n = 10) and a Phaseolus vulgaris leucoagglutinin (PHAL) injection group for electron microscopy analysis (n = 2). All animals received a pre-operative antiinflammatory drug (tolfédine 4% s.c. 0.1 mg/kg) and antibiotics (tribrissen 24% s.c. 0.13 ml/kg) 24 hours before surgical procedures. Twenty minutes prior to surgery, animals received atropine (0.1 mg/kg s.c.) and Atravet (0.05 mg/kg s.c.). Animals destined for the light microscopic study were anesthetized with a mixture of 60% N2O, 30% O2 supplemented with 5% isoflurane. After induction, isoflurane was reduced to 2% and the animals were intubated and placed in a stereotaxic frame. Animals destined for electron microscopic analysis were initially anesthetized with an intramuscular injection of ketamine (22 mg/kg), and intubated for gas anesthesia (0.5–1% nitrous oxide and 1–2% halothane). The cats were then placed in a stereotaxic apparatus and prepared for aseptic surgery. During all surgical procedures, animals were maintained at 38°C, and heart rate, end-tidal CO2, blood O2 saturation, and blood pressure were closely monitored. Analgesia was applied for at least 48 hours following surgery (temgesic 0.01 mg/kg bid).
Injections
Craniotomies were performed over PMLS (n = 7) cortex and area 17 (n = 3) in different animals at Horsley-Clark coordinates lateral 8 –15 and anterior 0 –7, and lateral 1–3 and posterior 4 – 6, respectively. Most injections were guided by electrophysiological recordings to ensure the positioning of the pipette into the gray matter. Injections were placed at the coordinates previously identified by electrophysiology. Borosilicate pipettes (1.5 mm external diameter) were pulled to obtain a tip of 50 –75 μm aperture for use in the light microscopy group. Volumes ranging between 0.5 and 1 μl of 5% BDA (3,000 kDa) were pressure injected with a syringe pump (Picoplus; Harvard Apparatus) at a rate of 1 μl per 10 minutes. Thirty minutes postinjection, the pipette was retracted from the injection site. A subset of injections (n = 5) was made with a 1 μl Hamilton syringe. Volumes of 0.2– 0.3 μl were injected via pressure. Acrylic bone cement was applied to seal the craniotomy, and the wounds were sutured in anatomical layers. All injection sites were verified histologically.
Animals destined for electron microscopic analysis received a 2.5% solution of PHAL dissolved in 10 mM phosphate-buffered saline (PBS; pH 7.4) delivered via ion-tophoretic injection (2.5–5 μA positive current for 20 – 40 minutes) via a glass pipette (10 –30 μm tip diameter).
Histochemistry
Light microscopy/BDA injections
Seven to ten days after the cortical injections, animals received an overdose of sodium pentobarbital (80 mg/kg) and were transcardially perfused with phosphate buffered 0.9% saline (0.1 M, pH 7.4), followed by phosphate-buffered 4% paraformaldehyde. Brains were stereotaxically blocked, removed from the cranium, postfixed overnight at 4°C, cryoprotected in 30% sucrose in 0.1 M phosphate buffer (PB; pH 7.4), and frozen until processing. Coronal sections (50 μm) were cut with a Leica cryostat and collected in PBS. A subset of five brains was not cryoprotected, and 50-μm-thick sections were cut in the coronal plane with a Leica vibratome.
Sections were then preincubated in 2.5% bovine serum albumin (BSA) and normal goat serum 2% in PBS, 0.01 M PB with 0.9% NaCl, pH 7.4, for 30 minutes, and the BDA was tagged with an avidin-biotin-peroxidase complex (ABC; Vectastain ABC Elite kit; Vector, Burlingame, CA). After buffer washes, the peroxidase was visualized with a nickel-intensified diaminobenzidine (DAB) reaction (10 –30 minutes). After PBS washes, sections were mounted on slides and dehydrated, mounted with Depex, and coverslipped for light-level examination. Adjacent sections were processed for acetylcholinesterase histochemistry for the identification of cytoarchitectonic boundaries between the lateral and the medial subdivisions of LP nucleus (Graybiel and Berson 1980). Sections were incubated for 15 hours in an aqueous solution with 50 mM sodium acetate, 4 mM copper sulfate, 16 mM glycine, 4 mM S-acetylthiocholine, and 86 μM ethroprazine (pH 5). Sections were rinsed in water and reacted for 10 minutes in a 1% aqueous solution of sodium sulfite and subsequently fixed in 4% paraformaldehyde for 8 hours. Sections were dehydrated, mounted with Depex, and cover-slipped for light-level examination.
Electron microscopy/PHAL injections
Animals in the electron microscopy group were transcardially perfused after 7 days postinjection with a solution of 2% paraformaldehyde and 1% glutaraldehyde. Brains were stereotaxically blocked, removed from the skull, and sectioned (50 μm) in the coronal plane with a Leica vibratome. A freeze-thaw procedure (Bickford and Hall, 1992) was used to increase the penetration of biotinylated anti-PHAL antibody (Vector; made in goat, diluted 1:200 in 1% NGS/PBS). After 48 hours of incubation in the anti-PHAL antibody, the sections were rinsed in PB, incubated in ABC, and reacted with DAB as described above. After PBS washes, sections were mounted on slides, dehydrated, mounted with Depex, and coverslipped for light-level examination.
Selected sections were postfixed in osmium, dehydrated in an alcohol series, and embedded in Durcupan resin (Ted Pella, Redding, CA). Ultrathin sections (approximately 0.08 μm thick) were cut on a vibratome and collected in serial order on Formvar-coated nickel slot grids. Approximately every third section was stained for the presence of γ-aminobutyric acid (GABA) by using previously reported postembedding immunocytochemical techniques (Patel and Bickford, 1997; Patel et al., 1999; Carden and Bickford, 1999). For this study, we used a rabbit polyclonal anti-GABA antibody (Sigma, St. Louis, MO) at a dilution of 1:500. The GABA antibody was tagged with a goat anti-rabbit antibody conjugated to 15-nm gold particles (Amersham, Arlington Heights, IL).
The GABA antibody is raised against a GABA-glutaraldehyde-BSA conjugate. The intensity and specificity of the antibody are therefore increased by fixation of the tissue with high concentrations of glutaraldehyde. In this study, because of the high glutaraldehyde content of the fixatives used, the GABA staining was sufficiently intense, and the background staining sufficiently low, that we were able to identify GABAergic and non-GABAergic structures via qualitative evaluation of the gold density overlying each profile.
Stereology
Serial sections from each animal were subjected to unbiased stereological evaluation. Section selection was randomly started at the caudal end of the nucleus. Subsequent sections were selected with the use of fixed intervals to obtain 10 sections per animal. The outline of each analyzed section was drawn under a ×10 objective with mapping and reconstruction software (Bioquant Novaprime). All labelled terminals in LP-pulvinar were plotted under a ×100 oil immersion objective. To obtain an unbiased size distribution of terminal boutons in LP-pulvinar, measurements were made by using an optical fractionators sampling scheme (West and Gundersen, 1990; West et al., 1991). Briefly, the entire region containing axonal terminals was systematically sampled with no fewer than 100 optical dissectors ranging between 400 and 2,500 μm2 in area and 10 μm in thickness. Care was taken to avoid sampling in the 2–3 μm immediately adjacent to the section surfaces to avoid measuring cut or damaged terminals. A rotator tool was used to estimate the volume of the terminals (Tandrup et al., 1997). Photomicrographs were taken with a digital camera (Q-Imaging, Retiga 1300) mounted on a microscope (Leica, DMR). Photomontages were made by using multiple focal planes, and single-axon reconstructions were produced with the pictures of successive sections. The contrast and brightness of the latter pictures were adjusted for uniformity, and the edge artefacts between photographs were attenuated. All these adjustments were made in Adobe Photoshop 8 for Windows.
RESULTS
Area 17 and area PMLS terminal distribution and morphology
As illustrated in Figure 1A, injection of BDA in area 17 labelled terminals in a single focus in the more ventral and caudal portions of the lateral LP nucleus, immediately medial to the dLGN and medial interlaminar nucleus. This region corresponds to the striate-recipient zone originally described by Graybiel and Berson (1980) or the LPl-1 described by Chalupa (1983). In contrast, injection of BDA in area PMLS labelled terminals in multiple zones within the LP nucleus. After area PMLS injections, a dense strip of labelled terminals was consistently found within LPl-1 (Fig. 1B). Additional patches of labelled terminals were also observed in the more rostral and lateral regions of the LP nucleus, adjacent to the pulvinar nucleus (Fig. 1B, arrows). At least some of these terminals appear to be distributed within the tectorecipient zone of the lateral LP, or LPl-2 (Chalupa and Abramson, 1989; Kelly et al., 2003). Less consistently, labelled terminals were also observed in the medial LP nucleus.
Fig. 1.
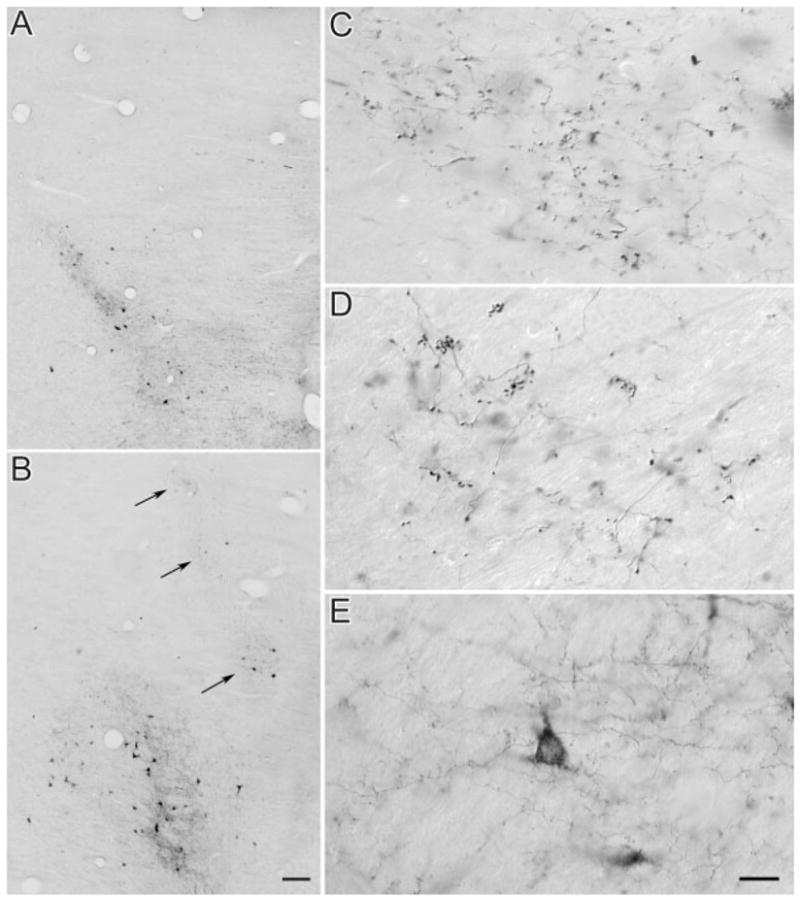
Terminal fields in the LP nucleus following injection of BDA in areas 17 and PMLS. A,C: Area 17. A: Terminals and cells are labelled in the LPl-1 region. C: Area 17 axons in the LPl-1 region give rise to large terminals that form single boutons or bouton groups of intermediate complexity. B,D,E: PMLS. B: Terminals and cells are labelled in multiple fields; a main field is located in the striate recipient LPl-1, and other smaller patches (arrows) are distributed in more dorsal, lateral, and rostral regions of the LP nucleus, possibly corresponding to the tectorecipient LPl-2. D: PMLS terminals patches (arrows in B) include groups of large boutons forming rosette-like structures, large single boutons, and bouton groupings of intermediate complexity. E: PMLS terminals in LPl-1 are mostly small terminals that are diffusely distributed. Scale bars = 100 μm in B (applies to A,B); 20 μm in E (applies to C–E).
Higher magnification photographs illustrate that terminal fields labelled by area 17 injections comprise large beaded or clustered terminals (Fig. 1C). Similar terminals are labelled in the rostral and lateral regions of the LP nucleus following area PMLS injections (Fig. 1D). In contrast, in the LPl-1 zone, most labelled axons originating from area PMLS are of small caliber and give rise to small diffusely distributed boutons that emanate from short stalks (Fig. 1E).
Classification of area PMLS corticothalamic terminal morphology
Photomicrographs were taken to classify terminals in the LP nucleus that originate from area PMLS. We divided the labelled terminals into four categories based on their size, preterminal axon morphology, and complexity of bouton groupings. The vast majority of labelled terminals in the LP nucleus were single small boutons that emanated from thin axons via short stalks (Fig. 2A). By using the nomenclature of Guillery (1966), we classified these terminals as type I. Many terminals were slightly larger than type I terminals but formed simple single terminal swellings at the end of long axonal side branches or as en passanti boutons (Fig. 2B–D). In the nomenclature of Guillery et al. (2001), these terminals were classified as singletons. Two larger terminal types formed more complex endings. The first exhibited the features of singletons but consisted of groupings of an average of three swellings of intermediate complexity (Fig. 2E). The second type of large terminal ending formed complex rosette-like structures composed of three or more distinct swellings (Fig. 2F). By the criteria of Guillery (1966), the large terminals that form rosettes or endings of intermediate complexity can be classified as type II terminals. The singleton terminals were more difficult to place in the type I or type II terminal categories.
Fig. 2.
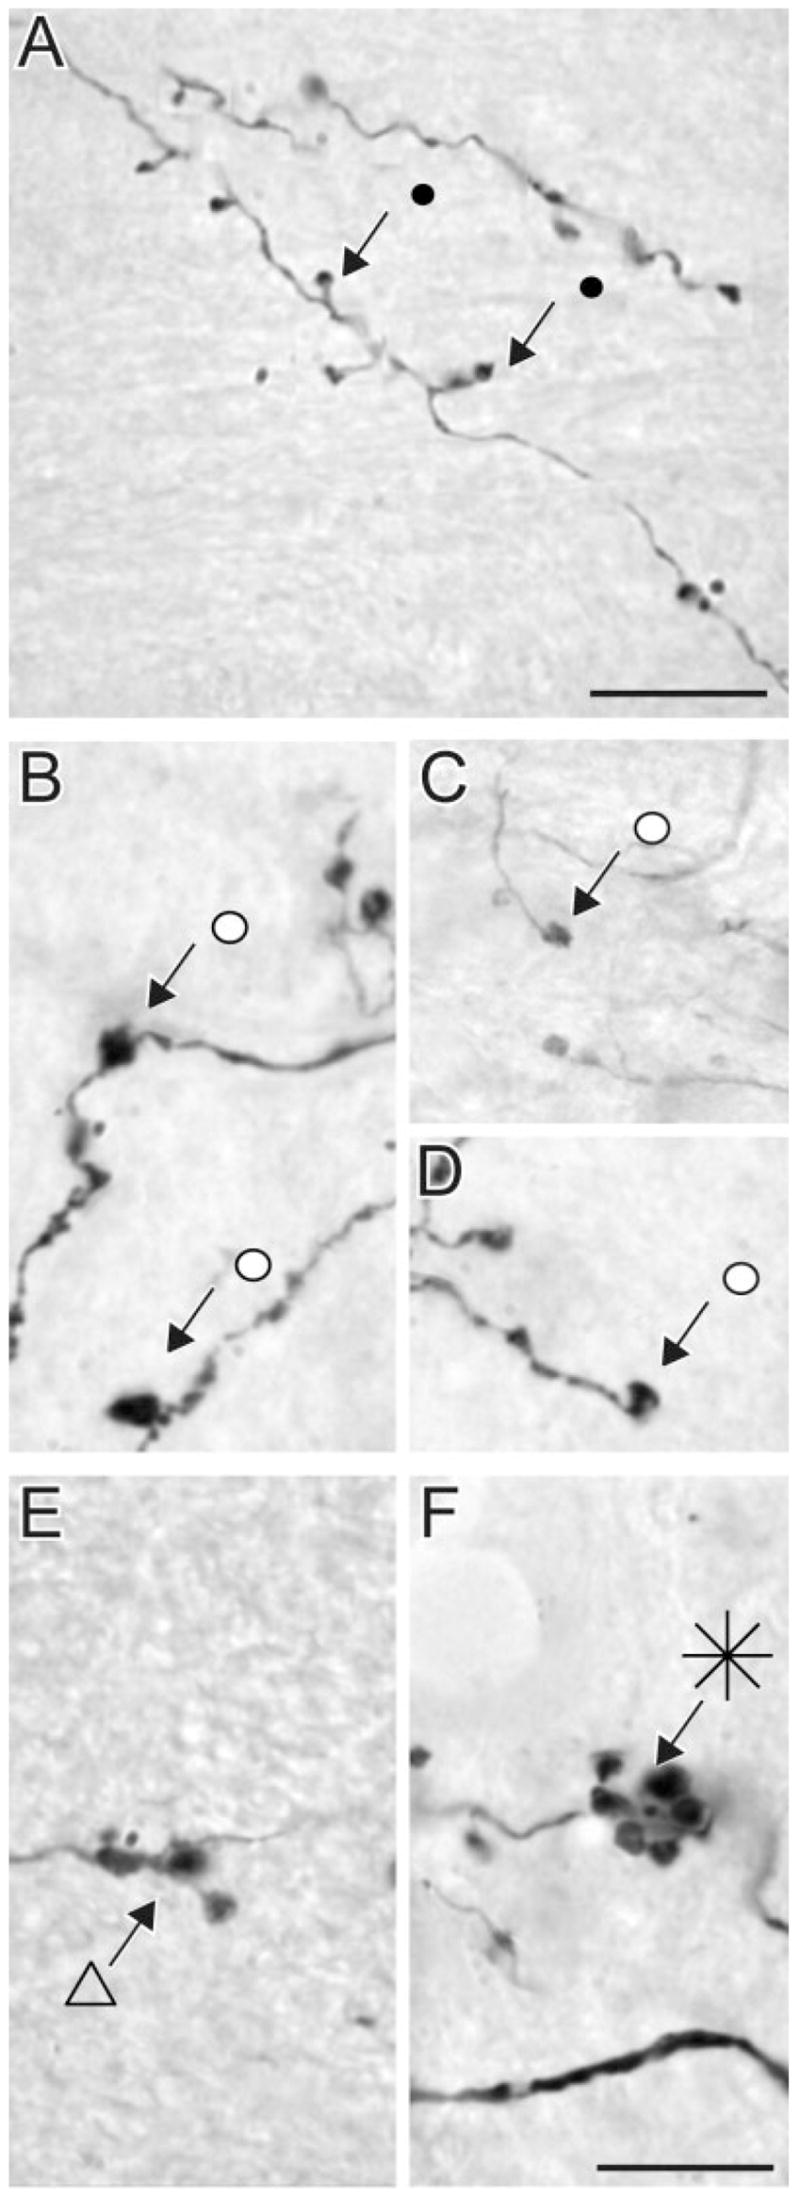
High-magnification photomicrographs of terminal types in the LPl-1 originating from area PMLS. Type I terminals area small boutons linked to small-diameter axons by short stalks (A). Singleton terminals form swellings along the axon (B) or single boutons at the end of long axon side branches (C,D). Type II terminals tend to group in clusters of endings of intermediate complexity (E) or form more complex rosette-like structures (F). Scale bars = 10 μm (applies to B–F).
Figure 3 illustrates the distribution of the different terminal types labelled following injections in area PMLS. In all cases, most labelled terminals were of type I morphology. In most cases, these terminals were too numerous to plot individually, and a dense distribution of terminals is indicated by gray shading. Singleton terminals were also quite numerous and are represented by open circles. Large (type II) terminals of intermediate complexity are represented by triangles, and rosettes are represented by asterisks. Only a few rosette endings were observed, usually only one or two per analyzed section. The general location of the LPl-2 zone, described by Chalupa et al. (1989), is indicated by arrows.
Fig. 3.

Spatial distribution of the various terminal types encountered in LP-pulvinar after a PMLS injection. A,B: Plots of terminals in two different animals with disparate injections in PMLS. The lightly shaded areas depict zones of high density of type I terminals, and the darkly shaded areas contain type I terminals plus singletons. Arrows indicate the LPl-2 subregion of the LP nucleus. Scale bars = 1 mm.
Single axon tracing
To document more carefully the morphology of axons that give rise to the different terminal types, we traced a representative sample of terminals and their preterminal axons. Small-caliber axon gave rise to sparse small terminal via short stalks (type I terminal; Fig. 4A). Many isolated axons could be followed for long lengths through the LP nucleus. These axons displayed many short side branches that gave rise to small terminals, but they rarely branched to give rise to long collaterals. Other axons were more tortuous, displayed longer terminal stalks, and were more highly branched. Clusters of terminals of intermediate complexity (type II), illustrated in Figure 4B, were found to arise from the ends of single axons. As illustrated in Figure 4C, single axons could give rise to multiple complex rosettes (type II). Singletons, illustrated in Figure 5, presented a variety of forms but generally arose as single boutons at the end of long axon branches. Multiple singletons can originate from a single axon (Fig. 5B,C). In all reconstruction cases, only one terminal type was present on a given axon.
Fig. 4.
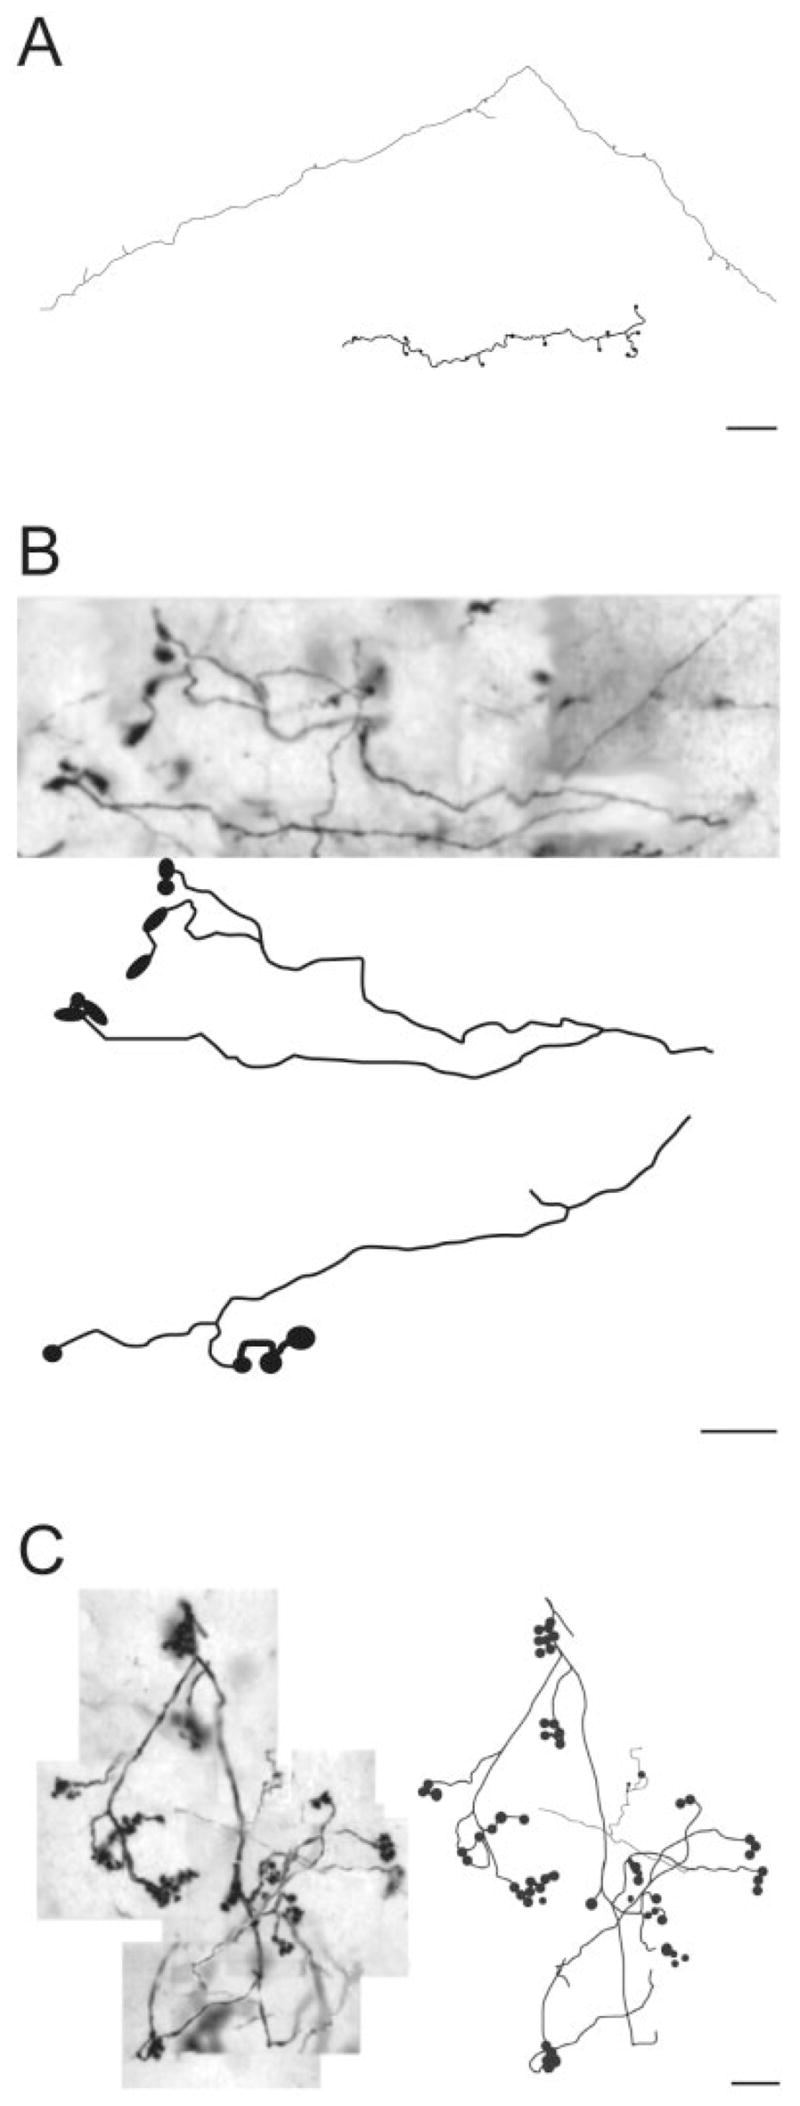
Drawings illustrate examples of the different categories of PMLS terminals observed in the LP nucleus. A: Type I terminals. B: Large terminals of intermediate complexity. C: Groups of large terminals that form rosette-like endings. Scale bars = 20 μm in A; 10 μm in B,C.
Fig. 5.
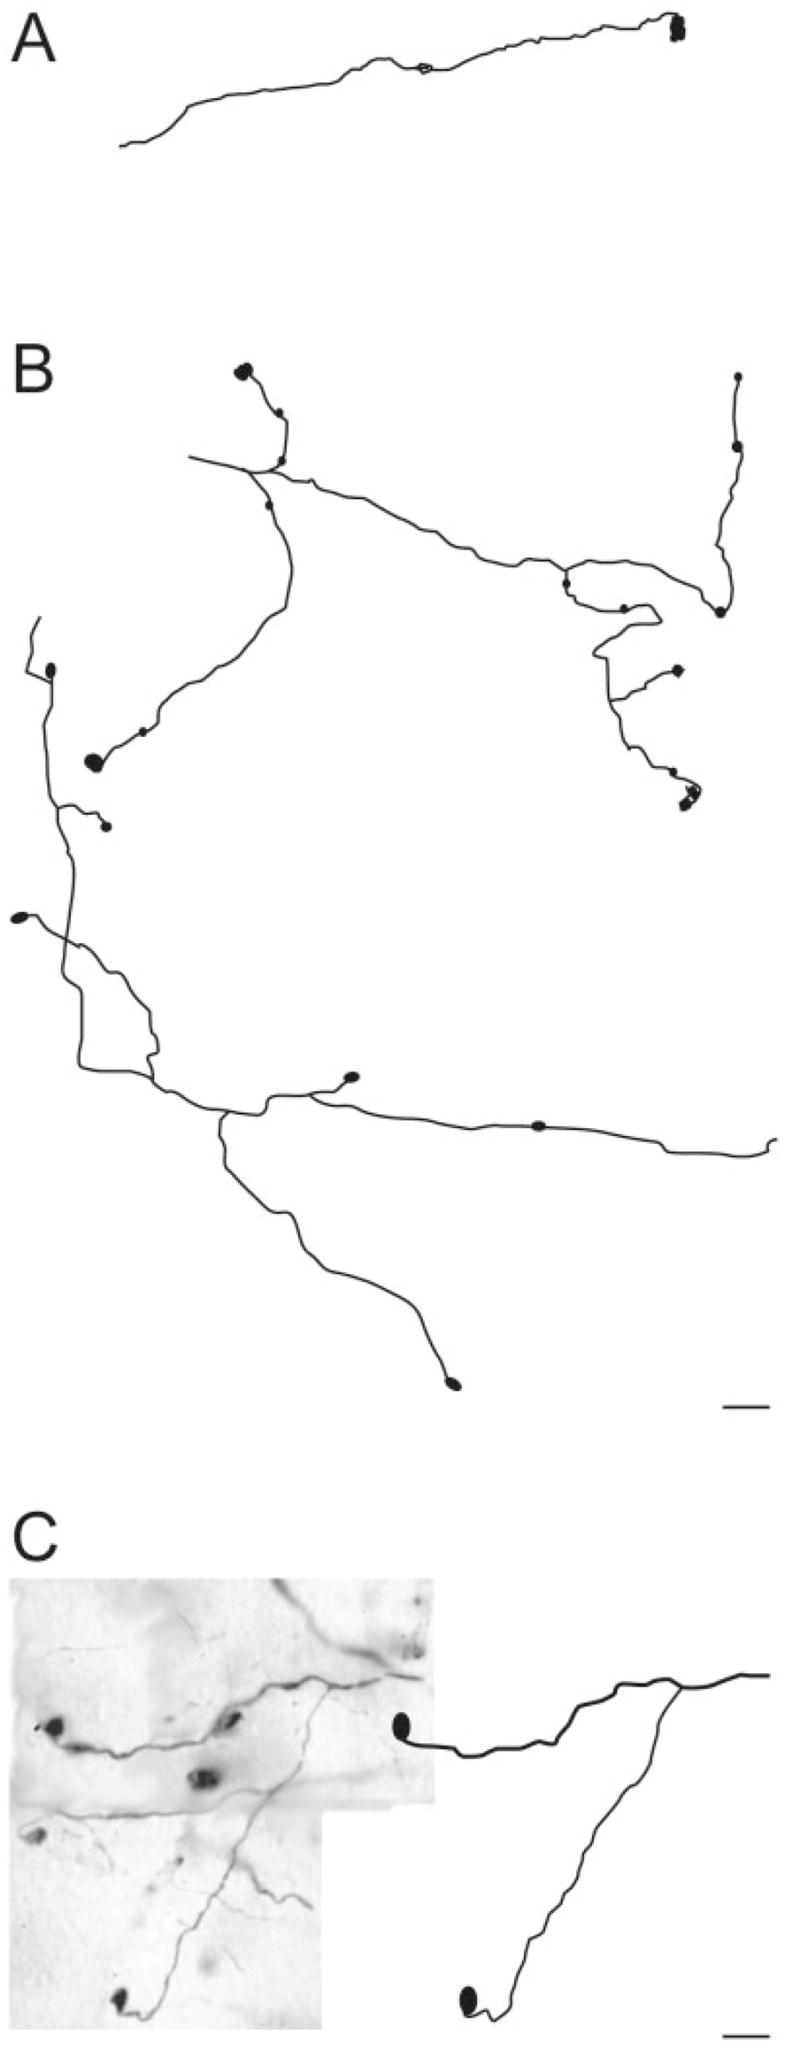
Drawings illustrate examples of PMLS terminals categorized as singletons. A: A single bouton at the end of a long stalk of over 150 μm. B: A single axon can have multiple long stalks on which singleton endings are observed. C: Singleton terminals can arise from axonal collaterals of different diameters. Scale bars = 10 μm in B (applies to A,B); 10 μm in C.
Quantitative analysis
To quantify the four categories of PMLS terminals described above, we sampled the labelled terminals by using stereological techniques in a representative case. This analysis revealed that the largest proportions of terminals could be classified as type I terminals (57%) or singletons (30%). Larger terminals of intermediate complexity made up 8% of the labelled terminals and complex rosettes 5% (Fig. 6). We also determined whether terminal size was correlated with axon diameter (Fig. 7). A Bonferroni’s post-hoc analysis of bouton size and axon thickness revealed that terminal size is a good predictor of the four qualitative categories (F 37.72, P = 0.001, R2 = 0.47). In contrast, axon diameter was not correlated with our qualitative categories (F 0.623, P = 0.47, R2 = 0.15). The analysis revealed that type I bouton size was statistically different from that of all other terminal types (P < 0.05) and that singletons were also different from type I and intermediate terminals (P < 0.05). The terminals of intermediate complexity were different from type I terminals and singletons but were not different from rosettes (P < 0.05). The group with the most variation in terminal size and axon diameter was the singletons. Within this group, there was no correlation between bouton size and axon diameter (r = 0.239, P = 0.14).
Fig. 6.
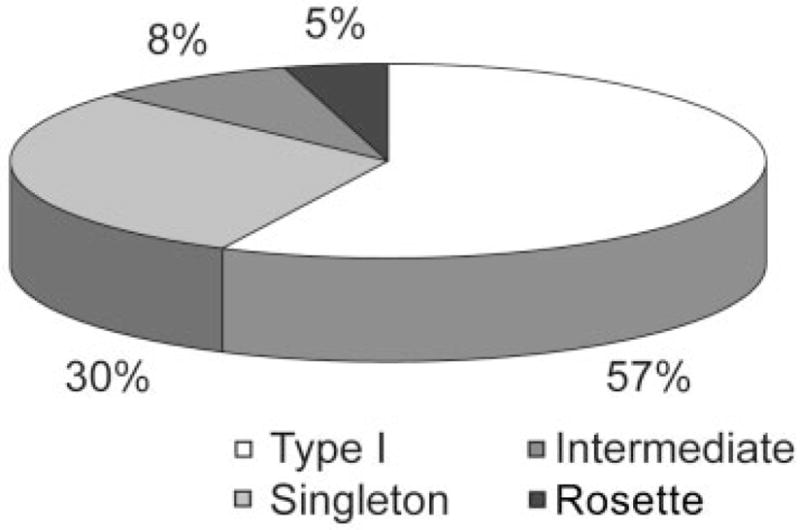
Proportions of the different PMLS terminal types encountered in LP nucleus with stereological sampling techniques.
Fig. 7.
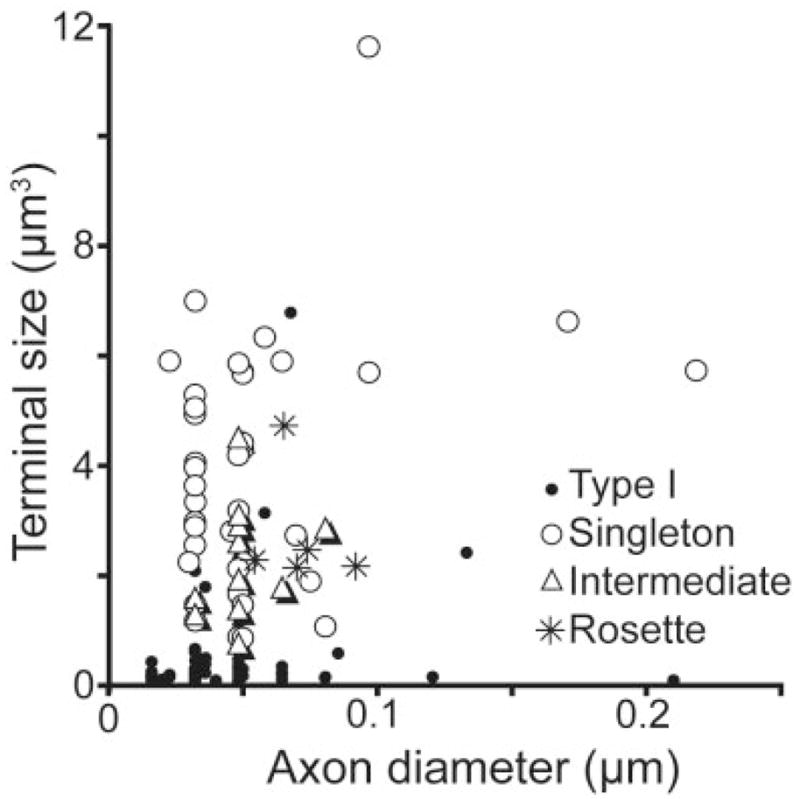
Terminal size plotted as a function of preterminal axon diameter for the four categories of terminal morphology.
Reciprocity
Injections of the low-molecular-weight (3,000 kDa) BDA labelled both corticothalamic axons by anterograde transport and thalamocortical cells by retrograde transport. After injections in area 17 or area PMLS, cells labelled by retrograde transport were observed primarily in regions that also contained the densest distribution of terminals labelled by anterograde transport (Fig. 1A,B), although isolated cells outside terminal fields were also observed. The labelled cells contained a dense granular reaction product clearly showing the perikaryal outline and the proximal dendritic segments. After either area 17 or area PMLS injections, numerous labelled axons bearing singletons or terminal clusters of intermediate complexity were observed close to labelled cells (Fig. 8A,B). In addition, after injections in area PMLS, many type I labelled axons were observed in close proximity to labelled cells (Fig. 8C).
Fig. 8.

Examples of suspected reciprocity. A: Photomontage of large terminals labelled by anterograde transport in close relation to a cell labelled by retrograde transport from injection in area 17. A1– 4: Different focal planes (z-offsets) used to create the photomontage presented in A. B: Photomontage of large terminals labelled by anterograde transport in close relation to a cell labelled by retrograde transport from injection in area PMLS. B1– 4: Different focal planes (z-offsets) used to create the photomontage presented in B. C: Photograph of small type I terminals labelled by anterograde transport in close relation to three cells labelled by retrograde transport from injection in area PMLS. Scale bars = 10 μm in A,B; 20 μm in C.
Ultrastructure of area PMLS corticothalamic terminals
To examine the ultrastructure of terminals in the LPl nucleus that originate from area PMLS, we examined PHAL-labelled terminals with an electron microscope. The following observations are based on examination of the synaptic connections of 185 labelled corticothalamic terminals. We examined 102 synaptic contacts made by terminals in LPl-1 and 84 synaptic contacts made by terminals in the presumed LPl-2.
Almost all terminals in LPl-1, labelled from injections in PMLS, were similar in morphology and synaptic connections. These terminals displayed almost exclusively RS morphology; they were small and filled with densely packed round synaptic vesicles (Fig. 9). They made asymmetric synaptic contacts primarily with small-caliber dendrites. These synaptic contacts were made outside of glomeruli, and the dendrites were frequently contacted by other unlabeled RS profiles.
Fig. 9.

Terminals in the caudal and ventral parts of the lateral subdivision of the lateral posterior nucleus (LPl-1) labelled with PHAL from an injection in the PMLS cortex are small and contain densely packed round vesicles (RS profiles/type I). A–E: They contact (white arrowheads) small-caliber dendrites in the extraglomerular neuropil. B,E: These dendrites are contacted by other unlabeled RS profiles (black arrowheads) or terminals that contain GABA as identified by a high density of gold particles (A, arrows indicate synaptic contacts). Most postsynaptic dendrites are GABA-negative, but occasional contacts are seen on GABAergic profiles (C). Scale bar = 1 μm.
In contrast to the homogeneous morphology of labelled terminals in the LPl-1 region, corticothalamic terminals in the LPl-2 fell into two categories. Labelled terminals in LPl-2 were either small RS profiles, similar to those observed in LPl-1, or larger profiles with round vesicles (RL profiles; Figs 10, 11). The RL profiles, in addition to being much larger than the RS profiles, display several other morphological differences. For example, the vesicles within RL profiles were not as densely packed as those contained in the RS profiles, and the RL profiles contained more mitochondria than RS profiles. RL profiles also participated in much more complex glomerular synaptic arrangements in which they contacted dendrites with vesicles (F2 profiles) and without vesicles.
Fig. 10.
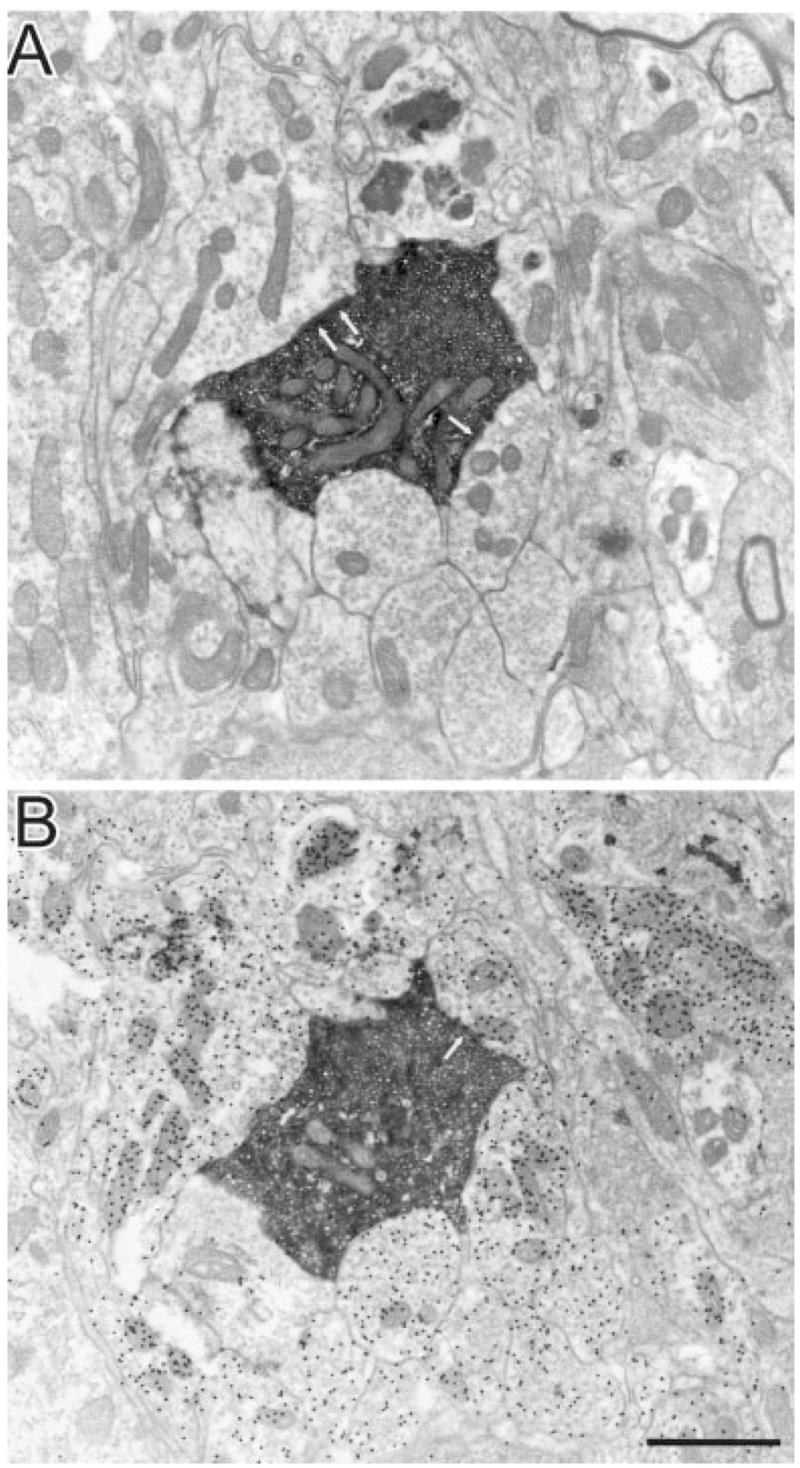
Adjacent sections, unstained (A) and stained for GABA (B), through an RL profile (presumed type II terminal) in the dorsal and rostral part of LPl (LPl-2) labelled with PHAL from an injection in cortical area PMLS. This terminal makes several synaptic contacts (arrows) with GABAergic dendrites within a glomerulus. Scale bar = 1 μm.
Fig. 11.
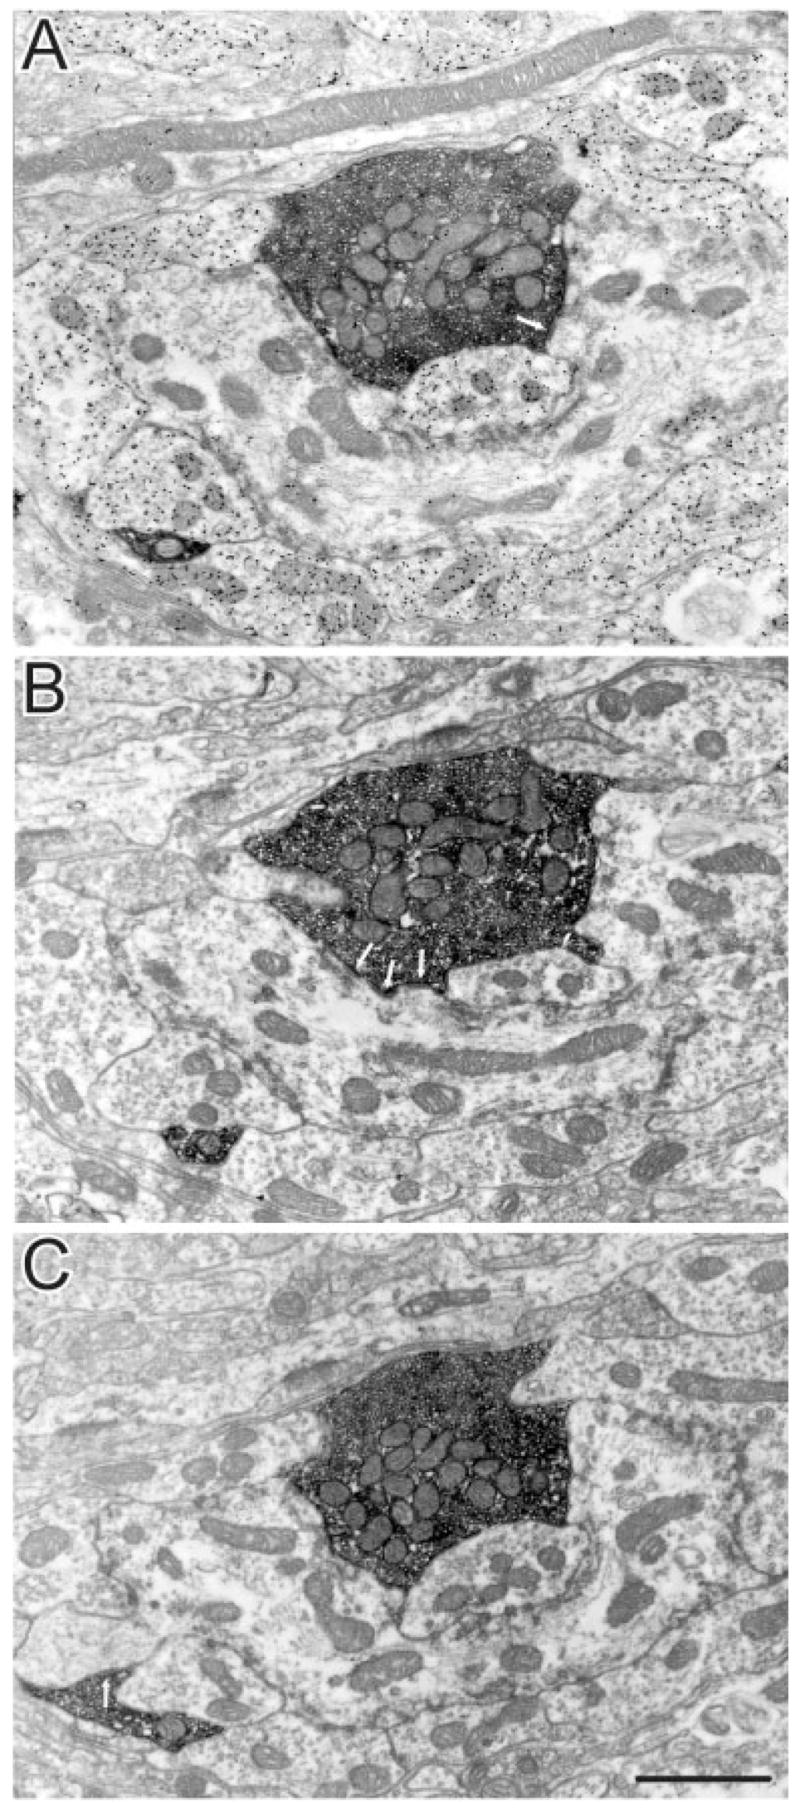
Adjacent sections, stained for GABA (A) and unstained (B,C), through an RL profile (presumed type II terminal) in the dorsal and rostral LPl (LPl-2) labelled with PHAL from an injection in cortical area PMLS. This terminal makes several synaptic contacts (arrows) with GABAergic and non-GABAergic dendrites within a glomerulus. Scale bar = 1 μm.
Ultrastructural examination of labelled terminals also revealed that, whereas single synaptic contacts were made by the RS terminals, the RL terminals made multiple synaptic contacts with one or more postsynaptic targets. Normally, every third section was scanned with the electron microscope, and photographs were taken of any labelled terminals making a synaptic contact. With this spacing, we rarely photographed the same RS profiles in multiple sections. Only six RS profiles were photographed in more than one section, and these terminals made only one synaptic contact. All RS profiles observed in single sections also contacted only one target. In contrast, the larger RL profiles were more frequently observed in multiple sections (12 terminals), and multiple synaptic contacts were identified in serial sections and within single sections (up to four contacts per terminal observed within one section and up to 12 contacts per terminal observed in serial sections).
For the quantitative analyses described below, multiple synaptic contacts made by individual terminals were counted only if the synaptic zones were separated by a nonsynaptic zone of 0.5 μm or more. For example, three synaptic contacts were counted for the terminal illustrated in Figure 10, and two synaptic contacts were counted for the terminals illustrated in Figure 11.
Because we found that RS and RL profiles (classified by qualitative criteria) contact profiles of different sizes, we tested whether the combined measurements of the size of the pre- and postsynaptic profiles could be used to classify corticothalamic terminals by using strictly quantitative criteria. A plot of presynaptic vs. postsynaptic profile minor diameters illustrates that the terminals sampled within LPl-1 formed a tight group of small terminals that contact small dendrites; this correlated well with our qualitative categorization of most terminals as RS profiles (Fig. 12A). In contrast, similar plots of the terminals sampled within LPl-2 revealed a much wider distribution of presynaptic and postsynaptic profile diameters. Although as a group the size of the presynaptic profiles correlated with our qualitative categorization of RS and RL profiles (ANOVA, P < 0.001, R2 = 0.42), this quantitative analysis revealed considerable overlap between the sizes of terminals that we qualitatively identified as RS and RL profiles. Furthermore, the size of dendrites postsynaptic to labelled terminals in the LPl-2 varied widely and was not correlated with our RS and RL categories (ANOVA, P < 0.349, R2 = 0.01).
Fig. 12.
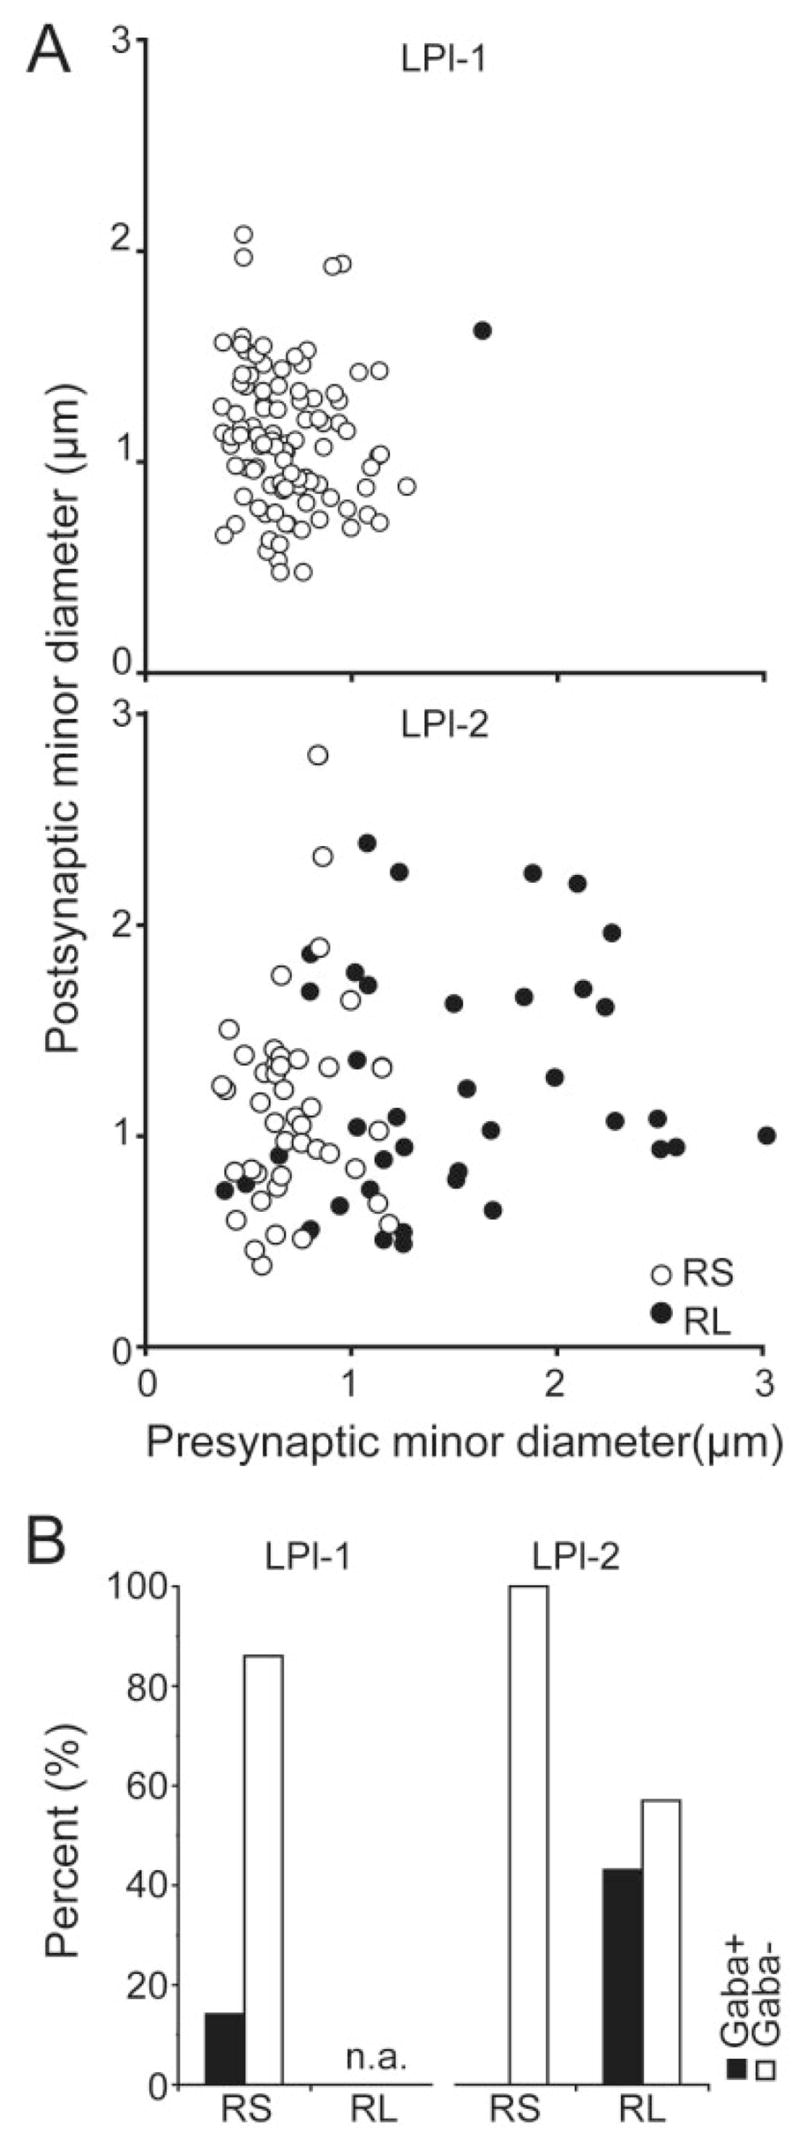
A: Scatterplots of the minor diameter of labelled corticothalamic terminals as a function of the minor diameter of their postsynaptic targets illustrate the relation between the sizes of presynaptic and postsynaptic partners. Upper graph: Synapses in the LPl-1. Lower graph: Synapses in LPl-2. B: Histograms illustrate the number of GABAergic and non-GABAergic postsynaptic profiles in the LPl-1 and LPl-2.
Therefore pre- and postsynaptic profile size might not always correlate with ultrastructural categories that take into account additional, less easily quantifiable features, such as vesicle packing density, mitochondria content, and synaptic arrangements. In addition, our ultrastructural analysis was carried out with photographs of single sections, which underestimates pre- and postsynaptic profile sizes. Serial section reconstructions of labelled terminals would be more likely to identify a correlation between terminal size and ultrastructural features. Alternatively, the smaller profiles that we identified as RL profiles could represent smaller singleton terminals.
A subset of sections was stained for GABA with postem-bedding immunocytochemical techniques. As illustrated in Figure 12B, in each subdivision, most dendrites contacted by terminals labelled from PMLS injections were GABA negative and thus can be identified as the dendrites of thalamocortical projection neurons. However, in the LPl-1, a small proportion of dendrites (14%) was GABA-positive and thus could be identified as the dendrites of interneurons (Palestini et al., 1993). In LPl-1, these GABA-positive dendrites rarely contained vesicles; only two were classified as F2 profiles.
In contrast, in the LPl-2 region, all of the postsynaptic dendrites that did not contain vesicles were GABA negative, and all of the postsynaptic profiles that were GABA positive contained vesicles (F2 profiles). The postsynaptic GABAergic profiles that contain vesicles can tentatively be classified as the dendritic terminals of interneurons, based on previous studies of the LGN (Famiglietti and Peters, 1972; Hamos et al., 1985; Montero, 1986),. However, this identification remains tentative, because the dendritic nature of these terminals has not been definitively established within the LP nucleus.
All of the terminals presynaptic to GABAergic profiles in the LPl-2 were categorized as RL profiles. In the LPl-2, 97% of the RL profiles participated in glomerular synaptic arrangements. Forty-five percent of the synaptic contacts made by RL profiles were with GABAergic F2 profiles, and 55% were with non-GABAergic dendrites. All of the RS profiles in the LPl-2 were found to contact non-GABAergic dendrites.
DISCUSSION
Figure 13 schematically summarizes the findings of the current study and those of previous studies. It has been well documented that layer VI cells in area 17 project to the dLGN (Gilbert and Kelly, 1975; Deschênes et al., 1994; Bourassa and Deschênes, 1995; Ojima et al., 1996), where they innervate the distal dendrites of projection cells (P, gray) with type I terminals/RS profiles (black circles) (Guillery, 1966; Jones and Powell, 1969; Robson, 1983; Vidnyánszky and Hamori, 1994; Murphy and Sillito, 1996; Vidnyánszky et al., 1996; Erisir et al., 1997). The dLGN in turn innervates layers IV and VI of area 17 (LeVay and Gilbert, 1976; Ferster and LeVay, 1978; Humphrey et al., 1985a,b; Boyd and Matsubara, 1996; Kawano, 1998). In contrast, layer V cells in area 17 innervate the LPl with type II terminals/RL profiles (gray circles) that participate in glomerular arrangements with projection cell dendrites and interneuron (I, white) dendritic terminals (Abramson and Chalupa, 1985; Vidnyánszky et al., 1996; Feig and Harting, 1998); these arrangements are very similar to those made by retinal terminals in the dLGN (Guillery, 1966). LPl cells in the striate-recipient zone in turn innervate layer I of area 17 and layers IV and I of area PMLS (Abramson and Chalupa, 1985) via axon collaterals (Tong and Spear, 1986; Miceli et al., 1991).
Fig. 13.

Schematic summary of corticothalamic circuitry involving areas 17 and PMLS. In both the dorsal lateral geniculate nucleus (dLGN) and the lateral subdivision of the lateral posterior nucleus (LPl), thalamocortical projection cells (P) are depicted in gray, and GABAergic interneurons (I) are depicted in white. The cortical laminae (I–VI) of areas 17 and PMLS are indicated by the dotted lines, and the thalamocortical projections from the dLGN and LPl to areas 17 and PMLS are shown with arrows. The apical dendritic distributions of layer V and layer VI corticothalamic pyramidal cells are schematically represented, and their thalamic projections depicted as large (gray circles) terminals or small (black circles) terminals respectively. See text for additional details of the schematic synaptic arrangements.
We found that within the striate-recipient zone of the LPl, area PMLS primarily innervates projection cells with RS profiles. We also observed within the striate recipient LPl that a small percentage (14%) of RS profiles contacts the dendritic shafts of interneurons. The RS profiles in the LPl presumably originate from layer VI cells; Abramson and Chalupa (1985) found that, after injections in the LPl, most cells in area PMLS were located in layer VI. Larger PMLS terminals, which presumably arise from layer V, were less frequently observed within the striate-recipient zones of the LP nucleus. Therefore, we predict that few cells receive layer V input from both area 17 and PMLS.
However, the larger terminal types labelled following PMLS injections (including singletons, clusters of intermediate complexity, and rosettes) were relatively numerous within the more rostral, lateral, and dorsal regions of the lateral LP, an area that may correspond to the tectorecipient LPl-2 (Chalupa and Abramson, 1989; Kelly et al., 2003). We found that this region receives PMLS input from both RS profiles, which contact projection cell dendrites, as well as RL profiles, which contact both projection cell dendrites (55%) and interneuron dendritic terminals (45%) in glomerular arrangements. These results indicate that the innervation of the LPl from area PMLS may vary within subregions of the LPl and could provide a complex mixture of signals that could be integrated with signals from area 17 and the superior colliculus.
Evidence for the integration of cortical inputs in the LPl
Sherman and Guillery (1998) have proposed, based on electrophysiological studies of the dLGN, that RL profiles throughout the dorsal thalamus can be considered drivers, whereas RS profiles can be considered modulators. That is, RL profiles may be inputs that establish the primary receptive field properties of thalamic cells, whereas RS profiles may be inputs that modulate responses without dramatically changing their fundamental properties. With this model, our results predict that, in the LPl, the response properties might be driven primarily by layer V cells in area 17, whereas layer VI cells in area PMLS might modulate these responses.
In fact, our previous studies have shown that the basic response properties of LPl cells are similar to the layer V cells in area 17 that project to the LP (Casanova et al., 1989; Casanova, 1993; Casanova and Savard, 1996). They are orientation and direction selective, and respond well to the movement of random dot patterns or visual noise. However, the receptive fields of LPl cells are larger than those of the layer V cells, and, after lesions or cooling of area 17, the response properties of most LPl cells were not dramatically affected (Casanova et al., 1997). The residual visual activity observed could be contributed by the PMLS projections to the LPl. Because area PMLS receives direct projections from the retinorecipient medial interlaminar nucleus and C lamina of the dLGN (Tong et al., 1982), corticocortical projections from area 17 are not essential for the maintenance of area PMLS response properties (Spear et al., 1980; Tong et al., 1984). Alternatively, the visual activity in the LPl that remains when area 17 is silenced may be contributed by projections from areas 18, 19, or 21a. These areas all innervate the LPl (Updyke, 1977, 1986; Berson and Graybiel, 1983), and the projections from areas 18 and 19 have been shown to exhibit type II morphology (Ojima et al., 1996; Guillery et al., 2001). In addition, the LPl receives direct input from the retina (Boire et al., 2004). Although these terminals are small and relatively sparsely distributed, they could contribute to LPl response properties. On the other hand, after massive cooling of both the striate and the extrastriate cortices or extensive lesions of extrastriate areas, the responses of LP neurons were dramatically reduced (Chalupa, 1991; Merabet et al., 1998). Therefore, it appears that the response properties of most lateral LP neurons are created via the integration of inputs from several different cortical areas.
Classification of terminal types in the LP nucleus
The axons labelled following PMLS injections exhibited varied morphologies, which we were able to place into the four categories previously established by Guillery et al. (2001): small (type I) terminals (57%), medium-sized to large singletons (30%), large (type II) terminals in arrangements of intermediate complexity (8%), and large (type II) terminals that form arrangements resembling rosettes (5%). By analyzing bouton size and preterminal axon diameter, we found that singletons were statistically different from smaller type I and larger type II terminals. This suggests that singletons could arise from a distinct type of corticothalamic axon.
At this point, it is not known whether singletons labelled by area PMLS injections originate from layer V or layer VI cells. However, because area 17 injections resulted in the labelling of singleton terminals as well as terminals of intermediate complexity and rosettes (Guillery et al., 2001), it is likely that layer V cells give rise to multiple terminals types. It is possible that layer V cells that project to the pulvinar/LP can be subdivided into distinct categories. Layer V axons have been shown to branch to project to the striatum and thalamus, or to the superior colliculus and thalamus, but not to all three targets (Deschênes et al., 1994; Pare and Smith, 1996). In fact, physiological recordings in the cat area PMLS indicate that corticostriatal and corticotectal cells constitute separate populations and display distinct physiological properties (Niida et al., 1997). Future studies are needed to determine how various corticothalamic cell types correlate with the four or more categories of corticothalamic terminals that can be identified at the light microscopic level in the LP-pulvinar complex.
Future studies are also needed to clarify how the multiple terminal categories observed at the light microscopic level correspond to features that we observed at the electron microscopic level. By ultrastructural observations, we could identify only two categories of terminals: RS and RL profiles. These two terminal types were distinguished not only on the basis of their size but also on the basis of more qualitative features, which included vesicle packing density, mitochondria content, and synaptic arrangements. Our quantitative measurements of terminal size showed that, although RL profiles as a group were larger than RS profiles, the distributions of individual profile sizes showed considerable overlap (Fig. 12). Although the smaller RL profiles likely are pieces of larger terminals, the overlap of RS and RL profiles sizes may also reflect the overlap in the sizes of the four categories of terminals identified via light microscopy (Fig. 7). Finally, we found no correlation between presynaptic terminal type and postsynaptic profile size, although we were able to find such a correlation in a previous study of area 7 terminals in the pulvinar nucleus (Baldauf et al., 2005). This might reflect differences in terminal types originating from area PMLS and area 7 or differences in cell morphologies in the pulvinar and LP nuclei.
Regional specificity of the PMLS-LP projection
The results presented here show considerable overlap within the LPl of the various terminal types that were labelled following tracer injection in the PMLS. Complex type II axon terminals formed discrete foci intermingled within more widespread fields of singletons and type I axon terminals. This labelling pattern was similar to that observed in our previous studies of the projection from area 7 to the pulvinar nucleus (Baldauf et al., 2005). It is also similar to the overlap of type I and type II terminals labelled following injections in area 19 (Guillery et al., 2001), although in this latter study the type II terminals tended to form more focused clusters that overlapped with fewer type I terminals.
We did observe some indication of regional specificity in that the proportion of PMLS terminals classified as RL profiles was higher in the more rostral and dorsal regions of the LPl (adjacent to the pulvinar nucleus) than in more caudal and ventral regions of the LPl (adjacent to the dLGN). This region likely corresponds to the LPl-2, originally described by Chalupa and Abramson (1989) based on visual responses that were distinct from those recorded in the main, striate-recipient zone of the LP (LPl-1). In contrast to the well-defined receptive fields of neurons in the LPl-1 region, neurons in the LPl-2 region have very large receptive fields, and few are direction or orientation selective. The LPl-2 region also corresponds to the tectorecipient zone of the lateral LP nucleus (Chalupa and Abramson, 1988), so it is possible that the superior colliculus contributes significantly to the response properties of neurons in this region of the thalamus. Our finding that immunocytochemical staining for substance P also delineates this zone lends further support to this idea (Kelly et al., 2003). Substance P has been shown to be a neurotransmitter used in the pathway from the superior colliculus to the LPm nucleus (Hutsler and Chalupa, 1991) and might also be used in the pathway from the superior colliculus to the LPl-2 subdivision of the LPl nucleus (Chalupa and Abramson, 1988).
Receptive fields in the LPl-2 regions are much larger than those of cells in the superficial layers of the superior colliculus that project to the LPl-2 region (Chalupa et al., 1983; Chalupa and Abramson, 1989). Thus, a variety of inputs may converge in LPl-2 to be integrated. Our results suggest that inputs from PMLS likely contribute to these responses. Perhaps this region of the LP-pulvinar complex functions as a true “association nucleus,” which integrates information from a variety of cortical and subcortical sources. In this context, most neurons in this region may exhibit higher-order properties known to exist in LP-pulvinar (e.g., complex motion sensitivity; Merabet et al., 1998; Dumbrava et al., 2001). Continued study of the synaptic targets of both cortical and subcortical inputs to the LPl nucleus is needed to unravel its circuitry and to aid in the ongoing modification of theoretical models of visual attention and salience.
Acknowledgments
We thank the Research Resources Facility of the University of Louisville for the excellent animal care and surgical assistance, Martin Boyce and Cathie Caple for their expert assistance with the histology and electron microscopy, and Ranida Chomsung for her contributions to the ultrastructural analysis. We especially thank Drs. Pedro Lowenstein and Gillian Einstein for their generous donation of the tissue used for ultrastructural analysis. Their contributions to this project were supported by NATO 353-9015 and NEI 303-8770.
Grant sponsor: Canadian Institutes of Health Research (to C.C.); Grant sponsor: National Sciences and Engineering Research Council of Canada (to M.P.); Grant sponsor: National Institute of Neurological Disorders and Stroke; Grant number: NS35377 (to M.E.B.). Scholarship sponsor: Fonds de la Recherche en Santé du Québec Fellowship (Chercheur National; to C.C.); Fellowship sponsor: Fonds de la Recherche en Santé du Québec Scholarship (to F.H.-G.).
LITERATURE CITED
- Abramson BP, Chalupa LM. The laminar distribution of cortical connections with the tecto- and cortico-recipient zones in the cat’s lateral posterior nucleus. Neuroscience. 1985;15:81–95. doi: 10.1016/0306-4522(85)90125-3. [DOI] [PubMed] [Google Scholar]
- Anderson JC, Binzegger T, Martin KA, Rockland KS. The connection from cortical area V1 to V5: a light and electron microscopic study. J Neurosci. 1998;18:10525–10540. doi: 10.1523/JNEUROSCI.18-24-10525.1998. [DOI] [PMC free article] [PubMed] [Google Scholar]
- Baldauf ZB, Chomsung RD, Carden WB, May PJ, Bickford ME. Ultrastructural analysis of projections to the pulvinar nucleus of the cat. I: middle suprasylvian gyrus (areas 5 and 7) J Comp Neurol. 2005;485:87–107. doi: 10.1002/cne.20480. [DOI] [PMC free article] [PubMed] [Google Scholar]
- Berson DM, Graybiel AM. Parallel thalamic zones in the LP-pulvinar complex of the cat identified by their afferent and efferent connections. Brain Res. 1978;147:139–148. doi: 10.1016/0006-8993(78)90778-3. [DOI] [PubMed] [Google Scholar]
- Berson DM, Graybiel AM. Organization of the striate-recipient zone of the cats lateralis posterior-pulvinar complex and its relations with the geniculostriate system. Neuroscience. 1983;9:337–372. doi: 10.1016/0306-4522(83)90299-3. [DOI] [PubMed] [Google Scholar]
- Bickford ME, Eisenback MA, Einstein G. Synaptic targets of corticothalamic terminals in the cat LP nucleus originating from area PMLS. Soc Neurosci Abstr. 1998;24:1162. [Google Scholar]
- Boire D, Matteau I, Casanova C, Ptito M. Retinal projections to the lateral posterior-pulvinar complex in intact and early visual cortex lesioned cats. Exp Brain Res. 2004;159:185–196. doi: 10.1007/s00221-004-1946-6. [DOI] [PubMed] [Google Scholar]
- Bourassa J, Deschênes M. Corticothalamic projections from the primary visual cortex in rats: a single fiber study using biocytin as an anterograde tracer. Neuroscience. 1995;66:253–263. doi: 10.1016/0306-4522(95)00009-8. [DOI] [PubMed] [Google Scholar]
- Boyd JD, Matsubara JA. Laminar and columnar patterns of geniculocortical projections in the cat: relationship to cytochrome oxidase. J Comp Neurol. 1996;365:659– 682. doi: 10.1002/(SICI)1096-9861(19960219)365:4<659::AID-CNE11>3.0.CO;2-C. [DOI] [PubMed] [Google Scholar]
- Casanova C. Responses of cells in cat’s area 17 to random dot patterns: influence of stimulus size. Neuroreport. 1993;4:1011–1014. doi: 10.1097/00001756-199308000-00004. [DOI] [PubMed] [Google Scholar]
- Casanova C, Savard T. Responses to moving texture patterns of cells in the striate-recipient zone of the cat’s lateral posterior-pulvinar complex. Neuroscience. 1996;70:439– 447. doi: 10.1016/0306-4522(95)00359-2. [DOI] [PubMed] [Google Scholar]
- Casanova C, Freeman RD, Nordmann JP. Monocular and binocular response properties of cells in the striate-recipient zone of the cat’s lateral posterior-pulvinar complex. J Neurophysiol. 1989;62:544–557. doi: 10.1152/jn.1989.62.2.544. [DOI] [PubMed] [Google Scholar]
- Casanova C, Savard T, Darveau S. Contribution of area 17 to cell responses in the striate-recipient zone of the cat’s lateral posterior-pulvinar complex. Eur J Neurosci. 1997;9:1026–1036. doi: 10.1111/j.1460-9568.1997.tb01453.x. [DOI] [PubMed] [Google Scholar]
- Chalupa LM. Visual function of the pulvinar. In: Dreher B, Robinson SP, editors. Vision and visual dysfunction: the neural basis of visual function. Boca Raton, FL: CRC Press; 1991. pp. 140–159. [Google Scholar]
- Chalupa LM, Abramson BP. Receptive-field properties in the tecto-and striate-recipient zones of the cat’s lateral posterior nucleus. Prog Brain Res. 1988;75:85–94. doi: 10.1016/s0079-6123(08)60468-9. [DOI] [PubMed] [Google Scholar]
- Chalupa LM, Abramson BP. Visual receptive fields in the striate-recipient zone of the lateral posterior-pulvinar complex. J Neurosci. 1989;9:347–357. doi: 10.1523/JNEUROSCI.09-01-00347.1989. [DOI] [PMC free article] [PubMed] [Google Scholar]
- Chalupa LM, Williams RW, Hughes MJ. Visual response properties in the tectorecipient zone of the cat’s lateral posterior-pulvinar complex: a comparison with the superior colliculus. J Neurosci. 1983;3:2587–2596. doi: 10.1523/JNEUROSCI.03-12-02587.1983. [DOI] [PMC free article] [PubMed] [Google Scholar]
- Deschênes M, Bourassa J, Pinault D. Corticothalamic projections from layer V cells in rat are collaterals of long-range corticofugal axons. Brain Res. 1994;664:215–219. doi: 10.1016/0006-8993(94)91974-7. [DOI] [PubMed] [Google Scholar]
- Dumbrava D, Faubert J, Casanova C. Global motion integration in the cat’s lateral posterior-pulvinar complex. Eur J Neurosci. 2001;13:2218–2226. doi: 10.1046/j.0953-816x.2001.01598.x. [DOI] [PubMed] [Google Scholar]
- Erisir A, Van Horn SC, Bickford ME, Sherman SM. Immunocytochemistry and distribution of parabrachial terminals in the lateral geniculate nucleus of the cat: a comparison with corticogeniculate terminals. J Comp Neurol. 1997;377:535–549. [PubMed] [Google Scholar]
- Famiglietti EV, Jr, Peters A. The synaptic glomerulus and the intrinsic neuron in the dorsal lateral geniculate nucleus of the cat. J Comp Neurol. 1972;144:285–334. doi: 10.1002/cne.901440304. [DOI] [PubMed] [Google Scholar]
- Feig S, Harting JK. Corticocortical communication via the thalamus: ultrastructural studies of corticothalamic projections from area 17 to the lateral posterior nucleus of the cat and inferior pulvinar nucleus of the owl monkey. J Comp Neurol. 1998;395:281–295. doi: 10.1002/(sici)1096-9861(19980808)395:3<281::aid-cne2>3.0.co;2-z. [DOI] [PubMed] [Google Scholar]
- Ferster D, LeVay S. The axonal arborizations of lateral geniculate neurons in the striate cortex of the cat. J Comp Neurol. 1978;182:923–944. doi: 10.1002/cne.901820510. [DOI] [PubMed] [Google Scholar]
- Gilbert CD, Kelly JP. The projections of cells in different layers of the cat’s visual cortex. J Comp Neurol. 1975;163:81–105. doi: 10.1002/cne.901630106. [DOI] [PubMed] [Google Scholar]
- Graybiel AM. Some thalamocortical projections of the pulvinar-posterior system of the thalamus in the cat. Brain Res. 1970;22:131–136. doi: 10.1016/0006-8993(70)90409-9. [DOI] [PubMed] [Google Scholar]
- Graybiel AM, Berson DM. Histochemical identification and afferent connections of subdivisions in the lateralis posterior-pulvinar complex and related thalamic nuclei in the cat. Neuroscience. 1980;5:1175–1238. doi: 10.1016/0306-4522(80)90196-7. [DOI] [PubMed] [Google Scholar]
- Guillery RW. A study of Golgi preparations from the dorsal lateral geniculate nucleus of the adult cat. J Comp Neurol. 1966;128:21–50. doi: 10.1002/cne.901280104. [DOI] [PubMed] [Google Scholar]
- Guillery RW. Anatomical evidence concerning the role of the thalamus in corticocortical communication: a brief review. J Anat. 1995;187:583–592. [PMC free article] [PubMed] [Google Scholar]
- Guillery RW, Feig SL, Van Lieshout DP. Connections of higher order visual relays in the thalamus: a study of corticothalamic pathways in cats. J Comp Neurol. 2001;438:66– 85. doi: 10.1002/cne.1302. [DOI] [PubMed] [Google Scholar]
- Hamos JE, Van Horn SC, Raczkowski D, Uhlrich DJ, Sherman SM. Synaptic connectivity of a local circuit neurone in lateral geniculate nucleus of the cat. Nature. 1985;317:618– 621. doi: 10.1038/317618a0. [DOI] [PubMed] [Google Scholar]
- Humphrey AL, Sur M, Uhlrich DJ, Sherman SM. Projection patterns of individual X- and Y-cell axons from the lateral geniculate nucleus to cortical area 17 in the cat. J Comp Neurol. 1985a;233:159–189. doi: 10.1002/cne.902330203. [DOI] [PubMed] [Google Scholar]
- Humphrey AL, Sur M, Uhlrich DJ, Sherman SM. Termination patterns of individual X- and Y-cell axons in the visual cortex of the cat: projections to area 18, to the 17/18 border region, and to both areas 17 and 18. J Comp Neurol. 1985b;233:190–212. doi: 10.1002/cne.902330204. [DOI] [PubMed] [Google Scholar]
- Huppé-Gourgues F, Boire D, Charpentier A, Ptito M, Casanova C. Morphology of cortical terminals in the LP-pulvinar complex. Fed Eur Neurosci. 2004a;2:A122.7. [Google Scholar]
- Huppé-Gourgues F, Boire D, Charpentier A, Ptito M, Casanova C. Morphology of the corticothalamic terminals in high order thalamic relay. Soc Neurosci Abstr 983.8 2004b [Google Scholar]
- Hutsler JJ, Chalupa LM. Substance P immunoreactivity identifies a projection from the cat’s superior colliculus to the principal tectorecipient zone of the lateral posterior nucleus. J Comp Neurol. 1991;312:379–390. doi: 10.1002/cne.903120306. [DOI] [PubMed] [Google Scholar]
- Jones EG, Powell TP. An electron microscopic study of the mode of termination of corticothalamic fibres within the sensory relay nuclei of the thalamus. Proc R Soc Lond B Biol Sci. 1969;172:173–185. doi: 10.1098/rspb.1969.0018. [DOI] [PubMed] [Google Scholar]
- Jones EG, Powell TP. An analysis of the posterior group of thalamic nuclei on the basis of its afferent connections. J Comp Neurol. 1971;143:185–216. doi: 10.1002/cne.901430204. [DOI] [PubMed] [Google Scholar]
- Kato N. Cortico-thalamo-cortical projection between visual cortices. Brain Res. 1990;509:150–152. doi: 10.1016/0006-8993(90)90323-4. [DOI] [PubMed] [Google Scholar]
- Kawano J. Cortical projections of the parvocellular laminae C of the dorsal lateral geniculate nucleus in the cat: an anterograde wheat germ agglutinin conjugated to horseradish peroxidase study. J Comp Neurol. 1998;392:439– 457. doi: 10.1002/(sici)1096-9861(19980323)392:4<439::aid-cne3>3.0.co;2-1. [DOI] [PubMed] [Google Scholar]
- Kelly LR, Li J, Carden WB, Bickford ME. Ultrastructure and synaptic targets of tectothalamic terminals in the cat lateral posterior nucleus. J Comp Neurol. 2003;464:472– 486. doi: 10.1002/cne.10800. [DOI] [PubMed] [Google Scholar]
- LeVay S, Gilbert CD. Laminar patterns of geniculocortical projection in the cat. Brain Res. 1976;113:1–19. doi: 10.1016/0006-8993(76)90002-0. [DOI] [PubMed] [Google Scholar]
- Li J, Guido W, Bickford ME. Two distinct types of corticothalamic EPSPs and their contribution to short-term synaptic plasticity. J Neurophysiol. 2003;90:3429–3440. doi: 10.1152/jn.00456.2003. [DOI] [PubMed] [Google Scholar]
- Mathers LH. The synaptic organization of the cortical projection to the pulvinar of the squirrel monkey. J Comp Neurol. 1972a;146:43– 60. doi: 10.1002/cne.901460104. [DOI] [PubMed] [Google Scholar]
- Mathers LH. Ultrastructure of the pulvinar of the squirrel monkey. J Comp Neurol. 1972b;146:15– 42. doi: 10.1002/cne.901460103. [DOI] [PubMed] [Google Scholar]
- Merabet L, Desautels A, Minville K, Casanova C. Motion integration in a thalamic visual nucleus. Nature. 1998;396:265–268. doi: 10.1038/24382. [DOI] [PubMed] [Google Scholar]
- Miceli D, Reperant J, Marchand L, Ward R, Vesselkin N. Divergence and collateral axon branching in subsystems of visual cortical projections from the cat lateral posterior nucleus. J Hirnforsch. 1991;32:165–173. [PubMed] [Google Scholar]
- Montero VM. Localization of gamma-aminobutyric acid (GABA) in type 3 cells and demonstration of their source to F2 terminals in the cat lateral geniculate nucleus: a Golgi-electron-microscopic GABA-immunocytochemical study. J Comp Neurol. 1986;254:228–245. doi: 10.1002/cne.902540207. [DOI] [PubMed] [Google Scholar]
- Murphy PC, Sillito AM. Functional morphology of the feedback pathway from area 17 of the cat visual cortex to the lateral geniculate nucleus. J Neurosci. 1996;16:1180–1192. doi: 10.1523/JNEUROSCI.16-03-01180.1996. [DOI] [PMC free article] [PubMed] [Google Scholar]
- Niida T, Stein BE, McHaffie JG. Response properties of corticotectal and corticostriatal neurons in the posterior lateral suprasylvian cortex of the cat. J Neurosci. 1997;17:8550–8565. doi: 10.1523/JNEUROSCI.17-21-08550.1997. [DOI] [PMC free article] [PubMed] [Google Scholar]
- Niimi K, Sprague JM. Thalamo-cortical organization of the visual system in the cat. J Comp Neurol. 1970;138:219–250. doi: 10.1002/cne.901380208. [DOI] [PubMed] [Google Scholar]
- Ogren MP, Hendrickson AE. The morphology and distribution of striate cortex terminals in the inferior and lateral subdivisions of the Macaca monkey pulvinar. J Comp Neurol. 1979;188:179–199. doi: 10.1002/cne.901880113. [DOI] [PubMed] [Google Scholar]
- Ojima H, Murakami K, Kishi K. Dual termination modes of corticothalamic fibers originating from pyramids of layers 5 and 6 in cat visual cortical area 17. Neurosci Lett. 1996;208:57– 60. doi: 10.1016/0304-3940(96)12538-6. [DOI] [PubMed] [Google Scholar]
- Olson CR, Graybiel AM. An outlying visual area in the cerebral cortex of the cat. Prog Brain Res. 1983;58:239–245. doi: 10.1016/S0079-6123(08)60025-4. [DOI] [PubMed] [Google Scholar]
- Palestini M, Guegan M, Saavedra H, Thomasset M, Batini C. Glutamate, GABA, calbindin-D28k and parvalbumin immunoreactivity in the pulvinar-lateralis posterior complex of the cat: relation to the projection to the Clare-Bishop area. Neurosci Lett. 1993;160:89–92. doi: 10.1016/0304-3940(93)90920-g. [DOI] [PubMed] [Google Scholar]
- Pare D, Smith Y. Thalamic collaterals of corticostriatal axons: their termination field and synaptic targets in cats. J Comp Neurol. 1996;372:551–567. doi: 10.1002/(SICI)1096-9861(19960902)372:4<551::AID-CNE5>3.0.CO;2-3. [DOI] [PubMed] [Google Scholar]
- Raczkowski D, Rosenquist AC. Connections of the multiple visual cortical areas with the lateral posterior-pulvinar complex and adjacent thalamic nuclei in the cat. J Neurosci. 1983;3:1912–1942. doi: 10.1523/JNEUROSCI.03-10-01912.1983. [DOI] [PMC free article] [PubMed] [Google Scholar]
- Reinoso-Suarez F, Roda JM. Topographical organization of the cortical afferent connections to the cortex of the anterior ectosylvian sulcus in the cat. Exp Brain Res. 1985;59:313–324. doi: 10.1007/BF00230911. [DOI] [PubMed] [Google Scholar]
- Robertson RT, Cunningham TJ. Organization of corticothalamic projections from parietal cortex in cat. J Comp Neurol. 1981;199:569–585. doi: 10.1002/cne.901990409. [DOI] [PubMed] [Google Scholar]
- Robson JA. The morphology of corticofugal axons to the dorsal lateral geniculate nucleus in the cat. J Comp Neurol. 1983;216:89–103. doi: 10.1002/cne.902160108. [DOI] [PubMed] [Google Scholar]
- Robson JA, Hall WC. The organization of the pulvinar in the grey squirrel (Sciurus carolinensis). I. Cytoarchitecture and connections. J Comp Neurol. 1977a;173:355–388. doi: 10.1002/cne.901730210. [DOI] [PubMed] [Google Scholar]
- Robson JA, Hall WC. The organization of the pulvinar in the grey squirrel (Sciurus carolinensis). II. Synaptic organization and comparisons with the dorsal lateral geniculate nucleus. J Comp Neurol. 1977b;173:389– 416. doi: 10.1002/cne.901730211. [DOI] [PubMed] [Google Scholar]
- Rockland KS. Further evidence for two types of corticopulvinar neurons. Neuroreport. 1994;5:1865–1868. doi: 10.1097/00001756-199410000-00006. [DOI] [PubMed] [Google Scholar]
- Rockland KS. Two types of corticopulvinar terminations: round (type 2) and elongate (type 1) J Comp Neurol. 1996;368:57– 87. doi: 10.1002/(SICI)1096-9861(19960422)368:1<57::AID-CNE5>3.0.CO;2-J. [DOI] [PubMed] [Google Scholar]
- Rockland KS. Convergence and branching patterns of round, type 2 corticopulvinar axons. J Comp Neurol. 1998;390:515–536. doi: 10.1002/(sici)1096-9861(19980126)390:4<515::aid-cne5>3.0.co;2-3. [DOI] [PubMed] [Google Scholar]
- Rodrigo-Angulo ML, Reinoso-Suarez F. Afferent connections of the lateralis medialis thalamic nucleus in the cat. Brain Res Bull. 1995;38:53– 67. doi: 10.1016/0361-9230(95)00072-m. [DOI] [PubMed] [Google Scholar]
- Sherman SM, Guillery RW. Functional organization of thalamocortical relays. J Neurophysiol. 1996;76:1367–1395. doi: 10.1152/jn.1996.76.3.1367. [DOI] [PubMed] [Google Scholar]
- Sherman SM, Guillery RW. On the actions that one nerve cell can have on another: distinguishing “drivers” from “modulators. Proc Natl Acad Sci U S A. 1998;95:7121–7126. doi: 10.1073/pnas.95.12.7121. [DOI] [PMC free article] [PubMed] [Google Scholar]
- Spear PD, Kalil RE, Tong L. Functional compensation in lateral suprasylvian visual area following neonatal visual cortex removal in cats. J Neurophysiol. 1980;43:851– 869. doi: 10.1152/jn.1980.43.4.851. [DOI] [PubMed] [Google Scholar]
- Tandrup T, Gundersen HJ, Jensen EB. The optical rotator. J Microsc. 1997;186:108–120. doi: 10.1046/j.1365-2818.1997.2070765.x. [DOI] [PubMed] [Google Scholar]
- Tong L, Spear PD. Single thalamic neurons project to both lateral suprasylvian visual cortex and area 17: a retrograde fluorescent double-labeling study. J Comp Neurol. 1986;246:254–264. doi: 10.1002/cne.902460209. [DOI] [PubMed] [Google Scholar]
- Tong L, Kalil RE, Spear PD. Thalamic projections to visual areas of the middle suprasylvian sulcus in the cat. J Comp Neurol. 1982;212:103–117. doi: 10.1002/cne.902120202. [DOI] [PubMed] [Google Scholar]
- Tong L, Kalil RE, Spear PD. Critical periods for functional and anatomical compensation in lateral suprasylvian visual area following removal of visual cortex in cats. J Neurophysiol. 1984;52:941–960. doi: 10.1152/jn.1984.52.5.941. [DOI] [PubMed] [Google Scholar]
- Updyke BV. Topographic organization of the projections from cortical areas 17, 18 and 19 onto the thalamus, pretectum and superior colliculus in the cat. J Comp Neurol. 1977;173:81–122. doi: 10.1002/cne.901730106. [DOI] [PubMed] [Google Scholar]
- Updyke BV. Projections from visual areas of the middle suprasylvian sulcus onto the lateral posterior complex and adjacent thalamic nuclei in cat. J Comp Neurol. 1981;201:477–506. doi: 10.1002/cne.902010403. [DOI] [PubMed] [Google Scholar]
- Updyke BV. Retinotopic organization within the cat’s posterior suprasylvian sulcus and gyrus. J Comp Neurol. 1986;246:265–280. doi: 10.1002/cne.902460210. [DOI] [PubMed] [Google Scholar]
- Vidnyánszky Z, Hamori J. Quantitative electron microscopic analysis of synaptic input from cortical areas 17 and 18 to the dorsal lateral geniculate nucleus in cats. J Comp Neurol. 1994;349:259–268. doi: 10.1002/cne.903490208. [DOI] [PubMed] [Google Scholar]
- Vidnyánszky Z, Borostyankoi Z, Gorcs TJ, Hamori J. Light and electron microscopic analysis of synaptic input from cortical area 17 to the lateral posterior nucleus in cats. Exp Brain Res. 1996;109:63–70. doi: 10.1007/BF00228627. [DOI] [PubMed] [Google Scholar]
- West MJ, Gundersen HJ. Unbiased stereological estimation of the number of neurons in the human hippocampus. J Comp Neurol. 1990;296:1–22. doi: 10.1002/cne.902960102. [DOI] [PubMed] [Google Scholar]
- West MJ, Slomianka L, Gundersen HJ. Unbiased stereological estimation of the total number of neurons in the subdivisions of the rat hippocampus using the optical fractionator. Anat Rec. 1991;231:482–497. doi: 10.1002/ar.1092310411. [DOI] [PubMed] [Google Scholar]