Abstract
There is an increased interest in the development of bioactive polymeric dental composites and related materials that have potential for mineralized tissue regeneration and preservation. This study explores how the substitution of ethyl α-hydroxymethylacryate (EHMA) for 2-hydroxyethyl methacrylate (HEMA) in photo-activated 2,2-bis[p-(2'-hydroxy-3'-methacryloxypropoxy)phenyl]propane (Bis-GMA) and Bis-GMA/tri(ethylene glycol) dimethacrylate (TEGDMA) resins affected selected physicochemical properties of the polymers and their amorphous calcium phosphate (ACP) composites. Rate of polymerization and the degree of conversion (DC) of polymers {EHMA (E), HEMA (H), Bis-GMA/EHMA (BE), Bis-GMA/HEMA (BH), Bis-GMA/TEGDMA/EHMA (BTE) and Bis-GMA/TEGDMA/HEMA (BTH)} were assessed by photo-differential scanning calorimetry and Fourier-Transform Infrared (FTIR) spectroscopy. ACP/BTE and ACP/BTH composites were evaluated for DC, biaxial flexure strength (BFS), water sorption (WS) and mineral ion release. Mid-FTIR and near-IR measurements revealed the following order of decreasing DC: [E, H polymers (97.0 %)] > [BE copolymer (89.9 %)] > [BH copolymer (86.2 %)] > [BTE, BTH copolymers (85.5 %)] > [ACP/BTH composite (82.6 %)] > [ACP/BTE composite (79.3 %)]. Compared to HEMA, EHMA did not adversely affect the BFS of its copolymers and/or ACP composites. Lower WS of BTE copolymers and composites (28 % and 14 %, respectively, compared to the BTH copolymers and composites) only marginal reduced the ion release from ACP/BTE composites compared to ACP/BTH composites. More hydrophobic ACP composites with acceptable ion-releasing properties were developed by substituting the less hydrophilic EHMA for HEMA.
Keywords: amorphous calcium phosphate, composite, degree of vinyl conversion, ethyl-α-hydroxymethylacryate, ion release, mechanical strength, photo-polymerization
Introduction
When embedded in photo-polymerizable methacrylate matrices [1, 2] and exposed to aqueous milieu, amorphous calcium phosphate (ACP), an intermediate phase [3] in the formation of thermodynamically stable hydroxyapatite (HAP), has strong potential to redeposite tooth mineral [4]. ACP's bioactivity (i.e., the sustained release of Ca and PO4 ions and the subsequent spontaneous conversion of ACP into HAP) makes ACP-filled polymeric composites attractive as anti-demineralizing/remineralizing materials for the preservation or repair of enamel, dentin and/or bone. However, despite moderate improvement in their mechanical performance and the modest reduction in their polymerization shrinkage and water sorption [5-8], ACP composites still need further enhancement of their physicochemical properties to extend their clinical utility. Generally, our strategies for improving ACP composite properties have involved studies of the surface properties and particle size distribution of ACP fillers and fine-tuning of various resin systems.
The majority of the resin formulations we have investigated so far comprised 2,2-bis[p-(2'-hydroxy-3'-methacryloxypropoxy)phenyl]propane (Bis-GMA; base monomer), tri(ethylene glycol) dimethacrylate (TEGDMA; diluent monomer) and 2-hydroxyethyl methacrylate (HEMA). Hydrophilic HEMA is widely used in dental adhesive systems and in resin-modified glass ionomers. In polymeric forms it is utilized in soft contact lenses, vascular grafts, soft tissue substitutes, and as hydrogels for controlled-release delivery systems.
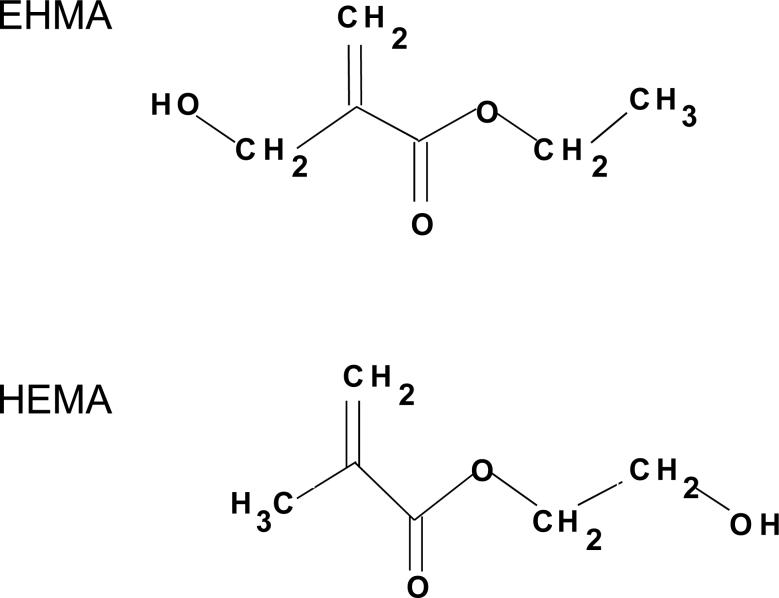
In this study, we focused on assessing the effect of substituting ethyl α-hydroxymethylacryate (EHMA), unique isomer of HEMA (Fig. 1, [9, 10]), for HEMA in Bis-GMA and in Bis-GMA/TEGDMA resins. Hypothetically, compared to HEMA-containing resins, EHMA-containing resins should exhibit considerably more intra-molecular than inter-molecular hydrogen bonding and are, thus, expected to have lower water solubility. To test this hypothesis, HEMA and EHMA homo-polymers as well as their Bis-GMA copolymers were evaluated for their relative rate of polymerization and degree of polymerization. Additionally, Bis-GMA/TEGDMA/HEMA and Bis-GMA/TEGDMA/EHMA copolymers and their composites were assessed for biaxial flexural strength (BFS), water sorption (WS) and ion release upon aqueous exposure.
Fig. 1.
Chemical structure of EHMA and HEMA monomers.
Materials and Methods
The following analytical methods/techniques were utilized to characterize EHMA, HEMA and their homo-polymers, copolymers, the ACP filler and ACP composites: Fourier-transform infrared spectroscopy (FTIR), photo-differential scanning calorimetry (DSC), gravimetry, mechanical testing (biaxial flexure strength (BFS)), 1H and 13C nuclear magnetic resonance (NMR) spectroscopy, ultraviolet/visible spectrophotometry and X-Ray diffraction (XRD). Indicated acronyms will be used throughout this manuscript.
EHMA synthesis and characterization
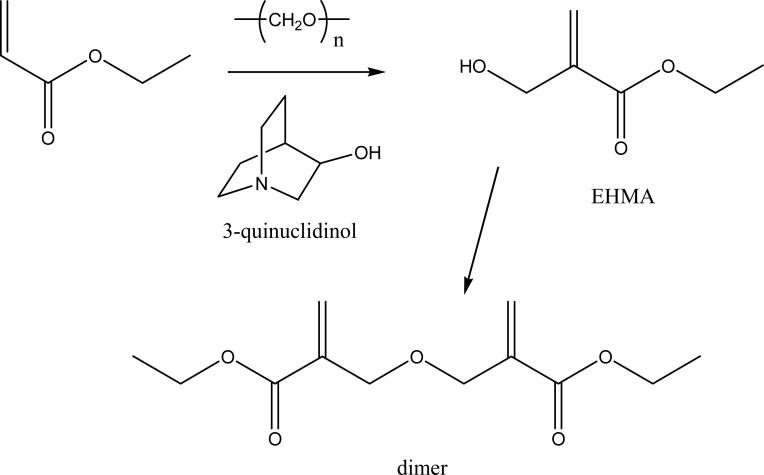
EHMA was synthesized (Fig. 2) in a stoppered flask from a reaction mixture containing 10 mmol ethyl acrylate, 10 mmol para-formaldehyde, 1.25 mmol 3-quinuclidinol, 2.5 g dimethyl sulfoxide (DMSO) and 0.85 g distilled water [11]. The mixture was heated at 100 °C for 30 min while magnetically stirred. It was then cooled to 23 °C and 3-quinuclidinol was removed by extraction with diluted hydrochloric acid. The crude product yielded a mass fraction (75 to 80) % EHMA. The addition of DMSO provided a homogeneous reaction mixture resulting in reduced reaction times and high conversion of acrylate to EHMA with minimal dimer formation. The presence of water in the reaction mixture favorably influenced the EHMA-dimer equilibrium since water is liberated during dimerization. Purified EHMA was obtained upon vacuum distillation, which successfully separated it from the dimer.
Fig. 2.
Synthesis of EHMA from ethyl acrylate.
Purified EHMA was characterized by FTIR (Nicolet Magna-IR FTIR 550 spectrophotometer, Nicolet Instrumentations Inc., Madison, WI, USA). The deconvoluted spectra were obtained using PeakFit version 4.12 (SeaSolve Software, Richmond, CA, USA). The structure of EHMA was confirmed by 1H and 13C nuclear magnetic resonance (NMR) spectroscopy (JEOL GSX-270, Peabody, MA, USA). Computer modeling of the cyclic and linear EHMA and HEMA structures was performed by utilizing CAChe software, Oxford Molecular, Portland, OR, USA.
ACP synthesis and characterization
ACP was synthesized as detailed earlier [1, 2]. It precipitated instantaneously in a closed system at 23 °C upon rapidly mixing equal volumes of a 800 mmol/L Ca(NO3)2 solution and a 536 mmol/L Na2HPO4 solution that contained a molar fraction of 2 % Na4P2O7 as a stabilizing component for ACP (to prevent premature conversion to HAP) .The suspension was filtered, the solid phase washed subsequently with ice-cold ammoniated water and acetone, and then lyophilized. To avoid exposure to humidity, ACP was kept under vacuum (2.7 kPa) until used in composite formulations.
The amorphous state of ACP was verified by powder XRD (Rigaku DMAX 2000 X-ray diffractometer, Rigaku/USA Inc., Danvers, MA, USA) and FTIR. XRD patterns were recorded from 4° to 60° 2θ with CuKα radiation (λ = 0.154 nm) at 40 kV and 40 mA. ACP samples were step-scanned in intervals of 0.010° 2θ at a scanning speed of 1.000°/min. The FTIR spectra of ACP specimens were recorded using a KBr pellet technique ((0.8 to 1.0) mg solid/400 mg KBr).
Formulation of the resins and evaluation of homopolymers and copolymers
The experimental resins were formulated from EHMA (synthesized as described above; Fig. 2) and the commercially available Bis-GMA, TEGDMA and/or HEMA monomers, and then photo-activated for visible light polymerization by the inclusion of either bis(2,6-dimethoxy benzoyl)-trimethylpentyl phosphine oxide & 2-hydroxy-2-methyl-1-phenyl-propan-1-one (1:3 mass ratio; CGI 1700; Ciba-Geigy Additives Division, Hawthorne, NY, USA) or bis(2,6-dimethoxy benzoyl)-trimethylpentyl phosphine oxide & 1-hydroxycyclohexyl phenyl ketone (1:1 mass ratio; Irgacure 1850;Ciba Specialty Chemicals Corporation, Tarrytown, NY, USA). The composition of the resins (% mass fraction) is provided in Table 1.
Table 1.
Composition (mass fraction, %) of experimental resins employed in the study.
| Resin acronym | Bis-GMA | TEGDMA | EHMA | HEMA | CGI 1700 | Irgacure 1850 |
|---|---|---|---|---|---|---|
| E | - | - | 97.00 | - | 3.00 | - |
| H | - | - | - | 97.00 | 3.00 | - |
| BE | 63.05 | - | 33.95 | 3.00 | - | |
| BH | 63.05 | - | - | 33.95 | 3.00 | - |
| BTE | 37.00 | 37.00 | 24.00 | - | - | 2.00 |
| BTH | 37.00 | 37.00 | - | 24.00 | - | 2.00 |
Photo-initiation of resins and composites
In this study we utilized two bis-acyl phosphine oxide-containing photo-initiators (CGI 1700 and Irgacure 1850) to prepare the homopolymers, copolymers and ACP composites. On exposure to blue light (470 nm) bis-acyl phosphine oxides undergo α-cleavage to form several polymerization initiation radicals.
Photo-polymerization studies
Photo-polymerization studies of homo-polymers derived from EHMA (E) or HEMA (H) as well as the corresponding copolymers with Bis-GMA (BE and BH resins) were conducted utilizing the DCS (Differential Photo-calorimeter; TA Instruments, New Castle, DE, USA) under following conditions: 30 °C; 6 min nitrogen purge before irradiation; 150 W Xe source; irradiation wavelength 470 nm; irradiation intensity 4.3 mW/cm2; resin sample mass (2 to 4) mg. Degrees of vinyl conversion (DC) of E and H homo-polymers and BE and BH copolymers were calculated based on the enthalpy of the exothermic polymerization process [12-14]. The DC of E, H, BE and BH resins was also determined by mid-FTIR after polymer films approx. 20 μm thick were formed between glass slides by visible light irradiation (16 mW/cm2) for 60 s per side (Triad 2000, Dentsply International, York, PA, USA) and post-cured at 37 °C for 24 h. The DC rates were calculated as described elsewhere [15-17].
The DC of Bis-GMA/TEGDMA/EHMA (assigned BTE) and Bis-GMA/TEGDMA/HEMA (assigned BTH) copolymers and their ACP composites were measured by near-infrared (NIR) spectroscopy [18]. NIR spectra (3 specimens/group) were acquired before photo cure (60 s per side; Triad 2000), immediately after and 24 h post-cure. DC was calculated from the % change in the integrated peak area of the 6165 cm−1 methacrylate =CH2 absorption band normalized to the 4623 cm−1 aromatic C-H absorption band area [18, 19] between the polymer and monomer.
Preparation of composite specimens
Composite pastes were made by mixing the BTE or BTH resin (mass fraction 60 %) with ACP filler (mass fraction 40 %) using hand spatulation. The homogenized pastes were kept under a moderate vacuum (2.7 kPa) overnight to eliminate the air entrained during mixing. The pastes were molded into disks (14.9 mm to 15.3 mm in diameter and 1.31 mm to 1.53 mm in thickness) by filling the circular openings of flat Teflon molds, covering each side of the mold with a Mylar film plus a glass slide, and then clamping the assembly together with spring clips. The disks were photo-polymerized by irradiating sequentially each face of the mold assembly for 60 s with visible light (Triad 2000). The unfilled copolymer disk specimens were prepared and irradiated in an identical manner.
Physicochemical testing of composites
Biaxial flexure strength (BFS) testing of the disk specimens was employed to compare the mechanical strength of BTE and BTH ACP composites. Piston-on-three-ball loading cell and a computer-controlled Universal Testing Machine (Instron 5500R, Instron Corp., Canton, MA, USA) operated by Testworks 4 software were utilized for these measurements. The BFS values of dry (after 24 h storage in the air at 23 °C) and wet (after 1 month immersion in HEPES-buffered saline solution (0.13 mol/L NaCl; pH = 7.4) at 23 °C; 100 mL saline solution/specimen) composite specimens (three specimens per group) were calculated according to ASTM F-394−78 [20].
Water sorption (WS) of BTE and BTH copolymers and composites was determined as follows. Specimens (five/group) were initially dried over CaSO4 at 23 °C until a constant mass was achieved (± 0.1 mg) and then each immersed in 40 mL saline solution for 1 month. Gravimetric mass changes of dry tissue-padded specimens were recorded at predetermined time intervals. The degree of WS of any individual specimen at a given time interval (t), expressed as mass fraction (%), was calculated using the equation:
| (1) |
where Wt is the sample mass at the time t, and Wo represents the initial mass of dry sample.
Mineral ion release from composite disk specimens was examined at 23 °C, in continuously stirred, saline solutions (initial volume of saline per composite specimen: 100 mL). 2 mL aliquots were taken at predetermined time intervals and the kinetic changes in the Ca and PO4 concentrations were determined in triplicate by utilizing spectro-photometric analytical methods [21, 22]. From the solution concentration data, the ion activity product, IAP, and the Gibbs free-energy, ΔGo, were calculated (Chemist software, MicroMath Research, St Louis, MO, USA) as described in detail in previous studies [23, 24]. The value of the solubility product, Ksp, for the stoichiometric hydroxyapatite, Ca10(OH)2(PO4)6, used in calculations was 117.1. Negative [ΔGo value signifies solution supersaturated with respect to Ca10(OH)2(PO4)6; the more negative the ΔGo value is, the higher the potential for hydroxyapatite formation under given experimental conditions.
Statistical data analysis
One standard deviation (SD) is identified in this paper for comparative purposes as the estimated standard uncertainty of the measurements. Experimental data were analyzed by ANOVA (α = 0.05). Significant differences between the groups were determined by all pair-wise multiple comparisons (two tail t-test; unequal variances).
Results
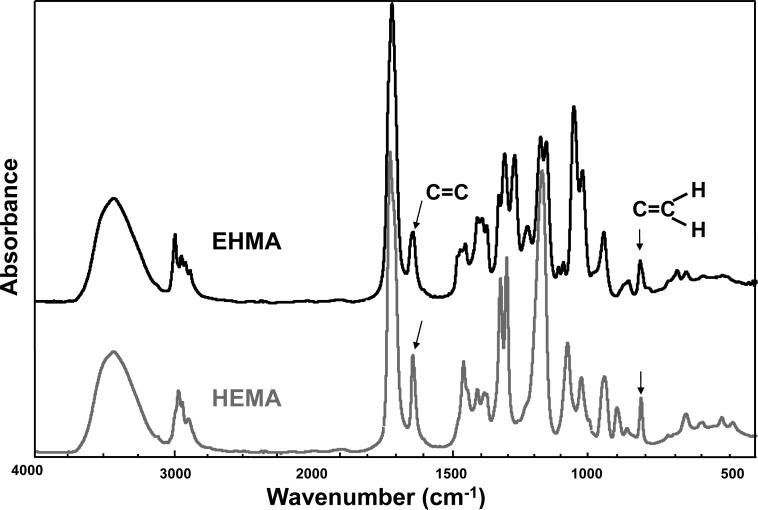
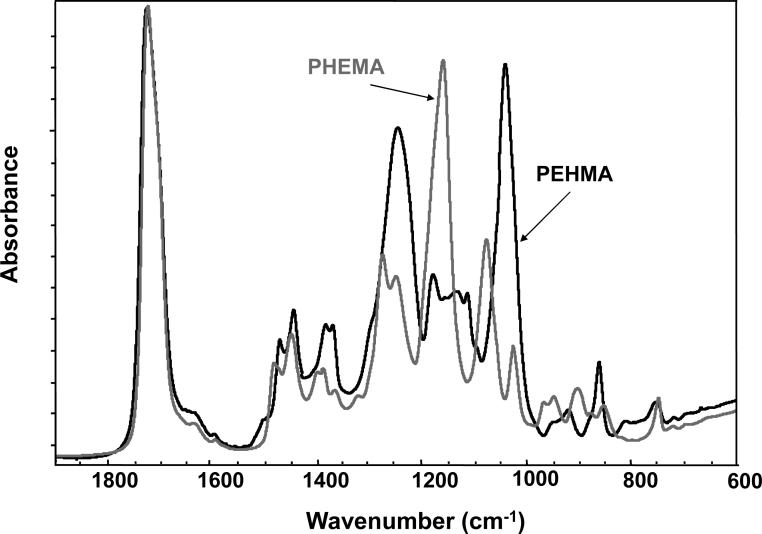
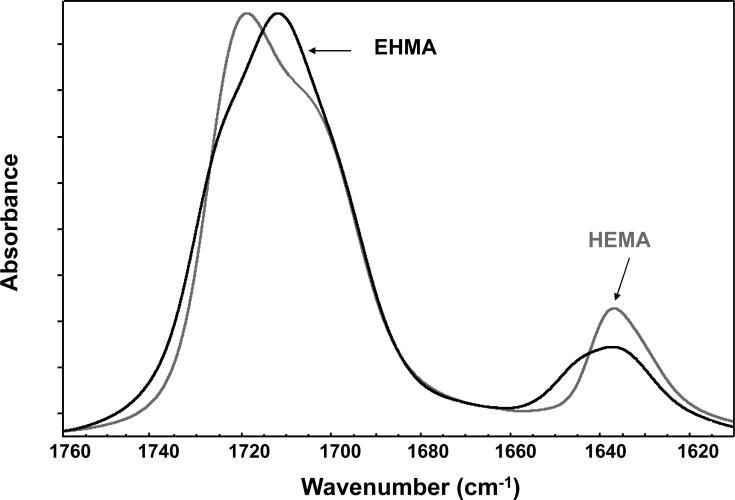
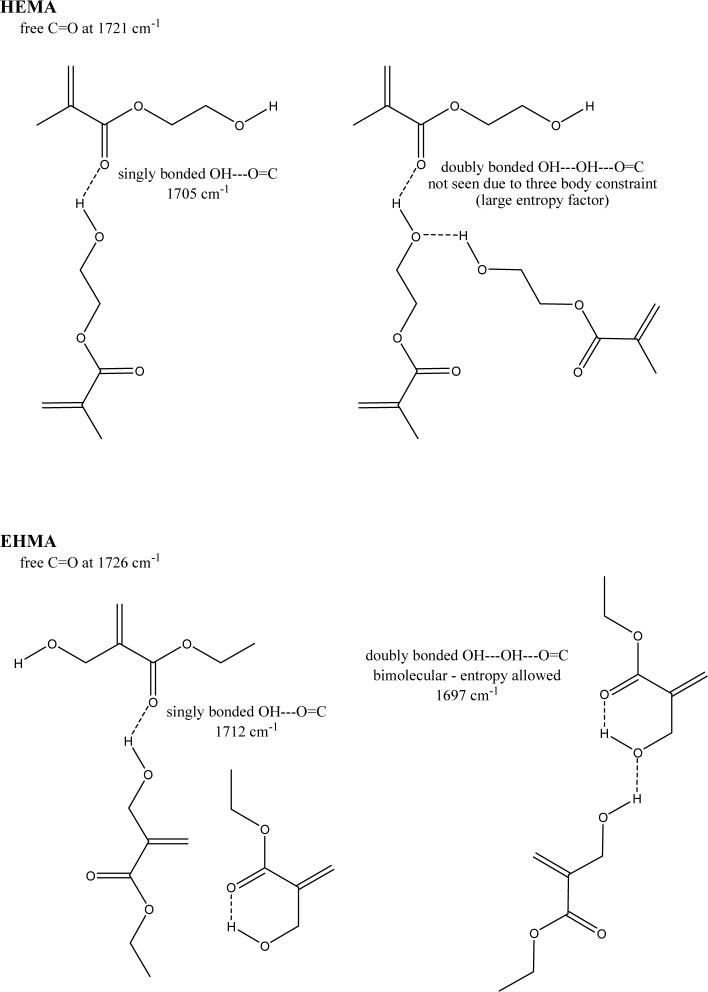
For comparison, typical FTIR spectra of EHMA and HEMA are shown in Fig. 3. Similarly, spectra of the corresponding homo-polymers (PEHMA and PHEMA, respectively) are compared in Fig. 4 and showed virtually no residual vinyl absorption bands. The expanded FTIR spectra emphasizing both the carbonyl and vinyl absorption bands of the monomers are given in Fig. 5. Both carbonyl bands have unresolved structure and the vinyl band of EHMA is a doublet. Hydrogen bonding for the carbonyl groups in HEMA and EHMA are shown in Fig. 6.
Fig. 3.
FTIR spectrum of EHMA compared to the spectrum of HEMA.
Fig. 4.
FTIR spectra of PEHMA and PHEMA homo-polymers.
Fig. 5.
Expanded FTIR spectra showing carbonyl and vinyl absorption bands of EHMA and HEMA monomers.
Fig. 6.
Schematic presentation of hydrogen bonding in HEMA and EHMA derived from deconvoluted FTIR spectra.
The 1H NMR spectral data for EHMA (also confirmed by 13C NMR) were as follows: 1.33 (CH2CH3), 4.26 (CH2CH3), 4.32 (CH2OH), 5.84 and 6.27 (=CH2). These are the chemical shifts in CDCl3 and they are reported with units of ppm.
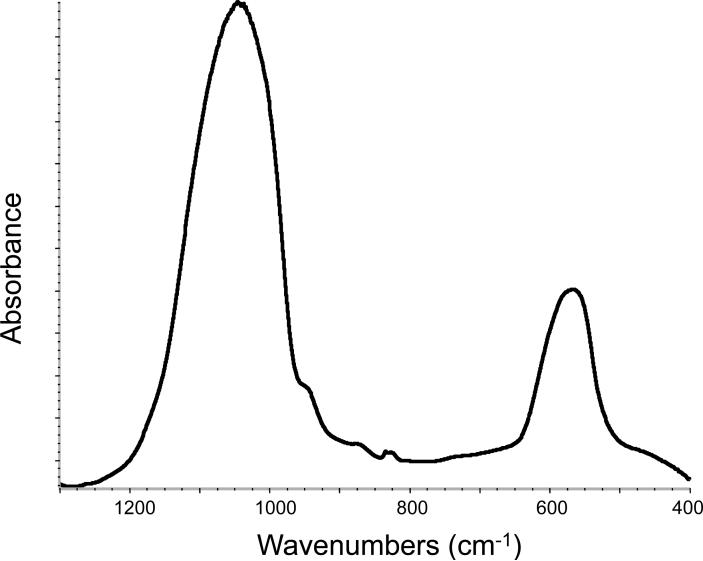
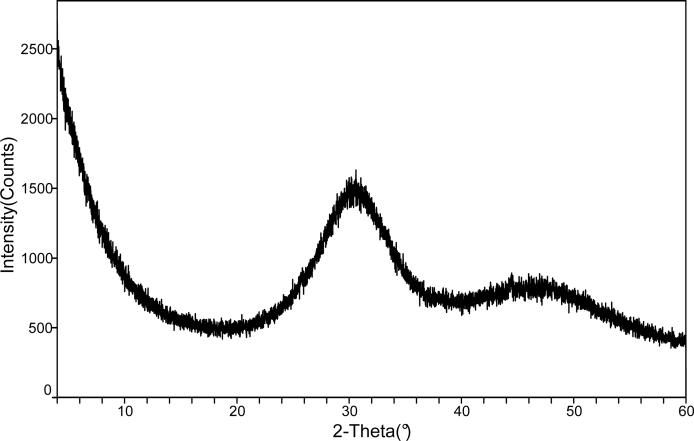
The ACP filler employed in this study showed the typical features of amorphous calcium phosphate solid with two broad phosphate absorbance bands at (1200 to 900) cm−1 and (630 to 550) cm−1 in its FTIR spectrum and two diffuse broad bands in the 2θ = (4 to 60)o region of its XRD pattern (Fig. 7 a, b).
Fig. 7.
FTIR spectrum (a) and XRD pattern (b) of the ACP filler utilized in the study.
Photo-DSC measurements revealed the maximum heat flow values of (3.2 ± 0.1) W/g and (7.6 ± 0.2) W/g for EHMA and HEMA homo-polymers, respectively. Heat flow maxima obtained for Bis-GMA/EHMA and Bis-GMA/HEMA copolymers were (12.9 ± 0.4) W/g and (15.9 ± 0.5) W/g, respectively. The values of DC calculated from the photo-DCS data and that measured by mid-FTIR and/or NIR spectroscopy are compiled in Table 2. Mean DC values (DSC data) obtained for the homo-polymerizations were essentially identical (72.6 % and 73.5 % for EHMA and HEMA, respectively). BE and BH copolymers attained on average 59.9 % and 63.4 % vinyl conversion, respectively. Under different polymerization conditions, the mean DC values (mid-FTIR and NIR measurements) decreased in the following order: [E, H homo-polymers (97.0 %)] > [BE copolymer (89.9 %)] > [BH copolymer (86.2 %)] > [BTE, BTH copolymers (85.5 %)] > [ACP/BTH composite (82.6 %)] > [ACP/BTE composite (79.3 %)].
Table 2.
Photo-DSC results and degree of conversion (DC; mean ± standard deviation) calculated from photo-DSC (DCDSC) and FTIR (DCFTIR; a - mid FTIR data, b - NIR data) measurements (24 h post-cure).
| Material group |
Polymerization kinetics (photo-DCS data) | DCDSC (%) |
DCFTIR (%) |
|
|---|---|---|---|---|
| Time to Rmax (s) |
Rmax (W/g) |
|||
| E homopolymer |
82.8 |
3.2 |
72.6 ± 2.2 |
97.0 ± 0.9a |
| H homopolymer |
56.4 |
7.6 |
73.5 ± 2.2 |
97.0 ± 0.9a |
| BE copolymer |
6.0 |
12.9 |
59.9 ± 1.8 |
89.9 ± 0.8a |
| BH copolymer |
6.0 |
15.9 |
63.4 ± 1.9 |
86.2 ± 0.8a |
| BTE copolymer |
- |
- |
- |
85.5 ± 0.2b |
| BTH copolymer |
- |
- |
- |
85.4 ± 1.7b |
| BTE ACP composite |
- |
- |
- |
79.3 ± 0.8b |
| BTH ACP composite | - | - | - | 82.6 ± 1.7b |
- mid FTIR data
- NIR data
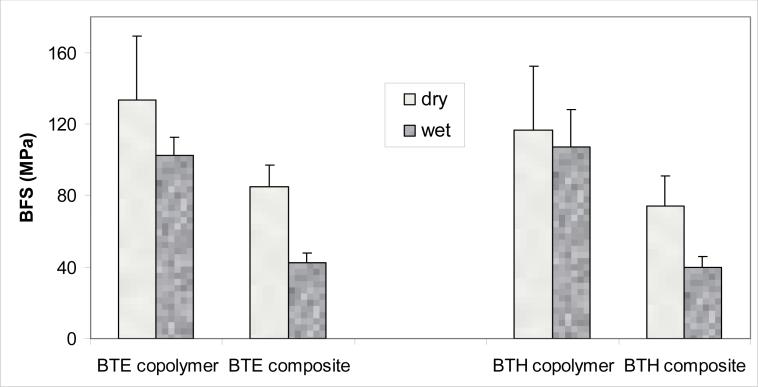
The results of the BFS testing of dry (before immersion) and wet (after 1 mo immersion in saline) specimens are summarized in Fig. 8. The higher BFS values of dry BTE copolymer and dry ACP/BTE composite specimens [(134 ± 35) MPa and (85 ± 12) MPa, respectively] compared to the BFS values of the corresponding BTH specimens [(117 ± 36) MPa and (74 ± 17) MPa, respectively] were not statistically significant (p > 0.05). Similarly, there was no statistically significant difference between the BFS values of wet BTE copolymer [(103 ± 10) MPa] and wet BTH copolymer [(107 ± 21) MPa] specimens. The BFS values of wet composite specimens after 1 month of saline immersion were practically identical for both groups: (43 ± 5) MPa for ACP/BTE composites vs. (40 ± 6) MPa for ACP/BTH composites. In both groups, the mechanical strength of wet ACP composites decreased approximately 60 % compared to the corresponding wet copolymers.
Fig. 8.
Biaxial flexure strength (BFS; mean value + standard deviation) of dry and wet (after 1 mo immersion in saline solution) BTE and BTH copolymer and composite specimens.
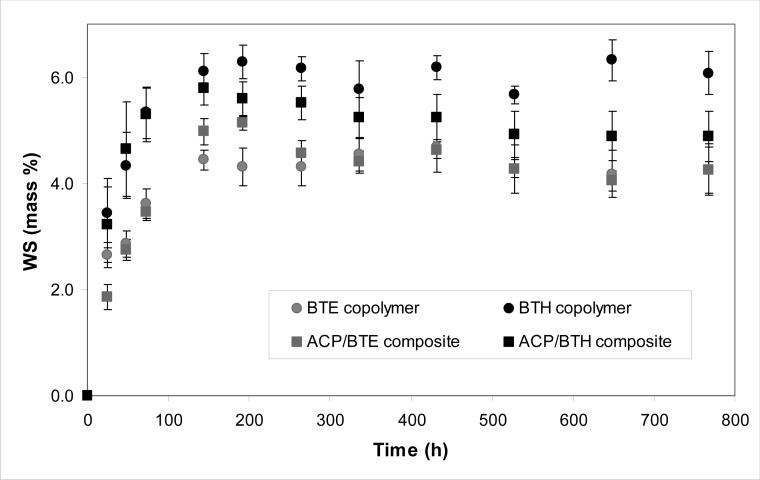
The WS kinetic data are presented in Fig. 9. BTE copolymer absorbed a maximum mass fraction (Wmax) of (4.39 ± 0.16) % water compared to (6.07±0.25) % in BTH copolymers. These WS levels were reached within (168 to 192) h in both copolymer and composite systems. Significantly, after reaching maximum values ((5.14 ± 0.14) % and (5.59 ± 0.33) % for ACP/BTE and ACP/BTH composites, respectively), the overall mass change of composites started to decline (the WS values recorded at 768 h were 21 % and 16 % lower than the WSmax values attained in ACP/BTE and ACP/BTH composites, respectively).
Fig. 9.
Water sorption (WS) of BTE and BTH copolymers and their ACP composites. Indicated values represent mean ± standard deviation (indicated by bars) for five specimens in each experimental group.
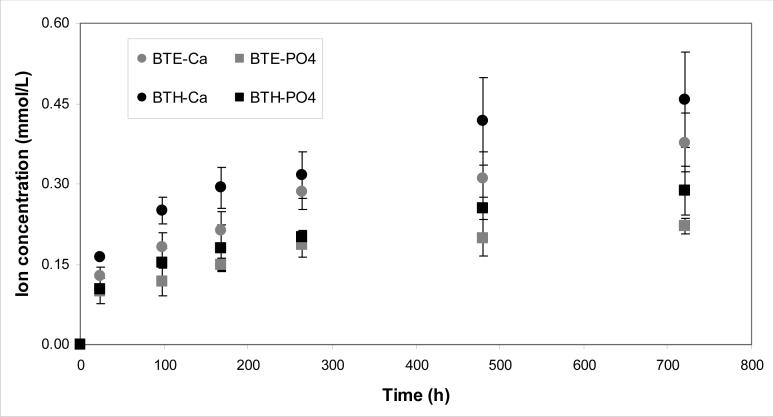
Kinetics of Ca and PO4 release from BTE/ACP and BTH/ACP composites are shown in Fig. 10. The thermodynamic calculations for the 1 month immersion solution concentration of Ca and PO4 revealed that supersaturation with respect to hydroxyapatite (the measure of the anti-demineralizing/remineralizing capacity) was significantly above the minimum required (ΔG0 < 0) for mineral redeposition to occur in both BTH/ACP (ΔGo = − (3.4 ± 0.2) kJ/mol) and BTE/ACP (ΔGo = − (2.8 ± 0.2) kJ/mol) composites.
Fig. 10.
Kinetics of ion release [mean values ± standard deviation (indicated by bars)] from BTE/ACP and BTH/ACP composites.
Discussion
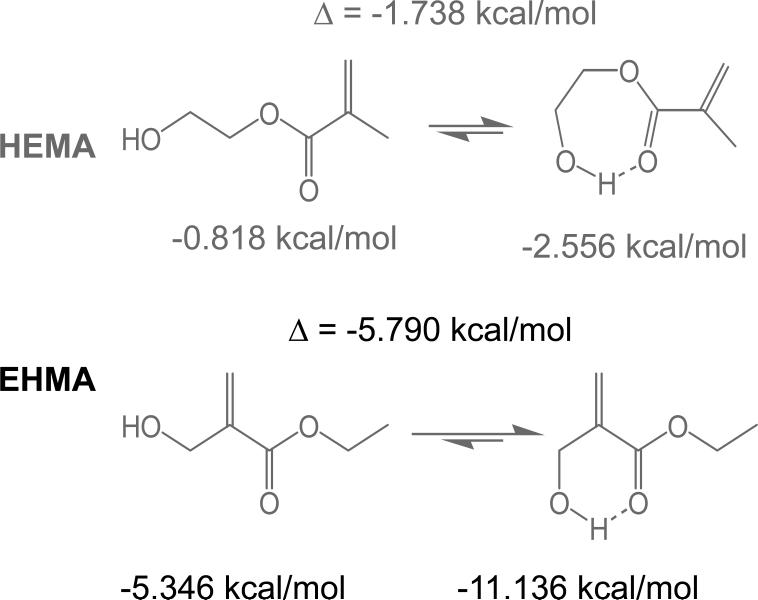
A facile high yield synthesis for the preparation of highly pure EHMA has been developed involving the 3-quinuclidinol-catalyzed reaction of ethyl acrylate with paraformaldehide in a mixed solvent of DMSO/water. EHMA's structure was characterized by FTIR and NMR spectroscopy. Additionally, computer modeling of the linear and cyclic structures of EHMA vs. HEMA (Fig. 11) indicated that EHMA forms a much more stable intra-molecular hydrogen bonded structure than HEMA (6-membered vs. 7-membered ring structure). These structural differences appear to be validated by FTIR analysis of the carbonyl absorption band of each monomer (Fig. 5). The simplest way to look at the relative degrees of hydrogen bonding for the carbonyl groups in HEMA and EHMA is to compare the peak maxima before any data processing. HEMA C=O max occurs at 1719 cm−1 vs. 1712 cm−1 for EHMA. The lower wavenumber (longer bond) for EHMA is indicative of stronger overall hydrogen bonding. One can also look at the free C=O peak contribution to the overall carbonyl absorbance. The deconvoluted spectra (not shown) for HEMA show about half of the carbonyl is in the non-bonded state [25] while the fraction for EHMA is considerably less (between 20 % and 28 % depending on the deconvolution technique). The schematic presentation of hydrogen bonding in HEMA and EHMA derived from deconvoluted FTIR spectra is shown in Fig. 6. To explain the presence of the significant third peak in the EHMA carbonyl, the hydrogen bond has to be significantly stronger than that of the normal hydrogen bond (1697 cm−1 vs. 1712 cm−1). Just invoking an intramolecular hydrogen bond does not generally mean the bond is any stronger than a similar intermolecular H bond. Stronger hydrogen bonds involving the same functionality arises when there is cooperative interaction resulting in additive effects. Therefore, the 3rd peak in EHMA may be a result of intramolecular hydrogen bonding only when this configuration is augmented by an additional cooperative intermolecular hydrogen bonding interaction. The intermediate peak in EHMA is the combination of singly bonded interactions, both intra- and inter-molecular. The reason this is not seen to any significant extent in HEMA is probably because the intramolecular interactions are minimal, which means three HEMA molecules would have to line up with high entropy costs relative to the overall stabilization factor. Conversely, the HEMA OH region does show singly and doubly bonded interactions because the OH-OH interactions are more favorable and allow the entropy barrier to be overcome in that case.
Fig. 11.
Results of the computer modeling indicating the minimized energies for the linear and cyclic HEMA and EHMA structures.
Compared to HEMA, EHMA is more hydrophobic and significantly less soluble in water, probably as a result of the different patterns of hydrogen bonding in the two isomers. The rates of photo-polymerization of EHMA, as determined by photo-DSC, were somewhat lower than those obtained with HEMA (see Table 2). However, with Bis-GMA as a comonomer, the rates of copolymerization were practically identical for both isomers. Significantly, the final DC values of both homo-polymers as well as BE and BH copolymers, determined by both photo-DSC and FTIR measurements (Table 2), were essentially equivalent. Ternary monomer mixtures BTE and BTH yielded well formed polymers and ACP composites. Their DC values were over 85 % and were reduced only slightly upon introduction of AP filler (7 % and 4 % for EHMA- and HEMA-containing resin, respectively).
The mechanical strength (i.e., BFS) of both dry and wet ACP/BTE and ACP/BTH composites was lower than the corresponding copolymers under both dry and wet conditions (Fig. 8). Multiple factors may have contributed to this reduction in strength of ACP composites: 1) uneven dispersion of large ACP agglomerates throughout the composite; 2) excessive water sorption, 3) the intra-composite ACP to apatite conversion taking place during aqueous immersion and 4) rigidity at the filler/matrix interface originating from spatial changes that may have occurred during mineral ion release. It appears that, as already shown in our earlier work with different resin formulations [2, 7, 8], the inability of ACP filler to closely interact with the resin again had a major role in controlling the mechanical behavior of these composites. A high number of non-bonding spaces (voids at the filler/matrix interface) that existed in both ACP/BTE and BTH composites is liable for their mechanical behavior.
The overall WS by ACP filled composites is a result of the water absorbed by both the resin matrix and the ACP filler. The copolymers formulated with more hydrophilic HEMA absorbed on average 37 % more water compared to copolymers formulated with less hydrophilic EHMA. However, the WSmax values of ACP/BTE and ACP/BTH composites were only slightly higher (15 %) in EHMA-containing composites and 8.5 % lower in HEMA-containing composites compared to the corresponding unfilled copolymers. This is most likely due to the loss of calcium and phosphate due to the intra-composite dissolution of ACP and its conversion to hydroxyapatite, a water-catalyzed process that occurs in parallel to water sorption. Overall, the affinity for water sorption in BTE and BTH resin composites has been only marginally affected by substituting EHMA for HEMA in the resins.
Ca and PO4 solution concentrations resulting from the conversion of ACP filler into apatite upon aqueous exposure (Fig. 10) suggest that, under given experimental conditions (buffered saline solution; pH = 7.40), ion release kinetics was similar for both BTE and BTH resin composites. No accelerated ion release was seen in more hydrophilic BTH formulations although they had, expectedly, shown moderately higher overall WS values. This, minimally higher ion release in ACP/BTH composites compared to ACP/BTE composites, could be possibly attributed to somewhat higher internal mineral saturation levels as a result of water being more easily absorbed by HEMA-containing composites. Since both solutions were significantly supersaturated with respect to hydroxyapatite, substituting EHMA for HEMA in ternary Bis-GMA/TEGDMA-based resins did not compromise the remineralizing potential of their ACP composites.
Conclusions
EHMA shows decreased affinity for water compared to HEMA. Despite the somewhat lower rates of polymerization of EHMA homo-polymers and copolymers, their final conversion values are essentially equivalent to those of HEMA homo-polymers and copolymers. Significantly, the WS and BFS of BTE and BTH copolymers and the corresponding ACP/BTE and ACP/BTH composites were equivalent and the ion release from both types of composites was also practically identical. In light of these results, EHMA can be considered as a suitable substitute for HEMA in dental and, possibly, biomedical applications.
Acknowledgements
Reported work was supported by the National Institute of Dental and Craniofacial Research (NIDCR: grant DE 13169 to the American Dental Association Foundation (ADAF) and the National Institute of Standards and Technology (NIST)/NIDCR Interagency Agreement XI-DE-7006). It is a part of the dental material research program conducted by NIST in cooperation with ADAF and was also supported by both NIST and ADAF. Generous contribution of Bis-GMA, TEGDMA and HEMA monomers from Esstech, Essington, PA, USA, and CGI 1700 from Ciba Specialty Chemicals Corporation, Tarrytown, NY, USA is gratefully acknowledged. Authors also acknowledge technical assistance of Mr. J.N.R. O'Donnell.
Footnotes
”Official contribution of the National Institute of Standards and Technology; not subject to copyright in the United States”
Disclaimer. Certain commercial materials and equipment are identified in this article to specify the experimental procedure. In no instance does such identification imply recommendation or endorsement by NIST or ADAF or that the material and equipment identified is necessarily the best available for the purpose.
References
- 1.SKRTIC D, ANTONUCCI JM, EANES ED, EICHMILLER FC, SCHUMACHER GE. J. Biomed. Mat. Res. (Appl. Biomater.) 2000;53:381. doi: 10.1002/1097-4636(2000)53:4<381::aid-jbm12>3.0.co;2-h. [DOI] [PubMed] [Google Scholar]
- 2.SKRTIC D, ANTONUCCI JM, EANES ED. J. Res. Natl. Inst. Stands. Technol. 2003;108(3):167. doi: 10.6028/jres.108.017. [DOI] [PMC free article] [PubMed] [Google Scholar]
- 3.EANES ED. Octacalcium phosphate. Karger; Basel: 2001. p. 130. [Google Scholar]
- 4.SKRTIC D, HAILER AW, TAKAGI S, ANTONUCCI JM, EANES ED. J. Dent. Res. 1996;75(9):1679. doi: 10.1177/00220345960750091001. [DOI] [PubMed] [Google Scholar]
- 5.O'DONNELL JNR, ANTONUCCI JM, SKRTIC D. J. Bioact. Comp. Polym. 2006;21(3):169. doi: 10.1177/0883911506064476. [DOI] [PMC free article] [PubMed] [Google Scholar]
- 6.LEE SY, REGNAULT WF, ANTONUCCI JM, SKRTIC D. J. Biomed. Mater. Res. 2007;80B:11. doi: 10.1002/jbm.b.30561. [DOI] [PMC free article] [PubMed] [Google Scholar]
- 7.SKRTIC D, ANTONUCCI JM. J. Biomat. Appl. 2007;21:375. doi: 10.1177/0885328206064823. [DOI] [PMC free article] [PubMed] [Google Scholar]
- 8.SKRTIC D, ANTONUCCI JM, EANES ED, EIDELMAN N. Biomaterials. 2004;25:1141. doi: 10.1016/j.biomaterials.2003.08.001. [DOI] [PubMed] [Google Scholar]
- 9.AVCI D, MATHIAS LJ, THIGPEN K. J. Polym. Sci.: Polym. Chem. 1996;34(15):3191. [Google Scholar]
- 10.ANTONUCCI JM, STANSBURY JW, FOWLER BO. Polym. Preprints. 2000;41(2):1616. [Google Scholar]
- 11.STANSBURY JW. Macromolecules. 1993;26:2981. [Google Scholar]
- 12.ANTONUCCI JM, TOTH EE. J. Dent. Res. 1983;23:791. doi: 10.1177/00220345830620020701. [DOI] [PubMed] [Google Scholar]
- 13.MIYAZAKI K, HORIBE TJ. J. Biomed. Mater. Res. 1988;22:1011. doi: 10.1002/jbm.820221105. [DOI] [PubMed] [Google Scholar]
- 14.URABE H, WAKASA K, YAMAKI M. J. Mater. Sci. 26(1991):3185. [Google Scholar]
- 15.WU WL, FANCONI BM. Polym. Engng. Sci. 23(1983):704. [Google Scholar]
- 16.FERACANE JL, GREENER EH. J. Dent. Res. 63(1984):1093. doi: 10.1177/00220345840630081901. [DOI] [PubMed] [Google Scholar]
- 17.RUEGGEBERG F, HASHINGER DT, FAIRHURST CW. Dent. Mater. 6(1990):241. doi: 10.1016/S0109-5641(05)80005-3. [DOI] [PubMed] [Google Scholar]
- 18.STANSBURY JW, DICKENS SH. Dent. Mater. 17(2001):71. doi: 10.1016/s0109-5641(00)00062-2. [DOI] [PubMed] [Google Scholar]
- 19.LIN-GIBSON S, LANDIS FA, DRZAL PL. Biomaterials. 2006;27:1711. doi: 10.1016/j.biomaterials.2005.10.040. [DOI] [PubMed] [Google Scholar]
- 20.ASTM F394−78. Standard test method for biaxial strength (modulus of rupture) of ceramic substrates. (re-approved 1996).
- 21.VOGEL GL, CHOW LC LC, BROWN WE. Caries Res. 1983;7:23. doi: 10.1159/000260645. [DOI] [PubMed] [Google Scholar]
- 22.MURPHY J, RILEY P. Anal. Chim. Acta. 1962;27:31. [Google Scholar]
- 23.ANTONUCCI JM, SKRTIC D. J. Bioact. Comp. Polym. 2005;20:29. [Google Scholar]
- 24.ANTONUCCI JM, SKRTIC D. Polymers for Dental and Orthopedic Applications. CRC Press; Boca Raton: 2007. p. 217. [Google Scholar]
- 25.TRUJILLO MT, JONES MS, STANSBURY JW. J. Biomed. Mater. Res.: Part A. 2007;83A:734. doi: 10.1002/jbm.a.31448. [DOI] [PubMed] [Google Scholar]


