Abstract
The pretectum (PT) can supply the pulvinar nucleus (PUL), and concomitantly the cortex, with visual motion information through its dense projections to the PUL. We examined the morphology and synaptic targets of pretecto-pulvinar (PT-PUL) terminals labeled by anterograde transport in the cat. By using postembedding immunocytochemical staining for γ-aminobutyric acid (GABA), we additionally determined whether PT-PUL terminals or their postsynaptic targets were GABAergic. We found that the main projection from the PT to the PUL is an ipsilateral, non-GABAergic projection (72.4%) that primarily contacts thalamocortical cell dendrites (87.6%), and also the dendritic terminals of interneurons (F2 profiles; 12.4%). The PT additionally provides GABAergic innervation to the PUL (27.6% of the ipsilateral projection), which chiefly contacts relay cell dendrites (84.6%) but also GABAergic profiles (15.4%). These GABAergic pretectal terminals are smaller, beaded fibers that likely branch to bilaterally innervate the PUL and dLGN, and possibly other targets. We also examined the neurochemical nature of PT-PUL cells labeled by retrograde transport and found that most are non-GABAergic cells (79%) and devoid of calbindin. Taking existing physiological and our present morphological data into account, we suggest that, in addition to the parietal cortex, the non-GABAergic PT-PUL projection may also strongly influence PUL activity. The GABAergic pretectal fibers, however, may provide a more widespread influence on thalamic activity.
Indexing terms: thalamus, visual system, jerk neurons, eye movements, GABA
The feline pulvinar nucleus (PUL) receives input from the pretectum (PT; Graybiel, 1972; Berman, 1977; Itoh, 1977; Berson and Graybiel, 1978; Graybiel and Berson, 1980; Weber et al., 1986; Schmidt et al., 2001), as well as a wide array of visual cortical areas (Raczkowski and Rosenquist, 1983; Baldauf et al., 2005). The PUL contains neurons that respond to movements in the visual field and also during saccadic eye movements (for review, see Chalupa, 1991; Casanova, 2003). Likewise, the feline PT contains a variety of cell types that are active during saccadic eye movements or in response to the movement of visual stimuli (Hoffmann and Schoppmann, 1975; Schoppmann and Hoffmann, 1979; Ballas and Hoffmann, 1985; Hoffmann and Distler, 1989; Schmidt and Hoffmann, 1992; Sudkamp and Schmidt, 1995; Schmidt, 1996; Missal et al., 2002). Specifically, pretecto-pulvinar (PT-PUL) cells have large receptive fields, are not directionally selective, and-have been shown to respond with a short burst of action potentials in response to rapid, jerk-like stimulus displacements (Sudkamp and Schmidt, 1995). Pretectal neurons with these response properties have been termed “jerk” neurons (Schoppmann and Hoffmann, 1979; Ballas and Hoffmann, 1985). Their activity is modulated in response to saccadic eye movements made in the light but not in the dark. Because the responses of PT-PUL neurons are similar to neurons in the PUL, it has been proposed that the PT-PUL projection may provide a driving input to at least a subset of PUL neurons (Sudkamp and Schmidt, 2000; Schmidt et al., 2001).
Although the pretectal cells that project to the feline PUL are located in the same compartments as those that project to the dorsal lateral geniculate nucleus (dLGN), several studies suggest that the pretectogeniculate (PT-LGN) and PT-PUL neurons form separate populations (Kubota et al., 1988; Schmidt, 1996). Like PT-PUL neurons, PT-LGN cells respond to large image displacements, but the activity of PT-LGN neurons can be modulated by saccadic eye movements made in the light or in the dark (“saccade” cells; Schmidt and Hoffmann, 1992; Schmidt, 1996). In addition, PT-LGN neurons contain γ-aminobutyric acid (GABA) and the messenger RNA for glutamic acid decarboxylase (GAD; Cucchiaro et al., 1991; Wahle et al., 1994; Wang et al., 2002a), whereas PT-PUL cells are reported to be non-GABAergic (Schmidt et al., 2001). Therefore, the role of the pretectal projection to the PUL is likely to be distinct from that of the PT-LGN projection.
The goal of this study was to examine the synaptic arrangements of PT-PUL terminals, as well as the distribution and neurochemical nature of the PT-PUL cells, as a first step toward understanding how subcortical inputs may influence the response properties of PUL neurons. In the previous accompanying paper, we describe the synaptic arrangements and cells of origin of the cortical input to the PUL (Baldauf et al., 2005). Some of these results were published previously in abstract form (Wang and Bickford, 2000; Wang et al., 2001).
MATERIALS AND METHODS
Experimental animals
Eight cats, each weighing 3–4 kg, were used in this study. All procedures were conducted in accordance with National Institute of Health Guidelines for the Care and Use of Laboratory Animals and were approved by either the University of Louisville or the University of Mississippi Medical Center Animal Care and Use Committee. Tracers were placed in the PUL of four cats and the PT of four cats (Table 1).
TABLE 1.
Summary of the Injections Made in the PUL and PT
| Cat | Injection site | Tracer |
|---|---|---|
| 00–01R | PUL | GFM |
| 00–07L | PUL | GFM |
| 00–07R | PUL | RFM |
| 03–01R | PUL | FDA |
| 03–09R | PUL | WGA-HRP |
| 01–02L | PT | PhaL |
| 01–09L | PT | BDA |
| 02–04R | PT | PhaL |
| 03–05R | PT | PhaL |
FDA, fluorescein conjugated to dextran amine (3000 molecular weight; Molecular Probes, Eugene, OR); GFM, green fluorescent microspheres (Luma Fluor, Naples, FL); PhaL, Phaseolus vulgaris leucoagglutinin (Vector, Burlingame, CA); RFM, red fluorescent microspheres (Luma Fluor); WGA-HRP, wheat germ agglutinin conjugated to horseradish peroxidase (Sigma, St. Louis, MO). For other abbreviations, see list.
Retrograde tracing
The four cats receiving PUL injections were anesthetized as described in the accompanying paper (Baldauf et al., 2005). A 1-μl Hamilton syringe containing an undiluted solution of green fluorescent microspheres (GFM) or red fluorescent microspheres (RFM), or a 10% solution of fluorescein conjugated to dextran amine (FDA), or a 2% solution of wheat germ agglutinin-horseradish peroxidase (WGA-HRP) was lowered vertically into the PUL (located using Horsley–Clarke coordinates), and 0.04–0.2 μl was injected. One week or 2 days after the injections, the animals were given an overdose of sodium pentobarbital (30 mg/kg i.v.) and perfused with a fixative solution of 4% paraformaldehyde (fluorescent cases) or 1% or 2% paraformaldehyde and 2% glutaraldehyde (FDA, WGA-HRP cases) in phosphate buffer (0.1 M, pH 7.4; PB). The following day, the brains were cut into 50-μm-thick coronal sections using a vibratome.
Sections containing FDA were processed as described in the accompanying paper (Baldauf et al., 2005). Sections containing pretectal cells labeled with GFM were stained for calbindin or GAD as described below. Sections containing WGA-HRP were reacted with 3,3′5,5′ tetramethylbenzidine (TMB; Sigma) stabilized with ammonium molybdate and 3,3′-diaminobenzidine (DAB), intensified with cobalt chloride (Horn and Hoffman, 1987), and then the sections were stained for calbindin or GABA as described below.
Immunohistochemistry for GABA, GAD, and calbindin
Sections containing pretectal cells labeled with GFM or the TMB/DAB reaction product were incubated in either an anti-GAD antibody (raised in rabbit; Chemicon International, Temecula, CA; diluted 1:1,000), anti-GABA antibody (raised in rabbit; Sigma Chemical Company, St. Louis, MO, diluted 1:2,000), or an anti-calbindin antibody (Sigma; diluted 1:10,000) overnight at 4°C in PB with 1% normal goat serum and 0.5% Triton. The sections were then rinsed in PB and incubated at a 1:100 dilution of either a biotinylated goat anti-rabbit or biotinylated goat anti-mouse antibody (both from Vector). Sections that contained GFM were then rinsed in PB and incubated in a 1:100 dilution of avidin conjugated to Alexa-546 (Molecular Probes, Eugene, OR). These sections were then rinsed, mounted, cover-slipped, and viewed under blue (to reveal GFM in PT-PUL cells) or green (to reveal calbindin or GAD) epifluorescent illumination. Sections that contained TMB/DAB reaction product were incubated in a 1:100 avidin–biotin–HRP complex solution (ABC; Elite Vectastain ABC Kit; Vector), and the HRP was revealed with a DAB reaction. The sections were then mounted on slides, cover-slipped, and viewed under transmitted illumination to distinguish the black crystalline TMB/DAB reaction product (PT-PUL cells) from the homogeneous brown DAB reaction product (GABA or calbindin).
Anterograde tracing
The four cats receiving PT injections were anesthetized as described in the accompanying paper (Baldauf et al., 2005). One cat received bilateral injections of biotinylated dextran amine (BDA) in the PT, and three cats received unilateral injections of Phaseolus vulgaris leucoagglutinin (PhaL) in the PT. For the BDA injections, three 0.1-μl injections of 5% BDA were placed in the PT using a 1-μl Hamilton syringe. For the PhaL injections, a 2.5% solution of PhaL was injected through a glass micropipette (20–30 μm-tip diameter) using 5–7 μA of continuous positive current for 10 minutes at each of the three to four sites. After a 7-day survival period, the cats were given an overdose of sodium pentobarbital (30 mg/kg i.v.) and perfused with Tyrode’s solution, followed by 2 liters of a fixative solution containing 1% or 2% paraformaldehyde and 1% or 2% glutaraldehyde. A vibratome was used to cut sections through the thalamus (50 μm thick), and the BDA was tagged with ABC solution. PhaL was revealed by using a biotinylated goat anti-PhaL antibody diluted 1:200 (Vector, lot no. F0623), followed by ABC solution. In each case, the HRP was revealed with a nickel-enhanced DAB reaction. Sections were either mounted and cover-slipped, or they were post-fixed in 2% osmium tetroxide solution, dehydrated in an ascending alcohol series, and embedded in Durcupan epoxy resin.
Ultrastructural analysis
For ultrastructural analysis of PT-PUL terminals, ultrathin sections were cut from blocks of the PUL that contained PhaL-labeled pretectal terminals, and every fifth section was collected on nickel slot grids. Every third section in this collection was stained for GABA as described in the accompanying paper (Baldauf et al., 2005). By using a Philips CM 10 electron microscope, we observed PhaL-labeled pretectal terminals in all GABA-stained sections. In blocks from two cases (01-02L, 02-04R), we photographed every field in which they made a synaptic contact in the ipsilateral PUL. For PhaL-labeled profiles in the contralateral PUL (02-04L), we photographed every labeled profile regardless of whether it was involved in a synapse.
For ultrastructural analysis of the presumed branches of PT-PUL axons within the LGN (labeled after FDA injections in the PUL, 03-01R), ultrathin sections were cut from blocks of the LGN that contained labeled terminals and axons. Every fifth section was collected on grids, and every second or third section in the series was then stained to reveal GABA, and every labeled profile in GABA-immunostained sections was photographed regardless of whether it was involved in a synapse.
Data analysis
Size measurements
Somata in the PT labeled by immunocytochemistry or retrograde transport were drawn with the aid of a camera lucida attachment, and their area was measured using a Summasketch II digitizing tablet (Summagraphics, Seymour, CT) and Sigma ScanPro 4.0 software (Jandel Scientific, San Rafael, CA). The digitizing tablet and software were also used to measure the minor diameter and area of labeled terminals and their postsynaptic targets and the length of each synaptic contact.
Quantification of GABA immunoreactivity
The analysis of postembedding GABA immunostaining was similar to previously described methods (Baldauf et al., 2005). We calculated the density of gold particles overlying labeled PT-PUL terminals and their postsynaptic targets and compared this distribution with the density overlying large terminals with round vesicles (RL profiles), identified by their large size, dark mitochondria, numerous round vesicles, and distinctive synaptic arrangements (Ito and Atencio, 1976, Wang et al., 2002b; Baldauf et al., 2003, 2005). We considered the gold density overlying RLs (only those that had a minor diameter larger than that of the largest PT-PUL terminal) to be an indicator of background staining of a known non-GABAergic, glutamatergic projection (Fosse and Fonnum, 1987). The student t test was used for statistical analyses.
Computer-generated figures
Images were acquired, analyzed, and prepared as described in the accompanying paper (Baldauf et al., 2005).
RESULTS
Distribution of PT-PUL cells
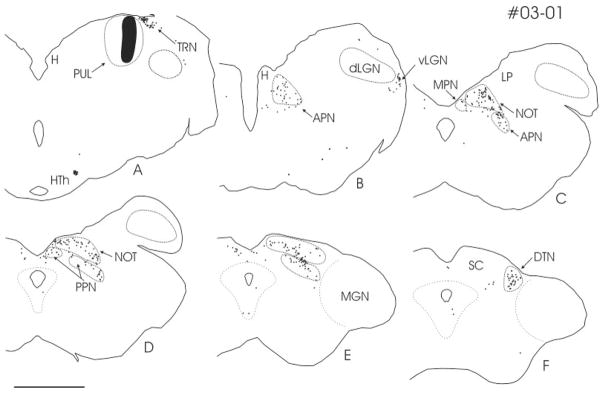
As illustrated in Figure 1, after unilateral injections of FDA (03-01) in the PUL, cells labeled by retrograde transport were densely distributed within the ipsilateral pretectal nuclear complex. The majority of cells were distributed within of the nucleus of the optic tract (NOT), posterior pretectal nucleus (PPN), and anterior pretectal nucleus (APN). Some cells in the contralateral PT were also noted. Outside the PT, PUL injections resulted in the retrograde labeling of cells in the cortex (Baldauf et al., 2005), ventral lateral geniculate nucleus (vLGN), and thalamic reticular nucleus (TRN). In addition, we observed labeled cells in the dorsal terminal nucleus (DTN) but not in the other parts of the accessory optic system.
Fig. 1.
A–F: After an injection of fluorescein conjugated to dextran amine (black patch; case 03-01) in the PUL, numerous cells in the NOT, the APN, and the PPN are labeled by retrograde transport (black dots). Cells labeled by retrograde transport are also located in the TRN, vLGN, and DTN. A: A dense cluster of cells was labeled in the lateral HTh. The distance between sections is 0.6 mm, and panel A corresponds to A6.4 according to the Horsley–Clarke stereotaxic coordinates. For abbreviations, see list. Scale bar = 5 mm in D (applies to A–F).
For most of the labeled PT-PUL cells, the tracer was confined to the somata and proximal dendrites. However, in some of the FDA-labeled cells, the tracer was sufficiently dense to reveal dendritic morphology. As illustrated in Figure 2, many of these FDA-labeled PT-PUL cells displayed sparsely branched, long radiating dendrites. We measured the soma sizes of FDA-labeled PT-PUL cells and compared them with the size of cells stained for Nissl substance in adjacent sections. As illustrated in Figure 3, the soma size of ipsilateral PT-PUL cells labeled by retrograde transport were smaller on average (276.64 μm2; SD 107.9; n = 119) than Nissl-stained PT somata (320.02 μm2; SD 133.57; n = 134). Despite the considerable overlap, the two groups were determined to be significantly different (P < 0.005).
Fig. 2.
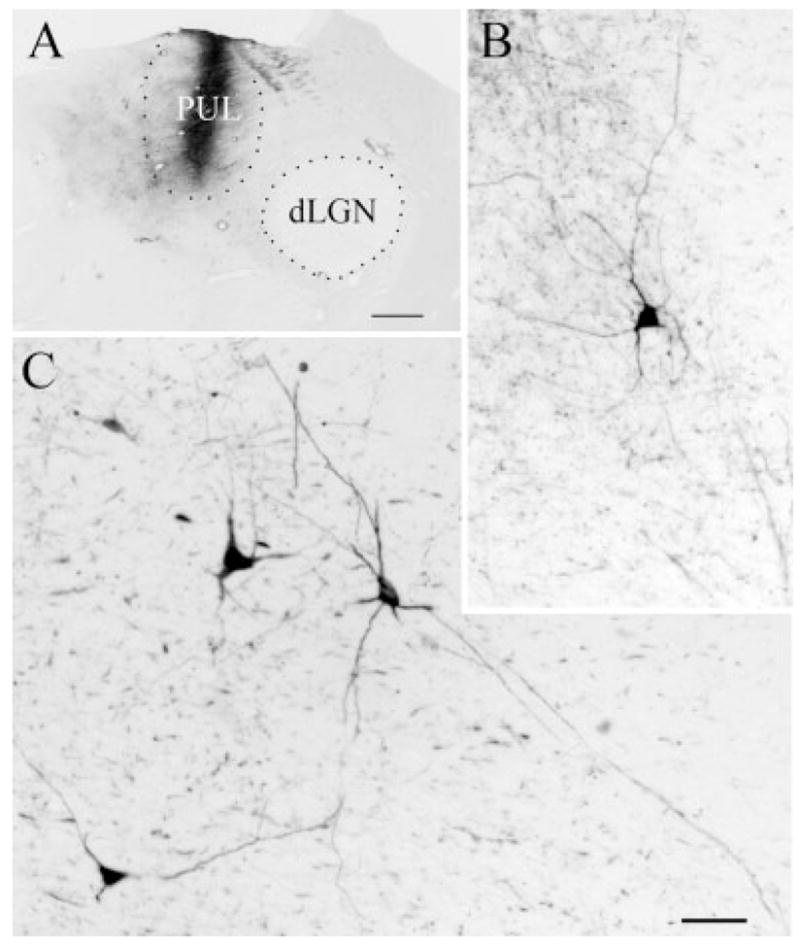
A–C: After an injection of fluorescein conjugated to dextran amine in the PUL (A), cells in the PT are labeled by retrograde transport (B,C). Many of these cells extend dendrites throughout wide regions of the PT. For abbreviations, see list. Scale bars = 1 mm in A; 30 μm in C (applies to B).
Fig. 3.
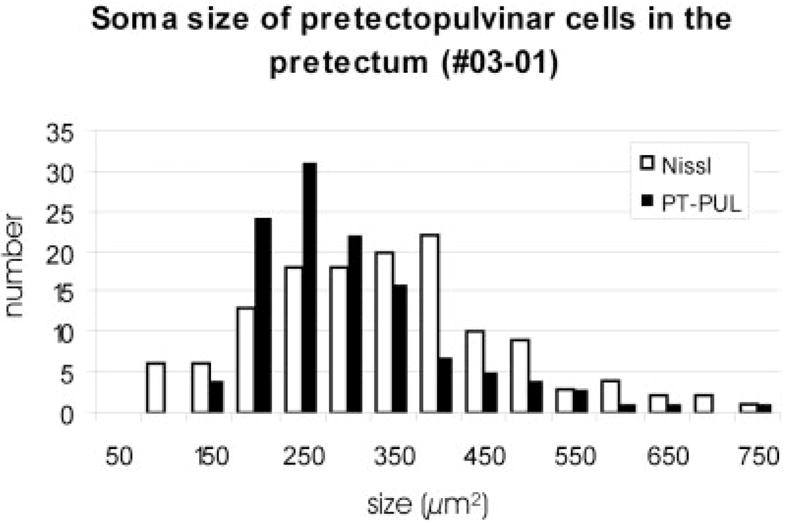
Comparison of the size of PT-PUL neurons and Nissl-stained cells in the PT (03-01). The PT-PUL neurons are somewhat smaller than the overall population of pretectal neurons. For abbreviations, see list.
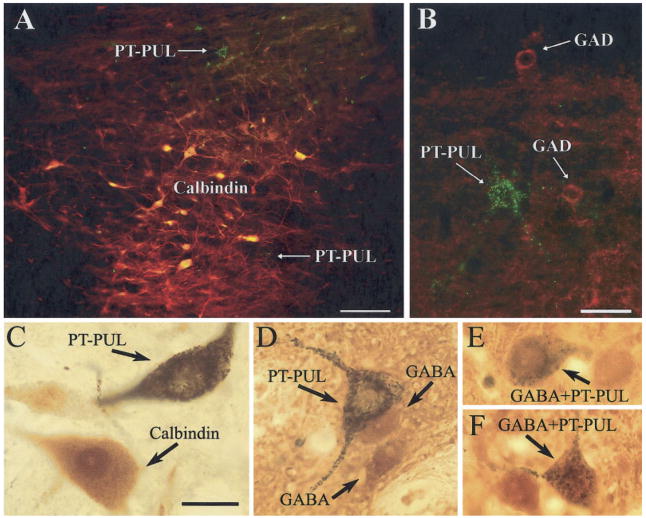
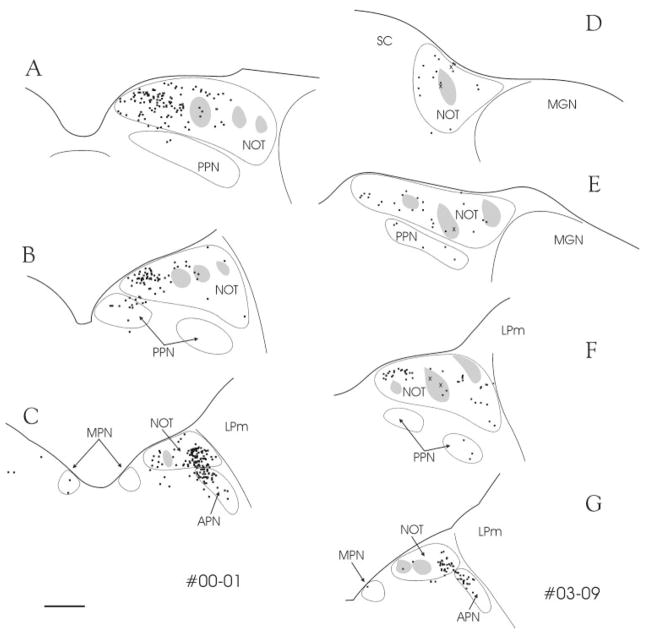
The PT has been shown to contain distinct patches of cells that use calbindin. These calbindin patches delineate the zones where retinopretectal axons terminate in dense clusters (Nabors and Mize, 1991) and calbindin-immunostained cells receive direct retinal input (Baldauf et al., 2003). To further define the distribution of PT-PUL neurons, we stained sections that contained GFM-labeled PT-PUL cells or WGA-HRP–labeled PT-PUL cells for calbindin. As shown in the photomicrographs in Figure 4A,C, the vast majority of PT-PUL cells did not contain calbindin, when either of the two techniques was used. Furthermore, as illustrated in Figure 5, most were located outside of the calbindin clusters.
Fig. 4.
A,C: Calbindin was not detected in most pretectal cells labeled by the retrograde transport of tracers injected into the PUL. A: A merged photograph of the PT photographed with blue light to reveal PT-PUL cells (green fluorescent microspheres [GFM]) and green light to reveal cells labeled with a calbindin antibody (yellow/ red). C: A photomicrograph of a PT-PUL cell (black crystalline reaction product) in tissue subsequently stained for calbindin (homogenous brown reaction product). B: Glutamic acid decarboxylase (GAD) was not detected in PT-PUL cells. Shown is a merged photograph of the PT photographed with blue light to reveal PT-PUL cells (GFM) and green light to reveal cells labeled with a GAD antibody (red). D–F: γ-Aminobutyric acid (GABA) was detected in a subset of PT-PUL cells. Shown are photomicrographs of PT-PUL cells (black crystalline reaction product) in tissue subsequently stained for GABA (homogenous brown reaction product). For abbreviations, see list. Scale bars = 100 μm in A,B; 30 μm in C (applies to C–F).
Fig. 5.
A–G: After injections of green fluorescent microspheres (A–C; case 00-01) or wheat germ agglutinin-horseradish peroxidase (D–G; case 03-09) in the PUL, numerous pretectal cells are labeled by retrograde transport (black dots). These cells are primarily located outside of clusters of cells that contain calbindin (gray areas). Nevertheless, a few double-labeled cells can be seen (X). For abbreviations, see list. Section spacing is 600 μm. Scale bar = 1 mm in C (applies to A–G).
Morphology and distribution of pretectothalamic terminals
Injections of PhaL (Fig. 6A, case 01-02, 7A case 02-04) or BDA (Fig. 6B, case 01-09) into the PT resulted in the anterograde labeling of a dense distribution of fibers in the PUL (Figs. 6C,D, 7B,C). The injections primarily covered the NOT and PPN of the pretectal nuclear complex. The overall distribution of terminal label is illustrated in Figure 8. Dense PT projections were also observed bilaterally in the PUL, the zona incerta, the vLGN, and in the ventral part of the central gray (CG). In addition, pretectal fibers with moderate density were observed bilaterally in the A laminae of the dLGN. Sparser pretectal fibers were widely distributed bilaterally across the thalamus, with projections to the C laminae of dLGN, medial interlaminar nucleus (MIN), LPm, LPl, laterodorsal nucleus (LD), perigeniculate nucleus (PGN), the TRN, centrolateral nucleus (CL), suprageniculate nucleus (Sg), and posterior thalamic nucleus (Po). The density and organization of the PUL terminals (Fig. 7B,C) can be compared with that seen in other thalamic nuclei in the photomicrographs included in Figures 7D–F.
Fig. 6.
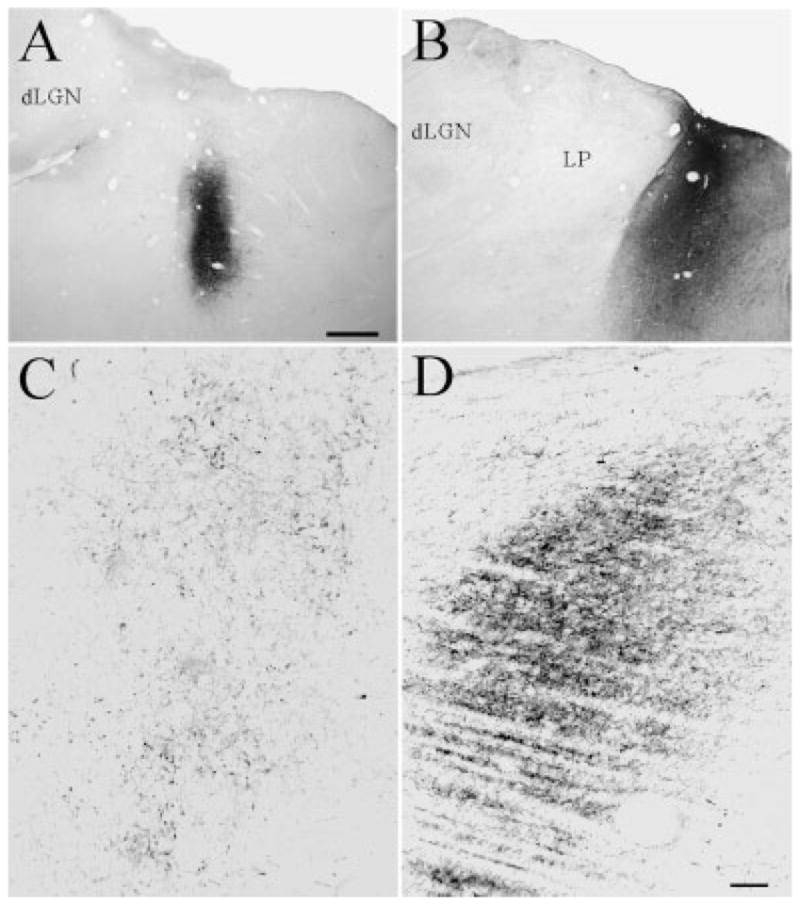
A–D: Injections of Phaseolus vulgaris leucoagglutinin (A; case 01-02) or biotinylated dextran amine (B; case 01-09) in the PT result in the anterograde labeling of a dense terminal field in the PUL (C,D). Terminals labeled after the injection illustrated in A and B are shown in C and D, respectively. For abbreviations, see list. Scale bar = 1 mm in A (applies to A,B); 100 μm in D (applies to C,D).
Fig. 7.
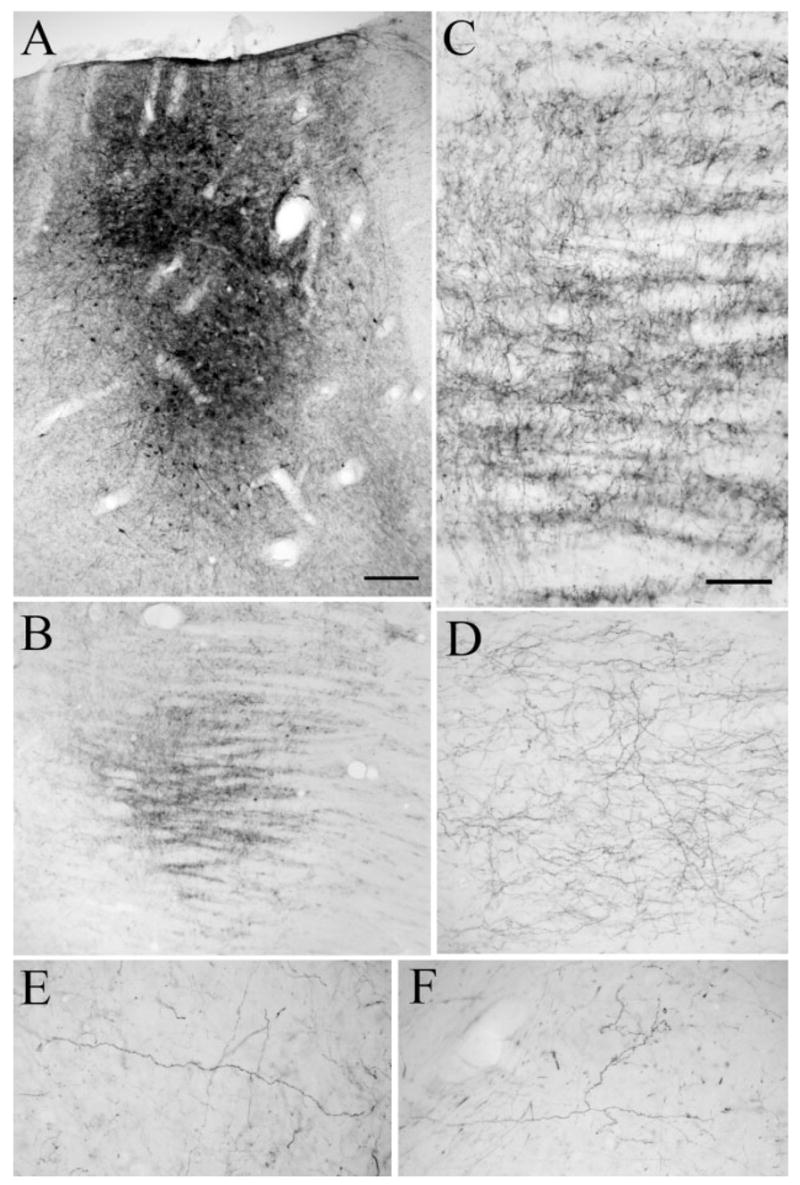
A–C: Injection of Phaseolus vulgaris leucoagglutinin (A; case 02-04) in the PT resulted in the anterograde labeling of a dense terminal field in the PUL (B), shown at higher magnification in C. D: Pretectal terminals in the A lamina of the dLGN are less dense than in the PUL, and all exhibit a varicose morphology. E,F: Similar varicose pretectal fibers are labeled in the LPl (E), and in the LPm (F) but are more sparsely distributed than in the dLGN. For abbreviations, see list. Scale bar = 250 μm in A (applies to A,B); 100 μm in C (applies to C–F).
Fig. 8.
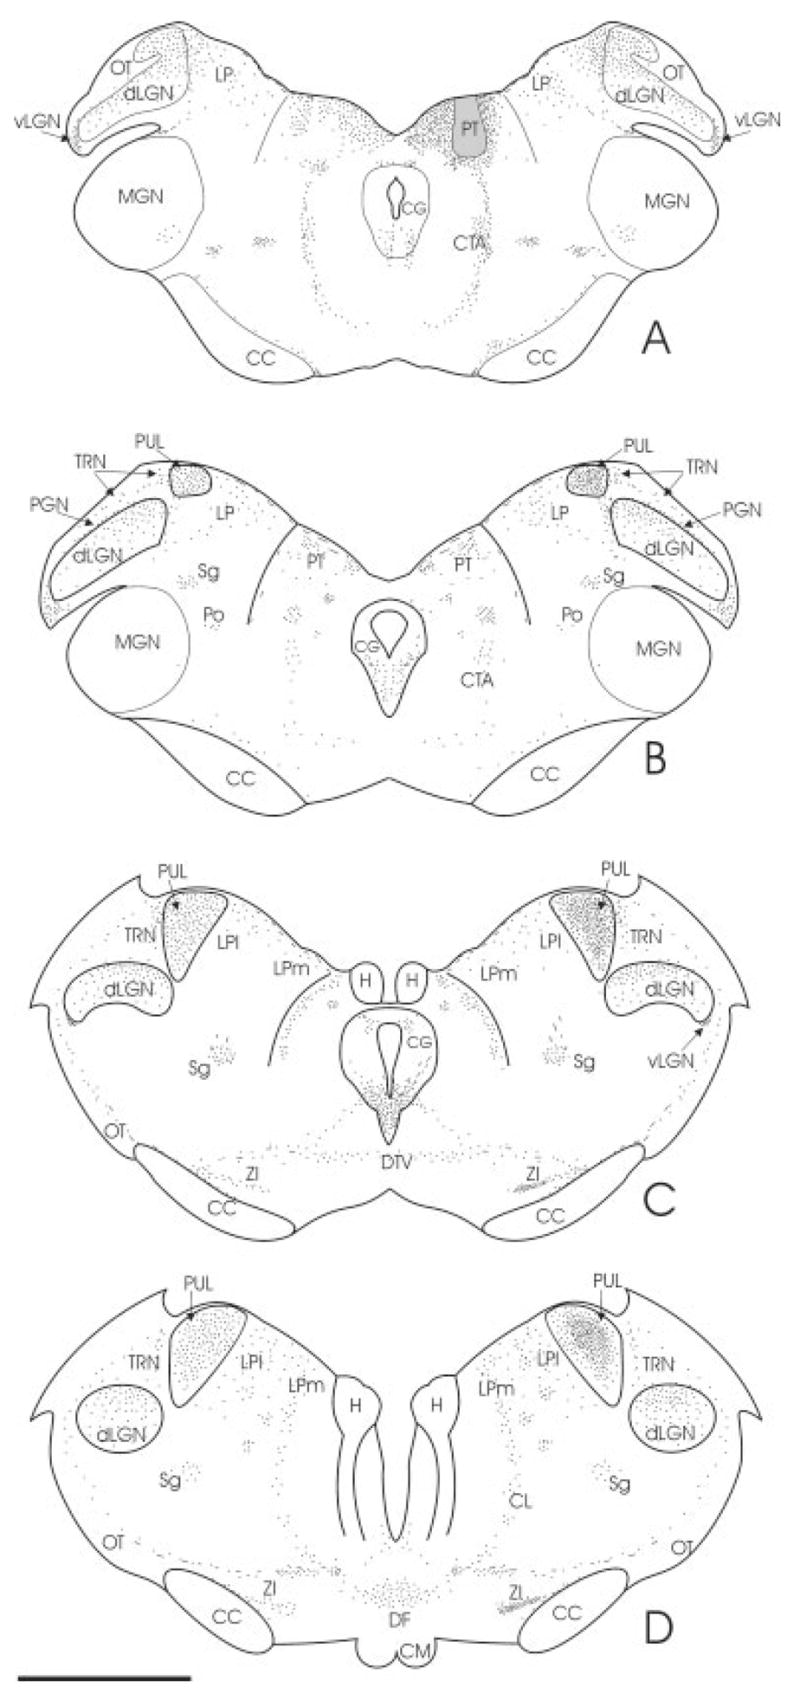
A–D: The schematic plot illustrates the distribution of pretectal efferents labeled from an injection of Phaseolus vulgaris leucoagglutinin (case 02-04; gray zone; also depicted in Fig. 7A). The densest projections of the PT are the PUL, the zona incerta (ZI), the vLGN, and the contralateral PT. Varicose terminals are indicated by small dots. Small stars indicate clustered terminals. Section spacing is 1mm, and panel A corresponds to A4.0 according to the Horsley–Clarke stereotaxic coordinates. For abbreviations, see list. Scale bar = 1 mm in D (applies to A–D).
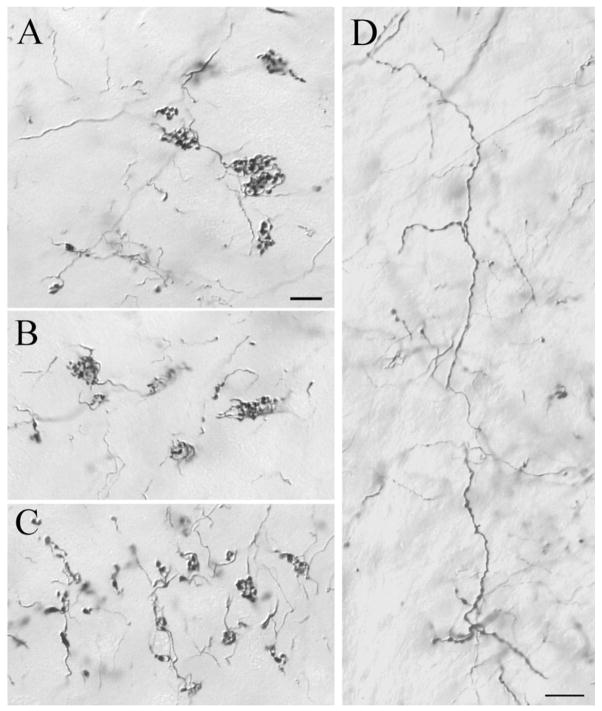
In contrast to the majority of pretectothalamic projections, which were beaded fibers with en passant boutons, the labeled PT-PUL terminal arbors displayed two types of morphology: grape-like clustered boutons (Fig. 9A–C) or en passant boutons (Fig. 9D). The arbors of clustered boutons resemble type II corticothalamic axons (Baldauf et al., 2005), whereas the varicose fibers resemble PT-LGN axons and terminals (Wang et al., 2002a).
Fig. 9.
After injections of anterograde tracers in the PT (02-04R), two types of terminals are labeled in the PUL. A–C: Most PT-PUL terminals form clusters of terminal boutons. D: Other labeled axons exhibit a beaded morphology. For abbreviations, see list. Scale bars = 10 μm in A (applies to A–C),D.
Synaptic targets of PT-PUL terminals
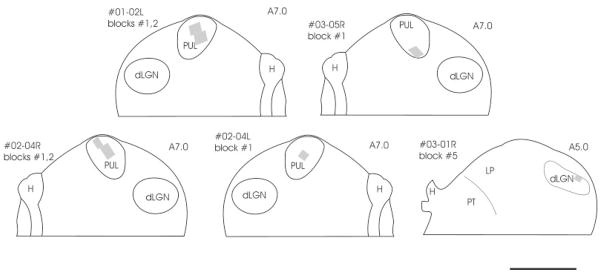
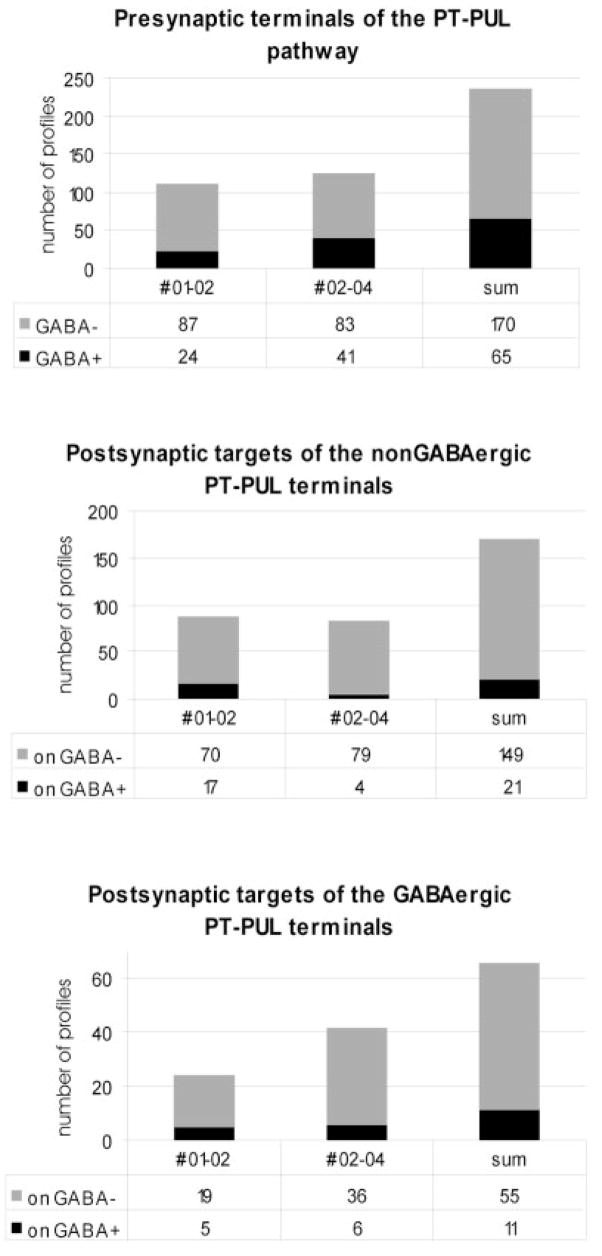
As illustrated in Figure 10, we examined five blocks of PUL tissue that contained PT-PUL terminals. A detailed ultrastructural analysis of PT-PUL terminals was completed in two cases, in which PhaL was used as an anterograde tracer (01-02L, 02-04R). The quantification of gold particle density overlying the neuronal elements enabled us to determine the GABAergic and non-GABAergic nature of pre- and postsynaptic profiles (Fig. 11). We photographed a total of 235 PhaL-labeled PT-PUL terminals that made synaptic contacts in the ipsilateral PUL. Using the analysis of gold particle density described in the methods section, most ipsilateral PT-PUL terminals were determined to be GABA-immunonegative (72.3% Figs. 12, 13). However, we also observed several GABA-immunoreactive PT terminals in the ipsilateral PUL (27.7%; Fig. 14). In case 01-02, 21.6% of the PT-PUL terminals were GABA-immunoreactive (24 of 111; Fig. 15), and in case 02-04, 33% of the PT-PUL terminals were GABA-immunoreactive (34 of 124; Fig. 15). The higher percentage of GABA-immunoreactive PT-PUL terminals in case 02-04R correlated with our qualitative observation that the tissue blocks chosen for analysis from this case contained a larger number of beaded boutons.
Fig. 10.
The locations of tissue blocks prepared for ultrastructural examination are schematically indicated with gray squares. From the PUL, six samples were examined: blocks 1,2 of case 01-02L (top left), blocks 1,2 of case 02-04R (bottom left), block 1 of case 03-05R (top right), block 1 of case 02-04L (bottom middle). Tissue from the dLGN was taken from case 03-01R (bottom right). The approximate position of each section is indicated by Horsley–Clarke stereotaxic coordinates. For abbreviations, see list. Scale bar = 2 mm.
Fig. 11.
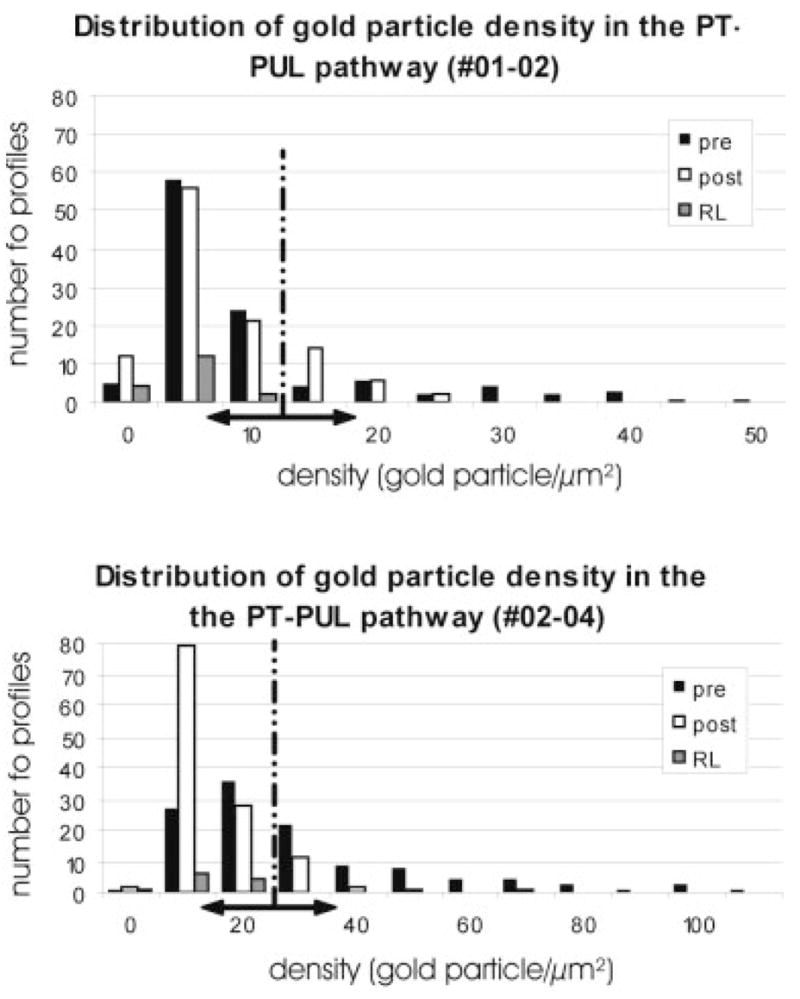
The histograms quantify the γ-aminobutyric acid (GABA) content within PT-PUL terminals, their postsynaptic elements, and large cortical terminals with round vesicles (RL) in two cases (01-02, 02-04). Using the mean gold particle density overlying selected RL profiles +2 standard deviations as an upper threshold for GABA-immunonegative profiles (vertical dashed line in the graph, and a double-headed arrow along the X axis), we estimated the number of GABAergic and non-GABAergic PT-PUL terminal and their target elements in the PUL. For abbreviations, see list.
Fig. 12.
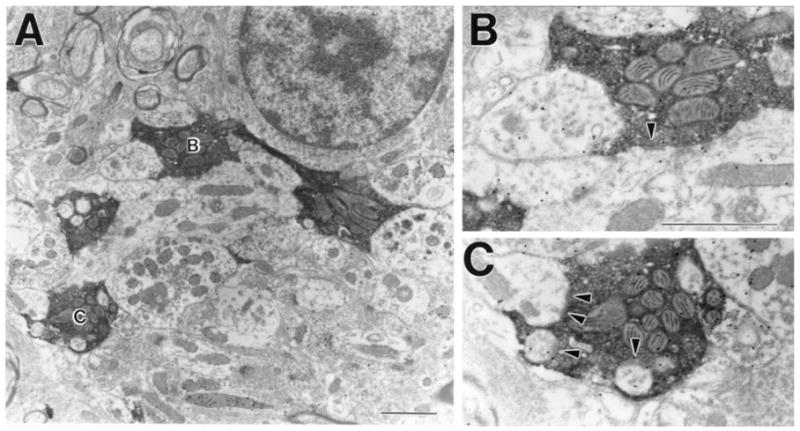
A: Most PT-PUL terminals do not contain γ-aminobutyric acid (GABA), form clusters of terminal boutons, and participate in glomerular arrangements. B,C: Terminals in A are shown at higher magnification. Arrowheads indicate synaptic contacts. For abbreviation, see list. Scale bars = 10 μm in A,B (applies to B,C).
Fig. 13.
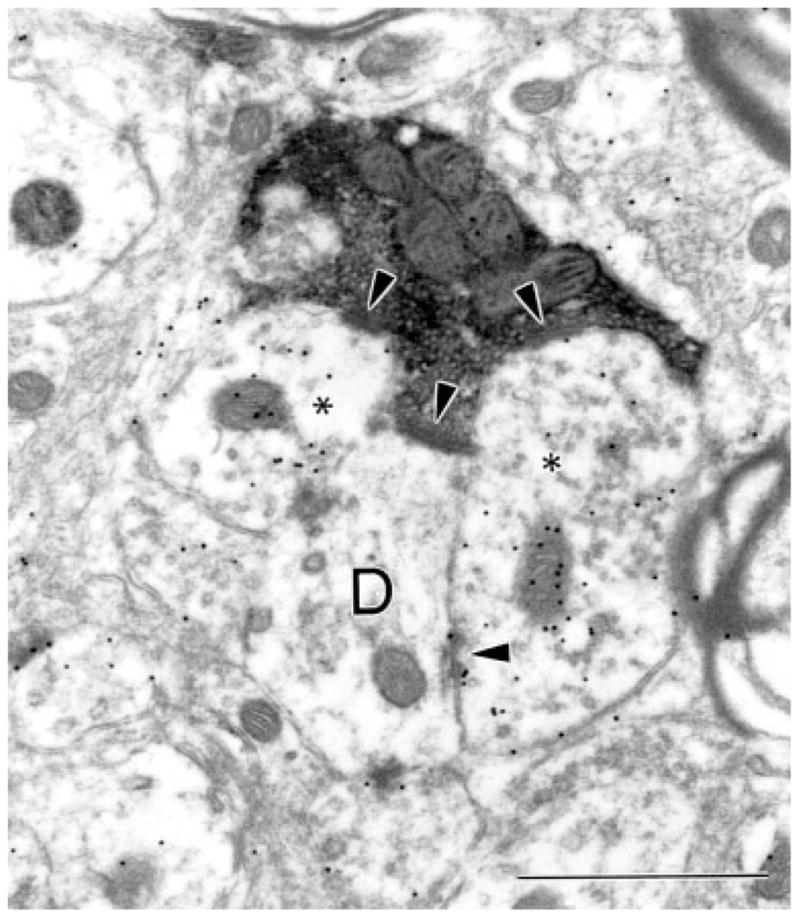
A γ-aminobutyric acid (GABA) -immunonegative PT-PUL terminal contacts (arrowheads) a GABA-immunonegative dendrite (D) and two GABA-immunoreactive profiles with vesicles (asterisks). A synaptic triad is formed by the synapse between one GABA-immunoreactive postsynaptic profile (asterisk, right) and the adjacent GABA-immunonegative dendrite (D). For abbreviation, see list. Scale bar = 1 μm.
Fig. 14.
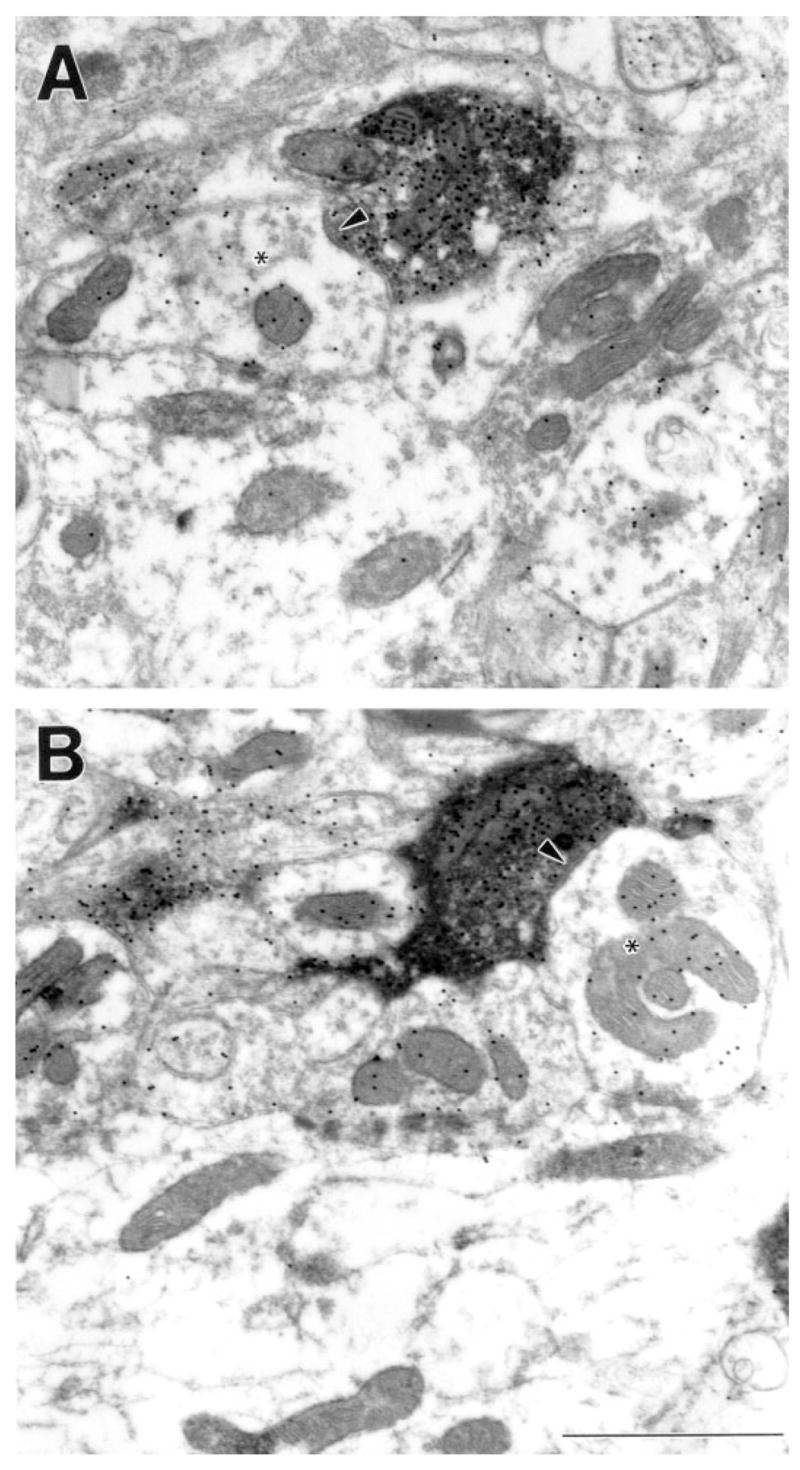
A subset of PT-PUL terminals contains γ-aminobutyric acid (GABA). A,B: Shown are two examples of GABAergic PT-PUL terminals that contact (arrowheads) GABAergic profiles that contain vesicles (asterisks). For abbreviations, see list. Scale bar = 1 μm in B (applies to A,B).
Fig. 15.
The top histogram illustrates the proportion of γ-aminobutyric acid (GABA) -ergic and non-GABAergic PT-PUL terminals observed (cases 01-02, 02-04, and combined). The proportion of GABAergic and non-GABAergic profiles postsynaptic to non-GABAergic PT-PUL terminals is shown (middle, cases 01-02, 02-04, and combined), and the proportion of GABAergic and non-GABAergic profiles postsynaptic to GABAergic PT-PUL terminals is shown (bottom, cases 01-02, 02-04, and combined). For abbreviation, see list.
The GABA-immunonegative PT-PUL terminals were profiles of small to large size that contained round vesicles and dark mitochondria. We compared the size of GABA-immunonegative PT-PUL terminals with those of corticothalamic terminals arising from area 7 that we previously categorized as small (RS) or large (RL) profiles (Baldauf et al., 2005). As illustrated in Figure 16A, the size range of GABA-immunonegative PT-PUL terminals overlapped the size range of both RS and RL corticothalamic terminals.
Fig. 16.
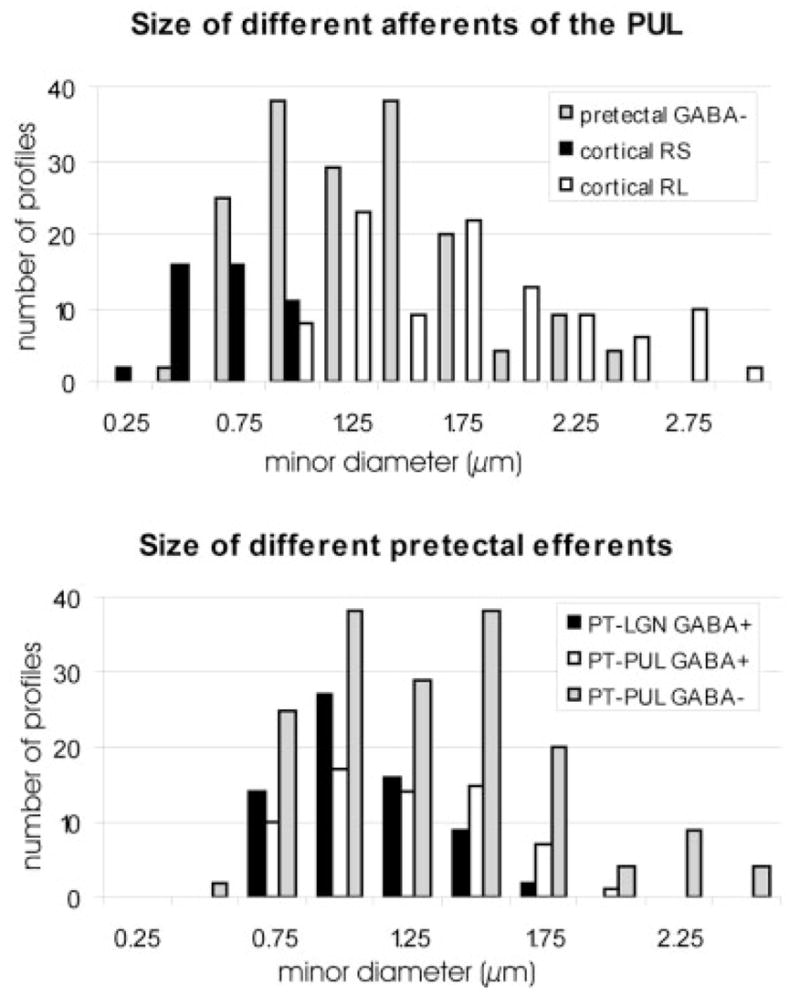
The top histogram compares the minor diameters of non–γ-aminobutyric acid (GABA) -ergic PT-PUL terminals (data from cases 01-02 and 02-04 combined) to two categories of corticopulvinar terminals labeled from area 7 (corticopulvinar data from Baldauf et al., 2005; cases 99-10 and 01-18 combined). The size range of PT-PUL terminals overlaps that of both small (RS) and large (RL) cortical terminals. The bottom histogram compares the minor diameters of non-GABAergic and GABAergic PT-PUL terminals to GABAergic PT-LGN terminals (measured from terminals reported by Wang et al. 2002a; cases 01-02 and 01-09 combined). The two types of GABAergic pretectal efferents are approximately the same size, whereas the non-GABAergic PT-PUL terminals are larger. For abbreviations, see list.
The postsynaptic densities of contacts made by GABA-immunonegative PT-PUL terminals were relatively thick (Fig. 12, 13). As summarized in Figure 15, these terminals primarily contacted GABA-immunonegative (thalamocortical cell) dendrites (in case 01-02, 70 of 87 or 80.5%, in case 02-04, 79 of 83 or 95.1%; both cases combined, 87.6%). The remaining contacts were made with GABA-immunoreactive elements (Fig. 15; in case 01-02, 17 of 87 or 19.5%, in case 02-04, 4 of 83 or 4.8%; both cases combined, 12.4%). Of these GABA-immunoreactive postsynaptic profiles, many contained vesicles and, therefore, can be tentatively identified as the dendritic terminals of interneurons (F2 profiles). Both types of contacts often occurred within complex synaptic clusters or glomeruli (Fig. 12). In rare instances, triadic arrangements were observed (i.e., a single PT-PUL terminal contacted both an F2 profile and a relay cell dendrite that was postsynaptic to the F2 profile, Fig. 13).
As illustrated in Figure 16B, the GABA-immunoreactive PT-PUL terminals were significantly smaller (mean minor diameter, MMD = 1.069 μm; SD 0.44) than the GABA-immunonegative PT-PUL terminals (MMD = 1.204 μm; SD 0.33; P < 0.005). We also compared the size of GABA-immunoreactive PT-PUL terminals with those of GABA-immunoreactive PT-LGN terminals (MMD = 0.953 μm; SD 0.26). The dLGN profiles analyzed here used material from our previous study (Wang et al., 2002a). There was no significant difference between the size of GABA-immunoreactive PT-PUL terminals and the size of PT-LGN terminals.
The GABA-immunoreactive PT-PUL terminals contained densely packed pleomorphic synaptic vesicles and abundant mitochondria (F1 profiles). Their postsynaptic densities were modest (Fig. 14). The GABA-immunoreactive PT-PUL terminals were most often observed as isolated boutons but were occasionally associated with synaptic clusters. Like GABA-immunonegative PT-PUL terminals, GABA-immunoreactive PT-PUL terminals primarily contacted GABA-immunonegative profiles (Fig. 15; case 01-02, 19 of 24 or 79.2%; case 02-04, 36 of 42 or 85.7%; both cases combined 83.3%). The remaining GABA-immunoreactive PT-PUL terminals contacted GABA-immunoreactive profiles (Fig. 15; case 01-02, 5 of 24 or 20.8%; case 02-04, 6 of 42 or 14.3% both cases combined, 16.7%). Most of the GABA-immunoreactive postsynaptic profiles contained vesicles (e.g., Fig. 14). An additional feature noted for both the GABA-reactive and GABA-immunonegative PT-PUL terminals was the presence of small postsynaptic profiles that invaginated the labeled terminals (e.g., Fig. 12C).
To compare the GABA immunoreactivity of PT-PUL terminals and their synaptic targets with those of PT-LGN terminals and their targets, we analyzed PT-LGN terminals photographed for our previous study (Wang et al., 2002a; cases 01-02, 01-09) and used criteria identical to that used for our analysis of PT-PUL terminals to quantitatively analyze the PT-LGN terminals. This re-analysis of PT-LGN terminals categorized 93.1% of the PT-LGN terminals as GABA-immunoreactive and 78.3% of their postsynaptic targets as GABA-immunoreactive. Thus, using identical parameters to analyze PT terminals in the PUL and LGN revealed differences in the proportions of terminals and synaptic targets which were classified as GABAergic.
We also measured the length of the synaptic contact zone of the PT-PUL terminals in two cases (01-02, 02-04) and compared them with the synaptic lengths of PT-LGN terminals photographed in our previous study (Wang et al., 2002a; cases 01-02, 01-09). The average length of contacts between GABA-immunonegative PT-PUL terminals and thalamocortical cell dendrites was 0.274 μm (SD 0.1). This type of contact was found to be statistically shorter than the other three types of contacts formed between GABA-immunonegative PT-PUL terminals and interneuron dendrites (0.327 μm, SD 0.1; P = 0.035), GABA-immunoreactive PT-PUL and thalamocortical cell dendrites (0.337 μm, SD 0.09; P < 0.005), or GABA-immunoreactive PT-PUL terminals and interneuron dendrites (0.37 μm, SD 0.12; P < 0.005). There was no statistical difference between these latter three types of PT-PUL contacts. The synaptic length of PT-LGN terminal contacts (0.323 μm, SD 0.1) was not statistically different from the GABA-immunoreactive PT-PUL terminals but was different from the GABA-immunonegative PT-PUL terminals that contact GABA-immunonegative dendrites (P < 0.005). This finding, as well as additional evidence presented in the final section of the Results section, suggests that the GABA-immunoreactive PT-PUL terminals may originate from axons that branch to also innervate the dLGN.
GABA content of PT-PUL neurons
Although we were unable to detect GAD in PT-PUL cells using fluorescent double-labeling techniques (Fig. 4B), immunocytochemical staining of WGA-HRP–labeled PT-PUL cells (revealed with the crystalline black TMB/DAB reaction) for GABA (revealed with a brown DAB reaction) enabled us to detect GABA within 26 of 126 WGA-HRP–labeled ipsilateral PT-PUL cells (or 20.6%; Fig. 4D–F). The distribution of these cells is illustrated in Figure 17. The GABA-immunonegative and GABA-immunoreactive neurons appear to have very similar, overlapping distributions. These data, in addition to the anterograde data described above, indicate that the PT-PUL pathway consists of both non-GABAergic and GABAergic cells and terminals.
Fig. 17.
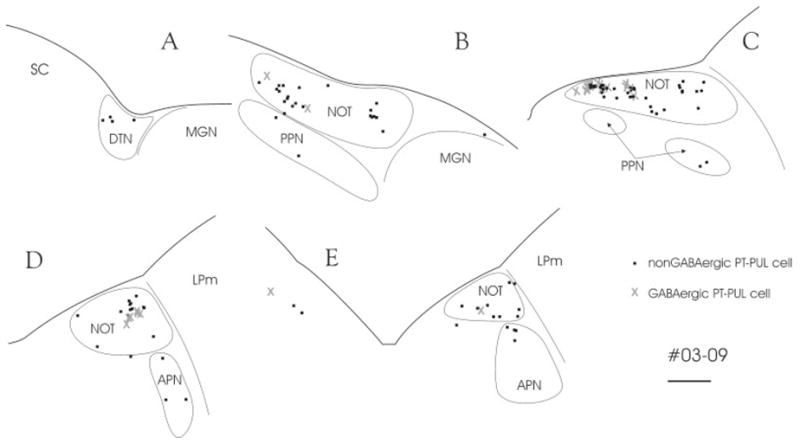
After an injection of wheat germ agglutinin-horseradish peroxidase in the PUL (03-09R), numerous pretectal cells are labeled by retrograde transport (black squares). A subset of these cells was labeled with an antibody against γ-aminobutyric acid (GABA, gray X). Section spacing is 600 μm. For abbreviations, see list. Scale bar = 1 mm.
Possible branching patterns of GABAergic PT-PUL cells
After the injection of FDA into the PUL (case 03-01), we noted that beaded fibers were labeled in the ipsilateral dLGN. These presumably were labeled by means of uptake of the FDA within branching pretectal axons that innervate both the PUL and dLGN. Such a branching pattern was noted in a previous study of individual PT-LGN axons (Uhlrich and Manning, 1995). To determine whether these fibers were GABAergic and contacted GABAergic interneurons (as we previously found for PT-LGN terminals, Wang et al., 2002a), we examined dLGN tissue from case 03-01 (ipsilateral to the PUL injection) that was stained for GABA using postembedding immunocytochemical techniques. We examined 57 FDA-labeled elements in the dLGN and found that all of the labeled profiles that contained vesicles (n = 39), and most of the labeled myelinated axons (17/18) were GABA-immunoreactive (Fig. 18). these labeled profiles were sparse, we observed few that were engaged in synaptic contacts. However, all of the observed postsynaptic profiles were GABA-immunoreactive (n = 9).
Fig. 18.
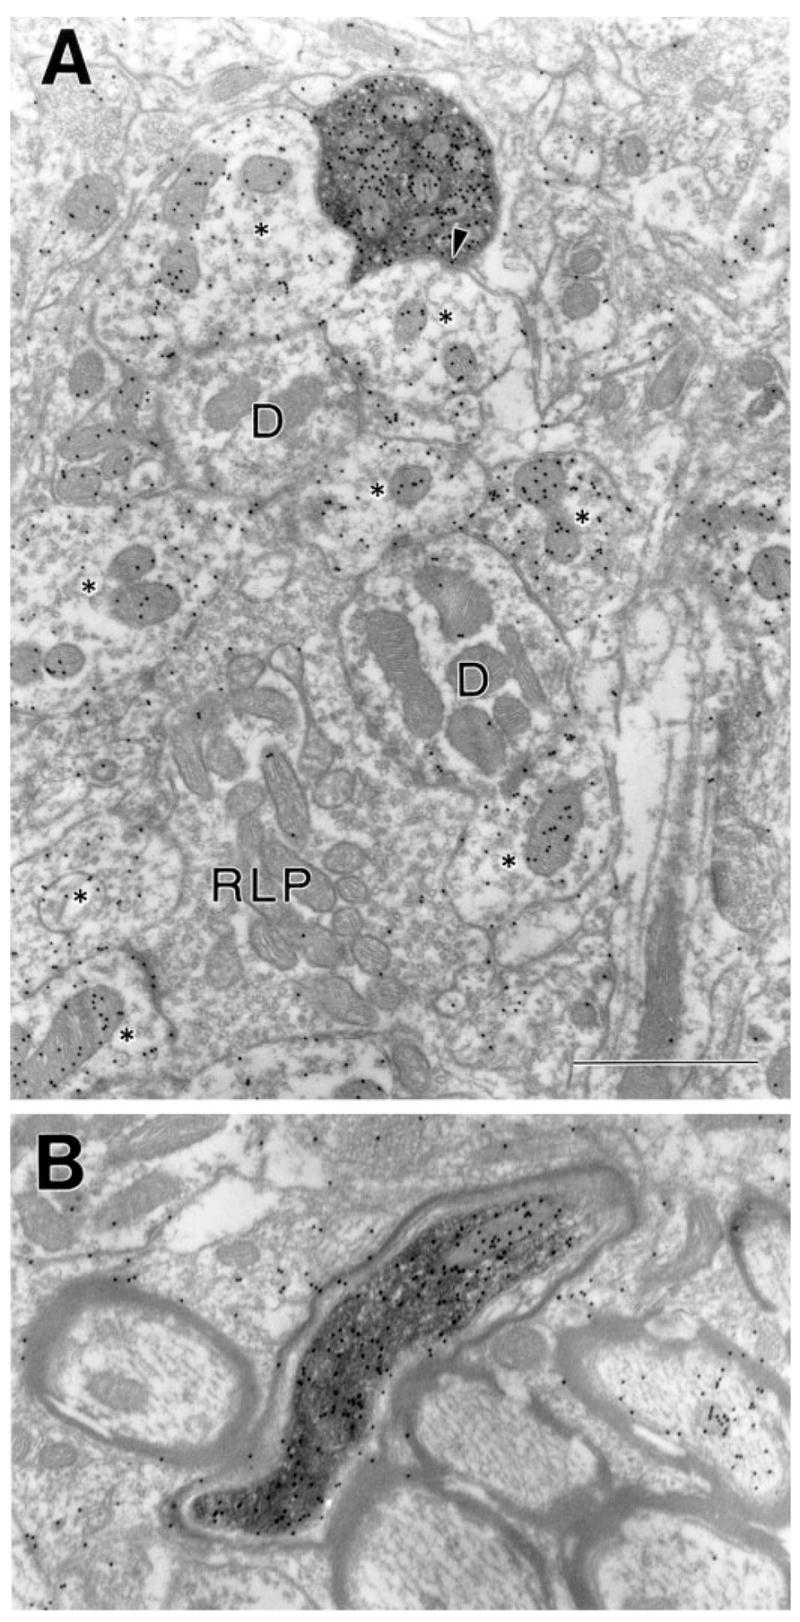
A,B: In the dLGN, terminals (A) and axons (B) labeled after an injection of fluorescein conjugated to dextran amine in the PUL contain γ-aminobutyric acid (GABA). The labeled terminal contacts (arrow) a GABA-immunoreactive profile within a glomerulus composed of a retinal terminal (RLP), thalamocortical cell dendrites (D), and GABAergic profiles (asterisks). For abbreviations, see list. Scale bar = 1 μm in A (applies to A,B).
We also noted that, after pretectal injections with PhaL, fibers were also labeled in the contralateral PUL and dLGN. The majority of these fibers displayed a beaded morphology. We examined 30 labeled profiles in the PUL contralateral to the pretectal injection of case 02-04 and found that most of these profiles were GABA-positive (26 or 86.7%). Therefore, it is possible that the axons of GABAergic PT-PUL cells may branch to bilaterally innervate both the PUL and the dLGN with diffuse beaded fibers. In contrast, the non-GABAergic PT-PUL projection appears to primarily innervate the ipsilateral PUL with larger clustered boutons.
DISCUSSION
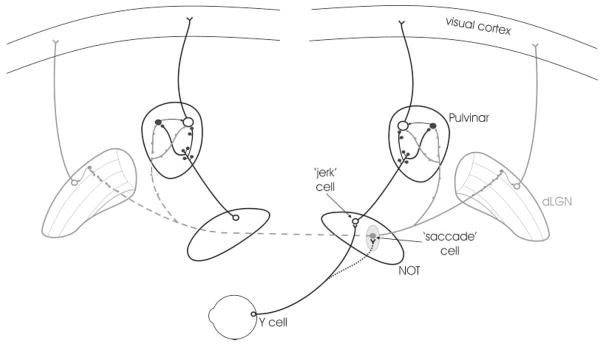
Figure 19 summarizes the present findings and those of previous studies. We found that the main projection from the PT to the PUL is an ipsilateral, non-GABAergic projection (72.4%) that primarily contacts thalamocortical cell dendrites (87.6%), but also contacts the dendritic terminals of interneurons (F2 profiles; 12.4%). These non-GABAergic terminals ranged from small to large in size, overlapping the size distribution of both RS and RL corticothalamic boutons. The PT additionally provides GABAergic innervation of the PUL (27.6% of the ipsilateral projection), which also chiefly contacts relay cell dendrites (84.6%), but also contacts GABAergic profiles (15.4%). These GABAergic terminals are smaller, beaded fibers that likely branch to bilaterally innervate the PUL and dLGN and possibly other targets.
Fig. 19.
The schematic diagram summarizes the present findings and those of previous studies. We found that the main projection from the PT to the PUL is an ipsilateral, non–γ-aminobutyric acid (GABA) -ergic projection. The PT-PUL neurons are primarily located within the NOT (open circles) and are presumably identical to the “jerk” cells receiving retinal input from Y ganglion cells (Ballas and Hoffmann, 1985). The non-GABAergic PT-PUL terminals form large clustered boutons in the PUL and contact both thalamocortical cells (open circles) and interneurons (filled black circles). We also found that both the ipsilateral and contralateral PUL receives a diffuse GABAergic projection from presumably another set of pretectal neurons (filled gray circle), the “saccade” cells. These GABAergic terminals form smaller, beaded boutons that likely branch to bilaterally innervate the PUL and dLGN. In the dLGN, they contact mostly interneurons (filled gray circles), whereas in the PUL they contact both thalamocortical cells and interneurons. For abbreviations, see list.
Comparison with previous studies
PT-PUL cells
Several previous studies have examined the distribution of PT-PUL cells labeled by retrograde neuronal transport among the various pretectal nuclei, and our results are in good agreement with these studies (Weber et al., 1986; Kubota et al., 1988; Schmidt et al., 2001). In the present study, PT-PUL neurons were primarily distributed in the NOT, but the APN, PPN, DTN also contained retrogradely labeled PT-PUL cells.
Schmidt et al. (2001) reported that most PT-PUL cells could be stained with an antibody against glutamate and that no PT-PUL cells could be labeled using in situ hybridization to reveal the presence of GAD mRNA. Similarly, we were unable to stain any PT-PUL cells using an antibody against GAD. However, our ultrastructural observations show that a relatively large percentage of labeled PT-PUL terminals contained GABA (20–30%). It may be particularly difficult to detect GABA or GAD within the GABAergic projection neurons of the PT. For example, although GABA was detected in 0–40% of PT-LGN cells (Cucchiaro et al., 1991; Nabors and Mize, 1991), we found that the vast majority of PT-LGN terminals contained GABA (Wang et al., 2002a; present study). Even using in situ hybridization techniques, GAD mRNA was detected in only 50–70% of PT-LGN cells (Wahle et al., 1994; Reimann and Schmidt, 1996). We have also noted that, within the GABAergic pretectotectal projection, staining to reveal the presence of GABA was much denser within pretectotectal terminals than within pretectotectal cells (Baldauf et al., 2003). Therefore, it is likely that the GABA content of PT-PUL cells is less than the GABA content of PT-PUL terminals. Nonetheless, both our anterograde and retrograde labeling studies indicate that a portion of the PT-PUL projection is GABAergic.
PT projections
Our results also corroborate previous anterograde tracing and degeneration studies which reported dense projections from the PT to the PUL (Graybiel, 1972; Berman, 1977; Itoh, 1977; Berson and Graybiel, 1978; Graybiel and Berson, 1980; Robertson et al., 1983; Schmidt et al., 2001). In addition, we confirmed the pretectal projections to the A and C laminae of the dLGN, MIN, GW, PGN, vLGN, LP, LD, CL, and zona incerta in cats (Graybiel and Berson, 1980; Robertson et al., 1983; Uhlrich and Manning, 1995; May et al., 1997; Nakamura and Itoh, 2004), and we additionally demonstrated PT projections to the Sg, Po, tegmental decussations (DTV), CG, and the TRN. These varicose pretectal fibers were very similar to those we observed earlier in the superior colliculus (Baldauf et al., 2003). With the exception of the zona incerta, vLGN, and the CG, the pretectal projections to the PUL were much denser than in all other PT targets. In fact, Schmidt et al. (2001) estimated that the PT innervated the PUL and LP in a ratio of 70:30, and our results confirm this approximate proportion.
The morphology of pretectal axons has been described in detail only for PT-LGN projections (Cucchiaro et al., 1991; Feig and Harting, 1994; Uhlrich and Manning, 1995). PT-LGN axons display a varicose or beaded morphology and give rise to GABAergic terminals that contact chiefly interneurons (Cucchiaro et al., 1993; Wang et al., 2002a; present study). Our results indicate that the PUL receives a dual pretectal projection: non-GABAergic, clustered terminals, and beaded GABAergic (PT-LGN-like) fibers.
Our results further suggest that the GABAergic PT-PUL projections may represent branches of axons that have a more widespread distribution than those of non-GABAergic PT-PUL axons. This scenario is indicated by our findings that most contralateral PT-PUL axons and dLGN axons labeled after PUL injections were GABAergic. This finding suggests, as illustrated in Figure 18, that individual GABAergic pretectal cells could possibly project bilaterally to widespread regions of the PUL. In addition, Uhlrich and Manning (1995) found that some PT-LGN fibers have bifurcating branches that project to PUL. These fibers were beaded and are likely to be the source of the GABAergic PhaL-labeled terminals that we observed. In fact, given the beaded morphology of the majority of pretectal efferents, it is probable that most of the pretectal innervation of the thalamus is GABAergic. In contrast, we predict that individual non-GABAergic pretectal cells innervate more focused regions of the ipsilateral PUL with clusters of large boutons. This idea is supported by retrograde tracing studies, which found that PT-PUL cells constitute a population that is separate from either PT-LGN cells (Kubota et al., 1988) or PT-LD cells (Robertson et al., 1983).
Functional implications
Our main finding is that most ipsilateral PT-PUL terminals are non-GABAergic profiles. Although these terminals lack the ultrastructural morphology associated with primary afferents, Schmidt et al. (2001) demonstrated that PUL neurons orthodromically activated by stimulation of the PT display response properties that are very similar to those recorded in PT-PUL cells. Both cell types respond to external moving visual stimuli or to image displacements caused by saccadic eye movements. These have been termed “SV” neurons in the PUL (Sudkamp and Schmidt, 2000) and “jerk” cells in the PT (Ballas and Hoffmann, 1985; Schweigart and Hoffman, 1992; Sudkamp and Schmidt, 1995). Therefore, the PT may provide a primary or driver-like input to at least a subset of PUL neurons.
In addition to a non-GABAergic, possibly driving input from the PT, our data also suggest that the PUL receives collateral input from GABAergic PT-LGN cells. The GABAergic projections to both the PUL and dLGN may arise from the “saccade” neurons of the PT, since neurons with these response properties have been shown to be antidromically activated after stimulation of the dLGN (Schmidt, 1996). In the dLGN, PT terminals primarily contact interneurons (Wang et al., 2002a), but in the present study, we found that GABAergic PT-PUL projections also contact thalamocortical cells. These projections could contribute to the response properties of other PUL cell types. That is, in addition to the “SV” cells, neurons that respond specifically either during self-generated movements (saccadic eye movements, “S” neurons) or after externally generated movements (visual stimulus movement, “V” neurons) have also been recorded in the PUL (Sudkamp and Schmidt, 2000). A convergence of GABAergic and non-GABAergic PT-PUL inputs might permit self-generated visual movement to be distinguished from externally generated visual movement by suppressing activity during saccadic eye movements. The ability to distinguish between self-generated and externally generated visual movement signals is a crucial step in locating salient visual targets in the visual environment and it is likely that the pretectal projection to the PUL plays an important role in this process.
The multiple cortical inputs that converge in the PUL are also likely to contribute to the response properties of PUL neurons. In particular, it has also been suggested that cortical inputs originating from layer V (RL profiles) may have a large impact on the response properties of the neurons of the PUL (Guillery, 1995; Sherman and Guillery, 1996, 1998; Guillery and Sherman, 2002). Comparison of non-GABAergic PT-PUL terminals to parieto-pulvinar terminals indicates that some PT-PUL terminals are as large as RL profiles, but as a group, they are smaller than RL profiles. In addition, although some PT-PUL terminals participate in glomerular-like arrangements, similar to RL profiles, this finding was not a consistent feature. Unlike the easily distinguishable RS and RL corticothalamic terminals, which likely have very different effects on thalamic activity, the ultrastructure of PT-PUL terminals does not fit the previously described terminal categories of thalamo-cortico-thalamic projections. In fact, the precise influence of either the cortex or the PT on feline PUL activity is unclear. Likewise, it remains to be determined whether cortical and PT terminals inputs terminate on separate PUL cell populations, or converge on the same cells. In either case, it seems likely that the complex signals coding motion of the visual scene recorded within the PUL are not initially generated at either cortical or subcortical levels but instead develop by means of the inextricable interactions between the cortex, thalamus, and PT. Unlike the first-order dLGN, which is incapable of influencing the activity of its driver (retina, Guillery, 1995; Sherman and Guillery, 1996, 1998; Guillery and Sherman, 2002), the higher-order PUL could influence the activity of its potential drivers: the cortex (directly) or the PT (indirectly by means of pulvino-cortico-pretectal connections). In addition, the overlapping distributions of corticopulvinar and PT-PUL terminals suggest that the function of the PUL might be to integrate cortical and subcortical signals rather than to merely transfer signals. Additional physiological studies are needed to address PUL function in more detail. The anatomical results of the present and companion (Baldauf et al., 2005) studies should aid in the design of these future studies.
Acknowledgments
National Institute of Neurological Disorders and Stroke; Grant number: NS35377; Grant sponsor: National Science Foundation; Grant number: IBN0130954; Grant sponsor: Fight for Sight, Inc.; Grant number: PD03055 (to Z.B.B.); Grant sponsor: Deutscher Akademischer Anstausch Dienst 1999/2000 stipend (to Z.B.B.).
The authors thank Martin J. Boyce; Cathie G. Caple; Jennifer Mahaney Cotton; Olga Golanov, MD; and Michael A. Eisenback, MS, for their valuable assistance in histological and electron microscopic processing; and Janice L. Ditslear and Nancy I. Hughes at the Research Resources Facility of University of Louisville for their excellent animal care and surgical assistance.
Abbreviations
- APN
anterior pretectal nucleus
- CC
crus cerebri
- CG
central gray
- CM
corpus mamillare
- CTA
central tegmental area
- DF
decussatio Foreli
- dLGN
dorsal lateral geniculate nucleus
- DTV
decussatio tegmenti ventralis
- DTN
dorsal terminal nucleus
- H
habenula
- HTh
hypothalamus
- LP
lateral posterior nucleus
- LPl
lateral subdivision of the lateral posterior nucleus
- LPm
medial subdivision of the lateral posterior nucleus
- MGN
medial geniculate nucleus
- MPN
medial pretectal nucleus
- NOT
nucleus of the optic tract
- OT
optic tract
- PPN
posterior pretectal nucleus
- PGN
perigeniculate nucleus
- Po
posterior thalamic nucleus
- PT
pretectum
- PT-LGN
pretectogeniculate
- PT-PUL
pretectopulvinar
- PUL
pulvinar nucleus
- SC
superior colliculus
- Sg
suprageniculate nucleus
- TRN
thalamic reticular nucleus
- vLGN
ventral lateral geniculate nucleus
LITERATURE CITED
- Baldauf ZB, Wang XP, Wang S, Bickford ME. Pretectotectal pathway: an ultrastructural quantitative analysis in cats. J Comp Neurol. 2003;464:141–158. doi: 10.1002/cne.10792. [DOI] [PubMed] [Google Scholar]
- Baldauf ZB, Chomsung RD, Carden WB, May PJ, Bickford ME. Ultrastructural analysis of projections to the pulvinar nucleus of the cat. I: Middle suprasylvian gyrus (areas 5 and 7) J Comp Neurol. 2005;485:87–107. doi: 10.1002/cne.20480. [DOI] [PMC free article] [PubMed] [Google Scholar]
- Ballas I, Hoffmann KP. A correlation between receptive field properties and morphological structures in the pretectum of the cat. J Comp Neurol. 1985;238:417–428. doi: 10.1002/cne.902380406. [DOI] [PubMed] [Google Scholar]
- Berman N. Connections of the pretectum in the cat. J Comp Neurol. 1977;174:227–254. doi: 10.1002/cne.901740204. [DOI] [PubMed] [Google Scholar]
- Berson DM, Graybiel AM. Parallel thalamic zones in the LP-pulvinar complex of the cat identified by their afferent and efferent connections. Brain Res. 1978;147:139–148. doi: 10.1016/0006-8993(78)90778-3. [DOI] [PubMed] [Google Scholar]
- Casanova C. The visual functions of the pulvinar. In: Chalupa LM, Werner JS, editors. The visual neurosciences. I. Cambridge, London: MIT Press; 2003. pp. 592–608. [Google Scholar]
- Chalupa LM. The visual function of the pulvinar. In: Dreher B, Robinson SP, editors. Vision and visual dysfunction: the neural basis of visual function. IV. Boca Raton: CRC Press; 1991. pp. 140–159. [Google Scholar]
- Cucchiaro JB, Bickford ME, Sherman SM. A GABAergic projection from the pretectum to the dorsal lateral geniculate nucleus in the cat. Neuroscience. 1991;41:213–226. doi: 10.1016/0306-4522(91)90211-6. [DOI] [PubMed] [Google Scholar]
- Cucchiaro JB, Uhlrich DJ, Sherman SM. Ultrastructure of synapses from the pretectum in the Alaminae of the cat’s lateral geniculate nucleus. J Comp Neurol. 1993;334:618–630. doi: 10.1002/cne.903340409. [DOI] [PubMed] [Google Scholar]
- Feig S, Harting JK. Ultrastructural studies of the primate lateral geniculate nucleus: morphology and spatial relationships of axon terminals arising from the retina, visual cortex (area 17), superior colliculus, parabigeminal nucleus, and pretectum of Galago crassicaudatus. J Comp Neurol. 1994;343:17–34. doi: 10.1002/cne.903430103. [DOI] [PubMed] [Google Scholar]
- Fosse VM, Fonnum F. Biochemical evidence for glutamate and/or aspartate as neurotransmitters in fibers from the visual cortex to the lateral posterior thalamic nucleus (pulvinar) in rats. Brain Res. 1987;400:219–224. doi: 10.1016/0006-8993(87)90620-2. [DOI] [PubMed] [Google Scholar]
- Graybiel AM. Some extrageniculate visual pathways in the cat. Invest Ophthalmol. 1972;11:322–332. [PubMed] [Google Scholar]
- Graybiel AM, Berson DM. Autoradiographic evidence for a projection from the pretectal nucleus of the optic tract to the dorsal lateral geniculate complex in the cat. Brain Res. 1980;195:1–12. doi: 10.1016/0006-8993(80)90861-6. [DOI] [PubMed] [Google Scholar]
- Guillery RW. Anatomical evidence concerning the role of the thalamus in corticocortical communication: a brief review. J Anat. 1995;187:583–592. [PMC free article] [PubMed] [Google Scholar]
- Guillery RW, Sherman SM. Thalamic relay functions and their role in corticocortical communication: generalizations from the visual system. Neuron. 2002;33:163–175. doi: 10.1016/s0896-6273(01)00582-7. [DOI] [PubMed] [Google Scholar]
- Hoffmann KP, Distler C. Quantitative analysis of visual receptive fields of neurons in nucleus of the optic tract and dorsal terminal nucleus of the accessory optic tract in macaque monkey. J Neurophysiol. 1989;62:416–428. doi: 10.1152/jn.1989.62.2.416. [DOI] [PubMed] [Google Scholar]
- Hoffmann KP, Schoppmann A. Retinal input to direction selective cells in the nucleus tractus opticus of the cat. Brain Res. 1975;99:359–366. doi: 10.1016/0006-8993(75)90037-2. [DOI] [PubMed] [Google Scholar]
- Horn AKE, Hoffmann KP. Combined GABA-immunocytochemistry and TMB-HRP histochemistry of pretectal nuclei projecting to the inferior olive in rats, cats and monkeys. Brain Res. 1987;409:133–138. doi: 10.1016/0006-8993(87)90748-7. [DOI] [PubMed] [Google Scholar]
- Ito H, Atencio F. Staining methods for an electron microscopic analysis of Golgi impregnated nervous tissue and a demonstration of the synaptic distribution upon pulvinar neurons. J Neurocytol. 1976;5:297–317. doi: 10.1007/BF01175117. [DOI] [PubMed] [Google Scholar]
- Itoh K. Efferent projections of the pretectum in the cat. Exp Brain Res. 1977;30:89–105. doi: 10.1007/BF00237861. [DOI] [PubMed] [Google Scholar]
- Kubota T, Morimoto M, Kaneseki T, Inomata H. Visual pretectal neurons projecting to the dorsal lateral geniculate nucleus and pulvinar nucleus in the cat. Brain Res Bull. 1988;20:573–579. doi: 10.1016/0361-9230(88)90216-x. [DOI] [PubMed] [Google Scholar]
- May PJ, Sun W, Hall WC. Reciprocal connections between the zona incerta and the pretectum and superior colliculus of the cat. Neuroscience. 1997;77:1091–1114. doi: 10.1016/s0306-4522(96)00535-0. [DOI] [PubMed] [Google Scholar]
- Missal M, Coimbra A, Lefèvre P, Olivier E. A quantitative analysis of the correlations between eye movements and neural activity in the pretectum. Exp Brain Res. 2002;143:373–382. doi: 10.1007/s00221-002-0999-7. [DOI] [PubMed] [Google Scholar]
- Nabors LB, Mize RR. A unique neuronal organization in the cat pretectum revealed by antibodies to the calcium-binding protein calbindin-D28K. J Neurosci. 1991;11:2460–2476. doi: 10.1523/JNEUROSCI.11-08-02460.1991. [DOI] [PMC free article] [PubMed] [Google Scholar]
- Nakamura H, Itoh K. Cytoarchitectonic and connectional organization of the ventral lateral geniculate nucleus in the cat. J Comp Neurol. 2004;473:439–462. doi: 10.1002/cne.20074. [DOI] [PubMed] [Google Scholar]
- Raczkowski D, Rosenquist AC. Connections of the multiple visual cortical areas with the lateral posterior-pulvinar complex and adjacent thalamic nuclei in the cat. J Neurosci. 1983;3:1912–1942. doi: 10.1523/JNEUROSCI.03-10-01912.1983. [DOI] [PMC free article] [PubMed] [Google Scholar]
- Reimann S, Schmidt M. Histochemical characterisation of the pretecto-geniculate projection in kitten and adult cat. Dev Brain Res. 1996;91:143–148. doi: 10.1016/0165-3806(95)00173-5. [DOI] [PubMed] [Google Scholar]
- Robertson RT, Thompson SM, Kaitz SS. Projections from the pretectal complex to the thalamic lateral dorsal nucleus of the cat. Exp Brain Res. 1983;51:157–171. doi: 10.1007/BF00237191. [DOI] [PubMed] [Google Scholar]
- Schmidt M. Neurons in the cat pretectum that project to the dorsal lateral geniculate nucleus are activated during saccades. J Neurophysiol. 1996;76:2907–2918. doi: 10.1152/jn.1996.76.5.2907. [DOI] [PubMed] [Google Scholar]
- Schmidt M, Hoffmann KP. Physiological characterization of pretectal neurons projecting to the lateral geniculate nucleus in the cat. Eur J Neurosci. 1992;4:318–326. doi: 10.1111/j.1460-9568.1992.tb00879.x. [DOI] [PubMed] [Google Scholar]
- Schmidt M, Sudkamp S, Wahle P. Characterization of pretectal-nuclear complex afferents to the pulvinar in the cat. Exp Brain Res. 2001;138:509–519. doi: 10.1007/s002210100738. [DOI] [PubMed] [Google Scholar]
- Schoppmann A, Hoffmann KP. A comparison of visual responses in two pretectal nuclei and in the superior colliculus of the cat. Exp Brain Res. 1979;35:495–510. doi: 10.1007/BF00236767. [DOI] [PubMed] [Google Scholar]
- Schweigart G, Hoffmann KP. Pretectal jerk neuron activity during saccadic eye movements and visual stimulations in the cat. Exp Brain Res. 1992;91:273–283. doi: 10.1007/BF00231660. [DOI] [PubMed] [Google Scholar]
- Sherman SM, Guillery RW. Functional organization of thalamocortical relays. J Neurophysiol. 1996;76:1367–1395. doi: 10.1152/jn.1996.76.3.1367. [DOI] [PubMed] [Google Scholar]
- Sherman SM, Guillery RW. On the actions that one nerve cell can have on another: distinguishing “drivers” from “modulators”. Proc Natl Acad Sci U S A. 1998;95:7121–7126. doi: 10.1073/pnas.95.12.7121. [DOI] [PMC free article] [PubMed] [Google Scholar]
- Sudkamp S, Schmidt M. Physiological characterization of pretectal neurons projecting to the LP-P complex in the cat. Eur J Neurosci. 1995;7:881–888. doi: 10.1111/j.1460-9568.1995.tb01075.x. [DOI] [PubMed] [Google Scholar]
- Sudkamp S, Schmidt M. Response characteristics of neurons in the pulvinar of awake cats to saccades and to visual stimulation. Exp Brain Res. 2000;133:209–218. doi: 10.1007/s002210000374. [DOI] [PubMed] [Google Scholar]
- Uhlrich DJ, Manning KA. Projection of individual axons from the pretectum to the dorsal lateral geniculate complex in the cat. J Comp Neurol. 1995;363:147–159. doi: 10.1002/cne.903630112. [DOI] [PubMed] [Google Scholar]
- Wahle P, Stuphorn V, Schmidt M, Hoffmann KP. LGN-projecting neurons of the cat’s pretectum express glutamic acid decarboxylase mRNA. Eur J Neurosci. 1994;6:454–460. doi: 10.1111/j.1460-9568.1994.tb00287.x. [DOI] [PubMed] [Google Scholar]
- Wang S, Bickford ME. Anatomical characterization of the projection from the pretectum to the pulvinar nucleus of the cat. Soc Neurosci Abstr. 2000;26:1470. [Google Scholar]
- Wang S, Boyce MJ, Eisenback MA, Bickford ME. Ultrastructural characterization of the projection from the pretectum to the pulvinar nucleus of the cat. Soc Neurosci Abstr. 2001;27:723.25. [Google Scholar]
- Wang S, Eisenback MA, Datskovskaia A, Boyce MJ, Bickford ME. GABAergic pretectal terminals contact GABAergic interneurons in the cat dorsal lateral geniculate nucleus. Neurosci Lett. 2002a;323:141–145. doi: 10.1016/s0304-3940(01)02533-2. [DOI] [PubMed] [Google Scholar]
- Wang S, Eisenback MA, Bickford ME. Relative distribution of synapses in the pulvinar nucleus of the cat: implications regarding the “driver/modulatorr” theory of thalamic function. J Comp Neurol. 2002b;454:482–494. doi: 10.1002/cne.10453. [DOI] [PubMed] [Google Scholar]
- Weber JT, Chen IL, Hutchins B. The pretectal complex of the cat: cells of origin of projections to the pulvinar nucleus. Brain Res. 1986;397:389–394. doi: 10.1016/0006-8993(86)90645-1. [DOI] [PubMed] [Google Scholar]


