

Abstract
Chronopharmacology is an important but under-explored aspect of therapeutics. Rhythmic variations in biological processes can influence drug action, including pharmacodynamic responses, due to circadian variations in the availability or functioning of drug targets. We hypothesized that global gene expression analysis can be useful in the identification of circadian regulated genes involved in drug action. Circadian variations in gene expression in rat liver were explored using Affymetrix gene arrays. A rich time series involving animals analyzed at 18 time points within the 24 hour cycle was generated. Of the more than 15,000 probe sets on these arrays, 265 exhibited oscillations with a 24 hour frequency. Cluster analysis yielded 5 distinct circadian clusters, with approximately two-thirds of the transcripts reaching maximum expression during the animal’s dark/active period. Of the 265 probe sets, 107 of potential therapeutic importance were identified. The expression levels of clock genes were also investigated in this study. Five clock genes exhibited circadian variation in liver, and data suggest that these genes may also be regulated by corticosteroids.
INTRODUCTION
Virtually all organisms have biological rhythms associated with the light-dark cycle (Badiu, 2003; Oishi et al., 2003; Murphy, 2005; Ueda et al., 2005). In mammals, rhythms exist at all levels of organization from the organismal to the cellular. The central orchestrators of these rhythms are paired suprachiasmatic nuclei (SCN) in the anterior part of the hypothalamus which receive direct input by way of the retinohypothalamic tract. However, the existence of diurnal and nocturnal animals and the ability of animals to shift with changes in the light-dark cycle indicate that beyond the SCN the rhythms are not slaves to the presence or absence of light (Dardente et al., 2002; Challet et al., 2003). In addition to receiving inputs from the retina, the SCN also receives inputs from forebrain areas that modulate the downstream influences of the SCN. Of particular importance to rhythmicity in peripheral tissues are outputs from the SCN which are directed to other parts of the hypothalamus that regulate both anterior and posterior pituitary hormones, as well as the autonomic nervous system. In addition, behavioral adjuncts associated with the exigencies of life such as feeding and activity can impact rhythmicity downstream of the SCN.
In the SCN the circadian clock involves an autoregulatory negative feedback loop of gene expression (Dardente et al., 2002; Challet et al., 2003; Ueda et al., 2005). Its basic elements are several transcription factors including CLOCK (Circadian Locomotor Output Cycles Kaput) and BMAL1 (Aryl Hydrocarbon Receptor Nuclear Translocator-like) which heterodimerize and enhance the expression of PERIOD (PER) and CRYPYOCHROME (CRY). In turn, PER and CRY heterodimerize and repress the expression of CLOCK and BMAL1. The core system is entrained to the light/dark cycle with CLOCK:BMAL being high during the light and PER:CRY being high during the dark (Ueda et al., 2005). In addition to the core transcription factors, there are additional transcription factors that add flexibility and adaptability to the central clock.
The central clock anticipates the change in photoperiods, preparing the animal for the upcoming period of activity and feeding, regardless of whether that period is in light or dark. The input from the SCN to the regulation of both pituitary hormones and the autonomic nervous system impart rhythmicity to peripheral tissues. However, this is further complicated by more diffuse behavior-related factors which alter systemic demands. Many of the transcription factors involved in regulating the central clock are also expressed in peripheral tissues. However, their regulation is complicated by variations in ancillary factors. The existence of both diurnal and nocturnal mammals and the phenomena of phase shifting by food restriction illustrate both the complexity and flexibility in peripheral rhythmicity. Its intrinsic nature is illustrated by the observations that rhythmic behavior with a periodicity of approximately 24 hours can be induced in a variety of cells in culture (Ueda et al., 2005).
The hypothalmic/pituitary/adrenal axis (HPA) is of particular importance to the active feeding period. Its effector hormones, glucocorticoids, are high during the light period in diurnal animals and during the dark period in nocturnal animals (Dardente et al., 2002). The mechanism for most glucocorticoid effects involves modulation in the amount of specific mRNAs (Almon et al., 2007). By virtue of their circadian periodicity, glucocorticoids are effectors of many circadian changes in gene expression.
The liver expresses an unusually large and diverse repertoire of genes (Almon et al., 2007). The nature of the processes carried out by liver suggests that many of its expressed genes should be under circadian control either directly or indirectly. In the present report we describe the use of Affymetrix arrays to analyze the livers of rats maintained on a strict light/dark regimen consisting of 12 hours light/12 hours dark with three animals sacrificed at 18 time points during the 24 hour period. This rich time series allowed us to group genes into five relatively discrete circadian clusters. Circadian responsive genes were also examined within the context of glucocorticoid regulation and their response to exogenous corticosteroids.
The probe sets that were found to have an oscillation with a 24 hour frequency had their identities confirmed when possible using the Basic Local Alignment and Search Tool (BLAST). This information was used to parse the genes into 13 functional groups. Functional groups were then analyzed by clusters to determine the distribution of these functions in circadian time.
Dysregulation of aspects of liver function are associated with a variety of common pathologies. As a result, liver functions are commonly targeted by drugs. It has been long recognized that rhythmic variations in biological processes can affect therapeutics, including absorption/distribution, excretion, protein binding, and response (Reinberg, 1992; Labrecque et al., 1995; Smolensky et al., 1999). Therefore the circadian regulation of gene expression was also examined and discussed within the context of drug targeting, with emphasis of cholesterol/bile acid synthesis, cancer chemotherapeutics, and translation and protein processing.
METHODS
Animals
Fifty-four normal (150–175 g) male Wistar rats were purchased in two separate batches of 27 from Harlan Sprague-Dawley Inc. (Indianapolis, IN, USA) and experiments were initiated at body weights between 225 and 275 g. Animals were housed and allowed to acclimatize in a constant-temperature environment (22°C) equipped with a 12-h light/dark cycle. Twenty-seven rats (Group I) were acclimatized for 2 weeks prior to study to a normal light/dark cycle, where lights went on at 8 AM and off at 8 PM. The onset of the light period was considered as time zero. The other 27 rats (Group II) were acclimatized for 2 weeks prior to study to a reversed light/dark cycle, where lights went on at 8 PM and off at 8 AM. Rats in Group I were killed on three successive days at 0.25, 1, 2, 4, 6, 8, 10, 11, and 11.75 hr after lights on to capture the light period. Rats in Group II were killed on three successive days at 12.25, 13, 14, 16, 18, 20, 22, 23, and 23.75 h after lights on to capture the dark period. Animals sacrificed at the same time on successive days were treated as triplicate measurements. Because normal rats were used, minimal animal handling with least possible environmental disturbances was employed to minimize stress. Night vision goggles were used to carry out animal procedures conducted in the dark period. At sacrifice, rats were weighed, anesthetized by ketamine/xylazine, and sacrificed by aortic exsanguination. Blood was drawn from the abdominal aortic artery into syringes using ethylenediaminetetraacetic acid (4mM final concentration) as anticoagulant. Plasma was harvested from blood by centrifugation (2000 × g, 15 minutes, 4°C) and frozen at minus 80°C until analyzed for corticosterone. Livers were excised and frozen in liquid nitrogen immediately after sacrifice and stored at minus 80°C until RNA preparation. Both acute and chronic MPL dosing experiments have been previously published (Almon et al., 2007). In brief, populations of adrenalectamized male Wistar rats were given doses of the synthetic glucocorticoid, methylprednisolone (MPL). In the acute experiment the animals were given a single bolus dose (50 mg/kg) of MPL and were sacrificed at 16 times over a 72 hour period following dosing. In the chronic experiment, the animals received a constant infusion of 0.3 mg/kg/h MPL via Alzet osmotic pumps and were sacrificed at 10 times over a 168 hour period. All rats had free access to rat chow and 0.9% saline drinking water. Our research protocol adheres to the Principles of Laboratory Animal Care (NIH publication 85-23, revised in 1985) and was approved by the University at Buffalo Institutional Animal Care and Use Committee.
Plasma Steroid Assays
Plasma corticosterone concentrations were determined by a sensitive normal-phase high-performance liquid chromatography (HPLC) method as previously described (Haughey and Jusko, 1988). The limit of quantitation was 10 ng/ml. The interday and intraday coefficients of variation (CV) were less than 10%.
Microarrays
Liver samples from each animal were ground into a fine powder in a mortar cooled by liquid nitrogen and 100 mg was added to 1 ml of pre-chilled Trizol Reagent (InVitrogen, Carlsbad CA). Total RNA extractions were carried out according to manufacturer’s directions and were further purified by passage through RNeasy mini-columns (QIAGEN, Valencia, CA) according to manufacturer’s protocols for RNA clean-up. Final RNA preparations were resuspended in RNase-free water and stored at −80°C. The RNAs were quantified spectrophotometrically, and purity and integrity assessed by agarose gel electrophoresis. All samples exhibited 260/280 absorbance ratios of approximately 2.0, and all showed intact ribosomal 28S and 18S RNA bands in an approximate ratio of 2:1 as visualized by ethidium bromide staining. Isolated RNAs from each liver sample was used to prepare the hybridization targets according to manufacturer’s protocols. The biotinylated cRNAs were hybridized to 54 individual Affymetrix GeneChips Rat Genome 230A (Affymetrix, Inc., Santa Clara, CA), which contained 15,967 probe sets. The 230A chip was used in the chronic infusion experiment as well allowing direct comparison between the two experiments. The 230A gene chips contain over 7,000 more probe sets more than the ones used (U34A) in our earlier muscle bolus dose MPL study (Almon et al., 2005). The high reproducibility of in situ synthesis of oligonucleotide chips allows accurate comparison of signals generated by samples hybridized to separate arrays. This data set has been submitted to GEO (GSE8988).
Dataset construction
As detailed above, animals were sacrificed at precise times on three successive days to obtain data points for the light period and three successive days to obtain data points for the dark period. Animals sacrificed at the same time on different days were treated as three replicates for that time to construct a 24 hr light:dark cycle. In order to obtain a clear picture of an entire cycle, two 24 hr periods were concatenated to obtain a 48 hr period which allowed visualization of rhythms that spanned the dark/light and dark/light transitions.
Data mining
A non-linear curve fit using MATLAB was conducted which fitted a sinus function [A*sin(Bt + c)] to the data including the replicates. Genes that could be curve fitted with a R2 correlation of greater than 0.8 were kept. This curve fitting approach enabled use of replicate information instead of depending on the ensemble average necessary with Fourier transforms or Lombs Scargle methods. This approach is viable due to our relatively large number of time samples. This dataset was then loaded into a data mining program, GeneSpring 7.0 (Silicon Genetics, Redwood City, CA), and we normalized the value of each probe set on each chip to the average of that probe set on all chips. In order to identify genes with similar patterns of oscillation within the daily cycle we applied Quality Threshold Clustering (QT) in GeneSpring using Pearson’s correlation as the similarity measurement.
RESULTS
Data mining
It is assumed that genes whose expression levels are part of the circadian rhythm will show one full oscillation every twenty-four hours. However, in light of possible ultradian or infradian cycles within the data, we have utilized a much more general model of periodic signals given as [A*sin(Bt + c)]. A non-linear curve fit was conducted which fitted a sinusoid to the data including the replicates. We identified 265 probe sets which fit the model [A*sin(Bt + c)] with a R2 correlation greater than 0.8. With this more general model, we found that all genes which showed a high level of correlation had similar values for B and showed one full cycle over 24 hours. This suggests that while there may exist ultradian or infradian signals, they were not evident in the experimental dataset, perhaps due to the sampling strategy employed in the experimental design. Using GeneSpring, we normalized the value of each probe set on each chip to the average of that probe set on all chips such that the expression pattern of all probe sets oscillated approximately around 1. There appear to be two major patterns as illustrated in Figure 1, with one pattern reflecting maximum expression during the light/inactive period while the others reach a maximum during the dark/active period. However, oscillations in expression have more discrete relationships to the light/dark periods. In order to group genes with similar patterns within the daily cycle we applied QT Clustering, yielding 5 clusters. Figure 2 shows these five clusters with the centriod (average of all of the genes in each cluster) highlighted in white. Approximately two-thirds of the probe sets reach maximum expression during the dark/active period. Supplementary Tables 1–5 (available online) provide a detailed list of all genes in each cluster, including Probe Set ID, Accession Number, Pearson’s correlation coefficient with the centroid, gene symbol, gene name, and gene function. Corticosterone reaches its maximum plasma concentration in these animals at hour 13.3 (Figure 3).
Figure 1.

Expression of circadian regulated genes. A non-linear curve fit using MATLAB was conducted which fitted a sinus function [A*sin(Bt + c)] to the data including the replicates. Genes that could be curve fitted with a R2 correlation of greater than 0.8 were kept.
Figure 2.

QT clustering of circadian regulated genes. Each probe set has greater than a .75 Person’s correlation with the centroid of the cluster (shown in white0.
Figure 3.
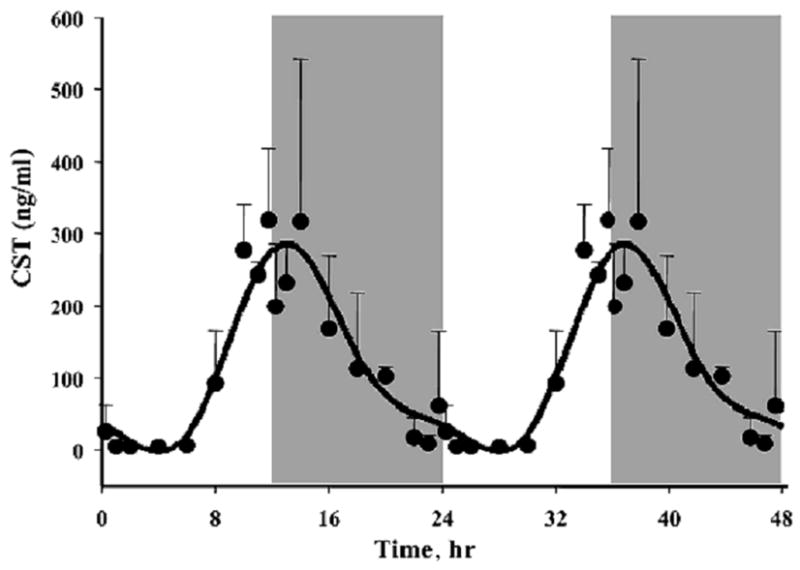
Plasma corticosterone (CST) as a function of circadian time as measured by HPLC. Symbols represent means and error bars 1 sd of the mean. Unshaded areas indicate light period and shaded areas indicate dark period.
Regulation
Three basic categories of transcription factors have been associated with control of circadian oscillation in gene expression. The first are those that participate through E-Box binding, the second through DBP/E4BP4 binding elements (D-boxes), and the last through RevErbA/ROR binding elements (RREs). We examined the chip for probe sets for transcription factors previously identified as involved in regulation of circadian patterns (Ueda et al., 2005). The 230A chip contained probe sets for 16 out of 17 of these transcription factors. However, only five (PER2, BMAL1b, DBP, Nr1d1, and Nr1d2) showed distinct circadian oscillation. Figure 4 shows the circadian patterns of these five genes in relation to the light/inactive and dark/active periods. Consistent with the literature on the core clock in the SCN, BMAL1b reaches a maximum during the light period while PER2 reaches a maximum during the dark period. The chip did contain probe sets for Clock, PER1, PER 3, CRY2, Bhlhb2 (Basic Helix-Loop-Helix Domain-Containing Protein, Class B 2, Dec1); Bhlhb3 (Basic Helix-Loop-Helix Domain-Containing Protein, Class B 3, Dec2, Sharp1); NFIL3A (Nuclear Factor, Interleukin 3 Regulated, E4BP4); RORA (RAR-Related Orphan Receptor A, RAR-Related Orphan Receptor Alpha, RZR-Alpha, RZRA, Retinoic Acid-Binding Receptor Alpha); RORB (RAR-Related Orphan Receptor B, RAR-Related Orphan Receptor Beta, RZR-Beta, RZRB, Retinoic Acid-Binding Receptor Beta) and RORC (RAR-Related Orphan Receptor C, RAR-Related Orphan Receptor Gamma, RORG, RZR-Gamma, RZRG, Retinoic Acid-Binding Receptor Gamma). We visually inspected the signals for these circadian related genes. The objective was to ascertain if there was a signal that just did not oscillate with a 24 hour frequency or if the signal was either not present or too low to be measured by the probe set. Signal intensities for Bhlhb2, NFIL3A, Clock, RORC, and RORB were sufficiently strong to indicate that they were expressed in the tissue even though they did not have a circadian rhythm. For the remainder of the probe sets, the signal was very low indicating that either they are not expressed in the tissue or that the probe set was not adequate to measure their presence.
Figure 4.

Expression patterns of 5 clock related transcription factors in liver as a function of circadian time. Unshaded areas indicate light periods and shaded areas indicate dark periods.
Previously we conducted two time series experiments in which cohorts of rats were given MPL either as a single bolus dose or chronic infusion and livers analyzed by gene arrays (Almon et al., 2005; Almon et al., 2007). Because a major regulator of circadian rhythms is the HPA axis, these arrays were examined for clock genes. Figure 5 and 6 show the acute and chronic profiles for both PER2 and BMAL1, two major clock genes. In the acute profile both respond to the single dose with a transient oscillation. With chronic infusion, both genes begin to oscillate but after about 48 hours all points for BMAL1 shows enhanced expression while all points for PER2 shows down-regulation. Three additional clock genes, DBP, nr1d1 and nr1d2, all have acute and chronic profiles similar to PER2 with the chronic profiles being consistently down-regulated after 48 hrs (Figures 7–9).
Figure 5.

Expression patterns of PER2 as a function of time after MPL administration to adrenalectomized animals. Left panels present data from acute (bolus 50 mg/kg) MPL dosing; right panels present data from chronic (0.3 mg/kg/h) MPL infusion. Array signals are normalized to zero time control values, and plotted as mean relative intensity at each time point. Error bars represent 1 sd of the mean.
Figure 6.

Expression patterns of BMAL1 as a function of time after MPL administration to adrenalectomized animals. Left panels present data from acute (bolus 50 mg/kg) MPL dosing; right panels present data from chronic (0.3 mg/kg/h) MPL infusion. Array signals are normalized to zero time control values, and plotted as mean relative intensity at each time point. Error bars represent 1 sd of the mean.
Figure 7.
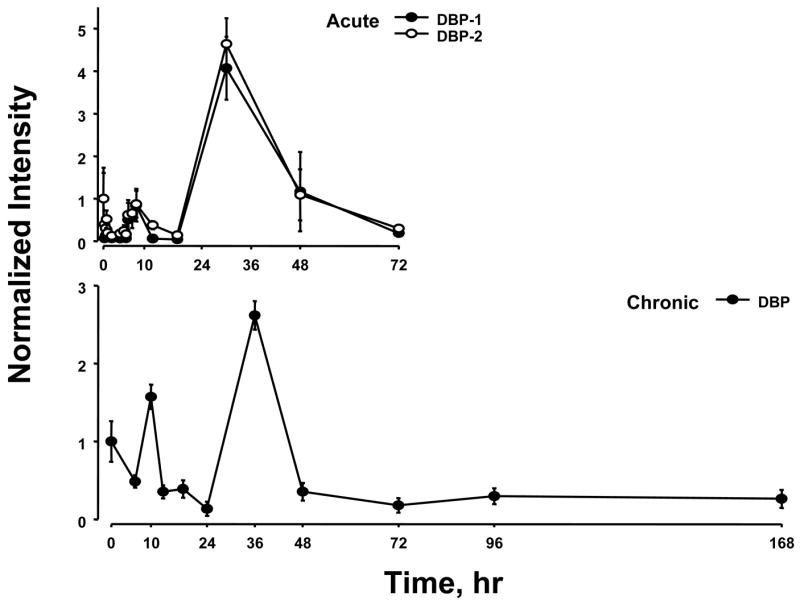
Expression patterns of DBP as a function of time after MPL administration to adrenalectomized animals. Upper panel presents data from acute (bolus 50 mg/kg) MPL dosing; lower panel presents data from chronic (0.3 mg/kg/h) MPL infusion. Array signals are normalized to zero time control values, and plotted as mean relative intensity at each time point. Error bars represent 1 sd of the mean. The array used for the acute experiments contained 2 probe sets for DBP, and both are presented.
Figure 9.

Expression patterns of Nr1d2 as a function of time after MPL administration to adrenalectomized animals. Upper panel presents data from acute (bolus 50 mg/kg) MPL dosing; lower panel presents data from chronic (0.3 mg/kg/h) MPL infusion. Array signals are normalized to zero time control values, and plotted as mean relative intensity at each time point. Error bars represent 1 sd of the mean. The array used for the chronic experiments contained 2 probe sets for Nr1d2, and both are presented.
Although the data suggest that BMAL1 may be continuously up regulated after 48 hours and that PER2, DBP, nr1d1 and nr1d2 may be continuously down regulated after 48 hours, this conclusion may be an artifact of sampling times. If one simply ignores the 36 hour point between 24 hours and 48 hours the conclusion of continuous up or down regulation extends back 24 hours. An alternative possibility is that all continue to oscillate with BMAL1 being out of phase with PER2, DBP, nr1d1 and nr1d2.
Functional groupings
Using extensive literature searches and domain knowledge we parsed all of the genes for which there were probe sets with a 24 hour frequency of oscillation into functional groups. We were able to identify genes that corresponded to all but eleven of the 265 probe sets. In all cases we attempted to classify the gene with respect to its function in the liver. This categorization is not perfect because some genes can fit into more than one group. For example, we placed interleukin 32 (IL32) and Kruppel-like factor 13 (Klf13) in the Immune Related group, whereas they could also have been placed in the Signaling and Transcription Regulation groups respectively. The thirteen functional groups are as follows: Bile Acid/Cholesterol Biosynthesis; Cell Cycle/Apoptosis; Translation/Protein Processing; Cytoskeleton; Carbohydrate/Glucose Metabolism; Immune Related; Lipid Metabolism; Mitochondrial; Protein Degradation; Signaling; Small Molecule Metabolism; Transcription Regulation; and Other. Table 1 shows the relevant information for each probe set in each functional grouping along with the cluster to which it belongs. As can be seen in Figure 2, Clusters 1 and 2 reach maxima during the light period, Cluster 3 reaches a maximum very close to the transition between light and dark while Clusters 4 and 5 reach maxima during the dark period. The most highly populated functional group is Translation/Protein Processing which contains 65 probe sets. Interestingly 55 of the probe sets are in Clusters 4 and 5 with maxima during the dark period. In contrast, the second most populated functional group is Cell Cycle/Apoptosis with 35 probe sets that are distributed almost equally between Clusters 1 and 2 with maxima during the light period and Clusters 4 and 5 with maxima during the dark period. The next two most populated groups are Lipid Metabolism and Transcription Regulation with 21 probe sets each. Lipid Metabolism has several probe sets in Cluster 3 with most of the remainder in Clusters 4 and 5. This pattern suggests that the system begins to anticipate the active dark period during the end of the light inactive period. Transcription Regulation shows no anticipation but Clusters 4 and 5 clearly dominate. The next two most populated groups are Bile Acid/Cholesterol Biosynthesis and Cytoskeleton, with 16 and 15 probe sets respectively. Quite clearly, Cluster 4 contains major enzymes involved in cholesterol biosynthesis while the production and movement of bile acids seems much more distributed. The remaining functional groups, Signaling (14), Carbohydrate/Glucose metabolism (13), Small Molecule Metabolism (12), Mitochondrial (12), Immune Related (11) and Protein Degradation (6) also have distributions that indicate functional significance during different times of the circadian cycle. The Other category contains 24 probe sets but 11 of these could not be assigned a function.
Table 1.
Functional Characterization of Circadian Regulated Genes in Liver.
| Probe ID | Accession No. | Cluster | Symbol | Gene Name | Gene Function |
|---|---|---|---|---|---|
| Translation/Protein Processing | |||||
| 1377192_a_at | BM384629 | 1 | Clpx | caseinolytic peptidase X | protein chaperone to mitochondria |
| 1372536_at | AI105042 | 1 | Cabc1 | chaperone, ABC1 activity of bc1 complex like | p53 induced chaperone, for protein complexes in the respiratory chain |
| 1390107_at | BG670294 | 1 | Sytl2 | synaptotagmin-like 2 | vesicle trafficking |
| 1386918_a_at | AF087827 | 1 | Oprs1 | opioid receptor, sigma 1 | export of lipids fromER to plasma membrane |
| 1389965_at | AA799818 | 2 | Tgoln2 | trans-Golgi network protein 2 | key sorting station for proteins, membrane traffic in secretory pathway |
| 1390697_at | BI278125 | 2 | Gemin8 | gem (nuclear organelle) associated protein 8 | small nuclear ribonucleoprotein assembly |
| 1373730_at | BI282077 | 2 | RBM33 | RNA binding motif protein 33 | RNA binding |
| 1367537_at | AI012479 | 2 | Eif4enif1 | eukaryotic translation initiation factor 4E nuclear import factor 1 | translation |
| 1398994_at | BI301193 | 2 | Tpst2 | protein-tyrosine sulfotransferase 2 | posttranslational modification |
| 1388901_at | AW534837 | 3 | Fkbp5 | FK506 binding protein 5 | glucocorticoid signaling, HSP90 |
| 1398240_at | NM_024351 | 4 | Hsp70 | heat shock protein 70; heat shock 70kD protein 8 | molecular chaperone, assists in the correct folding of other proteins |
| 1398819_at | NM_022934 | 4 | Hsj2, Dnaja1, Hsp40 | DNAJ (Hsp40) homolog, subfamily A, member 1 | partners for Hsp70 chaperones |
| 1387780_at | NM_032079 | 4 | Dnaja2 | DNAJ (Hsp40) homolog, subfamily A, member 2 | partners for Hsp70 chaperones |
| 1368852_at | BG668811 | 4 | Hsj2 | DNAJ-like 2 heat-shock 40-KD protein 4 | partners for Hsp70 chaperones |
| 1372141_at | BI289500 | 4 | PFDN2 | prefoldin subunit 2 | molecular chaperone, assists in the correct folding of other proteins |
| 1388136_at | BF282660 | 4 | Timm9 | translocase of inner mitochondrial membrane 9 | import and insertion of hydrophobic proteins into mitochondrial inner membrane |
| 1372533_at | AI175790 | 4 | EDEM1 | ER degradation enhancer, mannosidase alpha-like 1 | accelerates degradation of misfolded proteins in ER |
| 1372085_at | AI237657 | 4 | Arl6ip2 | DP-ribosylation factor-like 6 interacting protein 2 | translocation of proteins across the ER membrane |
| 1371843_at | AI234128 | 4 | Yipf5 | Yip1 domain family, member 5 | intracellular trafficking Golgi, Rab GTPases |
| 1374903_at | AI234819 | 4 | Ignt3 | beta-1,6-acetylglucosaminyltransferase family polypeptide 3 | Golgi, glycoprotein synthesis |
| 1371580_at | AI102725 | 4 | Spfh1 | SPFH domain family, member 1 | ER lipid raft associated 1 |
| 1372642_at | BE113397 | 4 | RNU17A | E1 small nucleolar RNA gene | interact directly with unique segments of pre-rRNA |
| 1374288_at | BG374267 | 4 | FTSJ3 | FtsJ homolog 3 (E. coli) | nucleolar, ribosome assembly, rRNA methyltransferase 3 |
| 1398832_at | NM_012749 | 4 | Ncl | nucleolin | transcription of ribosomal RNA genes by RNA polymerase I, in ribosome maturation |
| 1371498_at | AI412685 | 4 | JTV1, p38 | tRNA synthetase cofactor p38 | transcription of genes encoding mRNA |
| 1373668_at | BG373075 | 4 | Polr2i | polymerase (RNA) II polypeptide I | DNA directed |
| 1371463_at | AI233239 | 4 | phf5a | PHD finger protein 5A | pre-mRNA splicing, transcriptional regulator |
| 1371596_at | AI008971 | 4 | Rnps1 | ribonucleic acid binding protein S1 | regulates alternative splicing of a variety of pre-mRNAs |
| 1389301_at | AI176665 | 4 | MBNL1 | muscle blind-like 2 isoform 1 | triplet-expansion RNA-binding protein |
| 1371372_at | AA944161 | 5 | p23 | prostaglandin E synthase 3, telomerase-binding protein p23, Hsp90 co-chaperone | heat-shock protein-90 chaperone p23, coupled to prostaglandin-endoperoxide H synthase-1 |
| 1398877_at | BI283691 | 5 | Stip1 | stress-induced phosphoprotein 1 | association of the molecular chaperones HSP70 and HSP90 |
| 1368049_at | NM_012670 | 5 | Tcp1 | T-complex 1 | cytosolic chaperone, role in folding of newly translated proteins in cytosol |
| 1371403_at | AA799545 | 5 | Cct3 | chaperonin subunit 3 (gamma) | chaperone, VHL protein (tumor suppressor) |
| 1383160_at | AA892238 | 5 | Chordc1 | cysteine and histidine-rich domain(CHORD)-containing, zinc-bp1 | binds to HSP90 |
| 1388898_at | AI236601 | 5 | Hsph1 | heat shock 105kDa/110kDa protein 1 | chaperone activity |
| 1375335_at | BI285700 | 5 | Hsp90 | heat shock 90kDa protein 1, beta | chaperone activity |
| 1375336_at | AI237389 | 5 | hsp84 | heat shock protein 84 | chaperone activity |
| 1372701_at | AI237597 | 5 | Hsp1a | heat shock protein 1, alpha | chaperone activity |
| 1372489_at | AI172498 | 5 | Slap | sarcolemma associated protein | chaperone activity |
| 1388331_at | BG057543 | 5 | Hsp90B1 | heat shock protein 90kDa beta (Grp94), member 1(HSP90B1) | chaperone activity |
| 1371435_at | BI279561 | 5 | Naca | nascent-polypeptide-associated complex alpha polypeptide | chaperone/stress, prevents inappropriate targeting of non-secretory polypeptides |
| 1371693_at | AA849757 | 5 | AHSA1 | activator of heat shock 90kDa protein ATPase homolog 1 | stimulated the intrinsic ATPase activity of HSP90 |
| 1367686_at | NM_030835 | 5 | RAMP4, SERP1 | ribosome associated membrane protein 4 | stabilization of membrane proteins in response to stress |
| 1373319_at | BF419628 | 5 | Ddx1 | DEAD (Asp-Glu-Ala-Asp) box polypeptide 1 | RNA helicases, influence initiation, splicing, and ribosome and splicesome assembly |
| 1367480_at | AI230248 | 5 | Dhx15, EIF4A3 | DEAD (Asp-Glu-Ala-Asp) box polypeptide 48 | eukaryotic translation initiation factor 4A, isoform 3 |
| 1398937_at | BI279381 | 5 | Dhx15 | DEAH (Asp-Glu-Ala-His) box polypeptide 15 | ATP-dependent RNA helicase, pre-mRNA splicing factor |
| 1388528_at | AW433875 | 5 | Fbl | fibrillarin | component of nucleolar small nuclear ribonucleoprotein particle, processing preribosomal RNA |
| 1371505_at | BG381750 | 5 | Hnrpc | heterogeneous nuclear ribonucleoprotein C | mRNA (pre-mRNA) major constituents of ribonucleoprotein particles |
| 1371957_at | BM388851 | 5 | IMP4 | IMP4, U3 small nucleolar ribonucleoprotein | ribosomal protein |
| 1371445_at | BF285649 | 5 | p34 | leucine-rich-repeat-protein superfamily; p34 protein, ribosome binding | ribosome binding |
| 1375181_at | AI170643 | 5 | Rpl12 | ribosomal protein L12 | 60S ribosomal subunit |
| 1398315_at | AA800007 | 5 | Rpl15 | ribosomal protein L15 | 60S ribosomal subunit |
| 1398871_at | BG671311 | 5 | Rpl17 | ribosomal protein L17 | 60S ribosomal subunit |
| 1398885_at | AA925327 | 5 | Rpl23 | ribosomal protein L23 | 60S ribosomal subunit |
| 1398749_at | NM_022510 | 5 | Rpl4 | ribosomal protein L4 | 60S ribosomal subunit |
| 1398761_at | NM_031099 | 5 | Rpl5 | ribosomal protein L5 | chaperone for 5S rRNA |
| 1367606_at | NM_017153 | 5 | Rpls3a | ribosomal protein S3a | ribosome biogenesis; protein biosynthesis |
| 1388117_at | AI411893 | 5 | Snrpb | small nuclear ribonucleoprotein polypeptides B and B1 (Snrpb) | pre-mRNA splicing |
| 1376252_at | AI145784 | 5 | SRp20, Sfrs3 | splicing factor, arginine/serine-rich 3 (SRp20)(Sfrs3) | SR family of mRNA splicing factors, consecutive serine (S) and arginine (R) dipeptides |
| 1389344_at | BE109258 | 5 | Usp39 | ubiquitin specific protease 39 | possible competitor of ubiquitin C-terminal hydrolases (UCHs) |
| 1388424_at | AI407015 | 5 | Eif3s1 | eukaryotic translation initiation factor 3, subunit 1 alpha | Translation |
| 1373913_at | BF282271 | 5 | Pnpt1 | polyribonucleotide nucleotidyltransferase 1 | exosome complex, 3′ to 5′ exoribonuclease activity, RNA processing & degradation |
| 1372688_at | BI296190 | 5 | Exosc7 | exosome component 7 | rapid degradation of ARE-containing RNAs |
| 1398896_at | AA892567 | 5 | Arcn1 | archain 1 | coatomer associates with Golgi, biosynthetic protein transport from the ER |
| 1370305_at | U96490 | 5 | Yif1p | Yip1 interacting factor homolog A(YIF1A) | interacts with Yip1 |
|
| |||||
| Cell Cycle/Apoptosis | |||||
| 1367867_at | NM_013222 | 1 | Gfer, ALR | augmenter of liver regeneration; growth factor, erv1-like | induced expression of ODC and AMD1 (polyamine biosynthesis) |
| 1376788_at | AA818353 | 1 | Dapk1 | death associated protein kinase 1 | apoptosis positive mediators induced by gamma-interferon |
| 1388484_at | BI296084 | 1 | UBE2C | ubiquitin-conjugating enzyme E2C | regulated destruction of mitotic cyclins A and B |
| 1389408_at | BG379338 | 1 | Rrm2 | ribonucleotide reductase M2 | formation of deoxyribonucleotides from corresponding ribonucleotides |
| 1390117_at | BG372455 | 1 | Ypel2 | yippee-like 2 (Drosophila) | cell division |
| 1390381_at | BG379358 | 1 | Xpc | xeroderma pigmentosum, complementation group C | DNA repair |
| 1390672_at | BG381258 | 1 | RPRM | Reprimo | involved inp53-induced G2 cell cycle arrest |
| 1373542_at | BM386306 | 1 | Sphk2 | sphingosine kinase 2 (Sphk2) | formation of sphingosine 1-phosphate (SPP) |
| 1374747_at | BM384279 | 1 | PFTK1 | PFTAIRE protein kinase 1 | cyclin-dependent kinase related |
| 1388408_at | AA800199 | 1 | Prr13 | proline rich 13 | regulator of thrombospondin-1, taxol sensativity |
| 1368227_at | NM_031664 | 1 | Slc28a2 | solute carrier family 28 (sodium-coupled nucleoside transporter) a2 | purine nucleoside transport |
| 1369902_at | NM_139258 | 2 | Bmf | Bcl-2 modifying factor | proapoptotic members of the BCL2 family |
| 1370345_at | L11995 | 2 | Ccnb1 | cyclin B | complexes with p34(cdc2) to form the mitosis-promoting factor |
| 1370374_at | AF335281 | 2 | STEAP3 | STEAP family member 3 | downstream of p53 to interface apoptosis and cell cycle progression |
| 1388642_at | AI412114 | 2 | EI24 | etoposide induced 2.4 | apoptosis, p53-induced genes |
| 1373722_at | BE111697 | 2 | Kif20a | kinesin family member 20A_ | motor-driven transport processes that occur in mitotic cells |
| 1371632_at | AI231166 | 2 | CORO1C | Coronin, actin binding protein 1C | WD repeats |
| 1374939_at | BE112927 | 2 | Cyfip2 | cytoplasmic FMR1 interacting protein 2 | CYFIP2 is a direct p53 target responsible for p53-dependent apoptosis |
| 1368294_at | NM_053907 | 2 | Dnase1l3 | DNase gamma; deoxyribonuclease I-like 3 | apoptosis |
| 1374820_at | AI598946 | 4 | L3MBTL4 | l(3)mbt-like 4 (Drosophila) | changes in chromatin organization, cell cycle |
| 1375280_at | AW913871 | 4 | PNAS-4 | apoptosis-related protein PNAS-4 | protein targeting |
| 1387805_at | NM_053420 | 4 | Bnip3 | BCL2/adenovirus E1B 19 kDa-interacting protein 3 | pro-apoptotic mitochondrial protein |
| 1389738_at | AA848420 | 4 | Ung | uracil-DNA glycosylase | DNA repair enzyme |
| 1387244_at | NM_053899 | 4 | Cgr19 | cell growth regulatory with ring finger domain | p53 related, inhibits growth |
| 1367983_at | NM_053430 | 5 | Fen1 | flap structure-specific endonuclease 1 | removes 5-prime overhanging flaps in DNA repair and synthesis |
| 1370163_at | BF281299 | 5 | Odc1 | ornithine decarboxylase 1 | cell cycle, biosynthesis of polyamines |
| 1371418_at | BG665035 | 5 | CCT2 | chaperonin containing TCP1, subunit 2 (beta) | cyclin E accumulation, partner of cyclin-dependent kinase 2, positive control G1/S transition |
| 1387062_a_at | NM_080400 | 5 | Chek1 | checkpoint kinase 1 | timing of cell cycle transitions, DNA damage checkpoint |
| 1389384_at | BE111733 | 5 | Hrpap20 | hormone-regulated proliferation associated protein 20 | phosphoprotein required for proliferation and survival of hormone-dependent tumor cells |
| 1389658_at | BI283104 | 5 | Nsun2 | NOL1/NOP2/Sun domain family, member 2 | methyltransferase, disassembly nucleolus during mitosis, methylates RNA polymerase III |
| 1388629_at | BF281278 | 5 | Impdh2 | inosine 5-monophosphate dehydrogenase 2 | de novo synthesis of guanine nucleotides, regulation of cell growth |
| 1369962_at | NM_031014 | 5 | Atic | 5-aminoimidazole-4-carboxamide ribonucleotide formyltransferase/IMP cyclohydrolase | de novo purine biosynthesis |
| 1373625_at | AI412012 | 3 | Shmt1 | serine hydroxymethyl transferase 1 (soluble) | folate metabolism; biosynthesis of nucleotides and amino acids |
| 1373718_at | BM384071 | 1 | TUBB2 | tubulin, beta 2 | microtubules cytoskeleton |
| 1398317_at | BF283428 | 5 | Bpnt1 | bisphosphate 3′-nucleotidase 1 | nucleotide metabolism |
|
| |||||
| Lipid Metabolism | |||||
| 1374570_at | AI012474 | 1 | Agpat2 | 1-acylglycerol-3-phosphate O-acyltransferase 2 | signal transduction and lipid biosynthesis |
| 1389377_at | AA851803 | 1 | Insig2 | insulin induced gene 2 | blocks proteolytic activation of SREBPs by SCAP |
| 1367718_at | NM_017177 | 2 | Chetk | choline kinase-like; choline/ethanolamine kinase | first enzyme in phosphatidylcholine biosynthesis |
| 1388348_at | BI278590 | 2 | ELOVL5 | ELOVL family member 5, elongation of long chain fatty acids | fatty acid elongase |
| 1387183_at | J02844 | 2 | Crot | carnitine octanoyltransferase | beta oxidation, transfer of fatty acyl groups between CoA and carnitine |
| 1368426_at | NM_031987 | 2 | Crot | carnitine octanoyltransferase | beta oxidation, transfer of fatty acyl groups between CoA and carnitine |
| 1377921_at | AA875050 | 3 | ETNK2 | ethanolamine kinase 2 | first step of phosphatidylethanolamine (PtdEtn) biosynthesis |
| 1386960_at | NM_031589 | 3 | Slc37a4, G6pt1 | solute carrier family 37 member 4 | transports glycerol-3-phosphate between cellular compartments |
| 1367836_at | U88294 | 3 | CPTI | carnitine palmitoyltransferase I, mitochondrial | fatty acid metabolism |
| 1386946_at | NM_031559 | 3 | Cpt1a | carnitine palmitoyltransferase 1 alpha, liver isoform | fatty acid metabolism |
| 1371363_at | BI277042 | 4 | Gpd1 | glycerol-3-phosphate dehydrogenase 1 (soluble) | triglyceride synthesis |
| 1370150_a_at | NM_012703 | 4 | Thrsp, Lpgp, SPOT1 | thyroid hormone responsive protein | activates genes encoding enzymes of fatty acid synthesis |
| 1371400_at | AI169092 | 4 | Thrsp, Lpgp, SPOT1 | thyroid hormone responsive protein | activates genes encoding enzymes of fatty acid synthesis |
| 1387852_at | NM_012703 | 4 | Thrsp, Lpgp, SPOT1 | Thyroid hormone responsive protein | activates genes encoding enzymes of fatty acid synthesis |
| 1371012_at | AJ245707 | 4 | Hpcl2 | 2-hydroxyphytanoyl-CoA lyase. | peroxisome, alpha-oxidation of 3-methyl-branched fatty acids |
| 1368365_at | NM_031731 | 4 | Aldh3a2 | alcohol/aldehyde dehydrogenase family 3, subfamily A2 | catalyzes oxidation of long-chain aldehydes derived from lipid metabolism |
| 1390448_at | AA800699 | 4 | Abhd13 | abhydrolase domain containing 13 | triglyceride storage |
| 1386927_at | NM_012930 | 4 | Cpt2 | carnitine palmitoyltransferase 2 (Cpt2) | fatty acid metabolism |
| 1372318_at | AI235528 | 5 | ELOVL6 | ELOVL family member 6, elongation of long chain fatty acids | fatty acid synthesis |
| 1388108_at | BE116152 | 5 | ELO2 | fatty acid elongase 2 | fatty acid synthesis |
| 1369560_at | NM_022215 | 5 | Gpd3 | glycerol 3-phosphate dehydrogenase. | lipid and carrbohydrate metabolism |
|
| |||||
| Transcription Regulation | |||||
| 1370510_a_at | AB012600 | 1 | BMAL1b, Arntl | aryl hydrocarbon receptor nuclear translocator-like | circadian transcription factor |
| 1374753_at | AI105113 | 1 | PAPD4 | PAP associated domain containing 4 | DNA binding, transferase activity |
| 1370381_at | U61729 | 1 | PNRC1, FBXO11 | proline-rich nuclear receptor coactivator 1, F-box protein 11 | nuclear, type II protein arginine methyltransferase |
| 1398362_at | AI011448 | 1 | NOTCH2 | Transreg | notch homolog 2 (Drosophila) |
| 1370928_at | BI284739 | 2 | Litaf, RFX4 | regulatory factor X, 4 (influences HLA class II expression) | winged-helix transcription factor |
| 1373015_at | BI280348 | 2 | Rnf11 | ring finger protein 11 | modulator of growth factor receptor signalling and transcription |
| 1370975_at | AI172079 | 2 | JMJD1A | jumonji domain containing 1A | STAT3 signaling, transcription |
| 1367771_at | NM_031345 | 4 | Gilz | glucocorticoid-induced leucine zipper | glucocorticoid-induced leucine zipper that inhibits NF-B activity |
| 1371524_at | AI009608 | 4 | Gtl3 | trap locus 3, transcription factor IIB-like | transcription initiation in eukaryotes is mediated by the TATA-binding protein |
| 1369270_at | NM_052980 | 4 | Nr1i2 | nuclear receptor subfamily 1, group I, member 2 | pregnane X receptor (PXR) activates cytochrome P450-3A, xenobiotic and drug metabolism |
| 1372320_at | BE103894 | 4 | Msl31 | male-specific lethal-3 homolog 1 | chromatin remodeling and transcriptional regulation |
| 1377042_at | BI288196 | 4 | PCGF5, | polycomb group ring finger 5 | chromatin remodeling |
| 1374709_at | AI406795 | 4 | HLF, PAR bZIP | hepatic leukemia factor | proline and acidic amino acid-rich basic leucine zipper transcription factor family (circadian) |
| 1367541_at | BE113965 | 4 | METTL5 | methyltransferase like 5 | DNA methylation |
| 1373472_at | AI177008 | 5 | Actr6 | ARP6 actin-related protein 6 homolog(Actr6) | role in heterochromatin formation, nuclear |
| 1370062_at | NM_080902 | 5 | Hig1 | HIG1 domain family, member 1A, Hypoxia-inducible gene 1 | protects cells from apoptosis |
| 1389412_at | AA800693 | 5 | ZNF306 | zinc finger protein 306 | transcriptional regulation |
| 1368303_at | NM_031678 | 5 | Per2 | period homolog 2 (Drosophila) | regulation of transcription, DNA-dependent; rhythmic behavior |
| 1389420_at | BI279446 | 5 | Stap2 | signal-transducing adaptor protein-2 | signal-transducing adaptor molecule, links several tyrosine kinases and STAT3 |
| 1371873_at | AA850735 | 5 | ANP32E, Cpd1 | acidic (leucine-rich) nuclear phosphoprotein 32 family, member E | nucleo-cytoplasmic shutteling phosphoprotein, chromatin remodeling |
|
| |||||
| Bile Acid/Cholesterol | |||||
| 1368336_at | NM_017126 | 1 | Fdx1 | ferredoxin 1. | steroid, vitamin D, and bile acid metabolism (mitochondrial) |
| 1372755_at | AI102073 | 1 | Mal2 | T-cell differentiation protein 2, MAL PROTEOLIPID PROTEIN 2 | basolateral-to-apical transcytosis |
| 1387470_at | NM_031699 | 1 | Cldn1 | claudin 1 | Ca(2+)-independent cell adhesion activity |
| 1375933_at | BM392116 | 1 | Cldn2 | claudin 2 | Ca(2+)-independent cell adhesion activity |
| 1368769_at | NM_031760 | 2 | Abcb11 | ABC transport protein, sub-family B, member 11 | major canalicular bile salt export pump |
| 1374531_at | AA926305 | 2 | Slc6a6 | solute carrier family 6 (taurine), member 6 | taurine is involved in bile acid conjugation |
| 1368778_at | NM_017206 | 2 | Slc6a6 | solute carrier family 6 (taurine), member 6 | taurine is involved in bile acid conjugation |
| 1370940_at | BG378746 | 2 | Tjp2 | tight junction protein 2 (zona occludens 2) | bile acid transport and circulation |
| 1375852_at | BM390399 | 4 | Hmgcr | 3-hydroxy-3-methylglutaryl-Coenzyme A reductase | rate-limiting step in cholesterol biosynthesis |
| 1387848_at | NM_013134 | 4 | Hmgcr | 3-hydroxy-3-methylglutaryl-Coenzyme A reductase | rate-limiting step in cholesterol biosynthesis |
| 1387017_at | NM_017136 | 4 | Sqle | squalene epoxidase | cholesterol biosynthesis, catalyzes the first oxygenation step in sterol biosynthesis |
| 1368275_at | NM_080886 | 4 | Sc4mol | sterol-C4-methyl oxidase-like | cholesterol biosynthesis |
| 1388872_at | BI290053 | 4 | Idi1 | isopentenyl-diphosphate delta isomerase | isoprenoid biosynthetic pathway (peroxisomal) |
| 1368878_at | NM_053539 | 4 | Idi1 | isopentenyl-diphosphate delta isomerase | isoprenoid biosynthetic pathway (peroxisomal) |
| 1374251_at | AA893192 | 4 | Kir4.2, KCNJ15 | potassium inwardly-rectifying channel, subfamily J, member 15 | maintains charge balance during bile secretion |
| 1368458_at | NM_012942 | 4 | Cyp7a1 | cytochrome P450 (cholesterol hydroxylase 7 alpha) | catalyzes the first step in bile acid synthesis |
|
| |||||
| Cytoskeleton | |||||
| 1375216_at | AA850909 | 1 | Pvrl2 | poliovirus receptor-related 2 | cell surface protein |
| 1389681_at | BI296388 | 2 | Pvrl2 | poliovirus receptor-related 2 | cell surface protein |
| 1371969_at | BI291848 | 2 | CALD1 | caldesmon 1 | cytoskeletal remodeling |
| 1376038_at | AI411054 | 2 | CDC42 | cell division cycle 42 (GTP binding protein, 25kDa) | delivery of newly synthesized proteins/lipids to plasma membrane |
| 1376572_a_at | AI045848 | 2 | SVIL | Supervillin | link between actin cytoskeleton and membrane |
| 1388566_at | AI102215 | 2 | Lasp1 | LIM and SH3 protein 1 | regulation of dynamic actin-based, cytoskeletal activities |
| 1375775_at | BI296701 | 2 | ODF3 | outer dense fiber of sperm tails 3 | component of sperm flagella outer dense fibers |
| 1388422_at | BI275904 | 2 | Lims2 | LIM and senescent cell antigen like domains 2 | adhesion sites between cells and extracellular matrix (ECM) |
| 1375941_at | BI292120 | 3 | Baiap2l1 | BAI1-associated protein 2-like 1 | cytoskeletal regulation and cellular organization |
| 1387856_at | BI274457 | 4 | Cnn3 | calponin 3, acidic | cytoskeleton |
| 1388874_at | BE113032 | 4 | Mtss1 | metastasis suppressor 1 | regulator of cytoskeletal dynamics, interacts with ATP-actin monomers |
| 1368068_a_at | NM_130740 | 4 | Pacsin2 | protein kinase C and casein kinase substrate 2 | organization of actin cytoskeleton and regulation of vesicular traffic |
| 1389639_at | BF283302 | 4 | PCDH1 | protocadherin 1 (cadherin-like 1) | mediate calcium-dependent cell-cell adhesion |
| 1387793_at | NM_021594 | 5 | Slc9a3r1 | solute carrier family 9 (sodium/hydrogen exchanger) isoform 3 regulator 1 | actin cytoskeleton reorganization requires the activation of a sodium/hydrogen exchanger |
| 1399082_at | AI176581 | 5 | Tmem33 | transmembrane protein 33 | multipass membrane protein |
|
| |||||
| Signaling | |||||
| 1399005_at | BG673380 | 1 | Ppp2r5a | protein phosphatase 2, regulatory subunit B | signaling |
| 1368036_at | M60103 | 2 | Ptprf | protein tyrosine phosphatase, receptor type, F | signaling, insulin |
| 1373864_at | BM388810 | 2 | MAP3K4 | mitogen-activated protein kinase kinase kinase kinase 4 | mediator of environmental stress, activates CSBP2 MAPK pathway |
| 1398273_at | NM_053599 | 2 | Efna1, B61 | ephrin A1 | receptor tyrosine kinase |
| 1372844_at | AW531877 | 2 | Efna1, B61 | ephrin A1 | receptor tyrosine kinase |
| 1389169_at | AA944158 | 2 | Pgrmc2 | progesterone receptor membrane component 2 | receptor |
| 1388531_at | BF283382 | 2 | Pgrmc2 | progesterone receptor membrane component 2 | receptor |
| 1388659_at | BI295783 | 2 | Carhsp1 | calcium regulated heat stable protein 1 | IGF-I signaling kinase substrate |
| 1373777_at | BF391820 | 3 | RGS16 | regulator of G-protein signaling 16 | inhibits G protein-coupled mitogenic signal transduction and activation (MAPK) cascade |
| 1371543_at | AI170047 | 4 | Mtmr2 | myotubularin related protein 2 | protein-tyrosine phosphatase, non-receptor |
| 1373842_at | BM390718 | 4 | N-WASP | Neural Wiskott-Aldrich syndrome protein | transmission of signals from tyrosine kinase receptors and small GTPases to cytoskeleton |
| 1373277_at | BG373457 | 5 | Tm2d3 | TM2 domain containing 3 | G protein-coupled receptor |
| 1373162_at | AI600085 | 5 | Tmem41a | transmembrane protein 41a | multipass membrane protein |
| 1372752_at | BF282632 | 5 | Tspan4 | tetraspanin 4 | complexes with integrins and other cell-surface proteins |
|
| |||||
| Small Molecule Metabolism | |||||
| 1377375_at | AA944898 | 1 | Aass | aminoadipate-semialdehyde synthase | lysine-degradation |
| 1375856_at | AI102258 | 1 | ABAT | 4-aminobutyrate aminotransferase | catabolism of gamma-aminobutyric acid (GABA) |
| 1375215_x_at | BE109558 | 1 | Pgpep1 | pyroglutamyl-peptidase I | drug and TRH metabolizing enzyme |
| 1398282_at | NM_053902 | 2 | Kynu | kynureninase (L-kynurenine hydrolase) | tryptophan-nicotinic acid pathway decreased formation of nicotinic acid |
| 1387156_at | NM_024391 | 3 | Hsd17b2 | 17-beta hydroxysteroid dehydrogenase type 2 | catalyzes interconversion of testosterone and androstenedione, as well as estradiol & estrone |
| 1389430_at | AI176172 | 4 | Hsd17b7 | hydroxysteroid (17-beta) dehydrogenase 7 | oxidizes or reduces estrogens and androgens |
| 1387233_at | NM_017235 | 4 | Hsd17b7 | hydroxysteroid (17-beta) dehydrogenase 7 | oxidizes or reduces estrogens and androgens |
| 1387109_at | NM_031576 | 4 | Por | NADPH-cytochrome P-450 oxidoreductase | donates electrons to all microsomal P450 enzymes |
| 1371031_at | AI454484 | 4 | Mat1a | methionine adenosyltransferase I, ALPHA | catalyzes formation of adenosylmethionine from methionine and ATP |
| 1368213_at | AI407454 | 4 | Por | P450 (cytochrome) oxidoreductase | donates electrons to all microsomal P450 enzymes |
| 1387659_at | AF245172 | 5 | Gda | guanine deaminase; EC 3.5.4.3 | catalyzes hydrolytic deamination of guanine |
| 1387336_at | NM_022635 | 5 | Cml4 | N-acetyltransferase Camello 4 | drug metabolism in liver |
|
| |||||
| Carbohydrate/Glucose Metabolism | |||||
| 1388318_at | BI279760 | 1 | Pgk1 | Phosphoglycerate kinase 1 | glycolysis |
| 1371251_at | L05541 | 2 | GALT | galactose-1-phosphate uridyltransferase | interconversion of galactose-1-phosphate and glucose-1-phosphate |
| 1390172_at | AI409946 | 2 | Dhtkd1 | dehydrogenase E1 and transketolase domain containing 1 | oxoglutarate dehydrogenase (succinyl-transferring) activity |
| 1387203_at | NM_013120 | 2 | Gckr | glucokinase regulatory protein | inhibits glucokinase |
| 1387361_s_at | NM_053291 | 2 | Pgk1 | Phosphoglycerate kinase 1 | glycolysis |
| 1387228_at | NM_012879 | 3 | Slc2a2, Glut2 | solute carrier family 2 A2 | low-affinity glucose transporter, type 2 |
| 1393516_at | AA892335 | 3 | Slc16a12 | solute carrier family 16, member 12 | monocarboxylic acid transporters: lactate, pyruvate |
| 1390530_at | AI169239 | 3 | Slc16a12 | solute carrier family 16, member 12 | monocarboxylic acid transporters |
| 1369467_a_at | NM_012621 | 4 | Pfkfb1 | 6-Phosphofructo-2-kinase/fructose-2,6-bisphosphatase 1 | glycolysis |
| 1368460_at | NM_031741 | 4 | Slc2a5 | solute carrier family 2, member 5 | facilitated glucose transporter |
| 1372602_at | BI295979 | 4 | SBP | genethonin 1 | starch binding protein |
| 1370299_at | M10149 | 5 | Aldob | aldolase B; liver | glycolysis |
| 1368328_at | NM_013089 | 5 | Gys2 | glycogen synthase 2 (liver). | glucose storage |
|
| |||||
| Mitochondrial | |||||
| 1376427_a_at | AI029729 | 1 | Gldc | glycine decarboxylase | mitochondrial, glycine cleavage system |
| 1398891_at | AI103129 | 1 | Mrpl15 | mitochondrial ribosomal protein L15 | mitochondrial |
| 1374765_at | BI288055 | 2 | Bdh1 | 3-hydroxybutyrate dehydrogenase, type 1 | mitochondrial membrane, specific requirement for phosphatidylcholine |
| 1371519_at | AA851258 | 2 | Etfdh | electron-transferring-flavoprotein dehydrogenase | inner mitochondrial membrane |
| 1372715_at | AA819349 | 3 | SLC25A1 | liver tricarboxylate carrier, mitochondrial | mitochondrial, solute carrier |
| 1373282_at | AI406494 | 3 | SLC25A33 | mitochondrial carrier protein MGC4399 | mitochondrial inner membrane |
| 1373383_at | AA848807 | 4 | Mterfd1 | MTERF domain containing 1 | mitochondrial transcription termination factor |
| 1367982_at | NM_024484 | 4 | Alas1 | aminolevulinic acid synthase 1 | mitochondrial, rate-limiting enzyme in heme biosynthesis |
| 1398349_at | AI411497 | 5 | Ak2 | adenylate kinase 2 | mitochondrial, ATP:AMP phosphotransferase |
| 1367670_at | NM_017005 | 5 | Fh1 | fumarate hydratase | mitochondrial, Krebs cycle, fumarate to malate |
| 1399058_at | BI288800 | 5 | Mrpl18 | mitochondrial ribosomal protein L18 | mitochondrial |
| 1371634_at | BE107851 | 5 | TMEM126A | transmembrane protein 126A | mitochondrial |
|
| |||||
| Immune | |||||
| 1373515_at | BI275737 | 1 | MAC2 | galectin-5 (RL-18) | macrophage galactose-specific lectin |
| 1372004_at | AI102065 | 1 | HEBP1 | heme binding protein 1 | chemoattractant for dendritic cells and monocytes |
| 1367850_at | NM_053843 | 1 | Fcgr3 | Fc receptor, IgG, low affinity III | neutrophil-specific antigen |
| 1372056_at | AI406687 | 2 | Cmtm6 | CKLF-like MARVEL transmembrane domain containing 6 | chemokine-like factor superfamily member 6 |
| 1386987_at | NM_017020 | 3 | Il6r | interleukin 6 receptor. | cell surface receptor linked signal transduction |
| 1383013_at | AI045857 | 3 | Klf13 | kruppel-like factor 13 | transcription F dominant transactivator of RANTES in T-cells |
| 1380905_at | AA893260 | 3 | IL32 | interleukin 32 | a cytokine and inducer of TNFalpha |
| 1373986_at | AI410107 | 3 | TNFSF11 | tumor necrosis factor superfamily, member 11 | ligand for TNF receptor, RANKL receptor, activator of NF-kappa-B ligand |
| 1388102_at | U66322 | 4 | DIG-1 | dithiolethione-inducible gene-1. | inhibits pro-inflammatory actions of LTB4 |
| 1382255_at | BE110785 | 4 | PBEF1 | visfatin, pre-B-cell colony-enhancing factor 1 | type II phosphoribosyltransferase enzyme involved in NAD biosynthesis |
| 1371770_at | AW434268 | 5 | Ke2 | MHC class II region expressed gene KE2 | centromeric end of major histocompatibility complex |
|
| |||||
| Protein Degradation | |||||
| 1368184_at | NM_130430 | 1 | Psmd9 | proteasome (prosome, macropain) 26S subunit, non-ATPase, 9 | covalent attachment of ubiquitin |
| 1389480_at | AI598462 | 4 | Rwdd4a | RWD domain containing 4A | ubiquitin protein ligase activity |
| 1372115_at | AI408477 | 4 | UBR2 | ubiquitin protein ligase E3 component n-recognin 2 | recognize substrate’s destabilization signal, proteolysis |
| 1375549_at | AI407719 | 4 | Usp2 | ubiquitin specific peptidase 2 | disassembly of polyubiquitin chains |
| 1387703_a_at | AF106659 | 4 | Usp2 | ubiquitin-specific, cysteine protease | disassembly of polyubiquitin chains |
| 1376849_at | BM384872 | 5 | Usp48 | ubiquitin specific protease 48 | protein ubiquitination |
|
| |||||
| Other | |||||
| 1398950_at | BI275914 | 1 | Scel | sciellin | assembly/regulation of proteins in cornified envelope |
| 1398902_at | BF282978 | 1 | EST | mKIAA0664 protein | unknown function |
| 1390042_at | AI071166 | 1 | EST | Unknown | unknown function |
| 1373312_at | BI295064 | 1 | Pnkd | paroxysmal nonkinesiogenic dyskinesia | stress, hydroxyacylglutathione hydrolase, detoxify methylglyoxal |
| 1367838_at | NM_017074 | 1 | Cth | CTL target antigen (Cth) | hepatic synthesis of glutathione |
| 1389156_at | BM384589 | 2 | LOC498606 | hypothetical protein LOC498606 | unknown function |
| 1376709_at | BM388442 | 2 | Slc39a8 | solute carrier family 39 (metal ion transporter), member 8 | zinc transporter |
| 1387038_at | NM_053425 | 3 | Ccs | copper chaperone for superoxide dismutase | copper chaperone |
| 1376868_at | BM389293 | 3 | Cobll1 | Cobl-like 1(Cordon-bleu) | unknown function |
| 1389717_at | AI171467 | 4 | EST | KIAA0157 | unknown function |
| 1389561_at | BE110624 | 4 | EST | Unknown | unknown function |
| 1389256_at | BG381256 | 4 | EST | Unknown | unknown function |
| 1373870_at | BE110630 | 4 | FAM98A | family with sequence similarity 98, member A | unknown function |
| 1371147_at | X69834 | 4 | SERPINA3 | serine protease inhibitor 2.4. | plasma protein |
| 1369976_at | NM_053319 | 5 | Pin | dynein, cytoplasmic, light chain 1 | effects nitric oxide synthase activity |
| 1392928_at | AA891693 | 5 | PXMP3 | peroxisomal membrane protein 3, 35kDa (Zellweger syndrome) | peroxisome assembly |
| 1388534_at | AA851369 | 5 | SLC31A1 | solute carrier family 31, member 1 | high-affinity copper uptake |
| 1388325_at | BF281358 | 5 | Atp6v1d | ATPase, H+ transporting, V1 subunit D | vacuolar-type proton pump ATPase transport |
| 1371564_at | AI169159 | 5 | Atp6v1e1 | ATPase, H+ transporting, V1 subunit E isoform 1 | vacuolar-type proton pump ATPase transport |
| 1382048_at | BI289589 | 5 | MYO1D | myosin ID | molecular motors, intracellular movements |
| 1380547_at | BI288519 | 5 | CLCN3 | chloride channel 3 | voltage-gated chloride channel |
| 1371976_at | AI102758 | 5 | EST | Unknown | unknown function |
| 1371916_at | AI409380 | 5 | SEPX1 | selenoprotein X, 1 | scavenging of ROS, oxudative stress |
| 1371763_at | BI274533 | 5 | EST | Unknown | unknown function |
| 1368230_a_at | U95161 | 5 | LOC56769 | nuclear protein E3-3 | unknown function |
Drug targets and biomarkers
Three of the functional groups presented in Table 1 were unusually rich in potential drug targets and biomarkers. These functional groups of genes were examined more closely to identify current or potential drug targets and biomarkers, exploring the premise that the use of a drug or measurements of biomarkers may be optimized by taking advantage of circadian variations in the associated gene targets.
Cholesterol/Bile Acid production
Enzymes associated with the synthesis of both cholesterol and bile acids are all in Cluster 4 which has a maximum expression four hours into the animal’s dark/active period. This is not particularly surprising since rats, being nocturnal, are active and ingest food during the dark period, thus requiring bile acids during this time. Notable in this cluster are two probe sets for the enzyme HMG-CoA reductase which is the target for statin cholesterol lowering drugs (Stacpoole et al., 1987; Staels, 2006), as well as Sqle, another potential target for hypocholesterolemic drugs (Chugh et al., 2003), and Cyp7a1, which is the rate-limiting enzyme in the conversion of cholesterol to bile acids and is inhibited by fibrates, a class of hypolipidemic drugs (Post et al., 2001). Clusters 1 and 2 (lights on +3 hr and +6 hr, respectively) contain genes that are important to bile acid flow. For example, Cluster 2 contains Abcb11 which mediates the elimination of cytotoxic bile salts from liver cells to bile, and therefore plays a critical role in the generation of bile flow. A variety of drugs inhibit this export pump which can cause drug-induced intrahepatic cholestasis, one of the major causes of hepatotoxicity (Carlton et al., 2004).
Cell Cycle/Apoptosis
Of these 35 genes, almost all are either cancer chemotherapeutic targets or biomarkers relevant to prognosis. They are distributed throughout the light/inactive and dark/active periods and as such are found in all five clusters. Clusters 1 and 2 both peak in the light period. Cluster 1 is particularly rich in both chemotherapeutic targets and biomarkers, including beta tubulin (the main target of paclitaxel) (Tommasi et al., 2007), TXR1 (whose up-regulation impedes taxane-induced apoptosis in tumor cells) (van Amerongen and Berns, 2006), DAPK1 (whose lack of or low levels of expression is associated with highly aggressive metastatic tumors and is also a prognostic marker for disease recurrence) (Fraser and Hupp, 2007), and reprimo (a candidate tumor-suppressor gene whose aberrant methylation is associated with various cancers) (Takahashi et al., 2005). Similar relationships to cancer can be found in the remaining seven genes in Cluster 1. Cluster 2 contains five genes related to apoptosis, including several Bcl-2-binding proteins (Erkan et al., 2005; Zhao et al., 2005). Cluster 3 which peaks close to the light/dark transition contains only one gene, SHMT1, whose polymorphism is related to methotrexate resistance (de Jonge et al., 2005). Clusters 4 and 5 both peak during the dark period. Cluster 4 contains five genes relevant to the control of cell cycle and apoptosis, including Bnip3, whose down-regulation is associated with increased resistance to both 5-fluoro-uracil and gemcitabine (Erkan et al., 2005). Cluster 5 contains six genes. Of particular import is ODC1, the first enzyme in polyamine biosynthesis. Many chemotherapeutic strategies involve inhibition of polyamine biosynthesis and ODC plays a significant role in many of these, which include direct inhibitors of the enzyme often in combination with polyamine uptake inhibitors (Basuroy and Gerner, 2006). In addition, there are therapeutic approaches seeking to silence the ODC gene (Nakazawa et al., 2007). ODC is also a prognostic indicator, with treatment outcome being inversely related to tumor content (Basuroy and Gerner, 2006). This cluster also contains several other genes involved with DNA repair and thus potential targets for cancer therapies.
Translation and Protein Processing
In this last functional group we included all genes directly associated with both translation such as ribosomal proteins and protein processing such as chaperonins which are large molecular assemblies that assist protein folding to the native state. Inhibitors of chaperonins are being assessed as chemotherapeutic agents while enhancers of chaperonin activity are under investigation because misfolded proteins are responsible for a variety of diseases (Fenton and Horwich, 2003; Murphy, 2005; Powers and Workman, 2006; Zheng and Yenari, 2006). Fifty-five of the 65 genes are concentrated in Clusters 4 and 5 which peak in the dark/active period. Cluster 4 includes Hsp70 and three of its partner proteins: Dnaja1; Dnaja2; and Hsj2 (Zheng and Yenari, 2006). It also contains several genes associated with ribosomal synthesis and assembly, one of which, nucleolin, is currently under investigation as a drug target (Sakita-Suto et al., 2007). A nucleolin antisense oligonucleotide is being studied for inhibition of tumor cell proliferation. Cluster 5 is even richer in genes associated with translation and protein processing. Among these are transcripts for 14 proteins with chaperonin activity including Hsp90, the most abundant molecular chaperone in eukaryotic cells and a major focus for drug development (Powers and Workman, 2006). It also contains many genes associated with ribosomes including five transcripts for proteins that are part of the 60S ribosomal subunit. In addition there are transcripts for RNA helicases, several proteins involved in mRNA processing and EIF4A3 (Chan et al., 2004). What is clear from these data is that, for the most part, protein synthesis and processing take place during the dark when the animal is active. However, there are a limited number of transcripts that reach a maximum at other times. For example, the only gene in Cluster 3 is FKBP5 which is both a potential drug target and a biomarker. Its isomerase activity is inhibited by FK506 (tacrolimus), a macrolide immunosuppressant. Allelic variations in the FKBP5 gene are associated with depression and response to antidepressants (Binder et al., 2004). This relationship to depression seems to be related to activity of the HPA axis. Therefore it is probably relevant that FKBP5 reaches an expression maximum at a time very close to when circulating corticosterone peaks.
DISCUSSION
This report describes an analysis of circadian rhythms of mRNA expression in the liver of adult male rats. Animals were sacrificed at nine times during a 12 hour light period and nine corresponding times during a 12 hour dark period. Liver RNAs from each of the 54 animals were applied to individual Affymetrix GeneChips (RAE230A). Analysis yielded 265 probe sets with a 24 hour frequency. Because of the richness of this dataset, we were able to apply QT clustering and identified 5 groups with maxima at different times during the cycle. Two peaked during the light period, two during the dark period, and one very close to the light to dark transition. Approximately two-thirds of the probe sets reach maximum expression during the active (dark) period. The chip in several cases contained more than one probe set for the same gene. In 14 out of 15 instances, all probe sets for the same gene sorted to the same cluster. The single exception was Pvrl2 which sorted to both Clusters 1 and 2. The correlation coefficient of the probe set in Cluster 1 (1375216_at) was 0.84 while the correlation coefficient of the probe set in Cluster 2 (1370345_at) was also 0.84. Both have amongst the lowest correlations with the centroids of their respective clusters.
Regulation of the central clock involves a number of other transcription factors that may be expressed in peripheral tissues. The array used here contained probe sets for PER1, PER2 and, PER3. However, only PER2 showed significant expression and circadian oscillation while PER1 and PER3 had very low signals. Similarly, probe sets for CRY2 and Bhlhb3 also had very low signals. A very low signal can be due to either the lack of expression of the gene or inadequacy of the probe set to measure the signal. In contrast, the chip contained probe sets for Bhlhb2, NFIL3A, Clock, RORC and RORB, and these signals were reasonably strong but without oscillation. It has been reported that at least in some tissues, Clock is expressed at tonic levels and that cycling is due to the rhymicity of its heterodimeric partner BMAL (Reddy et al., 2005). Of the remaining transcription factors that have been implicated in regulation of circadian changes in gene expression only PER2, BMAL DBP, Nr1d1, and Nr1d2 showed a pattern of circadian oscillation. PER2 was in Cluster 5 during the dark period while BMAL was in Cluster 1 during the light period. DBP, Nr1d1 and Nr1d2 are all in Cluster 3.
The fact that BMAL1, PER2, DBP, Nr1d1 and Nr1d2 all begin to oscillate in response to acute MPL dosing suggest that they are all glucocorticoid sensitive either directly or indirectly. The observation that following chronic dosing an initial oscillation of BMAL occurs followed by what appears to be continuous up-regulation while PER2, DBP, Nr1d1 and Nr1d2 shows oscillation followed by what appears to be continuous down-regulation is potentially informative. However, the apparent continuous up- or down-regulation of the genes may actually be an artifact of sampling times. Just as reasonable an interpretation of the results is that all five genes continue to oscillate throughout the infusion period with BMAL being out of phase with PER2, DBP, Nr1d1 and Nr1d2.
Because synthetic glucocorticoids are a widely used class of drugs, we compared circadian regulated gene expression with those directly regulated by corticosteroids. These datasets together allowed us to address two basic but related questions. The first is: do all genes that respond to corticosteroids have circadian rhythms? The second is: do all genes with circadian rhythms respond to corticosteroid? The answer to both questions is no. Seventy-seven of the genes identified were both circadian and MPL responsive. The fact that all genes that respond to MPL are not circadian and that all genes with circadian rhythms do not respond to MPL suggests that there exist some diversity in mediating mechanisms. This result is consistent with previously described observations comparing our acute and chronic profiles (Almon et al., 2007).
If an animal is diurnal, changes in mRNA expression near the end of the dark period begins to prepare the animal for the activity and feeding time. Similarly, changes during the end of the light period prepare the diurnal animal for inactivity and rest. Rats are nocturnal and cycling of gene expression in peripheral tissues like the liver is reversed relative to humans who are essentially diurnal. We explored the results with a focus of potential chronotherapeutic insight.
We identified several genes transcripts that are closely associated with hypocholesterolemic drug strategies. Among these are transcripts for HMG-CoA reductase, the statin target, Sqle, involved in cholesterol synthesis, and Cyp7a1 which is the fibrate target in conversion of cholesterol to bile acids. These transcripts are in Cluster 4 which reaches a maximum 4 hr into the animal’s dark/active period. The current practice of having patients take statins before they go to bed (Staels, 2006) would seem inappropriate since available data indicates that in humans, HMG-CoA reductase has a maximum expression at about 10 AM (Harwood et al., 1987; Stacpoole et al., 1987). In those experiments the investigators were directly measuring enzymatic activity in serially drawn mononuclear leukocyte. The assumption was that activity in mononuclear leukocyte mirrors activity in the liver. In contrast, whole body cholesterol biosynthesis has been reported to peak between midnight and 3 AM (Parker et al., 1982). In those experiments, the investigators used plasma mevalonic acid as a biomarker for whole body cholesterol biosynthesis. Mevalonic acid is the direct product of HMG-CoA reductase. In addition, urinary mevalonic acid has become an indicator of the effectiveness of statin drug treatment (Hiramatsu et al., 1998). However, our data is consistent with the data of Harwood et al. indicating the enzyme reaches its peak during the animal’s active feeding period which in the case of rats would be during the dark period as opposed to the light period in humans. The presence of squalene epoxidase in Cluster 4 further reinforces the validity of these observations. What is confusing is why plasma and urine mevalonic acid peak during the inactive period in humans. Most of the mevalonic acid synthesized in the liver is used for cholesterol and then bile acid biosynthesis. However, the preponderance of mevalonic acid in circulation is metabolized by the kidney with the primary products being squaline and lanosterol (Raskin and Siperstein, 1974). The reason that the timing of the use of statins is important may have less to do with efficacy in lowering cholesterol and more to do with the toxic side effect associated with destabilization of muscle membranes and the development of rhabdomyolysis.
Of the transcripts with circadian rhythms, 35 were for proteins related to cell cycle and apoptosis. In contrast to the cholesterol synthesis related genes, the genes in this functional group are distributed in all five clusters. A relationship between circadian rhythms and cell cycle is well established and our data simply confirms and elaborates on the observations of others. However, the exploitation of these observations in cancer chemotherapy is not straightforward. In cancer therapeutics the important consideration is outcomes, which is based on the balance between toxic and therapeutic effects. If all dividing cells are entrained the same way to the circadian rhythm, then attaining an optimum balance is more complicated. However, some evidence is available that at least in some cases cancer cells have altered organization of the cell cycle relative to the circadian rhythm (Canaple et al., 2003; Garcia-Saenz et al., 2006). To the degree that this is true then knowledge of the circadian expression of drug targets in normal cells may provide a basis for reducing toxicity. Adding to the complexity are the observations that endogenous circadian rhythms are often disrupted in cancer patients.
Of the 265 circadian transcripts, 65 are associated with translation and protein processing. Out of these, only 8 reach a maximum during the light/inactive period. Cluster 3, which reaches a maximum shortly after the transition, contains only one transcript, FKBP5. FKBP5 is associated with glucocorticoid signaling (Binder et al., 2004) and reaches a maximum expression very close to the maximum of the corticosterone circadian rhythm. Clusters 4 and 5 contain the remaining 55 transcripts. Prominent among these are 20 chaperone related proteins. Both inhibiting and enhancing chaperone activities are evolving drug strategies. An important set of drugs in this category are geldanamycin derivatives which inhibit Hsp90 causing the degradation of proteins involved in a large variety of cellular processes from cell cycle and apoptosis to angiogenesis. Because misfolded proteins are associated with several diseases there are a variety of approaches being developed to enhance the activity of Hsp90 and other chaperonins (Powers and Workman, 2006). Two particularly interesting areas are chaperone-mediated enzyme enhancement and gene therapy. What is also clear is that protein synthesis related expression occurs primarily in Cluster 5. The fact that six proteins that are part of the 60S ribosomal subunit are co-expressed in Cluster 5 tends to validate our results. Proteins that work together are expressed together.
With the burgeoning development of antisense oligonucleotides it is probable that more transcripts will become drug targets. Timing will be an important aspect in the use of antisense technology when applied to transcripts with circadian rhythms.
Supplementary Material
Figure 8.

Expression patterns of Nr1d1 as a function of time after MPL administration to adrenalectomized animals. Upper panel presents data from acute (bolus 50 mg/kg) MPL dosing; lower panel presents data from chronic (0.3 mg/kg/h) MPL infusion. Array signals are normalized to zero time control values, and plotted as mean relative intensity at each time point. Error bars represent 1 sd of the mean. The array used for the acute experiments contained 2 probe sets for Nr1d1, and both are presented.
Acknowledgments
This dataset was developed at the Children’s National Medical Center under the auspices of a grant from the National Heart, Lung, and Blood Institute (NHLBI)/NIH Programs in Genomic Applications HL 66614 (Eric P. Hoffman, PI). We would like to acknowledge the technical assistance of Ms. Nancy Pyszczynski and Ms. Suzette Mis.
This work was supported by grant GM 24211 from the National Institute of General Medical Sciences, NIH, Bethesda, MD. EY and IPA also acknowledge support from NSF grant 0519563 and EPA grant GAD R 832721-010.
Abbreviations
- ADX
adrenalectomized
- MPL
methylprednisolone
- SCN
suprachiasmic nucleus
References
- Almon RR, Dubois DC, Jin JY, Jusko WJ. Pharmacogenomic responses of rat liver to methylprednisolone: an approach to mining a rich microarray time series. AAPS Journal. 2005;7:E156–194. doi: 10.1208/aapsj070117. [DOI] [PMC free article] [PubMed] [Google Scholar]
- Almon RR, DuBois DC, Jusko WJ. A microarray analysis of the temporal response of liver to methylprednisolone: a comparative analysis of two dosing regimens. Endocrinology. 2007;148:2209–2225. doi: 10.1210/en.2006-0790. [DOI] [PMC free article] [PubMed] [Google Scholar]
- Badiu C. Genetic clock of biologic rhythms. Journal of Cellular & Molecular Medicine. 2003;7:408–416. doi: 10.1111/j.1582-4934.2003.tb00243.x. [DOI] [PMC free article] [PubMed] [Google Scholar]
- Basuroy UK, Gerner EW. Emerging concepts in targeting the polyamine metabolic pathway in epithelial cancer chemoprevention and chemotherapy. Journal of Biochemistry. 2006;139:27–33. doi: 10.1093/jb/mvj022. [DOI] [PubMed] [Google Scholar]
- Binder EB, Salyakina D, Lichtner P, Wochnik GM, Ising M, Putz B, Papiol S, Seaman S, Lucae S, Kohli MA, Nickel T, Kunzel HE, Fuchs B, Majer M, Pfennig A, Kern N, Brunner J, Modell S, Baghai T, Deiml T, Zill P, Bondy B, Rupprecht R, Messer T, Kohnlein O, Dabitz H, Bruckl T, Muller N, Pfister H, Lieb R, Mueller JC, Lohmussaar E, Strom TM, Bettecken T, Meitinger T, Uhr M, Rein T, Holsboer F, Muller-Myhsok B. Polymorphisms in FKBP5 are associated with increased recurrence of depressive episodes and rapid response to antidepressant treatment. Nature Genetics. 2004;36:1319–1325. doi: 10.1038/ng1479. [DOI] [PubMed] [Google Scholar]
- Canaple L, Kakizawa T, Laudet V. The days and nights of cancer cells. Cancer Research. 2003;63:7545–7552. [PubMed] [Google Scholar]
- Carlton VEH, Pawlikowska L, Bull LN. Molecular basis of intrahepatic cholestasis. Annals of Medicine. 2004;36:606–617. doi: 10.1080/07853890410018916. [DOI] [PubMed] [Google Scholar]
- Challet E, Caldelas I, Graff C, Pevet P. Synchronization of the molecular clockwork by light- and food-related cues in mammals. Biological Chemistry. 2003;384:711–719. doi: 10.1515/BC.2003.079. [DOI] [PubMed] [Google Scholar]
- Chan CC, Dostie J, Diem MD, Feng W, Mann M, Rappsilber J, Dreyfuss G. eIF4A3 is a novel component of the exon junction complex. Rna-A Publication of the Rna Society. 2004;10:200–209. doi: 10.1261/rna.5230104. [DOI] [PMC free article] [PubMed] [Google Scholar]
- Chugh A, Ray A, Gupta JB. Squalene epoxidase as hypocholesterolemic drug target revisited. Progress in Lipid Research. 2003;42:37–50. doi: 10.1016/s0163-7827(02)00029-2. [DOI] [PubMed] [Google Scholar]
- Dardente H, Klosen P, Caldelas I, Pevet P, Masson-Pevet M. Phenotype of Per1- and Per2-expressing neurons in the suprachiasmatic nucleus of a diurnal rodent (Arvicanthis ansorgei): comparison with a nocturnal species, the rat. Cell & Tissue Research. 2002;310:85–92. doi: 10.1007/s00441-002-0609-9. [DOI] [PubMed] [Google Scholar]
- de Jonge R, Hooijberg JH, van Zelst BD, Jansen G, van Zantwijk CH, Kaspers GJL, Peters GJ, Ravindranath Y, Pieters R, Lindemans J. Effect of polymorphisms in folate-related genes on in vitro methotrexate sensitivity in pediatric acute lymphoblastic leukemia. Blood. 2005;106:717–720. doi: 10.1182/blood-2004-12-4941. [DOI] [PubMed] [Google Scholar]
- Erkan M, Kleeff J, Esposito I, Giese T, Ketterer K, Buchler MW, Giese NA, Friess H. Loss of BNIP3 expression is a late event in pancreatic cancer contributing to chemoresistance and worsened prognosis. Oncogene. 2005;24:4421–4432. doi: 10.1038/sj.onc.1208642. [DOI] [PubMed] [Google Scholar]
- Fenton WA, Horwich AL. Chaperonin-mediated protein folding: fate of substrate polypeptide. Quarterly Reviews of Biophysics. 2003;36:229–256. doi: 10.1017/s0033583503003883. [DOI] [PubMed] [Google Scholar]
- Fraser JA, Hupp TR. Chemical genetics approach to identify peptide ligands that selectively stimulate DAPK-1 kinase activity. Biochemistry. 2007;46:2655–2673. doi: 10.1021/bi061562j. [DOI] [PubMed] [Google Scholar]
- Garcia-Saenz JA, Martin M, Maestro M, Vidaurreta M, Veganzones S, Villalobos L, Rodriguez-Lajusticia L, Rafael S, Sanz-Casla MT, Casado A, Sastre J, Arroyo M, Diaz-Rubio E. Circulating tumoral cells lack circadian-rhythm in hospitalized metastasic breast cancer patients. Clinical & Translational Oncology: Official Publication of the Federation of Spanish Oncology Societes & of the National Cancer Institute of Mexico. 2006;8:826–829. doi: 10.1007/s12094-006-0139-0. [DOI] [PubMed] [Google Scholar]
- Harwood HJ, Jr, Bridge DM, Stacpoole PW. In vivo regulation of human mononuclear leukocyte 3-hydroxy-3-methylglutaryl coenzyme A reductase. Studies in normal subjects. Journal of Clinical Investigation. 1987;79:1125–1132. doi: 10.1172/JCI112928. [DOI] [PMC free article] [PubMed] [Google Scholar]
- Haughey DB, Jusko WJ. Analysis of methylprednisolone, methylprednisone and corticosterone for assessment of methylprednisolone disposition in the rat. Journal of Chromatography A. 1988;430:241–248. doi: 10.1016/s0378-4347(00)83159-x. [DOI] [PubMed] [Google Scholar]
- Hiramatsu M, Hayashi A, Hidaka H, Ueshima H, Kanno T. Enzyme immunoassay of urinary mevalonic acid and its clinical application. Clin Chem. 1998;44:2152–2157. [PubMed] [Google Scholar]
- Labrecque G, Bureau JP, Reinberg AE. Biological rhythms in the inflammatory response and in the effects of non-steroidal anti-inflammatory drugs. Pharmacology & Therapeutics. 1995;66:285–300. doi: 10.1016/0163-7258(94)00082-e. [DOI] [PubMed] [Google Scholar]
- Murphy PJM. Regulation of glucocorticoid receptor steroid binding and trafficking by the hsp90/hsp70-based chaperone machinery: implications for clinical intervention. Leukemia. 2005;19:710–712. doi: 10.1038/sj.leu.2403687. [DOI] [PubMed] [Google Scholar]
- Nakazawa K, Nemoto T, Hata T, Seyama Y, Nagahara S, Sano A, Itoh H, Nagai Y, Kubota S. Single-injection ornithine decarboxylase-directed antisense therapy using atelocollagen to suppress human cancer growth. Cancer. 2007;109:993–1002. doi: 10.1002/cncr.22483. [DOI] [PubMed] [Google Scholar]
- Oishi K, Miyazaki K, Kadota K, Kikuno R, Nagase T, Atsumi G-i, Ohkura N, Azama T, Mesaki M, Yukimasa S, Kobayashi H, Iitaka C, Umehara T, Horikoshi M, Kudo T, Shimizu Y, Yano M, Monden M, Machida K, Matsuda J, Horie S, Todo T, Ishida N. Genome-wide expression analysis of mouse liver reveals CLOCK-regulated circadian output genes. Journal of Biological Chemistry. 2003;278:41519–41527. doi: 10.1074/jbc.M304564200. [DOI] [PubMed] [Google Scholar]
- Parker TS, McNamara DJ, Brown C, Garrigan O, Kolb R, Batwin H, Ahrens EH. Mevalonic acid in human plasma: relationship of concentration and circadian rhythm to cholesterol synthesis rates in man. Proc Natl Acad Sci. 1982;79:3037–3041. doi: 10.1073/pnas.79.9.3037. [DOI] [PMC free article] [PubMed] [Google Scholar]
- Post SM, Duez H, Gervois PP, Staels B, Kuipers F, Princen HM. Fibrates suppress bile acid synthesis via peroxisome proliferator-activated receptor-alpha-mediated downregulation of cholesterol 7alpha-hydroxylase and sterol 27-hydroxylase expression. Arteriosclerosis, Thrombosis & Vascular Biology. 2001;21:1840–1845. doi: 10.1161/hq1101.098228. [DOI] [PubMed] [Google Scholar]
- Powers MV, Workman P. Targeting of multiple signalling pathways by heat shock protein 90 molecular chaperone inhibitors. Endocrine-Related Cancer. 2006;13(Suppl 1):S125–135. doi: 10.1677/erc.1.01324. [DOI] [PubMed] [Google Scholar]
- Raskin P, Siperstein MD. Mevalonate metabolism by renal tissue in vivo. J Lipid Research. 1974;15:20–25. [PubMed] [Google Scholar]
- Reddy AB, Wong GKY, O’Neill J, Maywood ES, Hastings MH. Circadian clocks: neural and peripheral pacemakers that impact upon the cell division cycle. Mutation Research. 2005;574:76–91. doi: 10.1016/j.mrfmmm.2005.01.024. [DOI] [PubMed] [Google Scholar]
- Reinberg AE. Concepts in chronopharmacology. Annual Review of Pharmacology & Toxicology. 1992;32:51–66. doi: 10.1146/annurev.pa.32.040192.000411. [DOI] [PubMed] [Google Scholar]
- Sakita-Suto S, Kanda A, Suzuki F, Sato S, Takata T, Tatsuka M. Aurora-B regulates RNA methyltransferase NSUN2. Molecular Biology of the Cell. 2007;18:1107–1117. doi: 10.1091/mbc.E06-11-1021. [DOI] [PMC free article] [PubMed] [Google Scholar]
- Smolensky MH, Reinberg AE, Martin RJ, Haus E. Clinical chronobiology and chronotherapeutics with applications to asthma. Chronobiology International. 1999;16:539–563. doi: 10.3109/07420529908998728. [DOI] [PubMed] [Google Scholar]
- Stacpoole PW, Bridge DM, Alvarez IM, Goldberg RB, Harwood HJ., Jr In vivo regulation of human mononuclear leukocyte 3-hydroxy-3-methylglutaryl coenzyme A reductase. Decreased enzyme catalytic efficiency in familial hypercholesterolemia. Journal of Clinical Investigation. 1987;80:1401–1408. doi: 10.1172/JCI113218. [DOI] [PMC free article] [PubMed] [Google Scholar]
- Staels B. When the Clock stops ticking, metabolic syndrome explodes. Nature Medicine. 2006;12:54–55. doi: 10.1038/nm0106-54. discussion 55. [DOI] [PubMed] [Google Scholar]
- Takahashi T, Suzuki M, Shigematsu H, Shivapurkar N, Echebiri C, Nomura M, Stastny V, Augustus M, Wu C-W, Wistuba II, Meltzer SJ, Gazdar AF. Aberrant methylation of Reprimo in human malignancies. International Journal of Cancer. 2005;115:503–510. doi: 10.1002/ijc.20910. [DOI] [PubMed] [Google Scholar]
- Tommasi S, Mangia A, Lacalamita R, Bellizzi A, Fedele V, Chiriatti A, Thomssen C, Kendzierski N, Latorre A, Lorusso V, Schittulli F, Zito F, Kavallaris M, Paradiso A. Cytoskeleton and paclitaxel sensitivity in breast cancer: the role of beta-tubulins. International Journal of Cancer. 2007;120:2078–2085. doi: 10.1002/ijc.22557. [DOI] [PubMed] [Google Scholar]
- Ueda HR, Hayashi S, Chen W, Sano M, Machida M, Shigeyoshi Y, Iino M, Hashimoto S. System-level identification of transcriptional circuits underlying mammalian circadian clocks. Nature Genetics. 2005;37:187–192. doi: 10.1038/ng1504. [DOI] [PubMed] [Google Scholar]
- van Amerongen R, Berns A. TXR1-mediated thrombospondin repression: a novel mechanism of resistance to taxanes? Genes & Development. 2006;20:1975–1981. doi: 10.1101/gad.1460806. [DOI] [PubMed] [Google Scholar]
- Zhao X, Ayer RE, Davis SL, Ames SJ, Florence B, Torchinsky C, Liou JS, Shen L, Spanjaard RA. Apoptosis factor EI24/PIG8 is a novel endoplasmic reticulum-localized Bcl-2-binding protein which is associated with suppression of breast cancer invasiveness. Cancer Research. 2005;65:2125–2129. doi: 10.1158/0008-5472.CAN-04-3377. [DOI] [PubMed] [Google Scholar]
- Zheng Z, Yenari MA. The application of HSP70 as a target for gene therapy. Frontiers in Bioscience. 2006;11:699–707. doi: 10.2741/1828. [DOI] [PubMed] [Google Scholar]
Associated Data
This section collects any data citations, data availability statements, or supplementary materials included in this article.