Abstract
Dynamic simulations are used to investigate ion cluster formation in unsaturated aqueous NaCl at 25 °C. Statistical, structural, and dynamic properties are reported. An effort is made to identify general behaviors that are expected to hold beyond the limitations of the force field. Above ~1 M, clusters with more than ten ions begin to form after ~10–20 ns of simulation time, but no evidence of irreversible ion aggregation is observed. Cluster survival times are estimated, showing that the kinetics becomes increasingly complex as salt is added, leading to multiple decay rates. Cluster dipole moment distributions show characteristic peaks that reflect the cluster preferred conformations in solution. These are modulated by electrostatic and liquid-structure forces, and are described in detail for clusters of up to five ions. For a given size and charge, the cluster morphology is independent of salt concentration. Below ~2 M, clusters affect the structure of water in their first hydration shells, so dipole moments parallel to the cluster macrodipoles are induced. These effects show a weak dependence with concentration below ~2 M, but vanish in the 2–3 M range. A possible connection with the structural transition recently suggested by NMR data in concentrated electrolytes is discussed. The effects of electrostatics on cluster speciation and morphology are discussed based on results from a set of simulations carried out with the ionic charges removed.
1. Introduction
Ions in solution affect the physical and chemical properties of single molecules and molecular aggregates in a wide range of size scales. Despite their ubiquitous presence in nature and their widespread use in technological and industrial applications, the atomistic mechanisms operating in concentrated solutions are only partially understood. In contrast, thermodynamic and transport properties of bulk solutions are well characterized1,2, and extensive data have been compiled for unsaturated and saturated solutions2.
Part of the early theories of electrolytes was developed to explain electric conductivity data. Fuoss advanced the notion of ionic association in liquids of low dielectric constants3–6. Ions were assumed to form pairs7, as originally proposed by Bjerrum based on electrostatic considerations8,9, and higher order clusters. Modern theories are based on integral equations10 in which both electrostatic and liquid structure forces are accounted for. Experiments have been conducted to probe these atomistic hypotheses, although important practical limitations exist. Experimental methods commonly used to study ionic solutions include IR absorption spectroscopy11; Raman12, Brillouin13, Rayleigh14, Compton15, and dynamic16 light scattering; NMR spectroscopy17; and more traditional ones, such as neutron and X-ray diffraction experiments18,19. Although a number of assumptions are usually necessary to analyze and interpret the experimental data, these methods have been used successfully to study dynamic and structural properties of complex liquids. Experiments have suggested the presence of clusters in unsaturated solutions of complex salts12,20. Cluster formation and aggregation have also been observed in supersaturated21 and supercritical22 solutions, two thermodynamic regimes of considerable experimental interest. The former provide insight into the nature of salt nucleation in metastable conditions. The latter occur naturally in geologic environments, where they are thought to play a role in the formation of mineral deposits in the Earth’s crust23. They are also of interest due to their role in ore and fluid extraction.
Unfortunately, the basic question addressed in this paper, that is, whether Na+ and Cl− ions in unsaturated aqueous NaCl solutions form clusters at ambient or physiological conditions, is still open to debate. This is unfortunate, because these are the most common ions in biology and biochemistry, where their concentrations vary from highly diluted to nearly saturation (~5.3 M at ambient conditions). For example, high concentrations (~3–5 M) of NaCl are needed for survival of halobacteria, since their cell walls disintegrate if the concentration drops below a certain threshold, typically ~1 M. However, high salt concentrations kill most other microorganisms. On the other hand, concentrations of Na+ and Cl− in the blood plasma are in the ~100–150 mM range, while lower concentrations are common in other extracellular fluids. In vitro experiments frequently involve concentrations between the above limits. Therefore, it is desirable to gain a clear understanding of how Na+ and Cl− ions behave in unsaturated aqueous solutions within a wide concentration range.
The most direct means to probe the atomistic structure of complex liquids is through X-ray and neutron diffraction experiments24. However, these methods cannot provide an answer to the question of whether Na+ and Cl− form clusters in water. In this case the contribution of ion-ion pair correlations to the total scattering pattern is too small compared to the contributions from water-water and water-ion interactions. Therefore, the distributions gNa-Cl, gNa-Na and gCl-Cl, which determine the degree of ion complexation and could provide direct evidence of the presence of clusters in the liquid, cannot be resolved. These methods, however, do provide information on the microscopic structure of water, both in bulk and in the hydration shells of ions. In combination with methods suitable to probe the dynamics of water molecules11, a picture of the behavior of water in ionic solutions is emerging25 (cf. Section 4).
One of the few studies that has provided preliminary evidence of the presence of clusters in unsaturated aqueous NaCl solutions at ambient conditions is based on dynamic light scattering experiments16. Large particles were detected in aqueous solution at ~20 °C, and identified as ion clusters and aggregates. Assuming that relaxation times are the result of spatial diffusion of the colloids, hydrodynamic radii distributions were calculated. Two characteristic radii were obtained, below ~1 nm and above ~100 nm. Unfortunately, these experiments lack atomistic resolution, so they are unable to provide information on cluster structure and dynamics.
Computer simulations have emerged as the most direct means to investigate atomistic properties of aqueous ionic solutions. Despite their limitations (cf. Section 5), they allow a detailed study of processes that are difficult to probe experimentally. These include ion cluster speciation, dynamics, and morphology, which are the main subjects of this paper; and the structure and dynamics of water. Computer simulations of aqueous ionic solutions have been reported in recent years under a variety of thermodynamic conditions, and for a number of salts22,23,26–34. For example, classical simulations have shown that guanidinium sulfate aggregates into large clusters, while guanidinium thiocyanate does not; both result are consistent with data from neutron diffraction experiments30. Simulations have also shown ion aggregation in other complex aqueous salts, such as ammonium sulfate35; these results seem consistent with data from dynamic light scattering experiments16. Simulations of simpler electrolytes have also shown evidence of cluster formation, although their experimental corroboration has been more elusive. Ion pairing and formation of small clusters has been detected in 1:1 electrolytes, including NaCl, at ambient conditions26,32,36. Simulations have been used to investigate early steps of nucleation in oversaturated NaCl solutions29, cluster formation of NaCl at supercritical conditions22,23,27, and ion pairing in NaCl at near-critical temperatures in a broad range of densities, from liquid to steam-like37.
Because of limitations in computer power earlier studies have been restricted to small systems and/or short simulation times. Recently, 10-ns MD simulations have provided evidence32 of cluster formation in 1 molal NaCl in water at 25 °C. These long simulations allowed statistically reliable calculations of the interconversion rates between clusters of different sizes. In this paper, results from a set of 40-ns molecular dynamics simulations of NaCl in water at 25 °C and 1 atm are reported. Salt concentrations are in the 0.1–3 M range. Long simulations are needed because the larger clusters take longer to form, as discussed herein. A reduced number of statistical, structural, and dynamic properties are studied to gain insight into the cluster speciation process.
2. Methods
The simulations were performed with classical potentials using the CHARMM program38. A cubic cell of volume ~(46Å)3 containing ~3500 non-polarizable (TIP3P39) water molecules pre-equilibrated at 25 °C was used. The density was ~0.993 g/cm3, consistent with a pressure of 0.1 MPa. The simulations were conducted in the canonical ensemble. Concentrations of 0.1, 0.5, 1, 2 and 3 M were generated by randomly replacing 2N water molecules with equal amount of Na+ and Cl− ions; N~61cM−1, where c is the salt concentration in moles of NaCl per liter of solution (M). This is a standard setup to partially compensate for changes in the ion molar volumes; errors of ~0.1% are expected for all of the concentrations studied here. Periodic boundary conditions and particle-mesh Ewald summations were used, with CHARMM-optimized parameters as reported40. The internal degrees of freedom of the water molecules were fixed with the SHAKE algorithm41, and a time step of 2 fs was used with the Verlet integrator. Data were collected every 1 ps for analysis. Electrostatic and van der Waals parameters were taken from the CHARMM force field (version c31b1). The system was equilibrated for ~2 ns to allow ions to diffuse across the unit cell. This equilibration time was estimated from the self-diffusion coefficient D of the slowest ions (Na+ at 3 M, in which case D≈1.5 10−5 cm2/sec) calculated from 6D=∂<|r(t)−r(t0)|2>/∂t at long t; <> denotes an average over time origins t0, and over all of the ions in the simulation box. A discussion is presented in Section 5 on the limitations of force field and computational setup, and the possible impact on the results herein reported.
3. Results
An ion cluster was defined in 42 as any array of ions such that: i) every ion is connected to at least one ion of the opposite charge; two ions are said to be connected if they are separated by a distance smaller than a cutoff rc; and ii) every ion can be reached from any other ion within the cluster through a path of consecutive connections. A cutoff rc=3.5 Å is chosen here as the position (found to be independent of concentration) of the minimum in the Na+-Cl− pair correlation functions gNa-Cl(r) (cf. Section 3.2). This definition is rather restrictive since it assumes that water molecules are not an integral part of the clusters. As mentioned in 42, a soft definition may use rc=6.0 Å, which is the position of the second minimum of gNa-Cl(r), thus allowing solvent-separated ion-pairs within the clusters. Other definitions are possible, e.g., one that allows only a maximum number of water molecules to penetrate the clusters. Ultimately, a precise definition is necessary to avoid ambiguity when comparing results of simulations with experimental data, or even with other simulations reported in the literature. The restrictive definition adopted here is the most conservative one, which would only provide evidence of the most compact clusters that can emerge under the conditions of the simulations. Any other definition would yield larger (and probably less stable) clusters and higher populations. In addition to the above structural requirement, a kinetic criterion also applies42: if a cluster splits into two fragments at time t but reforms before t + δt, then the cluster is assumed to have experienced just a structural fluctuation, and did not split. If two clusters merge at time t but separate again before t + δt, then the clusters are assumed to have just collided, and did not react. By convention42 δt is 2 ps, and is implicit in all the time integrals defined in this paper.
3.1. Cluster Statistics
A reduced set of statistical quantities are studied here that can be combined to derive others not considered explicitly. Probabilities distributions are derived from the cluster density ρ(n,q,t,c), defined as the number of clusters of size n (number of ions) and charge q per unit volume, at time t and concentration c. A cluster class is defined by n and q. The average molar concentration of clusters of size n calculated over the entire simulation time τ0 is given by cn = τ0−1∫cn(t)dt, where cn(t)=Σqcn,q(t) is the corresponding concentration at time t; ; and NA is Avogadro’s number. For the discussion that follows, the ions are viewed as a subsystem within the solution. At any given time t (snapshot) during the simulation, there is certain number of ions that do not belong to any clusters, i.e., they are isolated, fully hydrated ions, as expected from the traditional definition of a strong electrolyte. These ions are said to be dissociated, and form the dissociated or unstructured phase of the ions subsystem. All of the other ions are part of some cluster, regardless of its size. These ions are said to be associated, and form the associated or structure phase of the ions subsystem.
Cluster degrees of formation are defined by α(n)=cn/c, and were studied in 42. This quantity shows that the electrolyte is ~97% fully dissociated at 0.1 M, in which case only ion pairs are observed in the structured phase. The degree of dissociation decreases as salt is added. Thus, the electrolyte is only ~43% dissociated at 3 M, and clusters with more than twenty ions are observed in the structured phase42. Although the largest clusters form infrequently and decay relatively fast (cf. Section 3.3), they could play a role in nucleation and aggregation at long time regimes, as data reported in 16 suggest. During the course of the simulation the electrolyte undergoes significant structural fluctuations. To study these dynamic changes, the probability Ps that a fraction s of the electrolyte is in the structured phase is defined here as the time ratio Ps(S)=τ0−1∫G[s−s(t)]dt, where G(x) is 1 if x=0, and 0 otherwise; s is given by s(t)=1−f(t), where f(t)=c1(t)/2c is the fraction of fully dissociated electrolyte at time t (if there are no clusters at time t, then f=1, since c1=c1,+1+c1,−1). Ps is plotted in Fig. 1A for the five concentrations studied. At 0.1 M, the largest fraction sM of structured electrolyte (maximum value of s such that Ps≠0) observed during the simulation is 33%, while the most probable fraction s0 (maximum of Ps) is, in this case, equal to the lowest degree of structuredness sm (minimum value of s such that Ps≠0), which is full dissociation. The inset shows sm, s0, and sM as a function of concentration. sM decreases slightly at 0.5 M, but increases monotonically with c thereafter; monotonic increase is also observed for sm above 0.5 M, and for s0 at all concentrations. Thus, at 3 M, the amount of structured electrolyte fluctuates between 44% and 69%, with a most probable fraction of 56%. These results show that NaCl in water at ambient conditions can be more properly viewed as a multicomponent fluid, composed of reacting particles with well-defined average concentrations. These concentrations are given by cn=α(n)c, where α(n) was reported in42. The structural and dynamic properties of these particles are studied in Section 3.2 and 3.3. To gain insight into the dynamic behavior of the structured phase, the time evolution of s is analyzed. Oscillations are observed during short periods of times in an otherwise noisy, or much less oscillatory, background. These oscillations have periods in the ~0.5–1 ns time scale, and are illustrated in Fig. 1B at 3 M. A discrete Fourier transform analysis shows that the entire dynamics can be represented well by a superposition of plane waves with frequency below ~5 GHz. Depending on the concentration, a total of ~20–25 different components can be resolved within this frequency range. The lowest frequency is at ~200–300 MHz, which is the only component below 0.5 GHz, and corresponds to a single, slow period that spans the entire simulation time. Components above ~5 GHz correspond to associations and dissociation of few ions, and may be considered random fluctuations. During the oscillatory periods a large number of ions may be rapidly absorbed into or expelled from the structured phase. Figure 1B shows two intervals of ~250 ps (indicated by squared brackets) during which fast restructuring of the electrolyte occurs. During these short periods, ~80–100 Na+ and Cl− ions (out of ~200 fully dissociated ions, plus 166 associated ions already present in the simulation box) are rapidly absorbed into the structured phase. These periods of fast structural changes are more apparent at high concentrations. This collective behavior may be the result of cooperative effects, but this possibility is not explored here.
Fig. 1.
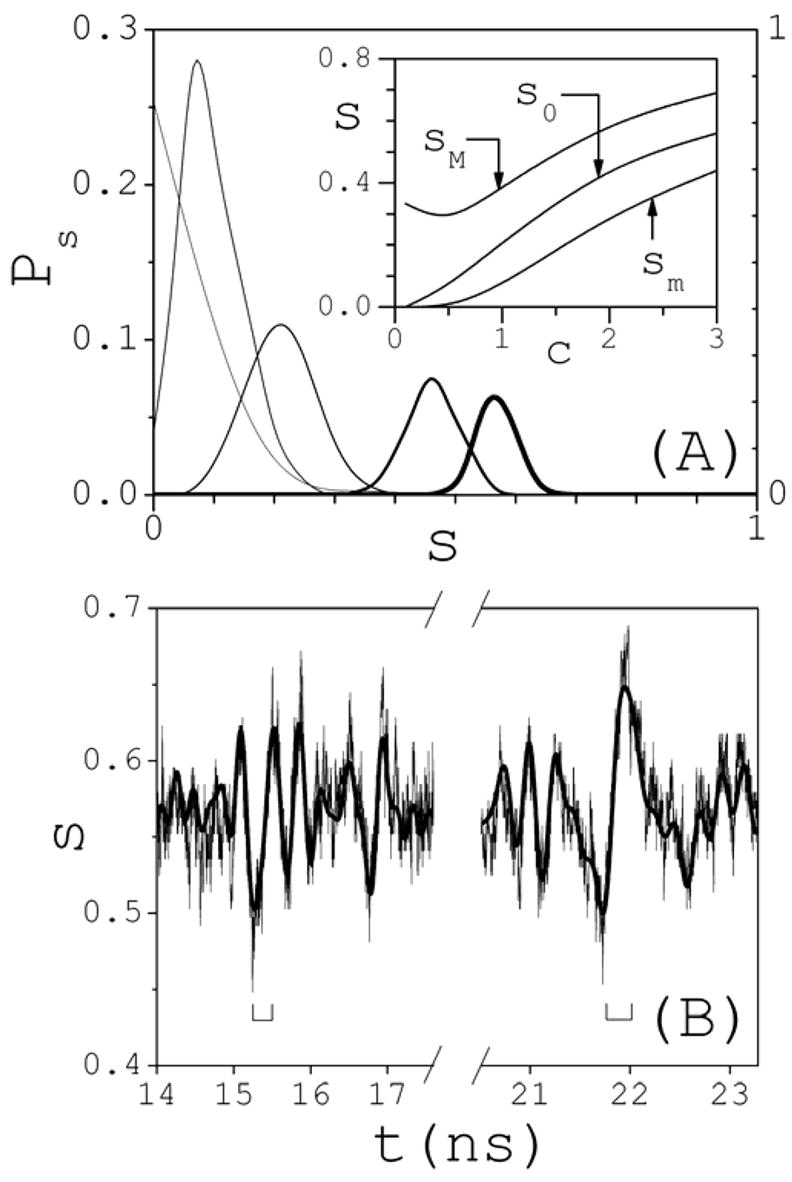
(A) Probability Ps that a fraction s of the electrolyte is in the structured phase during the dynamics (thinnest line: 0.1 M; thickness increases with salt concentration c; thickest line: 3 M); right axis: 0.1 M; left axis: all other concentrations. Inset: dependence of the maximum sM, most probable s0, and minimum sm fraction s of structured electrolyte as a function of concentration c (in M). (B) Typical oscillatory pattern during the time evolution of s(t), here illustrated at 3 M. Square bracket indicate 250-ps intervals during which fast electrolyte restructuring occurs.
The analysis presented above, which concerns the entire structured phase, can be partitioned among cluster classes. The probability Pn that a concentration cn of clusters of size n develops at any point during the dynamics can be defined as the time ratio Pn(cn)=τ0−1∫G[cn−cn(t)]dt. The analysis of Pn permits a better visualization of how the different cluster classes contribute to the structured phase, because quite different distributions may yield the same values of Ps. The typical behavior of Pn is illustrated in Fig. 2 for a concentration of 2 M (curved arrow indicates increasing cluster size). For a more intuitive discussion, results are given as a function of the number ν of clusters of size n in the simulation box. In this case there are 122 NaCl molecules dissolved in the system. The most probable value is determined by the maximum of Pn and denoted by ν0. Thus, the most probable number of clusters of size n that would be detected in a container of volume V if a large number of random measurements were performed by a hypothetical experimental apparatus is ~ν0V/Δv (Δv is the volume of the simulation box; cf. Section 2). Figure 2 shows that it is most likely to find ν0=66 fully dissociated (n=1) Na+ or Cl− ions simultaneously present in the simulation box than any other number. It is also most likely to find ν0=23 coexisting dimers (n=2), 8 trimers (n=3), 3 tetramers (n=4), or 2 pentamers (n=5), than any other number within each of these groups; ν0=1 for n>5. Each curve in Fig. 2 is normalized to 1−Pn(0), where Pn(0) is the probability to find zero clusters of size n; at 2 M, Pn(0)=0 for n≤ 3, i.e., dissociated ions, ion pairs, and trimers are observed at every snapshot of the dynamics. The inset of Fig. 2 shows ν0 as a function of n and c (clusters with ν0=1 are not shown; curved arrow indicates decreasing concentration). An analysis of the maximum values of ν with non-zero probability shows that several large clusters of the same size can coexist at times in the relatively small space of the simulation cell. For example, five decamers (n=10) are present simultaneously during certain periods of time at 3 M, and three at 2 M. At 3 M even larger clusters (n~15–20) may coexist for few picoseconds before they break apart or grow further as a result of new encounters.
Fig. 2.
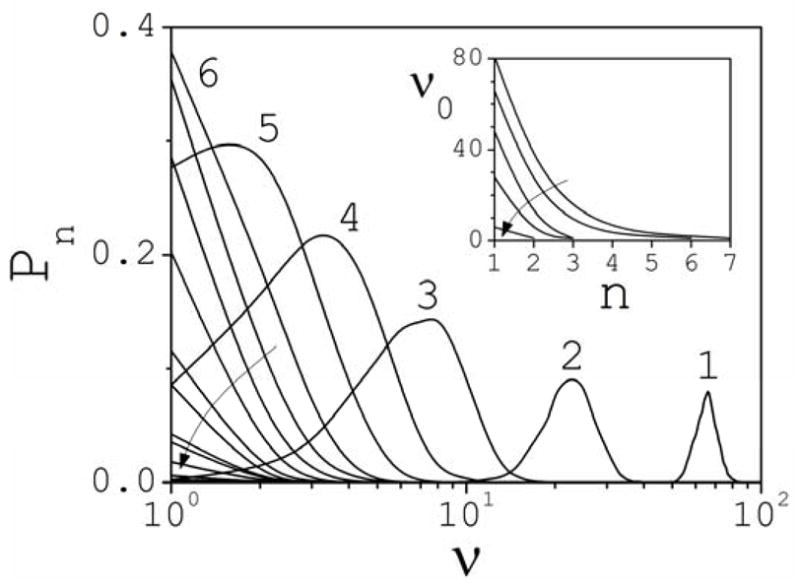
Partition of Ps into partial probabilities Pn at 2 M (the pattern is typical for other concentrations). Results are given as a function of the number ν of clusters of size n simultaneously present in the simulation box (ν=NAcnΔv; Δv is the volume of the box; cf. Section 2). The arrow indicates increasing cluster size. Inset: Most probable (maximum of Pn) number ν0 of clusters of size n present in the simulation box as a function of cluster size and concentration. The arrow indicates decreasing salt concentration.
3.2. Clusters Structure
Clusters morphology was studied in 42, and found to be independent of salt concentration. A measure of compactness based on water-accessible surface areas suggested that clusters can be described most simply as prolate spheroids in the sub-nanometer length scale. Calculation of cluster hydrodynamic radii showed a simple power-law behavior with n. Power laws were also obtained for the radius of gyration, and for the effective radius derived from solvent accessibility surfaces. Such behaviors are similar to those found experimentally in irreversible fractal aggregation of silica and gold43,44. Theoretical considerations show that such behaviors are also expected in covalent-bonded systems, such as polymers and other macromolecules45.
Cluster charges vary from −2 ≤ q/|e| ≤ +2 at 0.5 M, to −4 ≤ q/|e| ≤ +4 at 3 M, where e is the electron charge (e is set equal to unity). Fluctuations of ±1 are observed outside of these ranges, but the clusters are highly infrequent and short lived. The conditional probability P(q|n) that a cluster of size n has charge q can be calculated as P(q|n)=∫cn,q(t)dt/∫cn(t)dt. To illustrate, Fig. 3 shows the typical behavior of P(q|n) as a function of q for the smaller clusters at 3 M. In general, charges +q and −q form with comparable probabilities. Although q=0 is more likely to form than q≠0 in clusters with an even number of ions, e.g., P(0|n<8)~0.7–0.8, they form with comparable statistical frequencies as n increases, e.g., P(0|n>12)~0.5–0.6. In contrast, charges |q|=1 are more than four times as likely to form as |q|≠1 in clusters with an odd number of ions, regardless of size and concentration.
Fig. 3.
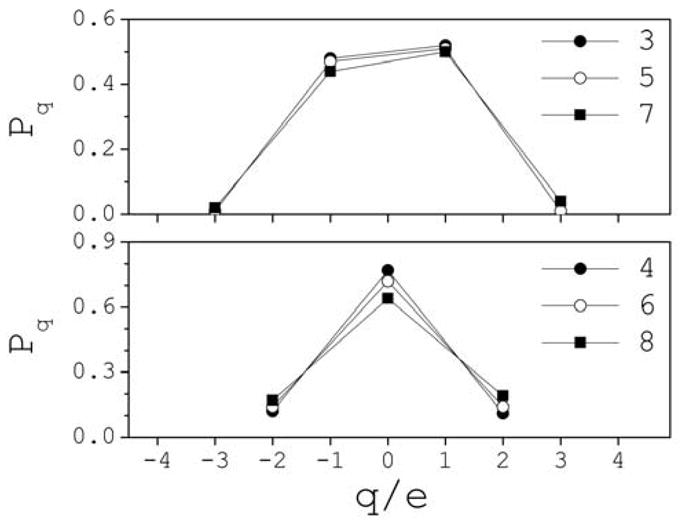
Conditional probability distributions Pq(q|n) that a cluster of size n has a total charge q at 3 M (the pattern is similar for other clusters and other concentrations). The symbols indicate the cluster size n.
The charge distribution within a cluster displays substantial variations as well, and contains information on the cluster’s morphology. Only dipole moments are considered here, but higher moments are not negligible, in general. Dipole moments are calculated with respect to the cluster centers of mass. A distribution function p(μ|n,q) has been defined42 such that dPn,q(μ)=p(μ|n,q)dμ is the conditional probability that a cluster of a given class has a dipole moment in the interval (μ,μ +dμ]. It was found42 that the main features of p(μ|n,q), including the locations of the peaks, are independent of salt concentration. Figure 4 shows p vs μ for clusters of size n≤5 and q=0, ±1, and ±2. The peaks of the distributions reflect the most populated conformations of the clusters in a class. For ion pairs the distribution results from the variations of the interionic distance r, with a single peak at μ2~12 D, corresponding to <r>~2.6 Å. The inset shows a schematic representation of the ions separated a distance <r>, and drawn to scale according to their ionic radii in solution. These radii are estimated as46 R=rM−1.4 Å, where rM is the position of the first maximum of the ion-oxygen pair correlation functions gO-Na(r) and gO-Cl(r) at infinite dilution calculated from a separate set of simulations using the same computational setup (cf. Fig. 5). Resulting values are RNa=(1.0±0.1) Å and RCl=(1.8±0.1) Å, which are practically the same as obtained from neutron scattering data at high dilution47,48, and used in previous calculations49. For trimers, the location and the height of the peaks depend on the sign of the charge, since the difference in Na+ and Cl− radii affects the angle θ at the central ion. Thus, a peak is observed for both q=±1, which corresponds to <θ>~110°. Trimers with q=+1 display an additional, larger peak corresponding to <θ>~93°, which is not significantly populated in trimers with q=−1. The difference in radii appears to be more generally related to the shift of p towards smaller values of μ in clusters with q<0 when compared to those with q>0; this shift is less apparent as cluster size increases. The conformations depicted as insets in Fig. 4 are schematic representations of actual structures observed in the simulations. To identify these conformations a window of size Δμ~1–2 D was defined around each value of μ where p presents a maximum. Over one hundred structures corresponding to different clusters were collected within these windows, and their conformations analyzed to identify the major conformational families contributing to the particular peak. This analysis shows that neutral tetramers adopt three main conformations: trans-like (the largest peak), cis-like (intermediate), and quasi-cyclic (smallest peak), as shown in the insets. These strguctural motifs, as well as those in trimers, appear frequently within the main conformational families observed in larger clusters. Doubly-charged tetramers display narrower distributions because a central ion is surrounded by three ions of opposite charge in a C3V point group symmetry. The magnitude of the dipole moment decreases as the planarity of the trigonal pyramid increases. Pentamers present two well-defined peaks, but they appear as the result of a superposition of smaller peaks. Close inspection shows that the largest peak for q=+1 is populated by three main structural families. These are obtained by connecting one sodium ion to a chloride ion of a cyclic tetramer (yielding the most populated conformations), or to the end of the chain of a cis-like or a trans-like tetramer. Pentamers, however, do not necessarily emerge from tetramers during the dynamics (cf. Section 3.3). These conformations also contribute to the highest peak for q=−1, but the all-trans conformations are much less populated (not shown). The smaller peaks in both charged pentamers correspond to structures that result from connecting one ion to a doubly-charged tetramer, as shown. The distribution of neutral hexamers (n=6) also appears to be the result of a superposition of several strongly overlapped peaks (not shown). In this case, a number of conformational families can still be identified, but are more difficult to associate with any particular peak42. A general trend for clusters of all sizes is that the limit of large values of μ corresponds to relatively loose, planar conformations that tend to strongly separate the internal charge.
Fig. 4.
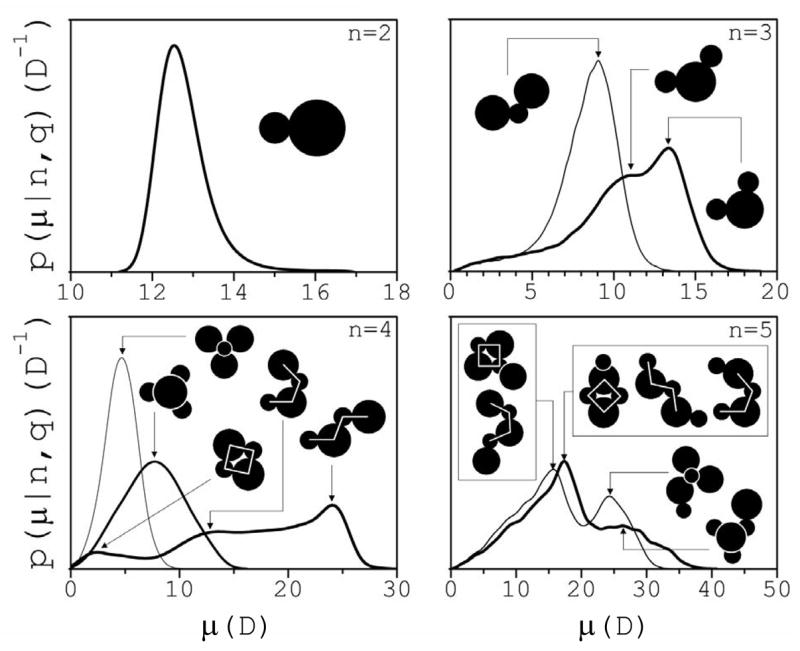
Conditional probability distribution p(μ|n,q) of cluster dipole moments μ. The insets show schematically the main structural families identified in each class, which are evidenced by the peaks in the distributions. Ion radii are drawn to scale as obtained from simulations at infinite dilution and consistent with experiments.
Fig. 5.
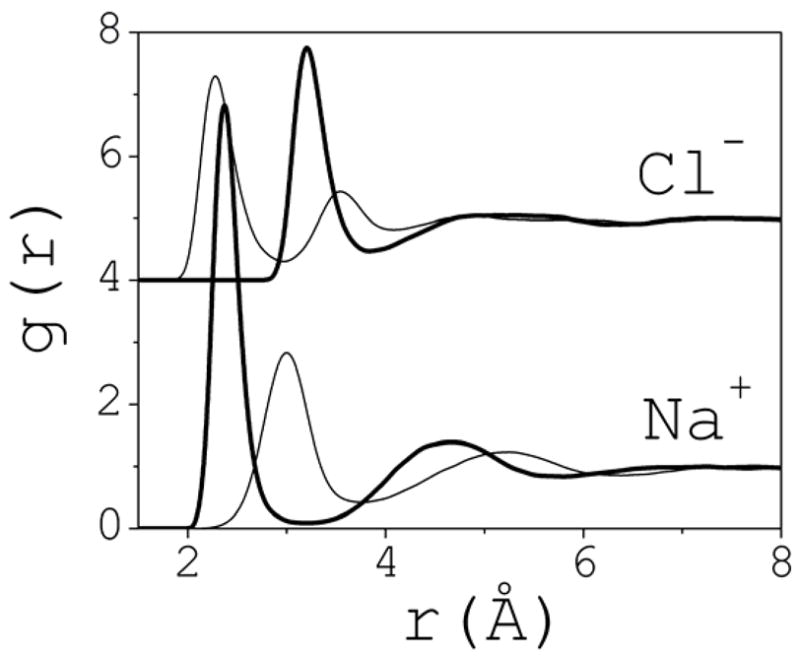
Ion-water pair correlation functions gO-ion (thick line) and gH-ion (thin) calculated at infinite dilution with the same computational setup (cf. Section 2). O and H are the oxygen and hydrogen atoms of the water molecules; the corresponding ions are indicated.
The conformations discussed above result from a combination of electrostatic forces and forces induced by the structured liquid around the clusters. To gain insight into the effect of electrostatics in cluster speciation and morphology, two additional simulations were carried out at 1 M and 2 M with the charges on the ions switched off. In this case, hydrophobic interactions are the main driving force for ion aggregation. These systems are referred to as uncharged, as opposed to the charged system studied above. The terms ion, ion cluster, Na and Cl, will still be used for convenience. The simulations were extended up to 10 ns, and the setup was identical as described in Section 2. The definition of ion cluster in this case is less straightforward because the effective ion-ion interactions are weaker. To illustrate, Fig. 6 shows gNa-Cl(r) for both the charged and uncharged systems at 1 M (thin line) and 2 M (thick). The cutoff rc is well defined in the former case, because Na+ and Cl− ions are either in contact with each other or separated by one water molecule. In contrast, the uncharged system shows a continuum of conformations with non-negligible population spanning the close-contact and solvent-separated ion pair distances. Thus, more structural flexibility or “breathing” is expected within clusters, even when a restrictive definition is adopted, i.e., one which excludes water as part of a cluster. For comparison with the charged system, this definition is also used here, so rc=5.5 Å is taken as the position of the first minimum of gNa-Cl(r) in the uncharged system.
Fig. 6.
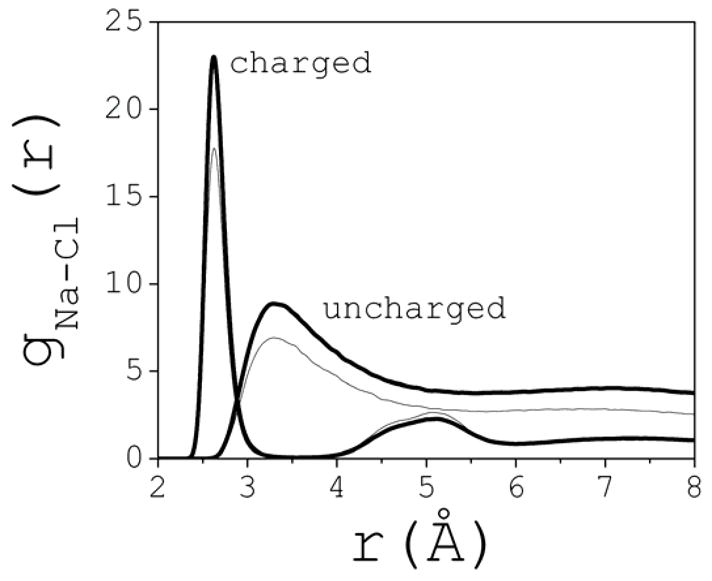
Sodium-Chloride pair correlation functions for the charged and uncharged systems, illustrated for 1 M (thin line) and 2 M (thick) concentrations (normalized at large interionic distances).
The simulations show that very large clusters are formed early in the dynamics. Substantial ion aggregation is already observed during the relatively short equilibration time (~2 ns), resulting in large fragments that coalesce further as the simulation proceeds. At 3 M, the system is only 37% dissociated at the end of the equilibration (64% at 1 M), and two large clusters, with ~50 and ~70 ions each, have formed. This behavior is expected for a system that cannot be easily diluted in a polar solvent. The degree of formation α(n) is plotted in Fig. 7; this should be compared with α(n) reported in 42. Very large clusters, containing more than fifty ions, are seen at 1 M, while clusters with more than a hundred ions are seen at 3 M. The main effect of the charge on the ions is then to strongly dilute the large ion aggregates and stabilize smaller, more compact clusters.
Fig. 7.
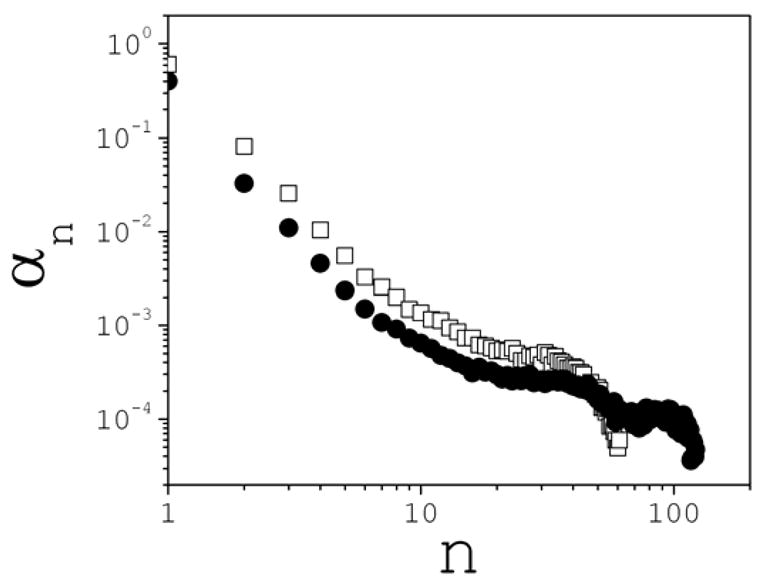
Cluster degrees of formation for the uncharged system at 1 M (squares) and 2 M (circles) concentrations.
A quantitative comparison of the clusters structure between the charged and uncharged systems is not possible due to the different definitions of ion cluster. However, a qualitative comparison is still possible if charges are reassigned to the ions and dipole moment distributions are calculated as in Fig. 4. Only dimers, trimers and tetramers will be considered; homomers, now observed, are excluded from the analysis. Figure 8 shows p(μ|n,q) vs μ for n≤4 and q=0, ±1, and ±2. As in Fig. 4, a number of peaks can be identified that suggest preferred conformations that are now modulated only by the liquid structure. The greater variability of the interionic distances provides more flexibility, resulting in smoother distributions that are shifted towards larger values of μ when compared to the charged system. For a better comparison with the charged system, a subset within each of these cluster classes is analyzed which conforms to the definition of ion cluster in the charged system, i.e., using rc=3.5 Å. The peaks are now better resolved (not shown) and the associated conformational families may be compared with those in the charged system. As in the charged system, trimers with q=+1 show two main conformations with angles <θ>~50° and ~95° at the central ion, while trimers with q=−1 show only one conformation with <θ>~80°. Electrostatic repulsion between like ions tends to slightly increase these angles, yielding the geometries shown in Fig. 4. For neutral tetramers three peaks are apparent: one small peak at small values of μ corresponds to the same cyclic conformations shown in Fig. 4 for the charged system. Exchanging the positions of a Na and a Cl within these cyclic structures yields other cyclic structures associated to a second, small peak at large values of μ. These conformations are not observed in the charged system due to the electrostatic repulsion between like ions. Both of these cyclic conformational families, at small and large values of μ, are limiting cases of highly flexible cis- and trans-like conformations observed in the intermediate range of μ, and contribute to the largest peak of the distribution. These conformations are locked into more rigid structures when electrostatic interactions are reestablished, as shown in Fig. 4. Tetramers with q=+2 show pyramid-like conformations, similar to those depicted in Fig. 4 for the charged system. However, Na ions may now get much closer to one another due to the lack of electrostatic repulsion. Thus, two close peaks are apparent in the distribution: one at larger μ, corresponding to structures with the three Na ions closely packed; and another one at smaller values ofμ, corresponding to rather planar structures with only two Na ions at close contact. When the ions are charged both conformations converge to the single trigonal pyramid shown in Fig. 4 for the charged system. Similar structures are observed for q=−2.
Fig. 8.

Conditional probability distribution p(μ|n,q) of cluster dipole moments μ for the uncharged systems at 2 M.
These results show that the cluster morphology contains considerable information on the forces induced by the structured liquid in the hydration shells. Intra-cluster electrostatic interactions further modulate these conformations and stabilize more compact clusters.
3.3 Cluster Dynamics
Tracking individual clusters during the course of the simulations shows that they form through multiple paths. They either grow from successive binary reactions of smaller clusters, or emerge as products of decay of yet larger clusters. The maximum number of consecutive steps a cluster can grow without breaking apart is two at 1 M, four at 2 M, and five at 3 M. Most clusters, however, grow only by a single step, which is the case for all of the clusters at 0.1 M and 0.5 M. Figure 9 shows the time Δt elapsed between the first (tF) and the second (tS) occurrence of clusters of size n. tF is defined as the time required for a cluster of a given size to emerge for the first time during the simulation. tS is defined as the time required for a second cluster of the same size to form which does not contain ions observed in the first occurrence. This latter requirement is stringent since clusters usually break and reform with only part being replaced by new ions. Although these clusters do not define tS, they do count as independent clusters for the purpose of statistics. This recycling process is remarkable for the larger clusters, where a core of few ions may persist for hundreds of picoseconds, participating in different clusters at different times, a behavior that may be dubbed promiscuity.
Fig. 9.
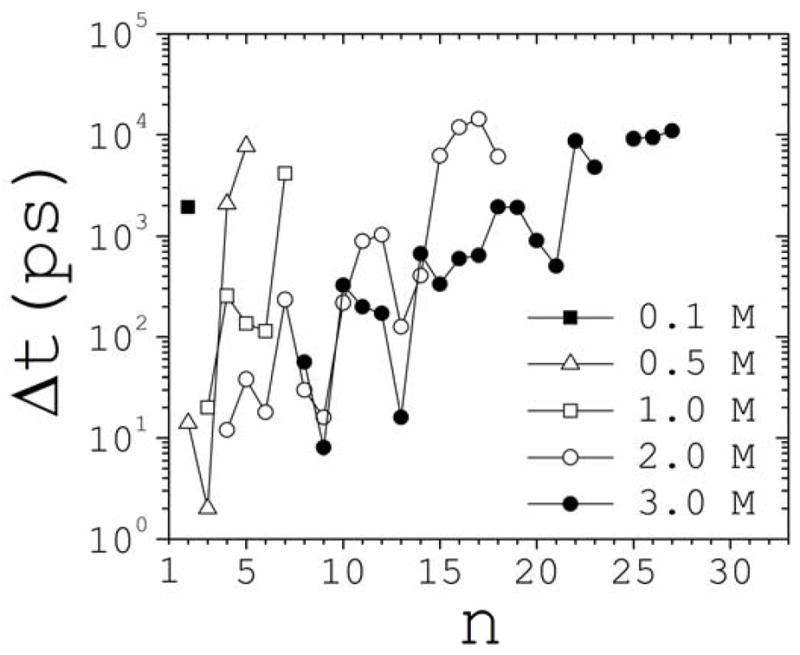
Time Δt=tS-tF elapsed between the first, tF, and the second, tS, occurrences of a cluster of size n, as a function of cluster size and concentration.
The absolute value of tF is somehow arbitrary. However, its distribution among cluster classes (not shown) offer insight into the speciation process. Although larger clusters usually take longer to form, they may appear prior to smaller clusters (e.g., in reactions m + m → 2m → (2m − n) + n, with m < n < 2m). At 0.1 M the first ion pair appears at ~100 ps, and takes ~2 ns for an unrelated dimer to form. As salt is added, clusters form faster, and at 1 M ion pairs are already present during the equilibration phase. Above 1 M, clusters of medium size (n~5–10) form during the equilibration time, although they are much smaller than those formed during the same period in the uncharged system (cf. Section 3.2). Overall, it took ~10 ns to record the first occurrences of all clusters observed in the simulations, although the largest cluster at 2 M and the two largest clusters at 3 M required ~12–18 ns. Second occurrences were recorded within the first ~20 ns, except for some very large clusters for which promiscuity persisted until the end of the simulations, so ts could not be determined.
Individual clusters lifetimes vary up to two orders of magnitude, depending on size and concentration. To quantify cluster decay rates, survival time distributions PD are defined as
| (1) |
where υi(x) is 1 if cluster i is present in the simulation box at time x, and 0 otherwise; Nn is the total number of unique clusters of size n that emerge during the entire simulation time τ0; An is a normalization factor such that PD(n,0)=1. PD can be interpreted as the probability that a cluster of size n survives a time t after its presence has been detected by a hypothetical experimental apparatus at t=0. This definition is similar to others used in the literature to calculate mean residence times (τR) of water in the hydration shell of ions50 or of functional groups in proteins51. Characteristic decay times τD inferred from PD are conceptually equivalent to τR, i.e., clusters reside in the simulation box until they react and cease to exist. The decay processes defined through Eq. (1) make no reference to the physical process by which a cluster vanishes from the solution. Thus, a cluster can either grow or split into fragments, and Eq. (1) does not differentiate between both situations; in either case the cluster is said to have decayed even when, physically, it may have grown. The value δt=2 ps implicit in Eq.(1) (cf. Section 3) has been used50, albeit for different physical reasons. Experimental errors in PD increase with t, but are difficult to evaluate. These are estimated here as , where N(t) is the number of unique clusters of size n that survive longer than t. Introducing these estimated errors prevents over-fitting and possible artifacts in the interpretation of decay rates.
Figure 10 shows the typical behavior of PD vs t in the case of ion pairs at 2 M. This behavior is typical regardless of the cluster class or salt concentration. It is here assumed that PD can be decomposed as PD(n,t)=∫H(τ)exp(−t/τ)dτ, where τ are the individual components of the decay-time spectrum, and H(τ)>0 is the time distribution of the decaying kinetics. The quantity H(τ)dτ can be interpreted as the probability that the decay occurs with a characteristic time in the interval (τ, τ +dτ]. The determination of H from PD through the above Laplace transformation is an ill-conditioned problem52. This is further complicated when PD is obtained from an experiment since many solutions may be compatible with the error bars or, as in this case, with the estimated error σ(t). To best address this problem a variational optimization based on the maximum entropy method53 is used here to obtain unbiased solutions. The quantity Q=S−Lχ2 is maximized with respect to H(τ), where S is the Shannon-Jaynes entropy54, and L is a Lagrange multiplier associated to χ2. Chi-square statistics is restricted to χ2~1, thus avoiding over-fitting of data that may not be warranted by the errors. If the best fit yields χ2<1, then the optimization process is stopped at χ2=1. If the best fit yields χ2>1, then α(t) is slightly rescaled by a common factor until the best fit yields χ2=1. This ensures a conservative approach to fitting, at the expense of resolution. In practice53, a logarithmic rescaling τ→log(τ) is applied such that H(τ)dτ→h(τ)dlog(τ), and solutions are given for h(τ) as a function of log(τ). The program MemExp55,56 is used here to find optimal solutions of h(τ). MemExp is a general program used to interpret kinetic data obtained from experiments.
Fig. 10.
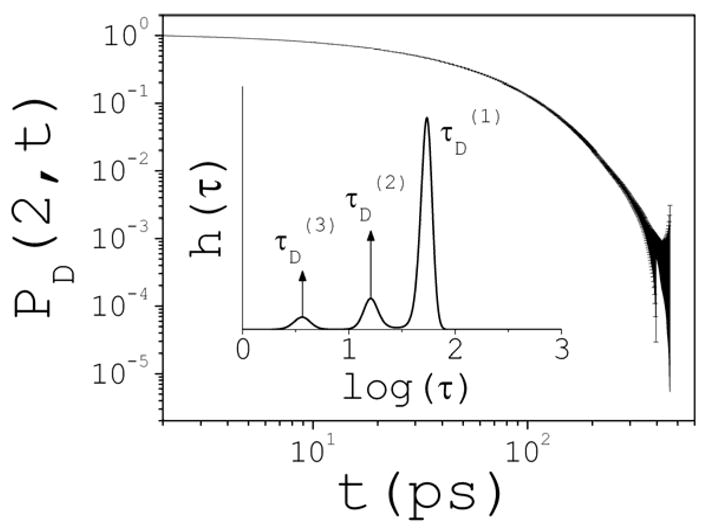
Typical form of the cluster survival-time probability distributions PD(n,t) and error estimates σ (t) shown; the example is for ion pairs at 2 M. Inset: solution of the corresponding decay-rate spectrum h(τ) obtained with the maximum entropy method. A continuum of rates τ describes the kinetics; three main discrete decay times can be identified in this case, τD(i) (i=1,2,3), corresponding to the peaks of h(τ); the contribution of each rate can be approximated by the area under the corresponding peak.
The inset of Fig. 10 illustrates the general form of h(τ) for PD(2,t) plotted in the figure. It shows three peaks that can be related to three characteristic decay times τD(i) (i=1,2,3). The areas under the peaks represent their relative contributions to the decay process. In general, the number and position of the peaks depend on n and c. A dependence on q is also expected, but is not studied here. At 0.1 M there is only one peak (not shown), and PD(2,t) can be described by a single exponential with a decay time of τD(1) 52 ps. This corresponds to the single process that characterizes the pair dissociation, and is controlled by the desolvation barrier that separates the contact and solvent-separated conformations. Figure 11 summarizes the results for all of the clusters for which statistics was deemed reliable, and for concentrations 0.5–3 M. The insets show h(τ) vs log(τ), and illustrate the changes of kinetics as cluster size and concentration increase. At 0.5 M, decay of ion pairs may be approximated by two exponentials, with τD(1) 8 and τD(2) 62 ps; the fastest rate contributes very little to the kinetics. Trimers and larger clusters are described by a single decay rate. At 1 M, three peaks can already be identified for ion pairs, at τD(1) 6, τD(2) 25, and τD(3) 68 ps; here also the contribution of the fastest decay rate is small. Trimers and tetramers show two peaks, while larger clusters show only one peak. A pattern can be inferred that is apparent above 1 M: three decay rates for small clusters; two rates as clusters size increases; and a single, basal rate for yet larger clusters. Whenever more than one peak is identified, the largest peak corresponds to the longest decay time (slowest rate). Multiple decay-time kinetics is expected as concentration increases, particularly for the smaller clusters. The populations of these clusters increase with c, and are also likely to interconvert with different concentration-dependent reaction rates. The overall kinetics of these reactions is complex, and can only be described through the precise form of h(τ) as obtained from an experimental determination of PD(t,n). Individual concentration-dependent reaction rates ki(c) can be calculated directly from the simulations for all of the possible interconversions i between clusters classes32. Such analysis may help to identify the particular reactions that contribute to the overall pattern shown in Fig. 11. However, the quantities PD studied here may be more relevant to help connect results from simulations to any physical quantities that can be measured in an experiment sensitive to the presence of clusters in the solution.
Fig. 11.
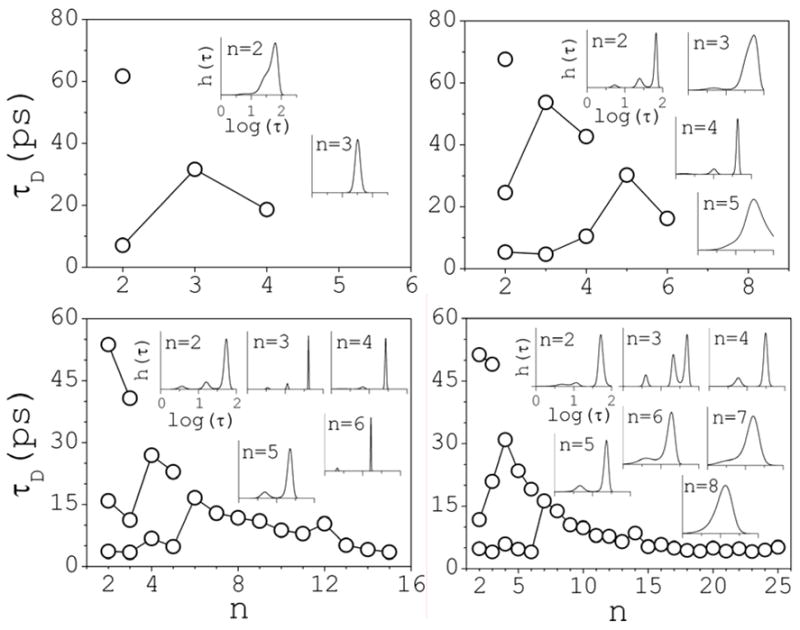
Complete set of solutions of cluster survival-time τD distributions as a function of cluster size. The insets illustrate the changes in the decay-time spectra h(τ) as the cluster size and concentration change; the relative contributions of each rate can be inferred from the area below each peak.
The analysis described above can also be applied to dissociated ions. These are characterized by single decay times τD(1), shown in Fig. 12; a double exponential function fits the data (not shown). The average distance traveled by an ion during τD(1) is the ion’s free path λ. Calculation of self-diffusion coefficients as a function of concentration (cf. Section 2) yields λ in the ~10–60 Å range for Na+, and ~10–70 Å for Cl−, as shown in the inset of Fig. 12; single exponentials fit the data (not shown).
Fig. 12.
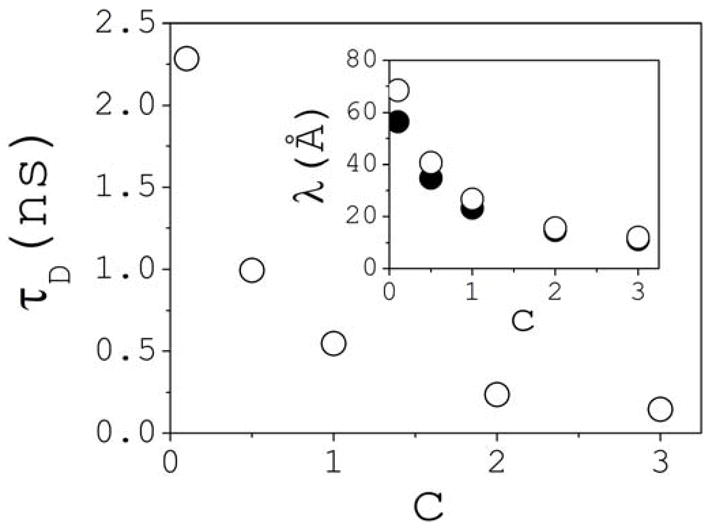
Average survival time τD of fully dissociated ions as a function of salt concentration c (similar for both Na+ and Cl−). Inset: free path λ of dissociated Na+ (solid circles) and Cl− (open circles) ions as a function of concentration.
A quantity related to PD is the lifetime distribution PL(n,t)=Nn−1Σiυi(t); the summation runs over Nn. PL is the probability that a cluster of size n lives at least a time t from the moment it is formed. Characteristic lifetimes τL inferred from this definition are longer than τD, but are not discussed. The longest lifetime τM for each cluster class is typically one order of magnitude longer than τD for the same class. Figure 13 shows τM as a function of n and c. For single ions, τM decreases with c, but the behavior reverses for ion pairs. Also, τM at 2 M appears to be systematically smaller than τM at 3 M for every cluster size. Thus, the structural integrity of at least one cluster in each class is preserved for longer periods of time as salt is added above ~2 M.
Fig. 13.
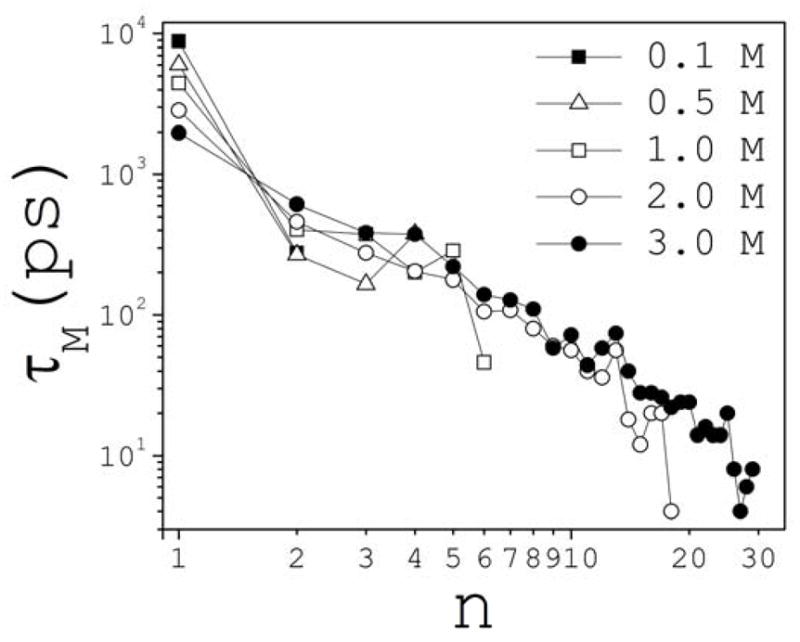
Maximum cluster lifetimes τM as a function of cluster size n at different concentrations c.
4. Cluster Effects on Water
The presence of ions in the solution affects the structure and dynamics of water, both in the bulk phase and in the ion hydration shells. Computational and experimental studies have been conducted to elucidate the nature of these changes, although results have not been conclusive, and sometimes controversial. The effects of ions on the water structure depend on the kind of ions and their concentrations, as illustrated in a recent study of aqueous hydroxide solutions57. Neutron and X-ray diffraction experiments in lithium chloride solutions have shown that the hydration shell of cations becomes increasingly distorted with increasing concentration, but the hydration shell of anions is nearly invariant58. It has also been shown that ion concentration may affect the numbers of water molecules coordinated to the ions59. Recent IR spectroscopy experiments has shown that the dynamics of water in the hydration shell of ions depend on whether the ion is a cation or an anion11. The same technique has shown that the rotational dynamics of water outside of the first hydration shells of ions is not affected by the presence of the ions60. The interpretation is that ions do not disrupt the hydrogen bond structure of water in the bulk, in contrast with the accepted view. These experiments have been conducted in diluted and concentrated Mg(Cl4)2, NaClO4, and Na2SO4 aqueous solutions. However, neutron diffraction experiments in concentrated NaCl and KCl have suggested that the effects of ions on the structure of the bulk water are indeed strong, and depend on the salt concentration25.
It is expected that the presence of clusters affects the structure and dynamics of water in complicated ways. Water molecules accommodate around the clusters, rearranging their hydrogen bond network according to the clusters morphology and internal charge distributions. A number of local properties may be affected by such changes, including water structure, translational and rotational diffusion, water residence times, and local dielectric properties. The interest here is in the dipole moment induced by a cluster on its hydration shells. The first hydration shell is defined as the set of NF water molecules j such that |ro,j−ri|<RF,i for at least one ion i in the cluster; ro,j is the position of the oxygen atom in molecule j, and ri is the position of ion i. RF,i is 3.8 Å if i is Cl− ion, and 3.2 Å if i is Na+. These values are obtained from the position of the first minimum of the ion-oxygen pair correlation functions shown in Fig. 5. The second hydration shell is defined similarly as the set of NS water molecules j, such that |ro,j− ri|<RS,i and that are not part of the first hydration shell. RS,i is 6.3 Å if i is Cl−, and 5.8 Å if i is Na+, as suggested by the second minimum of g(r).
The instantaneous dipole moment μF(t) of the first hydration shell of cluster k is given by μF(t)=Σμ j(t), where the sum runs over the NF(t) water molecules j with instantaneous dipole moments μj(t). To quantify the influence of the cluster, μF(t) is projected onto the direction of its instantaneous dipole μk(t), i.e., μF*(t)= μ F· μ̂k (t), where μ̂k ≡ μk/μk. A distribution function p(μF*|n,q) can now be defined such that dPn,q(μF*)=p(μF*|n,q)dμF* is the conditional probability that μF* lies in the interval (μF*,μF*+dμF*]. Figure 14 shows the behavior of p for c 2 M (thin line); the example is for ion pairs at 2 M, but is qualitatively similar for all clusters. The distribution can be approximated by a Gaussian function of the form P2,0(μF*)υexp[–(μF*–<μF*>2,0)2/σF] (also shown), where <μF*>2,0 is a measures of the effect of the ion pairs on the average orientation of the water molecules in the shell. In this case <μF*>2,0 3.9 D. Up to 2 M, the value of <μF*>n,q is positive and independent of concentration for a given cluster class. In addition, <μF*>n,q shows a very weak dependence on the cluster class for a given concentration: average values over n (for any c) yield: <μF*>n,q=3.5±0.8 (q=0); 4.2±0.4 (q=+2); 3.8±0.3 (q=–2); 4.1±0.3 (q=+1); and 4.0±0.3 (q=−1); all in Debye; standard deviations shown; statistical errors are small and omitted.
Fig. 14.
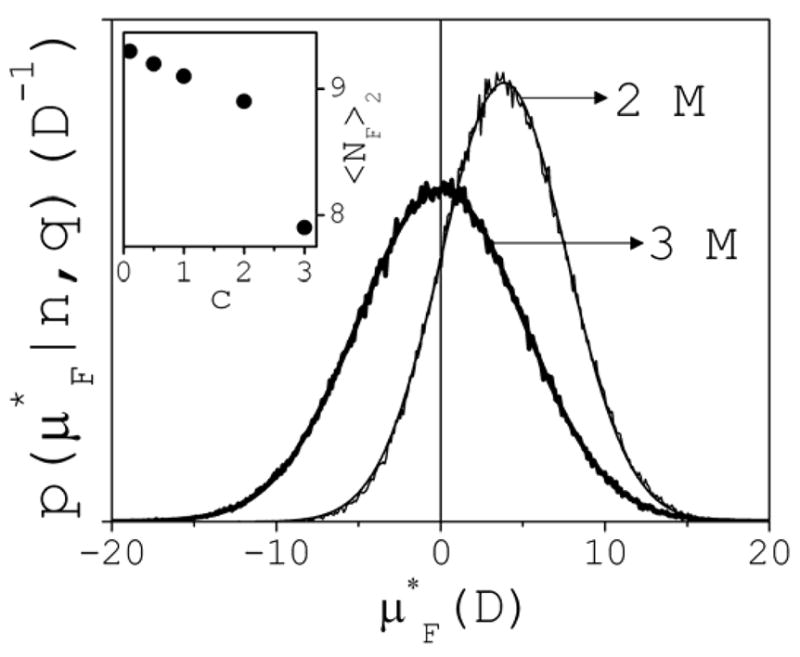
Conditional probability distribution p(μF*|n,q) of dipole moments μF* induced on the first hydration shells of ion pairs, at 2 M and 3 M. Gaussian functions fit the data, as shown. Inset: hydration number <NF>2 of ion pairs as a function of concentration.
The above results suggest that the structure of the hydration shell of a cluster of a given size and charge is not affected by the content of salt in the solution. However, a transition seems to occur between 2 M and 3 M, in which the influence of a cluster on its own hydration shell is completely removed. As a result, <μF*>n,q vanishes for all cluster classes at 3 M, as illustrated in Fig. 14 (thick line). To gain insight into this effect, cluster hydration numbers are analyzed, which are given by <NF>n=τ0−1∫NF(t)dt. The effect is already present in the case of ion pairs, so the inset of Fig. 14 shows only <NF>2 as a function of c. Below 2 M, <NF>2 shows little variations with concentration, but a drop of one water molecule is seen at 3 M. Similar tendency is observed for trimers, tertramers and pentamers, for which reliable data exists in the 0.5–2 M range. Above n~8, the situation seem to reverse, and the hydration numbers at 3 M are generally larger than those at 2 M (e.g., two additional water molecules are seen around clusters of size n=15). A trend with concentration cannot be inferred because larger clusters are not present below 2 M. Thus, the hydration shells of larger clusters at 3 M appear to capture more water molecules at the expense of the hydration shells of smaller clusters. <NF>n follows linear dependences with n of the form <NF>n~4.5+2.4n (2 M) and <NF>n~2.8+2.6n (3 M).
The above results show that, at 3 M, the structure of a cluster’s hydration shell appears to be perturbed by the presence of other clusters, possibly through direct interaction with their hydration shells. Thus, crowding effects above 2 M appears to influence the rearrangement and orientation of water molecules, such that random dipole moment distributions result. In contrast, below 2 M, each cluster exerts a strong influence on its own water environment, inducing a dipole moment of magnitude ~4 D on its first hydration shell, which is not affected by the amount of electrolyte present in the solution. Moreover, for c≤2 M, a cluster and the structured water in its first hydration shell cause its second hydration shell to restructure as well. Further studies using more advanced water models would be needed to describe reliably the water structure beyond its first shell. Suffices to say here that the calculated dipole moments <μS*>n,q induced in the second shells are of the order of ~2.5 D up to 2 M, and vanish at 3 M. Unlike <μF*>n,q, <μS*>n,q are almost independent of cluster class for a given concentration: average values over n yield: <μS*>n,q=2.4±0.4 (q=0); 2.4±0.2 (q=+2); 2.5±0.7 (q=−2); 2.6±0.4 (q=+1); and 2.6±0.4 (q=−1); all in Debye; standard deviations shown; statistical errors are small and omitted.
The phenomenon just described may have a close relation with the structural transition recently suggested by NMR data in concentrated aqueous electrolytes17. Ion chemical shifts of KCl, KF, and LiOH were measured17 as a function of concentration at 25 °C. The dependence is linear, but showed a change of slope in the ~1.7–3 M range. Such changes are usually associated to second-order phase transitions. A model of aqueous solutions has been proposed61 which is consistent with these and other experimental data62. The changes in slope are explained by changes in the water structure that result from changes in the hydrogen-bond (HB) strength in bulk water. Such changes affect the chemical environment of the ions, hence the resonance of their nuclear spins. In this model, the structure of hydration shells of ions and ion pairs (the only clusters assumed to be present in the solution) are not affected by concentration. The results reported in this paper suggest another possibility: i) hydration shells are strongly perturbed above certain threshold (~2 M for NaCl); ii) the concept of bulk water loses part of its meaning due to cluster crowding, which modify the water structure in the reduced inter-cluster space. Moreover, such restructuring may be long ranged due to HB networks inter-connecting nearby clusters63. Both (i) and (ii) might change the ion chemical environments, hence their chemical shifts.
5. Conclusions and Discussion
Statistical, structural, and dynamic properties of ion clusters in concentrated NaCl in water at ambient conditions below saturation were investigated with molecular dynamics simulations. The main goal of this study was to gain a better understanding of the cluster speciation process. To identify general trends that may hold beyond the limitations of the force field, the emphasis was on i) the relative behavior of a given cluster class (defined by n and q) at different salt concentrations, and ii) the relative behavior of different cluster classes at a given concentration. The quantities studied in this paper are not commonly discussed in the computer simulation literature, but they were chosen because they provide a rather clear and general picture of the behavior of ions and clusters in the liquid.
It was found that the larger clusters, e.g., with more than ten ions, may take up to ~20 ns to form, so long simulations are needed to extract statistically meaningful conclusion. The largest clusters are the most unstable, and no evidence of irreversible ion aggregation was found. Clusters grow for few consecutive steps (up to five at 3 M) before splitting into smaller clusters, although most clusters grow by a single step. An analysis of survival times showed that the cluster kinetics can be described by a continuum of decay rates. From the peaks of the distributions a discrete number of rates could be identified. It was found that only one rate controls the kinetics of ion pairs at 0.1 M, but this number increases with ion concentration, i.e., two rates at 0.5 M, and three rates at 1 M and above. Similar behavior is observed for other clusters up to hexamers. Larger clusters decay with only one rate, which is likely the result of association and dissociation involving a single ion at the cluster-water interface. An increasingly complex kinetics is expected as salt is added to the solution because the number of possible interconversions increases with the population of clusters classes. Thus, ion pairs may split into two ions, or grow into trimers, tetramers, etc, in each case with a different rate, which also depends on the concentration. A more detailed analysis would be needed to estimate each of these individual contributions and understand how they add up to yield the overall, simplified pattern just described. Survival times are within ~100 ps, with the largest clusters surviving no longer than ~10 ps. These are average values expected from a series of measurements with a hypothetical experimental apparatus that could detect clusters and discriminate their sizes. Individual cluster lifetimes, however, may be much longer. Large clusters may survive long periods of time as a promiscuous partner of other clusters. For example, a fragment detached from one cluster and rapidly attached to another one may have a short survival time, as defined in this study. However, they may be physically present in the solution for long periods of time, albeit masqueraded within other clusters.
Even a minute amount of ions removed from the dissociated phase and transferred to the associated phase may have important effects on the thermodynamic of the solution. Effects on the structure, dynamics and thermodynamics of molecules immersed in the solution, e.g., a protein, are also expected to be important. At 0.1 M, the electrolyte was found to be 97% dissociated, but only 43% at 3 M. During the dynamics, the fraction of structured electrolyte fluctuates randomly around its average value. However, concerted oscillations, with periods of ~0.5–1 ns, were observed during certain periods of time in which the electrolyte goes from a highly dissociated to a highly structured phase. The electrolyte can be viewed as a multicomponent fluid, composed of reacting particles with steady densities determined by their average molar concentrations cn. These particles have net charges ranging from −4e to +4e, depending on the size, although the most common and stable clusters are neutral. However, even neutral clusters may have important electrostatic effects because of their sizable dipole moments, with average values in the ~10–60 D range42. Cluster dipole moment distributions show peaks that can be associated to specific conformational families. Simulations carried out with the ionic charges switched off show that these conformations are modulated by both intra-cluster electrostatic forces and by forces induced by the structured liquid in the cluster hydration shells. For a given class, the cluster morphology is independent of the salt concentration, presumably because these forces are stronger than the perturbations created by other clusters in the solution. Moreover, the effects of a cluster on its first hydration shell are also independent of concentration below ~2 M. Thus, the hydration number and the dipole moments induced on these shells show little variation with concentration. However, at 3 M the hydration number changes sharply, while the induced dipole on the hydration shell vanishes. This may be explained by cluster crowding, which perturbs the structure of the liquid in the first shell, possibly through direct interactions with neighboring shells. These interactions are not unexpected if one assumes that all of the ions are fully dissociated. In this case the average distance between two nearest neighboring ions is ~6.4 Å, insufficient to accommodate two hydration shells. This is less obvious if clusters are present, since they leave more room in the inter-cluster space, thus allowing hydration shells to form unperturbed. Yet, the calculations do show that above a critical concentration between 2 M and 3 M a transition occurs. This may be related to the structural transition recently reported in concentrated ionic solutions based on NMR experiments17. At 25 °C, these experiments showed that second-order phase transitions occur in the 1.7–3 M range in aqueous solutions of simple salts, and explained based on changes in the water structure. In this view, cluster formation was out of the picture, except perhaps for ion pairs, so the results presented here may help to refine the interpretation.
The reliability of the results reported in this paper depends on i) the quality of the force field, and ii) the limitations of the simulation to describe realistic experimental conditions. Although this is true of any computer simulations, it deserves particular consideration in this study because experimental evidence of cluster formation is still inconclusive, as discussed in the Introduction. A correct description of water-water, ion-water, and ion-ion interactions is central to the reliability of the results. Different force fields describe this balance of forces differently, so substantial differences are expected. However, as the different studies mentioned in the Introduction suggest, they all seem to show cluster formation, albeit with different sizes and populations. A systematic study of most popular force fields also suggests this general trend64. Thus, the concern seems less about whether clusters exist, and more about what their partial concentrations are.
The strength and limitations of the force field used in this study are discussed below. It is first noted that methods have been developed to obtain parameters for water-water, ion-water, and ion-ion interactions using data from neutron scattering experiments65,66. In these methods, a classical force field, as the one used here, is assumed to capture the physics that determines the structure of the liquid. Parameters of the force field are then obtained self-consistently using Monte Carlo simulations. The parameters are said to be optimized when all the partial structure factors extracted from the experiment are reproduced. Computer simulation can then be carried out reliably with such optimal force field, and properties of the solution can be studied in detail. This hybrid optimization is possible for a number of simple solutes and complex salts for which isotope substitution yields well-resolved signals57,66. However, for reasons outlined in the Introduction, this method cannot be used to derive parameters for NaCl in water. Efforts to optimize the force field using available experimental information on pure NaCl crystals have recently been reported34.
A number of water models have been developed to perform well under specific thermodynamic conditions67. The water model used in this study39 was developed and optimized for ambient and physiological conditions. Basic tests to assess the quality of a water model typically include calculation of dielectric, structure, and transport properties, all of which may impact ion cluster formation. Systematic comparison of models for liquid water has been reported64,68,69. The model used here yields a value of ~88 for the bulk dielectric permittivity68, slightly larger than the experimental value of ~78. This is expected to be detrimental to cluster formation, which is not undesirable if a conservative approach is preferred. The model also describes well the microscopic structure of water in the first hydration shell, as compared with results from neutron scattering experiments68. However, the water structure beyond the first shell is not well reproduced, as it lacks the second maximum in the gOO pair correlation function. The most important limitation of this model is related to transport properties. The calculated self-diffusion coefficient at ambient conditions is68 ~5.1 105 cm2/s, while the experimental value is ~2.3 105 cm2/s. This may affect absolute values of the dynamic and kinetic properties of clusters. In addition to computational efficiency, the value of the dielectric constant and the short-range structure of water were important reasons for the choice of the water model in this study.
Another reason for the choice of this water model was that ion-water interactions were specifically optimized for use with this model. Experimental (Gibbs) free energies of hydration ΔG were used to calibrate parameters for Na+ and Cl− interactions with water70,71 using free energy perturbation simulations. This optimization is stringent since calculated values of ΔG are quite sensitive to these parameters. Two caveats need to be noted: Experimental estimates of ΔG of individual ions require knowing the absolute value of the free energy of hydration of a proton, ΔGH, which is used as a reference72. Experimental determination of ΔGH is difficult. More reliable values than traditional estimates has recently been reported based on water cluster-ion solvation data73. This new reference changes slightly the values of ΔG assigned to the ions73,74, what may impact the ion-water interaction parameters previously determined. Second, the treatment of long-range electrostatics used for the optimization was different than the treatment adopted here, which is based on Ewald summation, and the system’s size was smaller.
Parameters for ion-ion interactions are the most difficult to derive because of lack of experimental data. The parameters used here are calculated from uncorrected Lorentz-Berthelot (LB) mixing rules41. This is a compromise adopted by other force fields, and is known to be adequate in many cases. Empirical correction factors are sometimes introduced to better fit available experimental information75. This information is not available for NaCl, so care must be taken when using the LB rules to investigate properties highly sensitive to the ion-ion interactions. For a Na+-Cl− pair in the gas phase, the total potential energy V(r) (i.e., electrostatics plus van der Waals) as a function of the interionic distance r, calculated with the force field used in this study, has a minimum of V0 −128.2 Kcal/mol at r0 ≈ 2.4 Å. V0 varies substantially between different force fields, spanning ~15 Kcal/mol, according to data reported in 64. r0 also shows a strong dependence with the force field, spanning ~0.35 Å (the smallest/largest value corresponds to the most/least stable interaction). The force field used here yields V0 and r0 in the intermediate range when compared to others. From this gas phase comparison, it is not possible to decide which force field describes ion-ion interactions in solution more realistically. Here it is simply noted that V0 and r0 have long been known from ab initio quantum mechanics calculations76, and were also determined experimentally77. Calculations yield V0 ~ −128.6 Kcal/mol and r0 ~ 2.39 Å, practically the same as obtained with the force field used in this study (although this value may change with the level of theory used in the calculation); while experimental estimates yield stronger interactions, i.e., V0 ~ −132.2 Kcal/mol and r0 ~ 2.36 Å.
The discussion above shows that the fundamental balance of forces in the system, which is critical for ion cluster formation, is satisfactorily described. Parameters for water-water, ion-water, and ion-ion interaction contain as much experimental information as currently available. Obvious improvement can be made, for example, using a polarizable force field, since water and ion polarizabilities are expected to play a role in cluster formation. Whether these effects are detrimental or favorable to the formation and stability of a cluster is unclear. One particular polarizable force field is currently in development, and intended as a refinement of the force field used here78. Although the quality of the force field is the single most important concern when studying pure ionic solutions, the limitations of the simulation setup to describe real experiments needs to be evaluated as well. Two limitations of this setup are noted: one is related to the canonical ensemble used. Simulations in the isothermal-isobaric ensemble would be desirable to better represent experimental condition, although the qualitative results reported here are not expected to change. Another limitation is related to the size of the system. Finite-size effects and periodic boundary conditions may influence the formation of the larger clusters, since their length scale is comparable to that of the simulation cell42. Larger systems would also be needed to address the question of whether very large ion aggregates are present in the solution, as results reported in 16 suggest. The simulations reported here account only for the smaller clusters, which are in the sub-nanometer length scale 42.
Acknowledgments
This study utilized the high-performance computer capabilities of the Biowulf PC/Linux cluster at the NIH. This work was supported by the NIH Intramural Research Program through the Center for Information Technology, U.S. DHHS. The author thanks Peter Steinbach for help with the MemExp program, and the anonymous reviewers for valuable suggestions.
References
- 1.Onsager L, Fuoss RM. 1932;36:2689. [Google Scholar]
- 2.Robinson RA, Stokes RH. Electrolyte Solutions: The Measurement and Interpretation of Conductance, Chemical Potential and Diffusion in Solutions of Simple Electrolytes. Academic Press; New York: 1959. [Google Scholar]
- 3.Fuoss RM, Krauss CA. J Am Chem Soc. 1933;55:476. [Google Scholar]
- 4.Fuoss RM, Krauss CA. J Am Chem Soc. 1933;55:2387. [Google Scholar]
- 5.Fuoss RM. J Am Chem Soc. 1935;57:2604. [Google Scholar]
- 6.Fuoss RM. Proc Nat Acad Sci (USA) 1980;77:34. doi: 10.1073/pnas.77.1.34. [DOI] [PMC free article] [PubMed] [Google Scholar]
- 7.Marcus Y, Hefter G. Chem Rev. 2006;106:4585. doi: 10.1021/cr040087x. [DOI] [PubMed] [Google Scholar]
- 8.Bjerrum N. K danske vidensk Selsk. Vol. 7 1926. [Google Scholar]
- 9.Bjerrum N. Copenhagen: 1949. p. 108. [Google Scholar]
- 10.Evans R. Adv Phys. 1979;28:143. [Google Scholar]
- 11.Kropman MF, Bakker HJ. Science. 2001;291:2118. doi: 10.1126/science.1058190. [DOI] [PubMed] [Google Scholar]
- 12.Cerreta MK, Berglund KA. J Crystal Growth. 1987;84:577. [Google Scholar]
- 13.Tao NJ, Lindsay SM. 1988;92:5857. [Google Scholar]
- 14.Tao NJ, Lindsay SM. J Phys Condens Matter. 1989;1:8709. [Google Scholar]
- 15.Nygard K, Khakala M, Manninen S, Hamalainen K, Itou M, Andrejczuk A, Sakurai Y. Phys Rev B. 2006;73:024208. [Google Scholar]
- 16.Georgalis Y, Kierzek AM, Saenger W. J Phys Chem B. 2000;104:3405. [Google Scholar]
- 17.Dillon SR, Dougherty RC. J Phys Chem A. 2003;107:10217. [Google Scholar]
- 18.Neilson GW, Mason PE, Ramos S, Sullivan D. Phil Trans R Soc Lond A. 2001;359:1575. [Google Scholar]
- 19.Neilson GW, Adya AK, Ansell S. Annu Rep Prog Chem C. 2002;98:273. [Google Scholar]
- 20.Rusli IT, Schrader GL, Larson MA. J Crystal Growth. 1989;97:345. [Google Scholar]
- 21.Chatterji AC, Singh RN. J Phys Chem B. 1958;62:1408. [Google Scholar]
- 22.Oelkers EH, Helgeson HC. Science. 1993;261:888. doi: 10.1126/science.261.5123.888. [DOI] [PubMed] [Google Scholar]
- 23.Sherman DM, Collongs MD. Geochem Trans. 2002;3:102. doi: 10.1186/1467-4866-3-102. [DOI] [PMC free article] [PubMed] [Google Scholar]
- 24.Ansell S, Barnes AC, Mason PE, Neilson GW, Ramos S. Biophys Chem. 2006;124:171. doi: 10.1016/j.bpc.2006.04.018. [DOI] [PubMed] [Google Scholar]
- 25.Mancinelli R, Botti A, Bruni F, Ricci MA, Soper AK. Phys Chem Chem Phys. 2007;9:2959. doi: 10.1039/b701855j. [DOI] [PubMed] [Google Scholar]
- 26.Degreve L, da Silva FL. J Chem Phys. 1999;111:5150. [Google Scholar]
- 27.Koneshan S, Rasaiah JC. J Chem Phys. 2000;113:8125. [Google Scholar]
- 28.Chandra A. Phys Rev Lett. 2000;85:768. doi: 10.1103/PhysRevLett.85.768. [DOI] [PubMed] [Google Scholar]
- 29.Zahn D. Phys Rev Lett. 2004;92:408011. doi: 10.1103/PhysRevLett.92.040801. [DOI] [PubMed] [Google Scholar]
- 30.Mason PE, Dempsey CE, Neilson GW, Brady JW. J Phys Chem B. 2005;109:24185. doi: 10.1021/jp052799c. [DOI] [PubMed] [Google Scholar]
- 31.Du H, Rasaiah JC, Miller JD. J Phys Chem B. 2007;111:209. doi: 10.1021/jp064659o. [DOI] [PubMed] [Google Scholar]
- 32.Chen AA, Pappu RV. J Phys Chem B. 2007;111:6469. doi: 10.1021/jp0708547. [DOI] [PubMed] [Google Scholar]
- 33.Mountain RD, Thirumalai D. J Phys Chem B. 2004;108:19711. [Google Scholar]
- 34.Alejandre J, Hansen JP. Phys Rev E. 2007;76:061505. doi: 10.1103/PhysRevE.76.061505. [DOI] [PubMed] [Google Scholar]
- 35.Smith PE. J Phys Chem B. 1999;103:525. [Google Scholar]
- 36.Chialvo AA, Simonson JM. J Mol Liq. 2007;134:15. [Google Scholar]
- 37.Chialvo AA, Simonson JM. J Chem Phys. 2003;118:7921. [Google Scholar]
- 38.Brooks BR, Bruccoleri RE, Olafson BD, States DJ, Swaminathan S, Karplus M. J Comp Chem. 1983;4:187. [Google Scholar]
- 39.Jorgensen WL, Chandrasekhar J, Madura JD, Impey RW, Klein ML. J Chem Phys. 1983;79:926. [Google Scholar]
- 40.Hassan SA. J Phys Chem B. 2004;108:19501. [Google Scholar]
- 41.Allen MP, Tildesley DJ. Computer Simulation of Liquids. Clarendon Press; Oxford: 1987. [Google Scholar]
- 42.Hassan SA. Phys Rev E. 2008;77:031501. doi: 10.1103/PhysRevE.77.031501. [DOI] [PMC free article] [PubMed] [Google Scholar]
- 43.Wiltzius P. Phys Rev Lett. 1987;58:710. doi: 10.1103/PhysRevLett.58.710. [DOI] [PubMed] [Google Scholar]
- 44.Weitz DA, Huang JS, Lin MY, Sung J. Phys Rev Lett. 1985;54:1416. doi: 10.1103/PhysRevLett.54.1416. [DOI] [PubMed] [Google Scholar]
- 45.Tanford C. Physical Chemistry of Macromolecules. John Wiley & Sons; New York: 1961. [Google Scholar]
- 46.Marcus Y. Chem Rev. 1988;88:1475. [Google Scholar]
- 47.Ohtomo N, Arakawa K. Bull Chem Soc Jpn. 1979;52:2755. [Google Scholar]
- 48.Ohtomo N, Arakawa K. Bull Chem Soc Jpn. 1980;53:1789. [Google Scholar]
- 49.Hassan SA. J Phys Chem B. 2007;111:227. doi: 10.1021/jp0647479. [DOI] [PMC free article] [PubMed] [Google Scholar]
- 50.Impey RW, Madden PA, McDonald IR. J Phys Chem. 1983;87:5071. [Google Scholar]
- 51.Brunne RM, Liepinsh E, Otting G, Wuthrich K, van Gunsteren WF. J Mol Biol. 1993;231:1040. doi: 10.1006/jmbi.1993.1350. [DOI] [PubMed] [Google Scholar]
- 52.McWhirter JG, Pike ER. J Phys A: Math Gen. 1978;11:1729. [Google Scholar]
- 53.Steinbach PJ, Chu K, Frauenfelder H, Johnson JB, Lamb DC, Nienhaus GU, Sauke TB, Young RD. Biophys J. 1992;61:235. doi: 10.1016/S0006-3495(92)81830-1. [DOI] [PMC free article] [PubMed] [Google Scholar]
- 54.Jaynes ET. Phys Rev. 1957;106:620. [Google Scholar]
- 55.Steinbach PJ. J Chem Inf Comput Sci. 2002 doi: 10.1021/ci025551i. [DOI] [PubMed] [Google Scholar]
- 56.Steinbach PJ, Ionescu R, Matthews CR. Biophys J. 2002;82:2244. doi: 10.1016/S0006-3495(02)75570-7. [DOI] [PMC free article] [PubMed] [Google Scholar]
- 57.Imberti S, Botti A, Bruni F, Cappa G, Ricci MA, Soper AK. J Chem Phys. 2005;122:194509. doi: 10.1063/1.1899147. [DOI] [PubMed] [Google Scholar]
- 58.Harsanyi I, Pusztai L. J Chem Phys. 2005;122:124512. doi: 10.1063/1.1877192. [DOI] [PubMed] [Google Scholar]
- 59.Tromp RH, Neilson GW, Soper AK. J Chem Phys. 1992;96:8460. [Google Scholar]
- 60.Omta AW, Kropman MF, Woutersen S, Bakker HJ. Science. 2003;301:347. doi: 10.1126/science.1084801. [DOI] [PubMed] [Google Scholar]
- 61.Dougherty RC, Howard LN. Biophys Chem. 2003;105:269. doi: 10.1016/s0301-4622(03)00077-2. [DOI] [PubMed] [Google Scholar]
- 62.Dillon SR, Dougherty RC. J Phys Chem A. 2002;106:7647. [Google Scholar]
- 63.Hassan SA. J Phys Chem B. 2005;109:21989. doi: 10.1021/jp054042r. [DOI] [PMC free article] [PubMed] [Google Scholar]
- 64.Patra T, Karttunen M. J Comp Chem. 2004;25:678. doi: 10.1002/jcc.10417. [DOI] [PubMed] [Google Scholar]
- 65.Soper AK. Chem Phys. 1996;202:295. [Google Scholar]
- 66.Finney JL, Bowron DT. Phil Trans R Soc Lond A. 2005;363:469. doi: 10.1098/rsta.2004.1503. [DOI] [PubMed] [Google Scholar]
- 67.Guillot B. J Mol Liq. 2002;101:219. [Google Scholar]
- 68.Jorgensen WL, Tirado-Rives J. Proc Nat Acad Sci (USA) 2005;102:6665. doi: 10.1073/pnas.0408037102. [DOI] [PMC free article] [PubMed] [Google Scholar]
- 69.van der Spoel D, van Maaren PJ, Berendsen HJ. J Chem Phys. 1998;108:10220. [Google Scholar]
- 70.Beglov D, Roux B. J Chem Phys. 1994;100:9050. [Google Scholar]
- 71.Roux B. Biophys J. 1996;71:3177. doi: 10.1016/S0006-3495(96)79511-5. [DOI] [PMC free article] [PubMed] [Google Scholar]
- 72.Noyes RM. J Am Chem Soc. 1964;86:971. [Google Scholar]
- 73.Tissandier MD, Cowen KA, Feng WY, Gundlach E, Cohen MH, Earhart AD, Coe JV. J Phys Chem A. 1998;102:7787. [Google Scholar]
- 74.Pliego JR, Riveros JM. Chem Phys Lett. 2000;332:597. [Google Scholar]
- 75.White A. Internal Report. Weapons Systems Division, Department of Defense; 2000. Intermolecular Potentials of Mixed Systems: Testing the Lorentz-Berthelot Mixing Rules with Ab Initio Calculations. [Google Scholar]
- 76.Bounds DG, Hinchliffe A. Chem Phys Lett. 1982;86:1. [Google Scholar]
- 77.Huber KP, Herzberg G. Constants of Diatomic Molecules. Van Nostrand/Reinhold; New York: 1979. [Google Scholar]
- 78.Lamoureux G, Harder E, Vorobyov IV, Roux B, MacKerell AD. Chem Phys Lett. 2005;418:241. [Google Scholar]


