

Abstract
Because population stratification can cause spurious associations in case-control studies, understanding the population structure is important. Here, we examined Japanese population structure by “Eigenanalysis,” using the genotypes for 140,387 SNPs in 7003 Japanese individuals, along with 60 European, 60 African, and 90 East-Asian individuals, in the HapMap project. Most Japanese individuals fell into two main clusters, Hondo and Ryukyu; the Hondo cluster includes most of the individuals from the main islands in Japan, and the Ryukyu cluster includes most of the individuals from Okinawa. The SNPs with the greatest frequency differences between the Hondo and Ryukyu clusters were found in the HLA region in chromosome 6. The nonsynonymous SNPs with the greatest frequency differences between the Hondo and Ryukyu clusters were the Val/Ala polymorphism (rs3827760) in the EDAR gene, associated with hair thickness, and the Gly/Ala polymorphism (rs17822931) in the ABCC11 gene, associated with ear-wax type. Genetic differentiation was observed, even among different regions in Honshu Island, the largest island of Japan. Simulation studies showed that the inclusion of different proportions of individuals from different regions of Japan in case and control groups can lead to an inflated rate of false-positive results when the sample sizes are large.
Introduction
Genome-wide association studies (GWASs) are a powerful tool for dissecting complex traits by identifying loci linked to particular diseases.1–3 Finding disease loci in a GWAS requires large sample sizes and sophisticated statistical techniques. Inclusion of a large number of subjects in a study increases the power, but it also increases the rate of false-positive results, which may be partly due to population stratification or cryptic relatedness in either the cases or the controls.4 In a case–control GWAS, we detect loci at which some alleles or genotypes are different in frequencies between cases and controls. This approach assumes a homogeneous population in which the relationship between an allele and a trait is random for marker loci unlinked to the trait. In the presence of population stratification, nonrandom associations between an allele and a trait can be found at marker loci that are completely unlinked to a trait locus; such associations are called “spurious associations”5,6. For two subpopulations that were derived from a common ancestral population and that have differentiated to some extent, a spurious association would occur when the case and the control groups are composed of different proportions of the two subpopulations.6 Therefore, it is important to know whether a population is stratified and how and to what extent the stratification affects the results of association studies.
Several methods have been developed for assessing the level of population stratification. A basic approach is a model-based clustering method that uses multilocus genotype data from individuals and detects the presence of population stratification.7,8 Another approach is the genomic-control method, in which Bayesian outlier methods are used.9–11 The genomic-control method is based on the assumption that, in a stratified population, the distribution of the Cochran-Armitage trend test12 statistic would deviate from the expected chi-square distribution for marker loci unlinked to the disease locus. Recently, two methods have been developed for examining population stratification by analyzing relatedness among individuals with SNP genotypes; these methods are applicable to thousands of SNPs.13,14 One is based on a principle-component analysis and also provides a method for correcting for the effects of stratification.13,15 The other uses identity-by-state and identity-by-descent information, and in it, the individuals are clustered by multidimensional scaling (MDS).14
The Japanese population has a rather small genetic diversity, according to data from the SNP discovery project in Japan.16 However, a detailed analysis of the population structure of the Japanese with the use of genome-wide SNPs has not yet been conducted. Previous studies on genetic variations in the Japanese population examined mtDNA-sequence variation,17,18 polymorphic markers on the Y chromosome,19,20 or some polymorphic loci in autosomes.21 Generally, their results are consistent with the hypothesis that the Japanese population has a “dual structure”22 and that immigrants came to Japan in at least two major migration events. If the “dual structure” of the Japanese population is supported by genetic variations in the entire genome, then the correlation between two alleles in an individual would be slightly higher than that in an ideal homogeneous population. In future GWASs with large numbers of subjects, the presence of a population structure or cryptic relatedness in a case–control sample may increase the rates of false-positive results.23 Therefore, it is important to examine the population structure of Japanese individuals with genotypes for genome-wide SNPs. In this study, to examine the population structure of the Japanese population using multilocus SNP genotypes, we analyze the relatedness of 7001 Japanese individuals, along with the African, European and East-Asian individuals in the International HapMap project. We then show how inclusion of different proportions of individuals from different regions of Japan in case and control groups can lead to spurious associations.
Subjects and Methods
Subjects
Genotype data for 60 European, 60 African, and 90 East-Asian (45 Japanese and 45 Han Chinese) individuals were obtained from the HapMap database (release 22).24 In addition, genotype data were obtained from 7003 self-identified Japanese patients in the BioBank Japan Project.25 These patients, who had 35 of the 47 diseases studied in the BioBank Japan Project, were treated at hospitals in seven geographic regions (Figure 1): Hokkaido (514 individuals), Tohoku (466 individuals), Kanto-Koshinetsu (3978 individuals), Tokai-Hokuriku (358 individuals), Kinki (908 individuals), Kyushu (628 individuals), and Okinawa (151 individuals). Because none of the DNA samples were taken at hospitals in the area of Chugoku-Shikoku, analyses for Chugoku-Shikoku were not performed. The Biobank Japan Project collected human genomic DNA after the patients provided written informed consent to participate in this project. This project was approved by the ethical committees at The Institute of Medical Science, The University of Tokyo, and the Center for Genomics Medicine (formerly, SNP Research Center), Institutes of Physical and Chemical Research (RIKEN).
Figure 1.
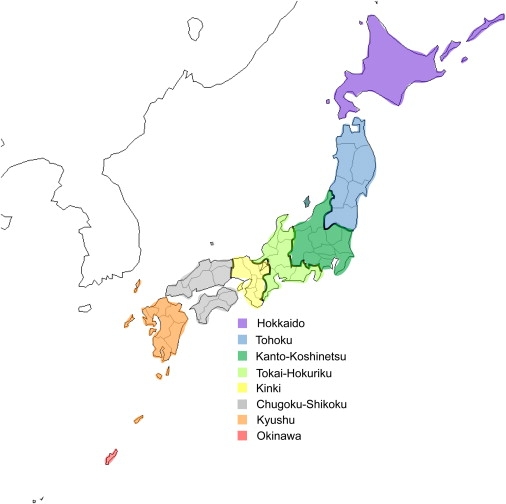
Geographical Regions of Japan
The 7003 Japanese individuals were divided into seven groups, according to the geographic regions where DNA samples were taken; i.e., Hokkaido (514 individuals), Tohoku (466 individuals), Kanto-Koshinetsu (3978 individuals), Tokai-Hokuriku (358 individuals), Kinki (908 individuals), Kyushu (628 individuals), and Okinawa (151 individuals). There were no subjects whose DNA samples were taken at hospitals in the area of Chugoku-Shikoku; therefore, analyses for Chugoku-Shikoku were not done. Here, “Hondo” means the Japanese main islands other than Okinawa. Honshu is the largest island, including the following areas: Tohoku, Kanto-Koshinetsu, Tokai-Hokuriku, Kinki, and Chugoku.
Genotyping
All of the Japanese DNA samples from the seven areas were grouped by types of diseases and were genotyped for 272,844 SNPs via Perlegen's platform.26,27 SNPs in autosomes (chromosomes 1–22) were selected for further analyses if they satisfied each of the following four criteria: (1) they were polymorphic in the Japanese population, 2) call rates were high enough (≥ 90%), (3) genotype frequencies were in accord with Hardy-Weinberg equilibrium, and (4) they were genotyped in the HapMap project. The Hardy-Weinberg test was used for removal of possibly mistyped SNPs (p < 0.01 by chi-square test) from raw genotyping data. After the selection of SNPs, the genotype data for 140,387 SNPs were used in additional analyses. When European and African samples were included in the analysis, the number of SNPs used was 135,754, because the genotype data for some SNPs were not available in the HapMap database for either European or African data although they were available for the other subpopulations.
Analysis of Relationship between Individuals
SNP autosomal genotypes were used in an examination of the relationship between individuals. The examination was performed via an “Eigenanalysis,” an application of principal-component analysis, in the computer program smartpca, from the EIGENSOFT package.13,15 The number of SNPs analyzed was 140,387 (when African and European individuals were not included) or 135,754 (when African and European individuals were included), and the PCA analysis was run with correction for linkage equilibrium. In an Eigenanalysis of individual SNP genotypes, the first component is the coordinate drawn in the multidimensional space so that the projections of the points (each point represents an individual) to the coordinate have the largest variance. The second component is the coordinate drawn in the multidimensional space so that the projections of the points to the coordinate have the second largest variance, and so forth. Intuitively, one can obtain the best separation of the individuals by use of the first component, the second-best separation by use of the second component, and so forth. The PCA plot with the first and second components showed two main clusters, formed by Japanese individuals, and a third cluster, formed by Han-Chinese individuals. The two main clusters for the Japanese individuals were defined by the K-means method, with the use of the first component. We also used the multidimensional scaling (MDS) method to examine relatedness among individuals, using PLINK.14
Calculation of FST
The FST value, as originally defined by Wright,28 was calculated between two clusters or between two local regions for each SNP site. Confidence intervals of the average FST over loci were calculated by bootstrap resampling, with 1000 replications.
Simulation of GWAS with Individuals from Subpopulations
To examine the effect of the Japanese population structure on a GWAS, we conducted simulations by sampling individuals from the subpopulations in different proportions between cases and controls, then evaluated possible inflation of false-positive rates with the use of the genome-wide χ2 inflation factor for the genomic control.9–11 Imagine that we have n1 case individuals, consisting of m1 and m2 individuals from subpopulations 1 and 2, respectively, and n2 control individuals, consisting of m3 and m4 individuals from subpopulations 1 and 2, respectively. For simulation of an association study, m1 + m3 individuals were randomly chosen without replacement from subpopulation 1 and m2 + m4 individuals were chosen from subpopulation 2 in the same way. With a case sample (m1 + m2 individuals) and a control sample (m3 + m4 individuals), the Cochran-Armitage trend test12 was performed with the genotypes for the 140,387 SNPs for calculation of a genome-wide inflation factor, λ, for the genomic control.9–11 The value of λ was computed as the median χ2 statistic divided by 0.455, the predicted median χ2 if there is no inflation. This procedure was repeated 100 times, and the mean and the standard deviation of observed λ values were calculated.
Results
Japanese Population Structure
To examine the relationship between Japanese individuals, the genotypes of 7003 Japanese individuals and those for 60 European, 60 African, and 90 East-Asian (45 Japanese and 45 Han Chinese) individuals from the International HapMap project were analyzed by Eigenanalysis with the program smartpca.15 The two-dimensional plots with the first and the second components (Figure 2A) showed that African (HapMap population of Yoruba in Ibadan, Nigeria [YRI]), European (HapMap population of Utah, USA residents with ancestry from northern and western Europe [CEU]), and East Asian (HapMap populations of Japanese in Tokyo [JPT] and Han Chinese in Beijing [CHB]) populations were clearly separated from each other, as shown in a previous study of worldwide human relationships based on genome-wide patterns of variation.29 Two Japanese individuals (denoted by “+” in Figure 2A) fell outside the above groups, probably because they had mixed East-Asian and European ancestry. Conversely, the plots with the third and fourth components (Figure 2B) separated the East-Asian subpopulations, suggesting that East-Asian subpopulations have differentiated SNPs.
Figure 2.
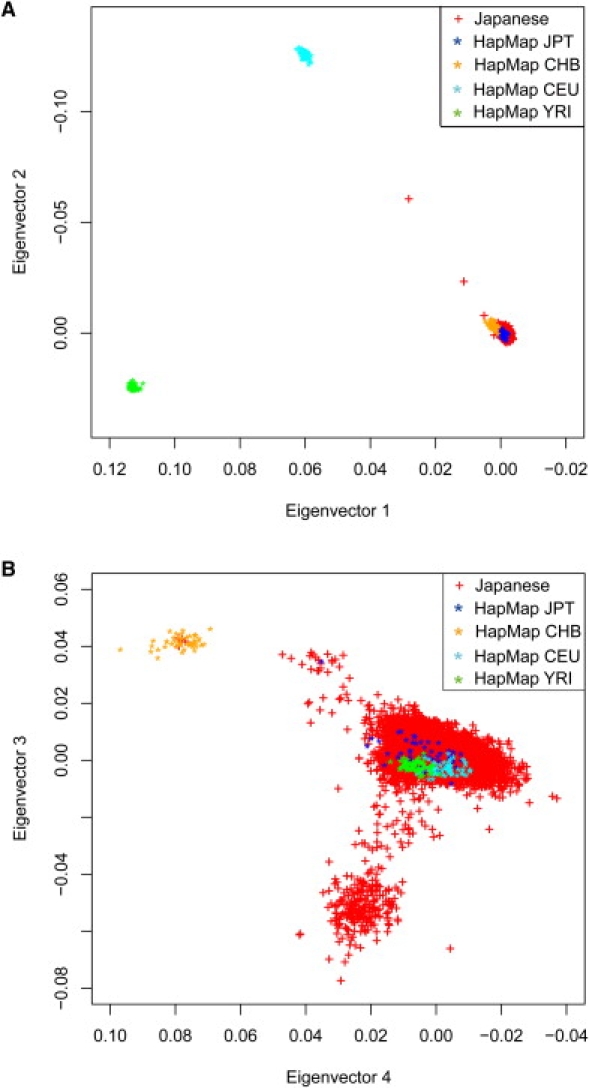
Relatedness between Japanese, Han-Chinese, European, and African Individuals
The relatedness between the 7003 Japanese individuals, along with 60 European (CEU), 60 African (YRI), and 90 East-Asian (45 JPT and 45 CHB) individuals from the HapMap project,24 was analyzed. The genotype data of 135,754 SNPs were analyzed by use of the smartpca program in EIGENSOFT.15
(A) The individuals were plotted in a two-dimensional graph, with the first (x axis) and the second (y axis) components of the Eigenvector factors.
(B) The individuals were plotted in a two-dimensional graph, with the third (x axis) and the fourth (y axis) components of the Eigenvector factors.
Then, the relationship between East-Asian individuals was analyzed, with the use of 7001 Japanese individuals (excluding two outliers) and the 45 Japanese and 45 Han-Chinese individuals from the HapMap project. In the plots with the first and second components (Figure 3A), Han-Chinese individuals formed a distinct cluster (Han-Chinese cluster), and almost all of the Japanese individuals fell into two main clusters. We also examined the relationship between the same individuals with the MDS method14 and obtained a very similar result (Supplemental Data, available online). We classified the Japanese individuals into two main clusters by K-means clustering on Eigenvector 1 values, because most of the differentiation appears to be reflected in Eigenvector 1.
Figure 3.
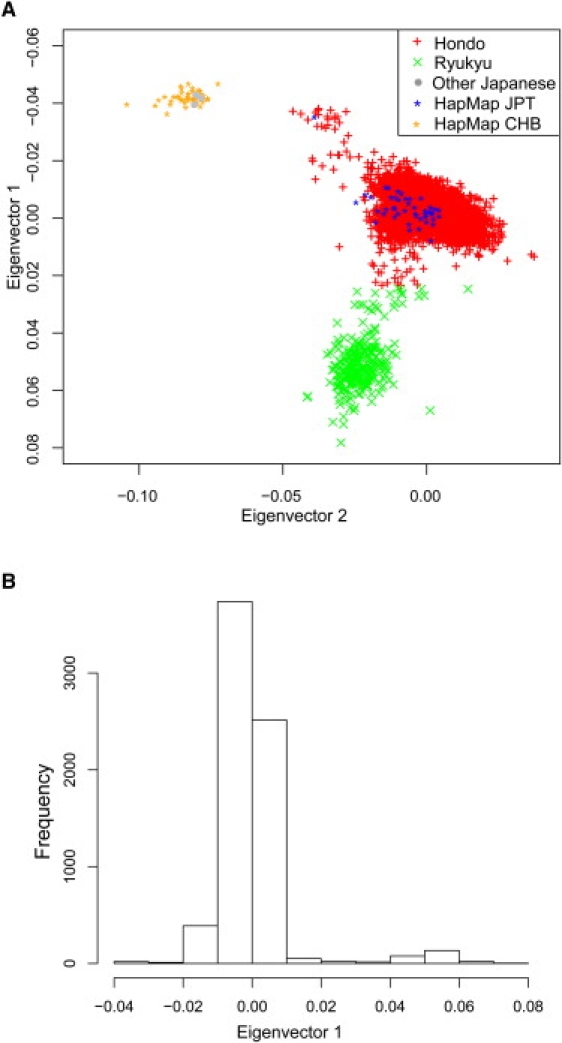
Relatedness between the 7001 Japanese Individuals
(A) The 7001 Japanese individuals, along with the 45 Japanese and 45 Han-Chinese individuals in the HapMap project, were examined for their relatedness with the use of genotype data for 140,387 SNPs. The analysis was conducted with the smartpca program in the EIGENSOFT package, and the Eigenvector factors for the first and the second components were used for the two-dimensional graph. For the Japanese individuals, there were two main clusters: the Hondo cluster (red plus signs) and the Ryukyu cluster (green crosses). There were four Japanese individuals (gray-filled circles) who belonged to the Han-Chinese cluster.
(B) Histogram of Eigenvector 1 for the Japanese individuals. There are two peaks, which correspond to the Hondo cluster and the Ryukyu cluster.
After the information of geographical regions of the Japanese individuals was disclosed, it was found that the largest cluster included most of the Japanese individuals whose samples were taken in an area of Japan other than the Okinawa area (Table 1). The second cluster includes most of the individuals whose samples were taken in Okinawa (Table 1). We call the largest cluster (6732 individuals) the Hondo cluster (the Japanese word “Hondo” literally means “the Japanese main islands other than Okinawa”), and we call the second cluster (265 individuals) the Ryukyu cluster (“Ryukyu” is the name of a kingdom that once existed as a chain of islands including Okinawa). The level of genetic differentiation between the clusters was evaluated by FST.28 The average FST between the Ryukyu and the Hondo clusters was 0.00276 (95% CI: 0.00274–0.00278), and that between the Ryukyu and the Han-Chinese clusters was 0.01108 (95% CI: 0.01101–0.01116). Thus, the Ryukyu cluster is more distant from the Han-Chinese clusters than the Hondo cluster is, given that the average FST between the Hondo and the Han-Chinese clusters is 0.00641 (95% CI: 0.00637–0.00647).
Table 1.
Classification of Japanese Individuals into Hondo and Ryukyu Clusters
| Region | Cluster |
Total | ||
|---|---|---|---|---|
| Hondo | Ryukyu | Han Chinese | ||
| Hokkaido | 509 (99.03) | 4 (0.78) | 0 (0.00) | 513a |
| Tohoku | 466 (100.00) | 0 (0.00) | 0 (0.00) | 466 |
| Kanto-Koshinetsu | 3945 (99.22) | 28 (0.70) | 4 (0.10) | 3977a |
| Tokai-Hokuriku | 358 (100.00) | 0 (0.00) | 0 (0.00) | 358 |
| Kinki | 881 (97.03) | 27 (2.97) | 0 (0.00) | 908 |
| Kyushu | 565 (89.97) | 63 (10.03) | 0 (0.00) | 628 |
| Okinawa | 8 (5.30) | 143 (94.70) | 0 (0.00) | 151 |
| Total | 6732 (96.16) | 265 (3.79) | 4 (0.06) | 7001 |
Numbers and percentages (in parentheses) of the individuals in the clusters are shown.
Individuals who are possible outliers (Figure 2A) were excluded.
Genetic Differentiation among Geographical Regions
To evaluate genetic differentiation among different regions in Japan, the PCA plots in Figure 3A and the classification of Japanese individuals into two clusters were reexamined according to the geographic regions where samples of the individuals were taken (Figures 4A–4G, Table 1). A measure of genetic differentiation, FST,28 between each pair of subpopulations at each SNP site was also estimated, and average FST values over all the autosomes were calculated (Table 2). There is a remarkable genetic differentiation between Okinawa and other regions in Japan. The FST values between Okinawa and the regions in Hondo were 0.00282–0.00352 (Table 2), whereas those for pairs of subpopulations in Hondo were much smaller (0.00023–0.00077).
Figure 4.
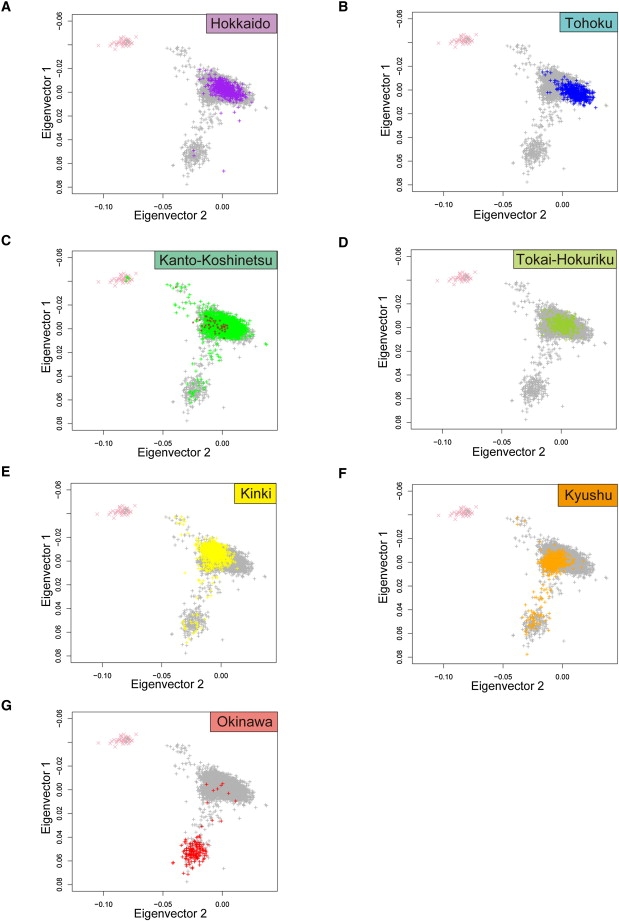
PCA Plots of the Japanese Individuals for Each Geographical Region
The PCA plots in Figure 3A are shown with respect to the seven regions. In each plot, the Japanese individuals (denoted by “+”) from one of the seven regions are highlighted by the colors in Figure 1, whereas the individuals from the other six regions are colored in gray. The HapMap CHB individuals and the HapMap JPT individuals (C) are shown by pink crosses and brown stars, respectively. The average values of Eigenvector 1 (PC1) and Eigenvector 2 (PC2), with standard deviations for the individuals from each region, are in given below.
(A) Hokkaido (purple; PC1 = −0.00140 ± 0.00672; PC2 = 0.00286 ± 0.00723).
(B) Tohoku (blue; PC1 = 0.00291 ± 0.00449; PC2 = 0.01118 ± 0.00716).
(C) Kanto-Koshinetsu (green; PC1 = −0.00100 ± 0.00634; PC2 = 0.00297 ± 0.00819).
(D) Tokai-Hokuriku (yellow-green; PC1 = −0.00188 ± 0.00419; PC2 = 0.00117 ± 0.006255).
(E) Kinki (yellow; PC1 = −0.00479 ± 0.01176; PC2 = −0.00690 ± 0.00707).
(F) Kyushu (orange; PC1 = 0.00451 ± 0.01514; PC2 = −0.00823 ± 0.00758).
(G) Okinawa (red; PC1 = 0.05017 ± 0.01335; PC2 = −0.02244 ± 0.00756).
Table 2.
Genetic Differentiation between Subpopulations
| Tohoku | Kanto-Koshinetsu | Tokai-Hokuriku | Kinki | Kyushu | Okinawa | |
|---|---|---|---|---|---|---|
| Hokkaido | 0.000606 | 0.000293 | 0.000636 | 0.000443 | 0.000552 | 0.003381 |
| (0.000602–0.000610) | (0.000291–0.000296) | (0.000631–0.000640) | (0.00044–0.000445) | (0.000549–0.000556) | (0.00336–0.003403) | |
| Tohoku | 0.000414 | 0.000770 | 0.000642 | 0.000687 | 0.003282 | |
| (0.000412–0.000418) | (0.000765–0.000775) | (0.000638–0.000646) | (0.000682–0.00069) | (0.003263–0.003304) | ||
| Kanto-Koshinstsu | 0.000409 | 0.000229 | 0.000322 | 0.003138 | ||
| (0.000407–0.000412) | (0.000227–0.000230) | (0.00032–0.000324) | (0.003120–0.003157) | |||
| Tokai-Hokuriku | 0.000551 | 0.000659 | 0.003522 | |||
| (0.000548–0.000554) | (0.000655–0.000663) | (0.003499–0.003544) | ||||
| Kinki | 0.000435 | 0.003452 | ||||
| (0.000432–0.000437) | (0.003431–0.003474) | |||||
| Kyushu | 0.002823 | |||||
| (0.002806–0.002842) |
Average FST between two subpopulations is shown. Confidence intervals (95%) are shown in parentheses.
Four of the geographical regions (Hokkaido, Kanto-Koshinetsu, Kinki, and Kyushu) in Hondo included small proportions of individuals from the Ryukyu cluster. Kyushu is located in the southeast part of Hondo, and it includes a part of the Ryukyu Islands in the Kagoshima prefecture. Although most of the individuals (565/628, 89.97%) in the Kyushu area belonged to Hondo cluster (Figure 4F), a significant number belonged to the Ryukyu cluster (63/628, 10.03%). Kanto-Koshinetsu and Kinki, both of which have cities with large populations, included a small fraction of individuals from the Ryukyu cluster (0.70% and 2.97%, respectively). Hokkaido (Figure 4A), which shows similarity to Kanto-Koshinetsu (Figure 4C) in both of the PCA plots and in the FST value, included four individuals (0.78%) from the Ryukyu cluster.
Most of the individuals in the Kanto-Koshinetsu area belonged to the Hondo cluster (3945/3977, 99.22%; Figure 4C), and four individuals in this area belonged to the Han-Chinese cluster. All of the HapMap JPT individuals belonged to the Hondo cluster. The PCA plots in Figure 4C are consistent with the fact that HapMap JPT samples were from Tokyo. The PCA plots in Figure 4C also show that genetic diversity in the Kanto-Koshinetsu area is a little greater than that in Tokyo. All of the individuals in the Tohoku and Tokai-Hokuriku areas belonged to the Hondo cluster (Figures 4B and 4D). However, our data show clear genetic differentiation between Tohoku and Tokai-Hokuriku. Interestingly, the FST value between Tohoku and Tokai-Hokuriku (0.00077; Table 2) was the highest among those between all the pairs of Hondo subpopulations. In the PCA plots, the average values of Eigenvector 2 were higher for the individuals from the eastern area, Tohoku, than for individuals from the western areas (Kinki and Kyushu). Tokai-Hokuriku is located in the middle of Honshu Island, and the average value of Eigenvector 2 for the individuals from Tokai-Hokuriku was intermediate between the average values of those from Tohoku and Kinki. The average values of Eigenvector 2 were highly correlated with the longitudes of the seven regions (r2 = 0.82, p = 0.0051; Figure 5), probably because the Han Chinese have much smaller values of Eigenvector 2 than do the Japanese (Figure 3A) and because the individuals from the western areas were a little closer to Han Chinese than those from the Tohoku area were.
Figure 5.
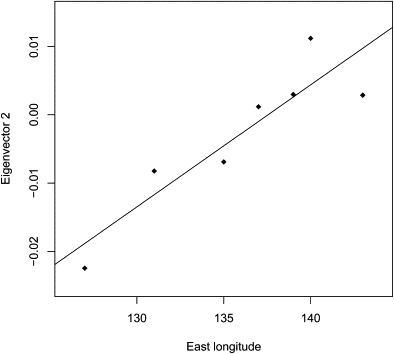
Relationship between Average Eigenvector 2 Values and Longitude, for Seven Regions of Japan
Longitudes (x axis) are the approximate east longitudes of the centers of the regions (Hokkaido, Tohoku, Kanto-Koshinetsu, Tokai-Hokuriku, Kinki, Kyushu, and Okinawa). The slope of the linear-regression line was estimated to be 0.00179 (95% CI: 0.00082–0.00275, p = 0.0051). The line in the graph shows the regression line (y = −0.245 + 0.00179x).
Genetic Differentiation between Hondo and Ryukyu Clusters
To clarify the genetic differences between the Hondo and the Ryukyu clusters over the genome and to know at which regions spurious associations are likely to occur, we examined the differences in allele and genotype frequencies between the two clusters. We examined the empirical distribution of FST for all of the SNPs (see Supplemental Data). In spite of the low level of differentiation between the two clusters (average FST = 0.0028), a substantial proportion of SNPs were located in the tails of the distribution; 165 of 140,368 SNPs have FST ≥ 0.03. Then, we searched for genomic regions that showed relatively higher differentiation by the FST values for each SNP (Table 3). The SNP that showed the highest FST (0.0598) was rs2071652 C/T in an intron of the MOG gene (MIM 159465), in the HLA region on chromosome 6 (at Chr6:29743296), for which the frequencies of allele C were 0.74 and 0.95 for the Hondo and Ryukyu clusters, respectively. In addition, another SNP (rs3094187) showing a high FST value (0.0492) was found in the HLA region. SNPs that were highly differentiated between the two clusters were also found in other chromosomes (Table 3).
Table 3.
Highly Differentiated SNPs between the Hondo and Ryukyu Clusters
| Chr. | Chr. Position (bp) | SNP | FST | Gene | Category |
|---|---|---|---|---|---|
| 1 | 166768077 | rs10429892 | 0.0410 | - | - |
| 1 | 235489612 | rs10495392 | 0.0438 | RYR2 | Intronic |
| 2 | 38763210 | rs13010022 | 0.0425 | GALM | Intronic |
| 2 | 43299016 | rs1346760 | 0.0411 | - | - |
| 2 | 107249537 | rs7587131 | 0.0400 | - | - |
| 2 | 199957247 | rs17265387 | 0.0456 | - | - |
| 3 | 188875600 | rs1365111 | 0.0418 | - | - |
| 4 | 144162662 | rs17017180 | 0.0401 | LOC729675 | Intronic |
| 4 | 185363004 | rs17075469 | 0.0426 | ENPP6 | Intronic |
| 5 | 136980906 | rs757157 | 0.0424 | KLHL3 | 3′ near gene |
| 6 | 29743296 | rs2071652 | 0.0598 | MOG | Intronic |
| 6 | 31234923 | rs3094187 | 0.0492 | TCF19 | 5′ UTR |
| 9 | 9593122 | rs10977865 | 0.0424 | PTPRD | Intronic |
| 10 | 51564756 | rs17720367 | 0.0450 | - | - |
| 10 | 52897035 | rs10997653 | 0.0422 | PRKG1 | Intronic |
| 10 | 78685945 | rs555766 | 0.0435 | KCNMA1 | Intronic |
| 10 | 104112832 | rs1890060 | 0.0411 | GBF1 | Intronic |
| 16 | 55898649 | rs1787781 | 0.0418 | - | - |
| 16 | 56479057 | rs2033249 | 0.0441 | - | - |
| 20 | 5360723 | rs709028 | 0.0407 | - | - |
| 22 | 21011765 | rs3819309 | 0.0425 | - | - |
SNPs for which FST values were relatively higher (≥0.04) are listed.
The nonsynonymous SNP showing the greatest difference in genotype frequency between the Hondo and Ryukyu clusters, as determined by the Cochran-Armitage trend test,12 was rs3827760 T/C (370Val/Ala) in the EDAR gene (MIM 604095) (Table 4). The frequencies of the T allele in the Hondo and Ryukyu clusters were 0.222 and 0.398, respectively. This SNP is highly differentiated between Asian and other populations, and its C allele is associated with thick hair.30,31 The nonsynonymous SNP that showed the second greatest difference in genotype frequencies was rs17822931 G/A (180Gly/Arg) in the ABCC11 gene (MIM 607040). The frequency of the G allele, which is associated with wet ear wax (MIM 117800), was higher in the Ryukyu cluster (0.258) than in the Hondo cluster (0.121). The A allele, which is associated with dry ear wax and whose frequencies were highest in Chinese and Koreans,32 was predominant in both the Hondo and Ryukyu clusters.
Table 4.
Nonsynonymous SNPs Showing Significant Differences in Genotype Frequencies between the Hondo and Ryukyu Clusters
| SNP | Chr. | Position | Gene | Amino Acid Change | p Valuea |
|---|---|---|---|---|---|
| rs3827760 | 2 | 108880033 | EDAR | 370 Ala/Val | 7.73×10⁻²¹ |
| rs17822931 | 16 | 46815699 | ABCC11 | 180 Gly/Arg | 1.63×10⁻²⁰ |
| rs2274067 | 1 | 229443429 | C1orf131 | 28 Val/Leu | 1.20×10⁻¹⁵ |
| rs3744921 | 18 | 28121686 | FAM59A | 291 Lys/Arg | 1.11×10⁻¹⁴ |
| rs9932051 | 16 | 10482297 | ATF7IP2 | 537 Thr/Ile | 1.63×10⁻¹² |
| rs2465811 | 12 | 69276321 | PTPRB | 127 Gly/Ser | 2.55×10⁻¹² |
| rs2589957 | 15 | 88704315 | MGC75360 | 83 Asn/Ser | 2.85×10⁻¹² |
| rs928302 | 21 | 42683153 | TMPRSS3 | 53 Val/Ile | 4.87×10⁻¹² |
| rs2273697 | 10 | 101553805 | ABCC2 | 417 Ile/Val | 1.18×10⁻¹¹ |
| rs3734166 | 5 | 137693222 | CDC25C | 70 Cys/Arg | 1.01×10⁻¹⁰ |
| rs3765534 | 13 | 94613416 | ABCC4 | 757 Glu/Lys | 1.54×10⁻¹⁰ |
| rs2070235 | 20 | 41764871 | MYBL2 | 427 Ser/Gly | 4.81×10⁻¹⁰ |
| rs2289178 | 15 | 46842064 | CEP152 | 700 Ile/Ser | 5.27×10⁻¹⁰ |
| rs3778922 | 7 | 151433265 | GALNT11 | 197 Tyr/Asp | 9.64×10⁻¹⁰ |
| rs10487075 | 7 | 88802957 | FLJ32110 | 909 Lys/Glu | 1.52×10⁻⁹ |
| rs14103 | 1 | 35093829 | LOC113444 | 14 Leu/Val | 4.88×10⁻⁹ |
| rs2275586 | 10 | 99230748 | MMS19L | 68 Gly/Ala | 1.16×10⁻⁸ |
| rs2228226 | 12 | 56152088 | GLI1 | 1100 Gln/Glu | 1.17×10⁻⁸ |
| rs3781409 | 10 | 126705619 | CTBP2 | 234 Met/Val | 1.54×10⁻⁸ |
| rs3732530 | 3 | 47593957 | CSPG5 | 188 Val/Gly | 1.80×10⁻⁸ |
| rs17707947 | 5 | 16930744 | MYO10 | 32 Val/Ile | 1.88×10⁻⁸ |
| rs2289080 | 2 | 233114422 | CHRNG | 149 Thr/Ala | 2.92×10⁻⁸ |
| rs3756323 | 5 | 140559542 | PCDHB11 | 4 Arg/Gln | 4.03×10⁻⁸ |
| rs11145017 | 9 | 78514775 | PRUNE2 | 446 Met/Ile | 4.73×10⁻⁸ |
| rs2241586 | 19 | 57560834 | ZNF610 | 131 Ser/Ala | 4.81×10⁻⁸ |
| rs2075352 | 3 | 10286939 | TATDN2 | 358 Pro/Leu | 5.03×10⁻⁸ |
| rs2295612 | 1 | 158883327 | SLAMF1 | 11 Phe/Leu | 9.51×10⁻⁸ |
Nonsynonymous SNPs for which P values were less than 10−7 are listed.
p values for the Cochran-Armitage trend test of genotype frequencies.
Effects of the Population Structure on a Case–Control Study
To examine how the Japanese population structure affects a case–control study, we conducted simulations by sampling individuals as cases and controls from subpopulations in different compositions. Then, we calculated the genome-wide χ2 inflation factor, λ, for genomic control,9–11 an indicator of the inflation of false-positive rates due to the effects of population structure. First, we examined how much the difference in proportions between case individuals from the Hondo and the Ryukyu clusters and control individuals from the Hondo and the Ryukyu clusters would affect the genome-wide χ2 inflation factor, λ. We conducted simulations in which the control group consisted of individuals from the Hondo cluster and the case group was a mixture of individuals from the Hondo and the Ryukyu clusters. Under these conditions, with 200 individuals for both cases and controls, the λ value reached 1.1 when the proportion of the individuals from the Ryukyu cluster was 23% (Figure 6A). Then, we examined how the sample size affects λ when the proportion of the individuals from the Ryukyu cluster in the case group was 10% or 20% (Figure 6B). As expected, we observed a linear increase of λ as the sample size increased. When 10% of the cases were from the Ryukyu cluster, the λ value was close to 1.1 when the sample size was 1000. This suggests that the inflation of false-positive rates would be within an acceptable level (λ ≤ 1.1) for a study design when the proportion of the individuals from the Ryukyu cluster is less than 10% and the sample size is 1000. If the sample size is larger than 1000, inclusion of individuals from the Ryukyu cluster could affect the results of the association study even when the proportion is small. Conversely, inclusion of a higher proportion of individuals from the Ryukyu cluster may not seriously affect the results of the association study when the sample size is smaller than 1000. Because λ is expected to increase linearly when the sample size increases, the acceptable proportion of the subjects from the Ryukyu cluster can be estimated for different sample sizes. When 20% of cases were from the Ryukyu cluster, the average value of λ exceeded 1.1 when the sample size was 300. This suggests that including a substantial proportion of individuals from the Ryukyu cluster would increase the rate of false-positive results even if the sample sizes were much smaller than 1000.
Figure 6.
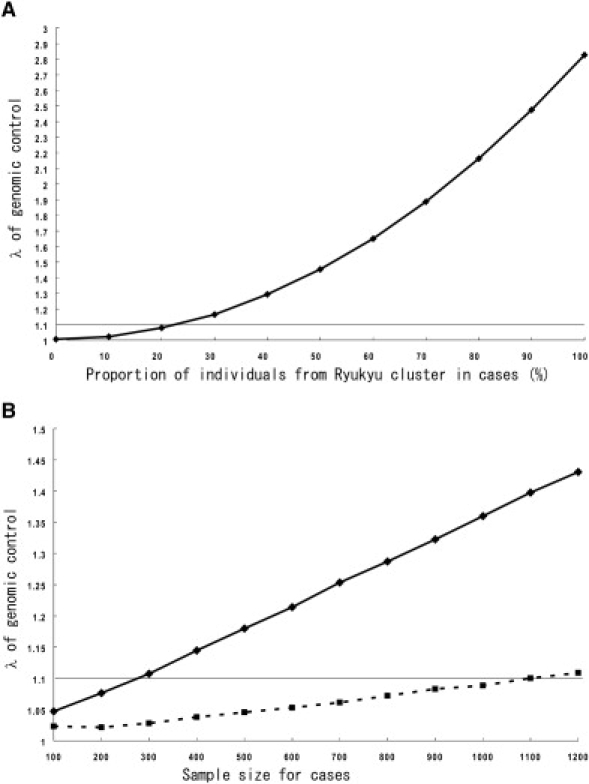
Increase of the Genome-Wide Inflation Factor by Different Compositions of Individuals from the Two Main Clusters
Simulations were performed with the use of genotype data for 140,387 SNPs by sampling of individuals from the subpopulations. The effects on rates of possible false-positive results by different compositions of the case individuals from the Ryukyu cluster were evaluated by calculation of average values of λ for the genomic control. The horizontal gray line shows λ = 1.1.
(A) Cases (200 individuals) were chosen from the Hondo and the Ryukyu clusters in different compositions, and 200 control individuals were chosen from Hondo cluster.
(B) Increase of λ with samples sizes with fixed proportions of individuals from the Ryukyu cluster (squares and dotted line, 10%; diamonds and solid line, 20%).
We also examined how different proportions of case and control individuals from subpopulations in Hondo affect λ, although the genetic differences within the Hondo cluster are much smaller than the genetic difference between the Hondo and the Ryukyu clusters. As a combination of two subpopulations in Hondo, individuals from Tohoku and Kinki (FST = 0.00064 between the two subpopulations) were used. In this simulation, all of the controls were from Kinki and the cases were a mixture of individuals from Kinki and Tohoku in different proportions. In simulations with 400 cases and 400 controls, we observed that λ reached 1.1 when the proportion of Tohoku case individuals was 53% (Figure 7).
Figure 7.
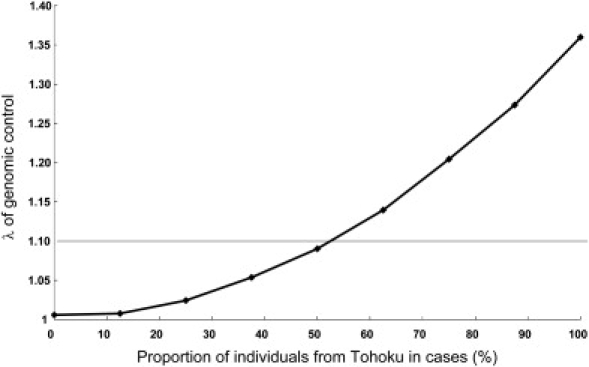
Increase of the Genome-Wide Inflation Factor by Different Compositions of Individuals from the Tohoku and Kinki Areas
Cases (400 individuals) were chosen from Tohoku and Kinki subpopulations in different compositions, and 400 control individuals were chosen from Kinki subpopulation.
To examine the effects of genetic differences between different regions within Hondo in a GWAS, we then conducted simulations by using pairs of the Hondo regions; one subpopulation was used for the cases and the other was used for the controls. For each condition of simulations with different numbers of individuals (200–350), the average value of λ was calculated (Figure 8). For the pairs of two subpopulations excluding Tohoku and Kyushu, the λ values were close to 1.0 and never reached 1.1 even when the sample size was 350. On the other hand, the pairs including Kyushu or Tohoku showed higher values of λ. The two pairs, Tohoku versus Kinki and Tohoku versus Kyushu, showed the highest λ values. For sample sizes larger than 350, the λ values can be approximated as λ increases linearly with the sample size.
Figure 8.
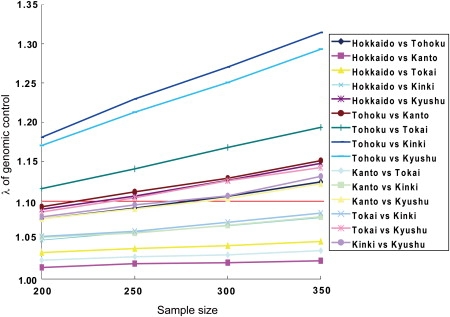
Increase of the Genome-Wide Inflation Factor with the Use of Two Different Subpopulations as Cases and Controls
With the use of a pair of subpopulations in Hondo, case individuals were chosen from one subpopulation and control individuals were chosen from another subpopulation. The average values of the genome-wide inflation factor are shown for different sample sizes. The horizontal red line shows λ = 1.1.
Discussion
Our present study has clearly shown, on the basis of analysis of genome-wide SNP genotypes that most Japanese individuals fall into two main clusters: the Hondo cluster and the Ryukyu cluster. Our results also show that local regions in Honshu Island (the largest island of Japan) are still genetically differentiated, even though human migration within Japan has become rather frequent in the past 100 years or so. Our finding that the individuals from Tohoku were less related to Han-Chinese individuals than were the individuals from Kinki and Kyushu suggests that the individuals in Tohoku were less affected by immigrants from the Asian continent than were the individuals in Kinki. The immigrants who came to Japan from the Asian continent through the Korean Peninsula may have entered Japan from northern Kyushu, the Japan Sea side of Kinki or Chugoku. Our finding that the individuals from the western areas in the Hondo cluster had smaller values of Eigenvector 2 than did those in the eastern areas may be because the northeast areas of Japan, such as Tohoku, are distant from the main contact point to the Asian continent. On the other hand, the individuals from Kanto-Koshinetsu and Hokkaido were broadly distributed in the PCA plots, which is not consistent with the east-west trend of genetic differentiation. The broad distribution of the individuals from Kanto-Koshinetsu may be due to recent migrations from various areas of Japan into the Kanto area. The Kanto area includes large cities, such as Tokyo and Yokohama, and recent migrations from various areas of Japan into the Kanto area may have obscured ancient genetic differentiation in the Kanto area. The individuals in Hokkaido are similar to those in the Kanto-Koshinetsu area, even though Hokkaido is located at the north end of Japan. This is probably because most of the people living in Hokkaido are descendents of people who moved from Honshu. The current population of Ainu (an ethnic group indigenous to Hokkaido) was estimated to be about 25,000, and this is ∼0.5% of the whole population in Hokkaido.
Previous studies showed genetic affinities between the Ainu and Ryukyu peoples,21,33 who live in the north and south ends of Japan, respectively, and who are thought to be descendents of the Jomon people. These observations are consistent with the “dual-origin hypothesis”,22 which states that the ancestral Japanese populations were brought by two major migration events.17,19–21 Archeological studies have suggested that the Jomon period (the Japanese Neolithic age) started about 16,000 years ago and ended about 3000 years ago, when the Yayoi period, a rice-farming and metal-using age, started. In the Yayoi period, immigrants from the Asian continent had moved to western Japan via Korea or China and expelled or mixed with the Jomon people. Our observations of the two main clusters and genetic differentiation among geographic regions are not discordant with the dual-origin hypothesis, although most of the Hokkaido individuals in this study are probably different from the indigenous Ainu people. Most of the people living in Okinawa Island are probably derived from the Jomon people, whereas most of the people living in Hondo are probably derived from the Yayoi people or are a mixture of the Yayoi and Jomon peoples. Individuals in Tohoku showed two interesting features that are difficult to attribute to only local genetic differentiation. First, within the Hondo cluster, the individuals from Tohoku were closest to the individuals from Okinawa with respect to Eigenvector 1 (Supplemental Data). Second, the FST value between Tohoku and Okinawa was smaller than the FST value between Tokai-Hokuriku and Okinawa, even though the geographical distance between Okinawa and Tohoku is greater than that between Okinawa and Tokai-Hokuriku. These observations might reflect ancient population affinities between Tohoku and Okinawa, which have been obscured by the gene flow between their geographic neighbors in Honshu Island. The presence of two main clusters may also be explained by the long-term isolation of populations in the Ryukyu Islands.34 However, the finding that the FST value between Okinawa and Tohoku was smaller than that between Okinawa and Tokai-Hokuriku cannot be explained by only local genetic differentiation. The distinct difference between the Hondo and the Ryukyu clusters is probably due to two factors: there were two major migrations to Japan, and populations in the Ryukyu Islands became genetically differentiated by isolation.
Although we classified the 7001 Japanese individuals into the two main clusters, most of the individuals in the Hondo cluster were located in a limited area in the PCA plot (between −0.02 and 0.01 for the first component and between −0.02 and 0.02 for the second component). If we define a “core Hondo-cluster area” as this area including most of the individuals, we notice a small fraction of individuals who were located between the Han-Chinese cluster and the core Hondo-cluster area (Figure 3A). Some of those individuals might be genetically non-Japanese East Asians, and others may have mixed Japanese and non-Japanese East-Asian ancestries. Further analyses including individuals from other areas of Asia would be desirable for understanding the Japanese population structure in detail, considering recent migrations from neighboring countries.
It is interesting that the genotype frequencies of two nonsynonymous SNPs, one in EDAR and the other in ABCC11, were significantly different between the Hondo and Ryukyu clusters. This is because these SNPs were associated with phenotypic variations,30,31 and it was suggested that the increase in the frequencies of the specific alleles were driven by positive selection. These observations suggest that a search for differentiated nonsynonymous SNPs between closely related subpopulations, like the Hondo and the Ryukyu clusters, would be an efficient approach to finding SNPs that are involved in phenotypic variations and have been under natural selection.
We should be careful when inferring from allele–trait associations that are detected in the genomic regions where relatively higher differentiations were observed (e.g., particular regions in chromosome 6).3 As a result of the considerable heterogeneity in the level of genetic differentiation over the human genome,35,36 spurious associations are more likely to occur in differentiated regions than in other regions, even if the value of the genome-wide inflation factor is within an acceptable range. To avoid possible false-positive results at differentiated SNPs, a method for correcting the effect of population stratification (implemented in the EIGENSTRAT program in EIGENSOFT13) would be effective.
Because of the genetic differentiation among geographical regions in Japan, the design of a GWAS needs to take into account the structure of the Japanese population, especially if there are differences in disease prevalence among geographical regions of Japan. In the present study, we used individual genotype data to conduct simulations in order to examine to what extent the population stratification causes an increase of false-positive rates in association studies. On the basis of the genome-wide χ2 inflation factor, λ, we found the conditions under which an increase of false-positive rates would be acceptable or negligible. More generally, we propose the following approaches to avoidance of an inflation of false positive rates in a GWAS for the Japanese population: (1) If either cases or controls include individuals from the Ryukyu cluster in different but small proportions, simply exclude them in the studies. (2) If both case and control groups include significant proportions of individuals from the Ryukyu cluster, examine the heterogeneity of the odds ratios among the clusters and the entire sample (e.g., by using the Mantel-Haenzel's test37). (3) Select controls so that the proportions of individuals from the Ryukyu cluster in case and control groups are as equal as possible. (4) If one examines the relatedness between case and control groups by any method (e.g., the smartpca program in EIGENSOFT,13,15 PLINK14) and obtains a result in a two-dimensional graph, then select the controls so that the graph areas including cases and controls are equivalent.
Supplemental Data
Supplemental Data include two figures and one table and can be found with this paper online at http://www.ajhg.org/.
Supplemental Data
Web Resources
The URLs for data presented herein are as follows:
EIGENSOFT, http://genepath.med.harvard.edu/∼reich/Software.htm
HapMap, http://www.hapmap.org/
Online Mendelian Inheritance in Man (OMIM), http://www.ncbi.nlm.nih.gov/Omim/
Acknowledgments
We thank Kazuharu Misawa, Takahiro Nakamura, Tatsuhiko Tsunoda, and Ryo Yamada for helpful discussions. We thank Toshihiro Tanaka for his effort in the SNP-discovery project in Japan. We thank all of the members in the Laboratory for Genotyping. We also thank all of the members in the BioBank Japan Project for their efforts in organizing the project. This study was supported by the Ministry of Education, Culture, Sports, Science and Technology; of Japan.
References
- 1.Ozaki K., Ohnishi Y., Iida A., Sekine A., Yamada R., Tsunoda T., Sato H., Sato H., Hori M., Nakamura Y., Tanaka T. Functional SNPs in the lymphotoxin-alpha gene that are associated with susceptibility to myocardial infarction. Nat. Genet. 2002;32:650–654. doi: 10.1038/ng1047. [DOI] [PubMed] [Google Scholar]
- 2.Klein R.J., Zeiss C., Chew E.Y., Tsai J.Y., Sackler R.S., Haynes C., Henning A.K., SanGiovanni J.P., Mane S.M., Mayne S.T. Complement factor H polymorphism in age-related macular degeneration. Science. 2005;308:385–389. doi: 10.1126/science.1109557. [DOI] [PMC free article] [PubMed] [Google Scholar]
- 3.The Wellcome Trust Case Control Consortium Genome-wide association study of 14,000 cases of seven common diseases and 3,000 shared controls. Nature. 2007;447:661–678. doi: 10.1038/nature05911. [DOI] [PMC free article] [PubMed] [Google Scholar]
- 4.Voight B.F., Pritchard J.K. Confounding from cryptic relatedness in case-control association studies. PLoS Genetics. 2005;1:e32. doi: 10.1371/journal.pgen.0010032. [DOI] [PMC free article] [PubMed] [Google Scholar]
- 5.Reich D.E., Goldstein D.B. Detecting association in a case-control study while correcting for population stratification. Genet. Epidemiol. 2001;20:4–16. doi: 10.1002/1098-2272(200101)20:1<4::AID-GEPI2>3.0.CO;2-T. [DOI] [PubMed] [Google Scholar]
- 6.Pritchard J.K., Rosenberg N.A. Use of unlinked genetic markers to detect population stratification in association studies. Am. J. Hum. Genet. 1999;65:220–228. doi: 10.1086/302449. [DOI] [PMC free article] [PubMed] [Google Scholar]
- 7.Pritchard J.K., Stephens M., Donnelly P. Inference of population structure using multilocus genotype data. Genetics. 2000;155:945–959. doi: 10.1093/genetics/155.2.945. [DOI] [PMC free article] [PubMed] [Google Scholar]
- 8.Hoggart C.J., Shriver M.D., Kittles R.A., Clayton D.G., McKeigue P.M. Design and analysis of admixture mapping studies. Am. J. Hum. Genet. 2004;74:965–978. doi: 10.1086/420855. [DOI] [PMC free article] [PubMed] [Google Scholar]
- 9.Devlin B., Roeder K. Genomic control for association studies. Biometrics. 1999;55:997–1004. doi: 10.1111/j.0006-341x.1999.00997.x. [DOI] [PubMed] [Google Scholar]
- 10.Devlin B., Roeder K., Wasserman L. Genomic control for association studies: a semiparametric test to detect excess-haplotype sharing. Biostatistics. 2000;1:369–387. doi: 10.1093/biostatistics/1.4.369. [DOI] [PubMed] [Google Scholar]
- 11.Devlin B., Roeder K., Wasserman L. Genomic control, a new approach to genetic-based association studies. Theor. Popul. Biol. 2001;60:155–166. doi: 10.1006/tpbi.2001.1542. [DOI] [PubMed] [Google Scholar]
- 12.Armitage P. Tests for linear trends in proportions and frequencies. Biometrics. 1955;11:375–386. [Google Scholar]
- 13.Price A.L., Patterson N.J., Plenge R.M., Weinblatt M.E., Shadick N.A., Reich D. Principal components analysis corrects for stratification in genome-wide association studies. Nat. Genet. 2006;38:904–909. doi: 10.1038/ng1847. [DOI] [PubMed] [Google Scholar]
- 14.Purcell S., Neale B., Todd-Brown K., Thomas L., Ferreira M.A., Bender D., Maller J., Sklar P., de Bakker P.I., Daly M.J., Sham P.C. PLINK: a tool set for whole-genome association and population-based linkage analyses. Am. J. Hum. Genet. 2007;81:559–575. doi: 10.1086/519795. [DOI] [PMC free article] [PubMed] [Google Scholar]
- 15.Patterson N., Price A.L., Reich D. Population structure and eigenanalysis. PLoS Genetics. 2006;2:e190. doi: 10.1371/journal.pgen.0020190. [DOI] [PMC free article] [PubMed] [Google Scholar]
- 16.Haga H., Yamada R., Ohnishi Y., Nakamura Y., Tanaka T. Gene-based SNP discovery as part of the Japanese Millennium Genome Project: identification of 190,562 genetic variations in the human genome. Single-nucleotide polymorphism. J. Hum. Genet. 2002;47:605–610. doi: 10.1007/s100380200092. [DOI] [PubMed] [Google Scholar]
- 17.Horai S., Murayama K., Hayasaka K., Matsubayashi S., Hattori Y., Fucharoen G., Harihara S., Park K.S., Omoto K., Pan I.H. mtDNA polymorphism in East Asian Populations, with special reference to the peopling of Japan. Am. J. Hum. Genet. 1996;59:579–590. [PMC free article] [PubMed] [Google Scholar]
- 18.Tanaka M., Cabrera V.M., Gonzalez A.M., Larruga J.M., Takeyasu T., Fuku N., Guo L.J., Hirose R., Fujita Y., Kurata M. Mitochondrial genome variation in eastern Asia and the peopling of Japan. Genome Res. 2004;14:1832–1850. doi: 10.1101/gr.2286304. [DOI] [PMC free article] [PubMed] [Google Scholar]
- 19.Hammer M.F., Horai S. Y chromosomal DNA variation and the peopling of Japan. Am. J. Hum. Genet. 1995;56:951–962. [PMC free article] [PubMed] [Google Scholar]
- 20.Hammer M.F., Karafet T.M., Park H., Omoto K., Harihara S., Stoneking M., Horai S. Dual origins of the Japanese: common ground for hunter-gatherer and farmer Y chromosomes. J. Hum. Genet. 2006;51:47–58. doi: 10.1007/s10038-005-0322-0. [DOI] [PubMed] [Google Scholar]
- 21.Omoto K., Saitou N. Genetic origins of the Japanese: a partial support for the dual structure hypothesis. Am. J. Phys. Anthropol. 1997;102:437–446. doi: 10.1002/(SICI)1096-8644(199704)102:4<437::AID-AJPA1>3.0.CO;2-P. [DOI] [PubMed] [Google Scholar]
- 22.Hanihara K. Dual structure model for the population history of the Japanese. Japan Review. 1991;2:1–33. [Google Scholar]
- 23.Nakamura T., Shoji A., Fujisawa H., Kamatani N. Cluster analysis and association study of structured multilocus genotype data. J. Hum. Genet. 2005;50:53–61. doi: 10.1007/s10038-004-0220-x. [DOI] [PubMed] [Google Scholar]
- 24.The International HapMap Consortium A haplotype map of the human genome. Nature. 2005;437:1299–1320. doi: 10.1038/nature04226. [DOI] [PMC free article] [PubMed] [Google Scholar]
- 25.Nakamura Y. The BioBank Japan Project. Clin. Adv. Hematol. Oncol. 2007;5:696–697. [PubMed] [Google Scholar]
- 26.Hinds D.A., Stuve L.L., Nilsen G.B., Halperin E., Eskin E., Ballinger D.G., Frazer K.A., Cox D.R. Whole-genome patterns of common DNA variation in three human populations. Science. 2005;307:1072–1079. doi: 10.1126/science.1105436. [DOI] [PubMed] [Google Scholar]
- 27.Peacock E., Whiteley P. Perlegen sciences, inc. Pharmacogenomics. 2005;6:439–442. doi: 10.1517/14622416.6.4.439. [DOI] [PubMed] [Google Scholar]
- 28.Wright S. The genetical structure of populations. Ann. Eugen. 1951;15:323–354. doi: 10.1111/j.1469-1809.1949.tb02451.x. [DOI] [PubMed] [Google Scholar]
- 29.Li J.Z., Absher D.M., Tang H., Southwick A.M., Casto A.M., Ramachandran S., Cann H.M., Barsh G.S., Feldman M., Cavalli-Sforza L.L., Myers R.M. Worldwide human relationships inferred from genome-wide patterns of variation. Science. 2008;319:1100–1104. doi: 10.1126/science.1153717. [DOI] [PubMed] [Google Scholar]
- 30.Fujimoto A., Kimura R., Ohashi J., Omi K., Yuliwulandari R., Batubara L., Mustofa M.S., Samakkarn U., Settheetham-Ishida W., Ishida T. A scan for genetic determinants of human hair morphology: EDAR is associated with Asian hair thickness. Hum. Mol. Genet. 2008;17:835–843. doi: 10.1093/hmg/ddm355. [DOI] [PubMed] [Google Scholar]
- 31.Sabeti P.C., Varilly P., Fry B., Lohmueller J., Hostetter E., Cotsapas C., Xie X., Byrne E.H., McCarroll S.A., Gaudet R. Genome-wide detection and characterization of positive selection in human populations. Nature. 2007;449:913–918. doi: 10.1038/nature06250. [DOI] [PMC free article] [PubMed] [Google Scholar]
- 32.Yoshiura K., Kinoshita A., Ishida T., Ninokata A., Ishikawa T., Kaname T., Bannai M., Tokunaga K., Sonoda S., Komaki R. A SNP in the ABCC11 gene is the determinant of human earwax type. Nat. Genet. 2006;38:324–330. doi: 10.1038/ng1733. [DOI] [PubMed] [Google Scholar]
- 33.Bannai M., Ohashi J., Harihara S., Takahashi Y., Juji T., Omoto K., Tokunaga K. Analysis of HLA genes and haplotypes in Ainu (from Hokkaido, northern Japan) supports the premise that they descent from Upper Paleolithic populations of East Asia. Tissue Antigens. 2000;55:128–139. doi: 10.1034/j.1399-0039.2000.550204.x. [DOI] [PubMed] [Google Scholar]
- 34.Novembre J., Stephens M. Interpreting principal component analyses of spatial population genetic variation. Nat. Genet. 2008;40:646–649. doi: 10.1038/ng.139. [DOI] [PMC free article] [PubMed] [Google Scholar]
- 35.Weir B.S., Cardon L.R., Anderson A.D., Nielsen D.M., Hill W.G. Measures of human population structure show heterogeneity among genomic regions. Genome Res. 2005;15:1468–1476. doi: 10.1101/gr.4398405. [DOI] [PMC free article] [PubMed] [Google Scholar]
- 36.Akey J.M., Zhang G., Zhang K., Jin L., Shriver M.D. Interrogating a high-density SNP map for signatures of natural selection. Genome Res. 2002;12:1805–1814. doi: 10.1101/gr.631202. [DOI] [PMC free article] [PubMed] [Google Scholar]
- 37.Mantel N., Haenszel W. Statistical aspects of the analysis of data from retrospective studies of disease. J. Natl. Cancer Inst. 1959;22:719–748. [PubMed] [Google Scholar]
Associated Data
This section collects any data citations, data availability statements, or supplementary materials included in this article.