Abstract
In this paper we introduce Nanoscale Optofluidic Sensor Arrays (NOSAs), which are an optofluidic architecture for performing highly parallel, label free detection of biomolecular interactions in aqueous environments. The architecture is based on the use of arrays of 1D photonic crystal resonators which are evanescently coupled to a single bus waveguide. Each resonator has a slightly different cavity spacing and is shown to independently shift its resonant peak in response to changes in refractive index in the region surrounding its cavity. We demonstrate through numerical simulation that by confining biomolecular binding to this region, limits of detection on the order of tens of attograms (ag) are possible. Experimental results demonstrate a refractive index (RI) detection limit of 7×10⁻⁵ for this device. While other techniques such as SPR possess a equivalent RI detection limit, the advantage of this architecture lies in its potential for low mass limit of detection which is enabled by confining the size of the probed surface area.
1. Introduction
Optical techniques represent one of the most popular methods for performing sensitive and label free biomolecular detection. Broadly speaking the primary advantages of optical techniques over analogous mechanical or electrical label free methods [1] are: the relative ease with which devices can be fabricated and the broad range of fluids and environments in which they can be used (e.g. gas, water and serum). Though numerous different architectures have been developed (including interferometric sensors [2, 3], resonant cavity sensors [4, 5], whispering gallery mode sensors [6, 7], surface plasma resonance (SPR) sensors [8] and photonic crystal based sensors [9, 10]) in nearly all cases detection is based on measuring the change in refractive index that results when solution phase targets bind with complimentary probes that have been predeposited on the surface. Of all the different architectures that have been developed, planar photonic crystal sensors [11] are particularly interesting not because they are necessarily more sensitive to intensive or bulk properties (e.g. refractive index) but rather because the small interrogation volume makes them more sensitive to extensive properties (e.g. total bound mass). High quality factor 1D and 2D photonic-bandgap microcavity [12] sensors amplify this effect by shrinking the probed volume to the size of the optical cavity, which can be on the order of λ3. Since the mode volume is so small the total amount of mass required to result in a measureable change in the refractive index (reflected by a change in the wavelength of the resonant peak) can also be very small. Examples of such systems include that of Lee et al. [9] who demonstrated a 2D resonant photonic crystal based biosensor for protein detection and Schmidt et al. [13] who demonstrated a nanoparticle sensing in a unique 1D cavity.
The drawback of these designs is that the large photonic bandgap prohibits having multiple sensing sites along the same waveguide. As such the number of targets which can be screened for at once is relatively small. Ideally one would like an architecture that combines the high quality factor, low mode volume sensing of the above devices with the ability to multiplex multiple detection sites along a single waveguide.
Here we describe a new paradigm for optofluidic [14, 15] sensing that allows us to overcome this limitation, which we refer to as Nanoscale Optofluidic Sensor Arrays (NOSA). As will be demonstrated, this technique has potentially tens of attograms level detection sensitivity without the need for target labeling, while allowing for two dimensional multiplexing at reaction site densities at least equivalent to that found in a standard microarray. While the bulk refractive index sensitivity of this device is lower than that of techniques such as SPR, its chief advantage lies in the ability to confine the size of the probed volume thus allowing for a low mass limit of detection. As such our device should be able to detect rarer targets in a given sample size since a smaller number of them are required to impart a measurable change. Each sensing site consists of an evanescently coupled 1D photonic crystal resonator that can be individually addressed via a microfluidic architecture which is bonded on top of the optical chip. In this paper we describe the device design, theoretical simulations, fabrication methods and experimental device characterizations demonstrating the working of this architecture. The numerical simulations confirm our experimental results and are used to analyze the suitability of our NOSA platform as a sensitive nucleic acid sensor. To illustrate the working of our device we flow aqueous solutions possessing different refractive indices through microfluidic channels that target the resonators. We determine the sensitivity of our devices by observing the shift in the resonant wavelength of the resonators as a function of the change in refractive index of the fluid.
2. Device design
Figure 1(a) shows a 3D illustration of our sensor design. It consists of a silicon (Si) waveguide with a 1D photonic crystal micro-cavity (side resonator) that lies adjacent to the waveguide. The side resonator consists of a central defect cavity with 8 holes on either side which form the 1-D photonic crystal. The Si waveguide was designed to be 450 nm wide and 250 nm tall to make it single mode. The low index silicon dioxide (SiO2) layer which lies beneath the high index Si waveguide helps confine the light within the waveguide core, preventing optical losses into the lower substrate. Figure 1(b) shows the fundamental quasi-TE mode for this waveguide geometry.
Figure 1.
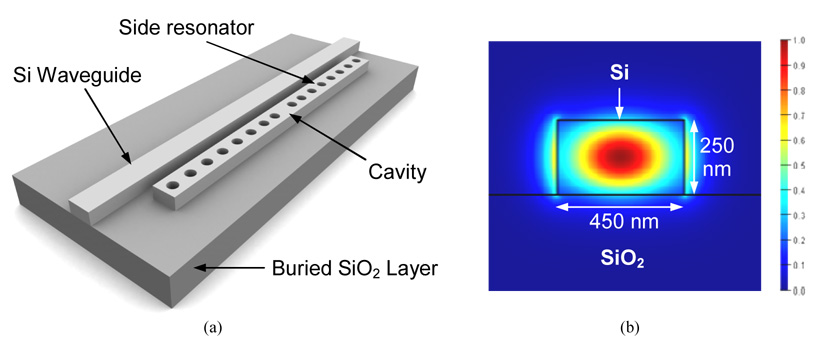
(a) 3D illustration of a sensing element in our sensor design. It consists of a 1D photonic crystal micro-cavity which is evanescently coupled to a Si waveguide. (b) The electric field profile for the fundamental TE mode propagating through an air-clad Si waveguide on SiO2.
A central defect cavity in the 1D photonic crystal gives rise to a defect state in the photonic bandgap. By varying this defect cavity spacing we can tune the resonant wavelength of this state across the bandgap of the side resonator. Analogous to a ring resonator [16] light corresponding to the resonant wavelength couples evanescently into the side resonator and is sustained within it. This results in a dip in the output spectrum of the waveguide at the resonant wavelength. Because the resonant structures lie to the side of the waveguide the bandgap does not interfere with the light transmission outside of that which lies in the resonant peak. Thus our unique design allows multiplexing along a single waveguide by placement of a large number of side resonators along the waveguide, each of which is fabricated to have a slightly different resonant wavelength.
Using Bloch-mode engineering concepts, Velha et al. [17] have experimentally achieved Q-factors as high as 8900 with such 1D resonant cavities. We performed finite difference time domain (FDTD) simulations to study and optimize our device design using a commercial FDTD software package (FDTD Solutions – Lumerical). Here we increased the Q-factor of our device by changing the spacing of the two innermost holes outwards to achieve Q-factors over 2000 for a resonator with 8 holes on either side of the cavity. While more extensive simulations could have been performed to design devices possessing higher Q-factors, a Q-factor of around 2000 is more than sufficient to illustrate the device concept and working principle. The holes in the side resonator were 200 nm in diameter and the lattice spacing of the 1D lattice was 390 nm. The innermost holes were shifted outwards, away from the cavity center by 39 nm.
Figure 2(a) shows the steady state electric field distribution for the resonant wavelength within the device. As can be seen, there is a significant amount of light amplification within the resonator. Relative to the evanescent field at the side walls of the resonator, we observe the inner most holes of the side resonator to have a stronger optical field. This causes the resonators to be very sensitive to refractive index changes within these holes due to the large degree of light-matter interaction inside them. Figure 2(b) is a FDTD simulation which demonstrates the typical output spectrum of a device with four evanescently coupled resonators. In this particular simulation each resonator consists of four holes on either side of the central cavity as opposed to eight which results in a lower Q-factor than that discussed above. The inherent advantage of our sensor design is apparent from this graph. By tuning the input light across a range of wavelengths and having a large number of side resonators (each designed to possess a unique resonant wavelength within this tunable range) placed alongside a single waveguide, the output spectrum will consist of a large number of sharp dips in an otherwise flat spectrum wherein each dip corresponds uniquely to one of the resonators. Any shift in one of the resonances indicates a change in the refractive index of the local environment around the corresponding resonator. In this manner a large number of detections can be done in parallel on a single waveguide (estimates of the maximum number is discussed in the experimental section).
Figure 2.
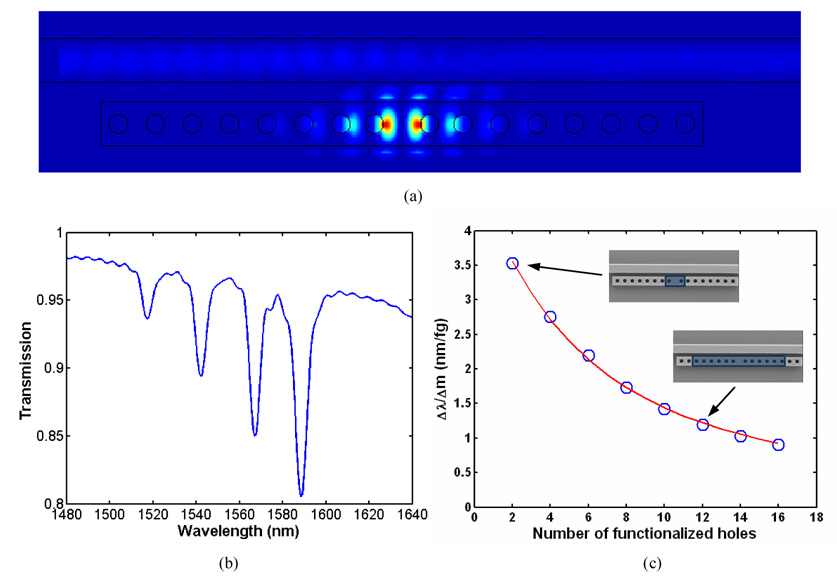
(a) Steady state electric field distribution for the resonant wavelength (b) FDTD simulation showing the output spectrum for a device consisting of a waveguide with four evanescently coupled side cavities adjacent to it. Here each resonator consists of a cavity with four holes on either side. (c) FDTD simulation showing the mass sensitivity of the device plotted as a function of the number of functionalized holes. The blue circles indicate the sensitivity values calculated from the simulations. The red curve shows a least-squares fit using an analytical model for the device sensitivity which is described below.
It is important to note that for applications such as biosensing, the device does not meaure changes in the bulk refractive index of the surrounding medium, but rather respond to local changes in the refractive index at the surface of the sensor. As a result, the magnitude of the resonant shift will be dependent on a combination of factors such as the biolayer thickness and the effective change in refractive index of the bound targets. To model this here, we performed detailed 3D FDTD simulations wherein we studied the sensitivity of this sensor design and determined how to achieve the lowest mass limit of detection using this architecture. We assumed that the resonator was initially functionalized by a 50 nm thick single stranded DNA monolayer (ssDNA). When a detection event occurs, the complementary ssDNA strand of the target would hybridize with the functionalized capture probes forming double stranded DNA (dsDNA). The ssDNA monolayer and the dsDNA monolayer were assumed to possess refractive indices of 1.456 and 1.53 respectively and a binding density of 1.49 pmol/cm2 [18]. The molecular weight of the nucleic acids used in our simulations is 57000 Daltons. We varied the number of holes being functionalized to study the mass sensitivity of the device as a function of the number of functionalized holes. Simulations were performed for the cases of two holes (the innermost holes on either side of the cavity), four holes (the inner two holes on either side), and so forth, up to 16 holes (eight holes on either side) being functionalized with a ssDNA capture probe. We have calculated the term Δλ/Δm in all these cases where Δλ is the shift in the resonant wavelength of the device caused due to positive binding events resulting in the formation of dsDNA and Δm is the mass of the bound target. This Δλ/Δm term is indicative of the mass sensitivity of the device. We use nucleic acids as are model species in this case due to the availability of data relating the change in local refractive index with surface concentration of immobilized probes and bound targets. For very large nucleic acid targets however there may be steric effects which preclude transport into the resonator holes potentially degrading the overall sensitivity. For smaller nucleic acids or antibody/antigen systems we do not expect this to be a problem.
The blue circles in Fig. 2(c) show the calculated sensitivity, Δλ/Δm for these different cases. As can be seen, the innermost holes are the most sensitive to any refractive index changes in the local environment as opposed to the holes that are further away from the cavity. These results can be explained by noting that in Fig. 2(a) the evanescent field is largest inside the innermost holes and decreases inside holes that are situated further away from the cavity. This is important to note because targeting only the inner most holes for functionalization allows for the lowest possible limit of mass detection for this device. In the case where only the inner two holes are functionalized we find that the resonance shifts by 3.5 nm when 1 femtogram of DNA binds to the resonator. Therefore a mass change of 10 attograms would result in a mass surface density of 0.84 nanogram/cm2 and an approximate shift of 10−2 nm which can be experimentally detected.
The mass sensitivity Δλ/Δm can be expressed by the following equation:
| (1) |
Here Δn is the change in refractive index induced by binding events at the sensing site and A is the area of the sensor that is functionalized with probe molecules. To maximize the mass sensitivity we try to optimize the terms in the RHS of Eq. (1). We observe that the first term Δn/(Δm/A) which represents the change in refractive index induced by the binding of mass, Δm per unit area is purely dependent on the optical properties of the bound target and the functionalization surface chemistry and thus cannot be increased by any other means. The Δλ/Δn term is a measure of the refractive index sensitivity of the device. Figure 3 is a plot illustrating the dependence of the wavelength shift Δλ on the number of functionalized holes N. We observe that an exponential function of the form a(1-e−bN) (shown in red), where a and b are arbitrary constants approximates this dependency quite well. It should be noted that the area A is directly proportional to the number of functionalized holes N. Thus taking all of the above into consideration we can express Eq. (1) analytically as:
| (2) |
where α and β are arbitrary constants. From the form of Eq. (2) we observe that the mass sensitivity increases if we lower the number of holes N, that are functionalized. Eq. (2) is used to fit the red curve in Fig. 2(c) where the values of α and β are 14.96 nm/fg and 0.3238 respectively. Thus, this analytical expression shows good agreement with the FDTD simulation results and helps us to understand that the mass sensitivity of the device increases with a decrease in the number of functionalized holes. To reiterate, although the resonant shift is larger for the greater number of holes which are functionalized, more bound mass is required to impart this change. Thus increasing the number of holes which are functionalized tends to negatively affect the mass limit of detection.
Figure 3.
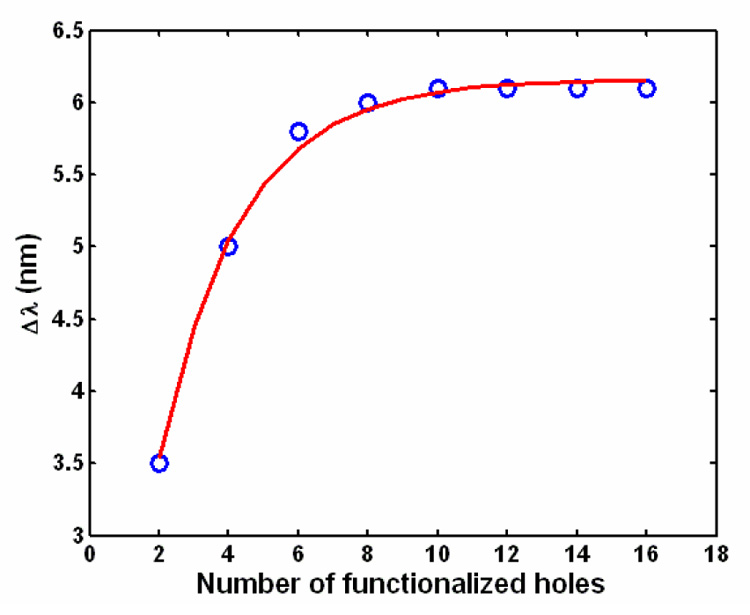
Plot illustrating the dependence of the shift in resonant wavelength of a resonator on the number of functionalized holes. The blue holes indicate the data obtained from 3D FDTD simulations. The red curve is a best-fit curve of the form a(1−e−bN) where a and b are arbitrary constants. The values of a and b used here are 6.159 nm and 0.4273 respectively.
3. Device Fabrication and experimental setup
To demonstrate the nanoscale optofluidic sensor array architecture and provide some validation of our numerical technique we fabricated a number of devices and performed a series of experimental characterization experiments. The devices were fabricated on SOI wafers having a device thickness of 250 nm. XR-1541 e-beam resist (HSQ, Dow-Corning Corporation) was spun on the wafer and the devices were patterned using a Leica VB6-HR electron beam lithography system. The Si device layer was then etched vertically down using a Chlorine based inductively coupled plasma etching system. The remaining XR-1541 was dissolved in a dilute 100:1 HF solution. To increase coupling efficiencies nanotapers [19] were fabricated and a layer of hard baked SU-8 (Microchem) photoresist was used as a cladding to the nanotapers. Following this the wafer was diced along the input and output ends of the waveguides.
The top fluidic architecture was fabricated using a soft lithography technique with polydimethylsiloxane (PDMS) [20] which is a flexible polymer. SU-8 photoresist was patterned and hardbaked on a silicon wafer to form the fluidic mold which consisted of individual channels for targeting each of the resonators separately. PDMS was poured on top of the mold and allowed to bake at 80°C for 2 hours. Following this the PDMS was carefully peeled off the mold to obtain the PDMS fluidic layer. Holes were punched into the fluidic reservoirs and then the PDMS layer was plasma cleaned for a few seconds along with the chip. The PDMS was then bonded irreversibly to the chip with the channels running orthogonal to the waveguide, with each channel aligned to one of the side resonators along the waveguide (Fig. 4(a)). Precise alignment of the channels with the resonators during bonding was ensured by using a modified overhead optical microscope setup. The bonded chip was left in an oven at 80°C for 10 hours to increase the bonding strength between the fluidic layer and the substrate. Fluids were flown through the channels using a digital pneumatic manifold setup (Fluidigm Corp). Figure 4(b) shows an SEM image of the NOSA.
Figure 4.
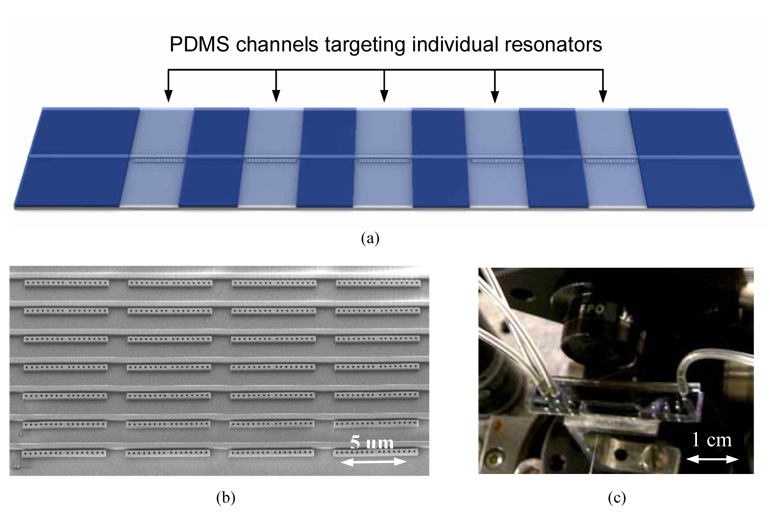
(a) 3D schematic showing a PDMS channel running across the side resonator. This channel allows the fluidic targeting of individual sensing sites (b) SEM of a NOSA device. It illustrates how this architecture is capable of two dimensional multiplexing, thus affording a large degree of parallelism. (c) Actual NOSA chip with an aligned PDMS fluidic layer on top.
We used an Ando AQ4321D Tunable Laser Source, which is tunable across the 1520nm to 1620nm spectrum. A lensed fiber is used to couple light from the laser into the chip. The fiber is clamped onto a three axis stage so that it can be positioned precisely for coupling light into the waveguides. The chip is mounted on another 3-axis stage. At the output end of the waveguide a lens is used to collect and collimate the output light from the waveguide into a photodetector. The output end of the waveguide is laterally shifted from the input end by 2mm to prevent directly scattered light from the input end reaching the detector. A polarizer is placed between the lens and the detector to select only the TE component of light emerging from the waveguide. Figure 4(c) shows the NOSA chip with a bonded PDMS fluidic layer.
4. Experimental results
A typical output spectrum of a waveguide with five resonators of differing sizes is shown in Fig. 5. In this case all five resonators had water as the surrounding medium. As can be seen, each resonator contributes a sharp dip to the output spectrum of the device. We observe that each 1D resonator possesses a large Q-factor varying from 1500 to 3000 and a full width at half maxima of less than a nanometer. This is important for two reasons. Firstly, higher Q-factors make it easier to detect very small shifts in the resonances. Equally as important however, is that as the peaks get narrower it allows us to pack the output spectrum with a larger number of closely spaced dips and thus allows us to multiplex a larger number of resonators onto a single waveguide. Given the operational range of a standard 1550nm tunable laser (such as the one used here) and the linewidth of the observed resonances, we expect that 50 such side resonators could be incorporated on a single waveguide allowing us to perform as many as 50 detections in parallel on a single waveguide. In addition, as mentioned before, the Q-factors of these resonators can be significantly enhanced by optimizing the device geometry to allow an even larger degree of multiplexing.
Figure 5.
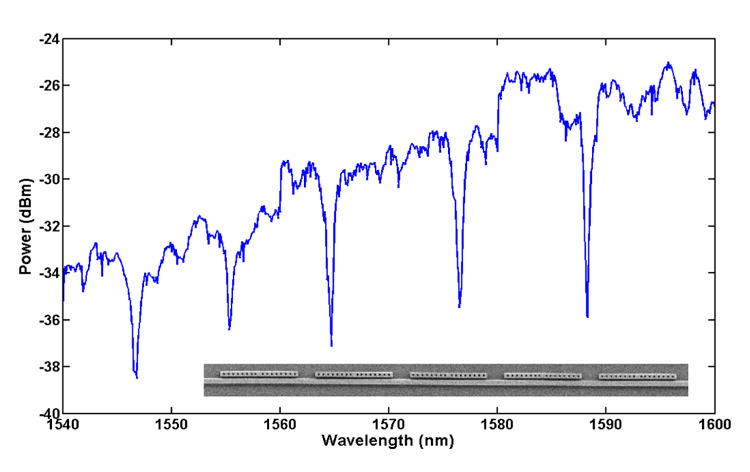
Output spectrum of a NOSA device consisting of five side-resonators as shown in the inset. Each dip in the spectrum is unique to one of the five resonators.
To investigate the RI sensitivity of the device we performed an experiment wherein one of the resonators was targeted by a fluidic channel which was initially filled with water. When a higher refractive index solution of Calcium Chloride is passed through the channel it changes the resonance condition of the resonator and pushes its unique resonant dip towards the red end of the spectrum as shown in Fig. 6(a). It is important to note that the other peaks are unaffected. In this way one can confirm positive binding events occurring at any one of the resonators since only their corresponding resonances would show a shift in the output spectrum. Resonators with no binding occurring will show no shift in their output resonance. The RI sensitivity of the NOSA devices was characterized by flowing fluids of different refractive indices through a channel targeting a particular resonator. We used deionized (DI) water as well as various concentrations of Calcium Chloride solution. The molar concentration of the CaCl2 solutions varied from 1M to 5M. The refractive indices of all the liquids were initially measured using a commercial refractometer.
Figure 6.
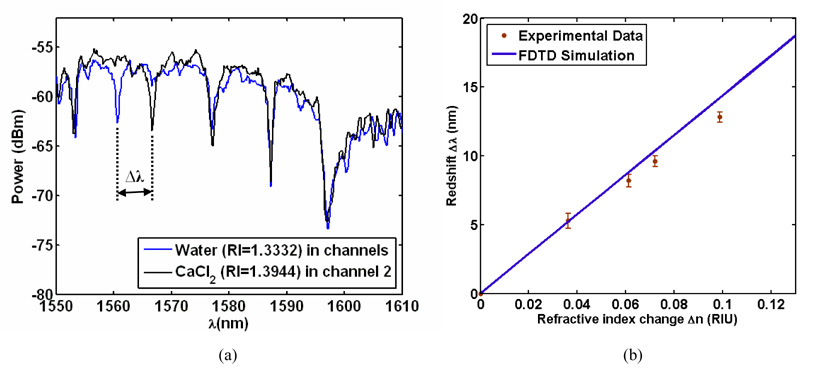
(a) Output spectrum for a NOSA where one of the 5 resonators is fluidically targeted, first with water and then with a CaCl2 solution. The resonance of the targeted resonator shifts towards the red end of the spectrum due to the higher refractive index of the CaCl2 solution. (b) Experimental data (with error bars indicating inter-device variability) showing the redshifts for various refractive index solutions. The blue line is the theoretically predicted redshift from FDTD simulations. The experimental data is in excellent agreement with the theory.
Figure 6(b) shows a plot of the shift in the resonant peak as a function of the change in refractive index of the fluid flowing through the channels. We observe an excellent match between the experimental data and the theoretically predicted redshifts. The slight discrepancy between the experimentally observed redshifts and those predicted by theory can possibly be attributed to optical losses in the waveguides and resonators arising due to surface roughness at their walls. The device exhibits a bulk refractive index sensitivity of over 130 nm for a unit shift in refractive index. Assuming a spectral resolution of 10 picometers we estimate the bulk refractive index detection limit of this device to be approximately 7×10⁻⁵. Thus, while the refractive index limit of detection of this device is not as good as techniques like SPR, the ability to drastically confine the detection volume by targeting the holes (especially the innermost holes as shown in the theoretical simulations) allows us to lower the mass limit of detection.
5. Conclusions
In this paper a new biosensor platform, which we refer to as nanoscale optofluidic sensor arrays, has been demonstrated and characterized. These devices comprise of a waveguide with a series of evanescently coupled “side resonators”. A change in the refractive index of the near field region surrounding the optical cavity results in a shift in the resonant wavelength. We have characterized the sensitivity of this device and shown agreement between experimental results and theory. Our results suggest a bulk refractive index resolution of 7×10⁻⁵ which translates to a mass limit of detection of approximately 35 ag. While the Q-factors of the devices were demonstrated to be around 3000, they could be enhanced by optimizing the device geometry thus providing room for increasing the multiplexing capabilities of this architecture.
Acknowledgements
This work was supported by the Nanobiotechnology Center (NBTC), an STC Program of the National Science Foundation under Agreement No. ECS-9876771. Additional support for this work was provided by the National Institutes of Health - National Institute of Biomedical Imaging and Bioengineering (NIH-NIBIB) under grant number R21EB007031 and the Defense Advanced Research Projects Agency Microsystems Technology Office (DARPAMTO) Young Faculty Award Program. We would also like to acknowledge Brad Schmidt and Michal Lipson for helpful discussions.
Footnotes
OCIS codes: (130.3120) Integrated optics devices; (230.7370) Waveguides; (280.4788) Optical sensing and sensors; (050.5298) Photonic crystals.
References and Links
- 1.Erickson D, Mandal S, Yang A, Cordovez B. Nanobiosensors: optofluidic, electrical and mechanical approaches to biomolecular detection at the nanoscale. Microfluidics and Nanofluidics. 2008;4:33–52. doi: 10.1007/s10404-007-0198-8. [DOI] [PMC free article] [PubMed] [Google Scholar]
- 2.Luff BJ, Wilkinson JS, Piehler J, Hollenbach U, Ingenhoff J, Fabricius N. Integrated optical Mach-Zehnder biosensor. J. Lightwave Technol. 1998;16:583–592. [Google Scholar]
- 3.Ymeti A, Greve J, Lambeck PV, Wink T, van Hovell S, Beumer TAM, Wijn RR, Heideman RG, Subramaniam V, Kanger JS. Fast, ultrasensitive virus detection using a young interferometer sensor. Nano Lett. 2007;7:394–397. doi: 10.1021/nl062595n. [DOI] [PubMed] [Google Scholar]
- 4.Matsko AB, Ilchenko VS. Optical resonators with whispering-gallery modes - Part I: Basics. IEEE J. Sel. Top. Quantum Electron. 2006;12:3–14. [Google Scholar]
- 5.Armani AM, Vahala KJ. Heavy water detection using ultra-high-Q microcavities. Opt. Lett. 2006;31:1896–1898. doi: 10.1364/ol.31.001896. [DOI] [PubMed] [Google Scholar]
- 6.Vollmer F, Braun D, Libchaber A, Khoshsima M, Teraoka I, Arnold S. Protein detection by optical shift of a resonant microcavity. Appl. Phys. Lett. 2002;80:4057–4059. [Google Scholar]
- 7.Armani AM, Kulkarni RP, Fraser SE, Flagan RC, Vahala KJ. Label-Free, Single-Molecule Detection with Optical Microcavities. Science. 2007;317:783–787. doi: 10.1126/science.1145002. [DOI] [PubMed] [Google Scholar]
- 8.Karlsson R. SPR for molecular interaction analysis: a review of emerging application areas. Journal of Molecular Recognition. 2004;17:151–161. doi: 10.1002/jmr.660. [DOI] [PubMed] [Google Scholar]
- 9.Lee MR, Fauchet PM. Two-dimensional silicon photonic crystal based biosensing platform for protein detection. Opt. Express. 2007;15:4530–4535. doi: 10.1364/oe.15.004530. [DOI] [PubMed] [Google Scholar]
- 10.Skivesen N, Tetu A, Kristensen M, Kjems J, Frandsen LH, Borel PI. Photonic-crystal waveguide biosensor. Opt. Express. 2007;15:3169–3176. doi: 10.1364/oe.15.003169. [DOI] [PubMed] [Google Scholar]
- 11.Joannopoulos JD, Meade RD, Winn JW. Photonic Crystals: Molding the Flow of Light. Princeton, New Jersey: Princeton University Press; 1995. [Google Scholar]
- 12.Foresi JS, Villeneuve PR, Ferrera J, Thoen ER, Steinmeyer G, Fan S, Joannopoulos JD, Kimerling LC, Smith HI, Ippen EP. Photonic-bandgap microcavities in optical waveguides. Nature. 1997;390:143–145. [Google Scholar]
- 13.Schmidt B, Almeida V, Manolatou C, Preble S, Lipson M. Nanocavity in a silicon waveguide for ultrasensitive nanoparticle detection. Appl. Phys. Lett. 2004;85:4854–4856. [Google Scholar]
- 14.Monat C, Domachuk P, Eggleton BJ. Integrated optofluidics: A new river of light. Nature Photonics. 2007;1:106–114. [Google Scholar]
- 15.Psaltis D, Quake SR, Yang CH. Developing optofluidic technology through the fusion of microfluidics and optics. Nature. 2006;442:381–386. doi: 10.1038/nature05060. [DOI] [PubMed] [Google Scholar]
- 16.Almeida VR, Barrios CA, Panepucci RR, Lipson M. All-optical control of light on a silicon chip. Nature. 2004;431:1081–1084. doi: 10.1038/nature02921. [DOI] [PubMed] [Google Scholar]
- 17.Velha P, Rodier JC, Lalanne P, Hugonin JP, Peyrade D, Picard E, Charvolin T, Hadji E. Ultracompact silicon-on-insulator ridge-waveguide mirrors with high reflectance. Appl. Phys. Lett. 2006;89:171121–171123. [Google Scholar]
- 18.Elhadj S, Singh G, Saraf RF. Optical Properties of an Immobilized DNA Monolayer from 255 to 700 nm. Langmuir. 2004;20:5539–5543. doi: 10.1021/la049653+. [DOI] [PubMed] [Google Scholar]
- 19.Almeida VR, Panepucci RR, Lipson M. Nanotaper for compact mode conversion. Opt. Lett. 2003;28:1302–1304. doi: 10.1364/ol.28.001302. [DOI] [PubMed] [Google Scholar]
- 20.Quake SR, Scherer A. From micro- to nanofabrication with soft materials. Science. 2000;290:1536–1540. doi: 10.1126/science.290.5496.1536. [DOI] [PubMed] [Google Scholar]


