

Abstract
Eosinophils and mast cells participate in the immune response against Helicobacter pylori, but their involvement in the gastric precancerous process is unclear. This study aimed to estimate eosinophil and mast cell density in antral mucosa in subjects from two Colombian populations with contrasting gastric cancer risks. Gastric mucosa biopsies were collected from 117 adult males (72 from a high-risk area and 45 from a low-risk area). A histopathology score was used to quantify severity of the lesions. Quantitation of eosinophils in hematoxylin-eosin stained sections and mast cells in immunostained sections for CD117/c-Kit was performed. Helicobacter pylori infection and genotyping were assessed in Steiner stain and PCR, respectively. Logistic regression models and semi-parametric cubic smoothing splines were used for analysis of the results. Eosinophil density was significantly higher in subjects from the low-risk area compared with subjects from the high-risk area. In both populations, eosinophil density increased with the histopathology score in the progression of lesions from normal morphology to multifocal atrophic gastritis. Intestinal metaplasia and dysplasia specimens showed further increase in eosinophil density in the high-risk area, but an abrupt decrease in the low-risk area. Mast cell density increased in parallel to the histopathology score in both populations. Our results suggest that eosinophils play a dual role in chronic gastritis. In the low-risk area, elevated eosinophil density represents a Th2-biased response that may downregulate the effects of proinflammatory cytokines preventing cancer development. In contrast, in the high-risk area, eosinophils might promote a Th1-type response leading to progression of precancerous lesions.
Keywords: Eosinophils, Helicobacter pylori, mast cells, gastritis, T-helper response, gastric carcinogenesis
Introduction
Eosinophils and mast cells (MC), classically recognized for their roles in allergic reactions and parasitic infections, are being increasingly studied in a wide range of processes including fibrotic response, angiogenesis, and malignant disorders (1-4). In the normal gastric mucosa, a small number of eosinophils and MC have been described in the lamina propria (5-7). Both cell types are increased in Helicobacter pylori (H. pylori)-induced gastritis (8,9). H. pylori infection, recognized by the International Agency for Research on Cancer as a class I carcinogen (10), affects approximately one half of the world population. However, only a very small fraction of subjects develops cancer of the stomach. The accepted model for development of H. pylori-induced gastric adenocarcinoma (11) consists of the following sequential precancerous changes: non-atrophic chronic active gastritis (NAG), multifocal atrophic gastritis without intestinal metaplasia (MAG), intestinal metaplasia (IM), and dysplasia. These changes take place over decades of H. pylori infection.
Incidence rates of gastric cancer vary considerably among populations. In Colombia, we have previously identified two populations in the Southwestern region that display contrasting risks of gastric cancer. In a study conducted from 1972 to 1974, the age-adjusted incidence rate for the high-altitude area in the Andes Mountains was estimated to be 150 cases per 100,000 inhabitants, and the rate for the coastal areas was 6 cases per 100,000 (12). Recent observations indicate that these differences persist. Although H. pylori infection rates are similarly elevated in both populations from childhood (13), multiple genetic and environmental factors are dissimilar in these two populations. In a previous study, we found a significantly higher prevalence of intestinal parasitic infections in subjects residing in the area at low-risk for gastric cancer (the Pacific coast) compared to residents of the high-risk mountainous area (14).
Based on differential exposure to parasitic infections in these populations, we hypothesize that eosinophils and MC may be key modulators of the inflammatory response to H. pylori in the gastric mucosa and may determine the outcome. This study aimed to assess the density of eosinophils and MC in the antral gastric mucosa in patients with dyspeptic symptoms from the aforementioned populations.
Materials and methods
Study Population
The study included 117 male adults between 40 and 59 years old with dyspeptic symptoms, who underwent upper gastrointestinal tract endoscopy between 1999 and 2003, and provided informed consent. Selection of gender and age for this study was based on our previous experience showing a higher prevalence of advanced gastric precancerous lesions in these demographic groups. Exclusion criteria were previous gastrectomy and concomitant major diseases. The protocol was approved by the Universidad del Valle Ethics Committee. Seventy-two of the subjects were residents of the high-risk area for gastric cancer and 45 were from the low-risk area. The high-risk area, in the Andean region, includes the towns of Pasto and Tuquerres, located 2800−3000 m above sea level. Its inhabitants are of Spanish-Amerindian ethnicity (mestizos) and have an agriculture-based economy. The diet is predominantly based on starch-rich vegetables, such as potatoes, and the consumption of salt tends to be high. In the low-risk area of Tumaco, at sea level, the population is of Spanish-African ancestry (mulattos), the economy is based on fishing, and the diet on seafood. These populations are about 230 Km apart. During endoscopy, performed by either of two experienced gastroenterologists, three biopsy specimens were obtained from antrum, incisura angularis and corpus. Information about demographics and smoking was collected.
Histochemistry and immunohistochemistry
Gastric mucosa biopsies were fixed in buffered formalin and embedded in paraffin. Four-micron-thick sections were cut and mounted on ProbeOn-Plus slides (Fisher Scientific, US) for histochemistry and immunohistochemistry. Hematoxylin and eosin (HE) and modified Steiner silver stainings were performed for histopathology and assessment of H. pylori infection, respectively. Eosin-Y, a well-known marker of eosinophils, was used as counterstain in HE preparations. Immunohistochemistry with polyclonal antibody against CD117/c-Kit (Biocare Medical, Concord, CA) was done for identification of MC in antral mucosa biopsies. Briefly, after overnight heating at 37°C, the sections were deparaffinized in xylene and rehydrated in graded alcohols. Endogenous peroxidase was blocked by adding hydrogen peroxide solution (3%) for 15 min at room temperature (RT). Pretreatment was performed by boiling tissue sections at 100°C for 20 min in Reveal (Biocare Medical, Concord, CA). The slides were arranged in pairs and incubated with the primary antibody (at 1:200 dilution) using capillary action for 60 min at RT in a humid chamber. After washing, incubation with biotinylated secondary antibody was performed for 30 min at RT. Sections were rinsed and incubated with streptavidin–HRP (Biocare Medical, Concord, CA, US) for 30 min at RT. Diaminobenzidine (Sigma-Aldrich, St Louis, MO) was used as a chromogen, and the tissues were counterstained with hematoxylin. Negative controls were performed by omitting the primary antibody.
Histopathology
For all the analyses, slides were coded and the pathologists were unaware of the area of residence of the subjects and the H. pylori genotyping results.
Diagnostic score
Histopathological diagnosis was assessed independently by two pathologists (PC and MBP) following published guidelines (5,15). Diagnostic categories were: 0: normal; 1: mild or superficial NAG (mild to moderate inflammatory infiltrate of any depth, or marked infiltrate within the superficial half of the corpus or antral mucosa), 2: severe and diffuse antral NAG (marked infiltrate across the total thickness of the antral mucosa), 3: MAG, 4: IM, and 5: dysplasia. Cases with any discordance were reviewed using a double-head microscope and a consensus was reached. In addition, to assess the heterogeneity of the precancerous lesions, a previously created histopathology score (16) was applied, as follows: the MAG score was modified adding the following values according to the degree of atrophy: mild: 0.50, moderate: 0.75, and severe: 1.0. The IM score was modified according to the type and extension of the metaplasia. IM type was classified into four categories: complete: 0.1, mixed predominantly complete: 0.2, mixed predominantly incomplete: 0.3, and incomplete (colonic): 0.4. For each patient, the average extension of the IM was calculated. Average values were grouped by tertiles derived from the overall distribution. Each tertile was given a value: 0.2, 0.4, or 0.6, respectively. The total score of IM was obtained adding the values for type and extension to the original score for IM. For dysplasia, the following values were added to the initial score according to the grade of the lesion: indefinite: 0.25, low grade: 0.50, and high grade: 0.75.
Polymorphonuclear neutrophils (PMN), mononuclear cells (MN) and H. pylori density
A semiquantitative 0 to 3 scale (absent or normal, mild, moderate, and marked) was applied for assessment of PMN, MN, and H. pylori density according to the updated Sydney System (5). Although inflammatory scores were separately evaluated in antral and corpus mucosa by both pathologists (PC and MBP), this report refers to assessment of the lesions in the antrum, because it was the predominant site of inflammation. H. pylori density was assessed in Steiner silver stain and the highest score obtained from the three biopsy samples was recorded for each subject.
Eosinophils and MC
One pathologist (MBP) evaluated the antral eosinophil infiltration in HE-stained slides using 3 different methods: first, a subjective evaluation of the presence of eosinophils in the entire histologic section, based on a semiquantitative score from 0 to 3, similar to that proposed by Dixon et al (5). Second, eosinophils were counted in 5 high power fields (HPF, 400x) and the average was calculated. Due to the uneven distribution of the infiltration, the areas with the highest concentration of eosinophils were selected. Third, eosinophil density was evaluated by counting eosinophils in the mucosa of the entire histologic section and measuring the area. Since the muscularis mucosae did not show significant eosinophil infiltration, it was not evaluated. For evaluation of antral MC density, CD117-immunoreactive cells were counted separately in the muscularis mucosae, as well as the rest of the mucosa (lamina propria and epithelium) of the entire histologic section. Both areas were individually measured. For all measurements, only cells with an identifiable portion of the nucleus were included. Because eosinophils and MC were rarely observed in lymphoid aggregates, these areas were excluded.
To assess the reliability of the data, we evaluated intra- and interobserver variation in both, eosinophil and mast cell density. A randomly selected sample including 30% of the subjects from each area was blindly re-evaluated by the same pathologist (MBP) who evaluated the overall set of biopsy specimens and by a second pathologist (HC), also in a blinded fashion. Eosinophil and MC density values were described as number of cells per mm2. Morphometric analyses were conducted in part using Metamorph Offline software (Molecular Devices, Downingtown, PA).
H. pylori genotyping
Molecular analyses for detection and genotyping of H. pylori were assessed using DNA obtained from paraffin-embedded tissues. Separate PCR reactions were performed for 16S rRNA and for the virulence-associated genes cagA and vacA (s and m regions). Discrimination of all genotypes was performed on agarose gels (17).
Statistical analysis
For continuous and categorical variables, respectively, univariate t-tests and chi-square tests were conducted to determine the statistical significance of any differences in the distribution of demographic and histopathological variables between groups. Fisher's exact test was used for categorical comparisons as appropriate. Because the continuous variables eosinophils/HPF, eosinophils/mm2, and MC/mm2 were not normally distributed, non-parametric Wilcoxon rank-sum tests were used to compare medians between groups.
To assess how well the semi-quantitative score and mean value of eosinophils/HPF represent the gold standard (eosinophils/mm2), receiver operating characteristic curves were estimated directly by an extended trapezoidal rule and by a non-parametric method analogous to the Wilcoxon/Mann-Whitney test (18). A confidence interval was constructed using DeLong's variance estimate (19). The semi-quantitative score and mean value of eosinophils/HPF were not included in further analyses. To evaluate the non-linear relationship between the cell densities (eosinophils and MC per mm2) and the histopathological score (as a continuous variable), graphs were generated using additive models with smooth cubic splines.
Using advanced gastric lesions (IM and dysplasia) as the outcome, and less advanced lesions (NAG and MAG) as the referent, logistic regression models were used to estimate odds ratios (OR) and 95% confidence intervals (95% CI). Independent factors in this comparison were eosinophil and MC density. Since these variables are continuous, the ORs represent a change in the estimated odds of the presence of IM and dysplasia when the continuous variable (number of eosinophils or MCs per mm2) increases by one cell. For a better understanding, we estimated ORs for the values of eosinophils and MCs in the 5th, 10th, 25th, 50th, 75th, 90th and 95th percentiles, derived from the overall distribution of eosinophil and MC density. The reference category was the 5th percentile. Potential confounding factors considered in the analysis included age, geographic area, smoking, H. pylori genotype, and PMN and MN scores. Interaction effects among geographic areas and number of eosinophils and MC were also tested.
The sample size for the kappa-statistic measure of intra- and interobserver agreement was calculated using the statistical software Stata. The estimation was based on two unique raters evaluating a binary event (medians were used as cutoffs). The assumed values were as follows: expected kappa =0.5, p1 (percent higher than the median for the first observer) = 0.5, p2 (percent higher than the median for the second observer) = 0.4, and absolute precision = 0.3. The estimated sample size was 31 subjects, however, it was increased to 36 subjects (30%), allowing for a margin of error in the estimation. It included 14 subjects from the low-risk area and 22 from the high-risk area. All analyses were performed by using SPSS 14.0 (SPSS Inc., Chicago, IL) and Stata 9.0 (Stata Corporation, College Station, TX).
Results
Of the 117 participants, 6 subjects had normal gastric histology, 48 had NAG, 21 had MAG, 38 had IM, and 4 had dysplasia (corresponding to the category “indefinite for dysplasia”). Selected variables according to gastric cancer risk area are shown in Table 1. No significant differences were observed between the two areas for age, histopathological diagnosis, status or density of H. pylori infection, or PMN and MN scores. Overall, H. pylori was detected in 90.6% and 91.5% of the subjects in Steiner-stained sections and by PCR, respectively. The proportion of individuals carrying more virulent H. pylori strains (cagA-positive vacA s1m1) and the proportion of subjects that smoked were significantly greater in the high-risk area. Among smokers, the median consumption was 4 cigarettes per day in both areas.
Table 1.
Characteristics of the subjects according to the gastric cancer risk area
| Variables | Gastric cancer risk area |
Two-sided p value | |
|---|---|---|---|
| Low-risk n=45 |
High-risk n=72 |
||
| Age in years, mean(SD) | 49.0(5.3) | 47.3(5.4) | 0.122 |
| Polymorphonuclear score in antruma, mean(SD) | 1.6(0.7) | 1.7(0.6) | 0.615 |
| Mononuclear score in antruma, mean(SD) | 2.0(0.4) | 2.2(0.5) | 0.172 |
| Histopathological diagnosis, n(%) | |||
| Normal and NAG | 19(42.2) | 35(48.6) | 0.149 |
| MAG | 12(26.7) | 9(12.5) | |
| IM and dysplasia | 14(31.1) | 28(38.9) | |
| H. pylori infection (based on Steiner stain), n(%) | 42(93.3) | 64(88.9) | 0.527 |
| H. pylori density (based on Steiner stain), n(%) | |||
| Mild | 5(11.9) | 3(4.7) | 0.402 |
| Moderate | 4(9.5) | 7(10.9) | |
| Marked | 33(78.6) | 54(84.4) | |
| H. pylori infection (based on PCR), n(%) | 42(93.3) | 65(90.3) | 0.739 |
| H. pylori genotypes, n(%) | |||
| cagA positive vacA s1m1b | 26(61.9) | 50(79.4) | 0.050 |
| Other | 16(38.1) | 13(20.6) | |
| Smoking statusc, n(%) | |||
| Non-smoker | 33(73.3) | 34(51.5) | 0.021 |
| Current-smoker/ex-smoker | 12(26.7) | 32(48.5) | |
Abbreviations: SD: standard deviation; NAG: non-atrophic gastritis; MAG: multifocal atrophic gastritis without metaplasia; IM: intestinal metaplasia; PCR: polymerase chain reaction
Cases with normal histology were not included.
This category includes s1m1 + s1 and m1/m2 + s1/s2 and m1
Eight percent of missing values in high gastric cancer risk area.
In subjects with normal histology, occasional eosinophils were observed in the lamina propria in the corpus and antral mucosa. In persons with antral gastritis, eosinophils showed great variability in number and distribution. In some subjects with atrophy, eosinophils were increased in areas of the lamina propria where mesenchymal tissue replaced glandular tissue or surrounding epithelium with IM. Occasionally, eosinophils were observed in the lumen of vascular structures and adjacent stroma (Figure 1). Degranulated eosinophils were observed with some frequency, but were not counted separately. In normal antral mucosa, MC were scattered within the lamina propria. In subjects with antral gastritis, MC were increased in numbers, especially in areas with atrophy and near the muscularis mucosae (Figure 2). Some subjects displayed increased MC density in the vicinity of lymphoid aggregates and/or within the muscularis mucosae.
Figure 1.
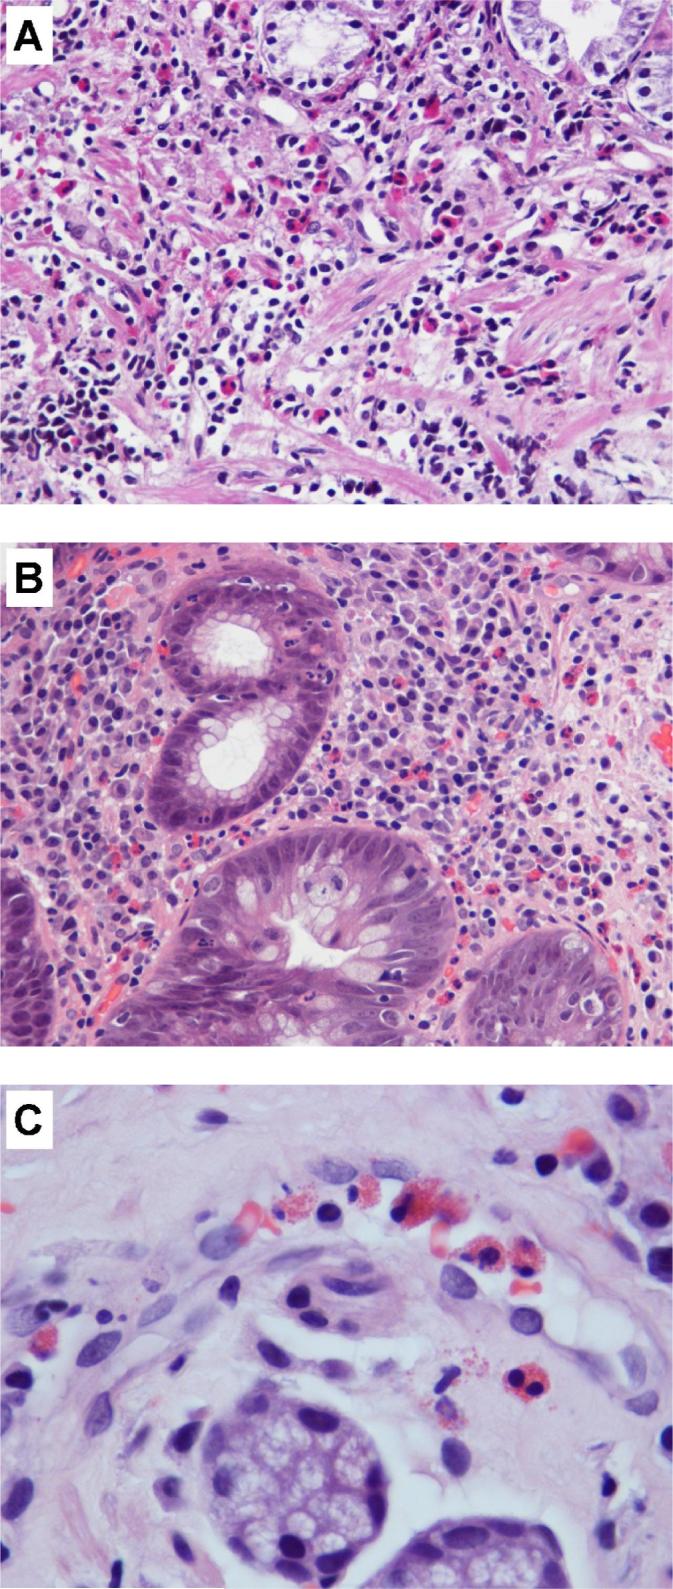
Eosinophil infiltrate in antral gastric mucosa of subjects from the low-risk area (HE-stained sections). (A and B) Increase in eosinophil density in lamina propria in (A) MAG, focus with loss of glandular structures and proliferation of mesenchymal tissue, and (B) IM. (C) Eosinophils in the lumen of a blood vessel and surrounding lamina propria. (A and B: × 400; C: × 1000)
Figure 2.

Immunohistochemical staining for mast cells (CD117/c-Kit). (A) Cell membranes are strongly stained. (B) Normal antral mucosa displaying scattered mast cells in lamina propria (arrows). (C and D) MAG: areas with loss of glands showing increased mast cell density. (A: × 1000; B and D: × 400; C: × 200)
Results of eosinophil and MC quantitation are displayed in Table 2. In the low-risk area, semiquantitative analysis demonstrated that 60% of the subjects exhibited moderate or marked infiltration of eosinophils, in contrast to 24% of subjects in the high-risk area. Similarly, median values of eosinophils were significantly higher in the low-risk area than in the high-risk area. MC density did not differ significantly between geographic areas either in the mucosa or in the muscularis mucosae.
Table 2.
Eosinophil and mast cell quantification in antral gastric mucosa according to the gastric cancer risk area
| Gastric cancer risk area |
Two-sided p value | ||
|---|---|---|---|
| Cell type and quantification method | Low-risk | High-risk | |
| EOSINOPHIL INFILTRATEa | n=45 | n=72 | |
| Semiquantitative score, n(%) | |||
| 0 (normal) | 8(17.8) | 29(40.3) | 0.001 |
| 1 (mild) | 10(22.2) | 26(36.1) | |
| 2 (moderate) | 11(24.4) | 10(13.9) | |
| 3 (marked) | 16(35.6) | 7(9.7) | |
| Eosinophils/HPF | |||
| Median | 24.1 | 7.3 | <0.001 |
| Minimum and maximum values | 1.2 − 73.4 | 0.4 − 51.4 | |
| IQR | 10.0 − 35.6 | 2.9 − 14.5 | |
| Eosinophils/mm2 | |||
| Median | 63.5 | 24.0 | <0.001 |
| Minimum and maximum values | 3.4 − 239.2 | 0.8 − 184.1 | |
| IQR | 32.2 − 105.8 | 10.5 − 58.7 | |
| MAST CELL INFILTRATE | n=40 | n=63 | |
| Mast cells/mm2 (excluding muscularis mucosae) | |||
| Median | 79.2 | 78.1 | 0.968 |
| Minimum and maximum values | 27.0 − 212.4 | 8.2 − 225.5 | |
| IQR | 54.2 − 99.4 | 51.5 − 111.6 | |
| Mast cells/mm2 (muscularis mucosae) | |||
| Median | 97.4 | 73.1 | 0.141 |
| Minimum and maximum values | 28.6 − 247.8 | 27 − 192.0 | |
| IQR | 72.7 − 120.6 | 60.1 − 106.6 | |
Abbreviations: HPF: high power field (400x); IQR: interquartile range.
Muscularis mucosae not included
Using the eosinophil density as the gold standard, the area under the curve for the semiquantitative score was 0.95 (95% CI, 0.92−0.99), while the mean number of eosinophils/HPF had an area under the curve of 0.98 (95% CI, 0.96−1.0). Table 3 shows the median values of eosinophils/mm2 according to histopathological diagnosis by risk area. Intra- and interobserver variations in eosinophil density were evaluated and satisfactory results were observed (kappa values: 0.83 and 0.62, respectively). Intra- and interobserver variations in mast cell density were evaluated and acceptable results were obtained (kappa values: 0.71 and 0.61, respectively). Graphs based on smooth regression models were created to better represent the observed trends (Figures 3 and 4). The curves indicate that the relationship between eosinophil density and histopathology score varied by geographic area (Figure 3). In both areas, the eosinophil density increased with the histopathology score from normal mucosa to severe MAG (score 4). In subjects with histopathology scores greater than 4, corresponding to IM and dysplasia, the eosinophil density decreased sharply in the low-risk area (Figure 3A), yet increased in the high-risk area (Figure 3B). Figure 4 indicates a linear association between MC density and the histopathology score for the total set of subjects. Analysis stratified by area showed a similar trend.
Table 3.
Eosinophil density according to histopathological diagnosis by gastric cancer risk area
| Gastric cancer risk area |
|||||
|---|---|---|---|---|---|
| Histopathological diagnosis | Histopathology score (Minimum and maximum values) | Low-risk |
High-risk |
||
| n | Median (IQR) (eosinophils/mm2) | n | Median (IQR) (eosinophils/mm2) | ||
| Normal | 0 | 1 | 6.19a | 5 | 3.35(2.6 − 3.4) |
| NAG | 1−2 | 18 | 48.2 (20.3 − 85.6) | 30 | 16.1 (6.8 − 41.1) |
| MAG | 3.5 − 4.0 | 12 | 121.5 (44.7 − 150.7) | 9 | 22.4 (18.1 − 59.9) |
| IM | 4.3 − 4.8 | 12 | 71.6 (55.2 − 89.1) | 26 | 36.3 (16.1 − 75.9) |
| Dysplasia | 5.25 | 2 | 52.6 (11.0 − 94.3) | 2 | 74.9 (18.8 − 131.0) |
This value is not a median, it is the eosinophil density of the only case in that category.
Abbreviations: NAG: non-atrophic gastritis; MAG: multifocal atrophic gastritis without metaplasia; IM: intestinal metaplasia; IQR: interquartile range.
Figure 3.

3. Relationship between eosinophil density and histopathology score by geographic area. The solid lines represent the smooth regression line fit, while the broken lines represent the limits of 95% confidence intervals provided by the model. (A) Low-risk area. (B) High-risk area.
Figure 4.

Relationship between mast cell density and histopathology score in the total set of subjects. The solid line represents the smooth regression line fit, while the broken lines represent the limits of 95% confidence intervals provided by the model.
Tables 4 and 5 show the ORs for advanced gastric lesions (IM and dysplasia) according to selected percentiles of the eosinophil and MC densities, respectively. ORs were adjusted for H. pylori genotype, which was the main confounder. Because a significant interaction between risk area and the eosinophil density was observed, ORs were separately estimated according to geographic area. In the low-risk area, as the density of eosinophils increased, the ORs for advanced gastric lesions decreased. In contrast, in the high-risk area, as the density of eosinophils increased, the ORs also increased. No interaction between geographic area and MC density was detected; therefore, a main effects model is presented. Because variables such as age, smoking, and scores of PMN and MN were not significantly associated with the presence of advanced lesions and did not influence the magnitude of the effect estimates, they were not included in the final models.
Table 4.
Odds ratios (OR) and 95% confidence intervals (CI) for advanced gastric lesions (IM and dysplasia) according to selected percentiles of the eosinophil density by gastric cancer risk area
| OR (95% CI)a |
|||
|---|---|---|---|
| Percentiles | Eosinophils/mm2 | Low-risk area | High-risk area |
| 5th | 2.4 | 1.0 | 1.0 |
| 10th | 3.9 | 0.99 (0.96 − 1.02) | 1.03 (0.96 −1.10) |
| 25th | 11.9 | 0.94 (0.92 − 0.97) | 1.16 (1.09 − 1.25) |
| 50th | 35.7 | 0.81 (0.78 − 0.83) | 1.71 (1.60 − 1.83) |
| 75th | 77.7 | 0.61 (0.60 − 0.63) | 3.36 (3.14 − 3.60) |
| 90th | 110.7 | 0.50 (0.48 − 0.51) | 5.72 (5.34 − 6.12) |
| 95th | 144.7 | 0.40 (0.39 − 0.41) | 9.89 (9.25 − 10.6) |
Odds ratios adjusted for H. pylori genotypes.
Table 5.
Odds ratios (OR) and 95% confidence intervals (CI) for advanced gastric lesions (IM and dysplasia) according to selected percentiles of the mast cell density
| Percentiles | Mast cells/mm2 | OR (95% CI)a |
|---|---|---|
| 5th | 29.5 | 1.0 |
| 10th | 35.7 | 1.10 (1.07 − 1.12) |
| 25th | 53.2 | 1.42 (1.39 − 1.45) |
| 50th | 78.5 | 2.06 (2.02 − 2.11) |
| 75th | 99.5 | 2.81 (2.75 − 2.87) |
| 90th | 146.3 | 5.62 (5.50 − 5.75) |
| 95th | 193.3 | 11.26 (11.02 − 11.51) |
Odds ratios adjusted for H. pylori genotypes.
Discussion
The main finding of this study is that there is a marked difference in the eosinophil density in the antral gastric mucosa between men from two populations with contrasting gastric cancer risks. Higher eosinophil density was observed in individuals residing in the low-risk area compared with subjects residing in the high-risk area. Although in both populations the eosinophil density increased gradually from normal mucosa to MAG, subjects from the low-risk area with MAG displayed numbers of eosinophils that were nearly six times higher than those from the high-risk area in the same diagnostic category. This is an interesting finding because MAG is considered to be the last reversible step in the gastric precancerous cascade (20). More advanced preneoplastic lesions (IM and dysplasia) were accompanied by an additional increase in eosinophil density in the high-risk area, but an abrupt decrease in the low-risk area. Our observations suggest that eosinophils may be playing different roles in these populations.
Because infection with H. pylori is the main recognized etiologic factor for gastric cancer, the host-bacterium interaction in the gastric mucosa and the characteristics of the inflammatory response are important factors in dictating the outcome. In general, H. pylori infection induces a Th1 immune response (21). However, some evidence shows a mixed Th1-Th2 profile (22). Th1 lymphocytes secrete interleukin (IL)-12 and interferon-gamma, and stimulate type 1 immunity, characterized by intense phagocytic activity and associated with increased and prolonged inflammation. Conversely, Th2 cells produce cytokines that downregulate inflammatory processes (IL-4, IL-5, IL-6, IL-10, and transforming growth factor-β), and induce B-cell activation. Eosinophils produce cytokines associated with a Th2 response; however, they may also be inducers of Th1-type response (1). In subjects from the low-risk area, the elevated eosinophil density observed in early stages of the process (NAG and MAG) may reflect a strong and prolonged anti-inflammatory Th2-type immune response to H. pylori that ameliorates the deleterious effects of the chronic inflammation and may dampen the progression to more advanced stages. In fact, a significantly lower proportion of subjects had IM in the low-risk area than in the high-risk area. In individuals from the high-risk area, a significantly lower eosinophil density was observed at early stages, but it increased progressively in more advanced lesions. In these subjects, we speculate that eosinophils may be part of either: a) a weak anti-inflammatory response at early stages, insufficient to delay the precancerous process, or b) a Th1-type response which may stimulate progression to more severe precancerous lesions and subsequently gastric cancer.
Eosinophils may regulate the functions of other cells by releasing cytokines, chemokines, cytotoxic granule proteins, and lipid mediators (1). Eotaxin-1 is a potent eosinophil chemoattractant that acts in synergy with IL-5 to stimulate the release of eosinophils from bone marrow and to recruit them into inflammatory sites, including the gastrointestinal tract (23). Genetic variants associated with differential expression of eotaxin-1 and IL-5 have been reported in some populations (24,25). It is possible that differences in the genetic backgrounds of the two studied populations may influence the recruitment of eosinophils into the gastric mucosa.
A small number of eosinophils may be present in the normal gastric mucosa (6). Preliminary data from an ongoing study performed by one of the authors of this report (HC) showed a median of 2 eosinophils/HPF in normal gastric mucosa from 114 children from New Orleans, USA. No difference between Caucasians and African-Americans was found (unpublished data). Eosinophil infiltration of the gastric mucosa is a feature of multiple disorders, including eosinophilic gastroenteritis, food allergy, inflammatory bowel disease, parasitic infections (7), and H. pylori-induced gastritis (9), among others. Eosinophilic gastritis is characterized by patchy infiltrates containing between 10 and 50 eosinophils/HPF (7). It affects mainly the antrum, and eosinophils must be the dominant cell type in the inflammatory infiltrate. In the current study, 89% of the subjects residing in the low-risk area and 75% from the high-risk area had 10 or more eosinophils/HPF in the antral mucosa. However, eosinophils were not the dominant cell type.
Individuals residing in temperate climates may be exposed to a greater variety of parasites and other infectious organisms or allergens, thus leading to increased numbers of gastrointestinal eosinophils (26). Studying subjects from the same geographic areas included in the present report, we found significantly higher rates of helminthic infections and higher IgE serum levels in subjects from the low-risk area compared to patients from the high-risk area (14). Ample evidence suggests that helminths alter immune responses beyond those directed against them. Individuals carrying helminths show immune bias away from the expected Th1-type response in certain conditions (27). In an animal model, sequential infection with Heligmosomoides polygyrus (a murine nematode) and Helicobacter felis resulted in a shift in the Th1-biased response to H. felis toward a Th2 phenotype and in reduction of gastric atrophy (28). In a Chinese population, H. pylori IgG levels and CagA seropositivity were significantly lower in subjects co-infected with Schistosoma japonicum than in subjects with H. pylori mono-infection. In addition, subjects with dual infections had less gastric atrophy in the corpus than subjects infected solely with H. pylori (29). The “hygiene hypothesis” suggests that the growing epidemic of immune-mediated diseases may result from improvements in sanitation and loss of exposure to infections, particularly during childhood (30). According to this hypothesis, parasites and microbes have been important in shaping and regulating the evolution of the immune system. A helminth-based therapy has been developed for patients with inflammatory bowel disease with favorable results (27).
Based on the current evidence and our observations in the low-risk area, we speculate that the chronic inflammatory response to H. pylori infection in the gastric mucosa is modulated by concurrent helminthiasis. Large numbers of eosinophils that bias the immune response towards a Th2 phenotype in the gastric mucosa during decades of H. pylori infection may be a determining factor limiting tissue injury over time. In contrast, observations in the high-risk area suggest that, after IM is established, eosinophils may enhance tissue damage induced by the chronic infection with H. pylori, ultimately leading to premalignant transformation. One mechanism of eosinophil-mediated damage involves its highly toxic peroxidase. Eosinophil peroxidase generates reactive brominating species which display cytotoxic and mutagenic effects (31). Considering that eosinophils may also produce cytokines associated with a Th1-type response leading to an increased and prolonged inflammation, reactive intermediates generated by neutrophils, monocytes, and macrophages might also induce DNA damage. Thus, based on the stimulus and/or the surrounding environment, eosinophils may promote or limit inflammatory processes.
MC and eosinophils participate in a complex self-perpetuating cycle. Eosinophils produce mediators responsible for MC differentiation, activation, proliferation and survival (4). In turn, activated MCs release mediators that favor eosinophil recruitment and activation, such as IL-5 and granulocyte-monocyte colony-stimulating factor (2). In H. pylori-induced gastritis, MC density is increased (8), likely due to antigens (such as vacuolating cytotoxin) that activate MC in vitro (32,33). MCs are important mediators of the immune response against Helicobacter in an animal model (34). In our study, the increase in MC density that paralleled the increase in the histopathology score in both populations may reflect the chronicity of the inflammatory process promoted by H. pylori infection. Areas of lamina propria with loss of glandular tissue showed an increased density of eosinophils and MC. Both cell types release pro-fibrogenic (i.e., transforming growth factor-β) and pro-angiogenic (i.e., vascular endothelial growth factor) factors involved in tissue remodeling leading to fibrosis in the colon and airway tissue (2,3,35). In chronically inflamed gastric mucosa, proliferation of mesenchymatous tissue may replace glandular tissue, a process likely promoted by the above mentioned factors. Angiogenesis contributes to the perpetuation of the inflammatory process by promoting the migration of inflammatory cells. We hypothesize that eosinophils and mast cells play key roles in the development of gastric atrophy and that eosinophils may also limit the progression to more advanced preneoplastic lesions under certain conditions.
The development of gastric adenocarcinoma is considered a multifactorial process. In this study, we also found a higher proportion of smokers and of subjects with the more virulent H. pylori strains (cagA+ vacA s1m1) in the high-risk population. These are known risk factors that may contribute to the difference in gastric cancer incidence between the two populations.
Because H. pylori virulence factor genotypes are associated with diagnosis, our findings were adjusted for those genotypes. The association between eosinophil or MC density with the histopathology score was independent of the H. pylori genotypes we examined.
In conclusion, our results suggest that the presence of increased numbers of eosinophils in the gastric mucosa over a prolonged period of time may represent a Th2- biased immune response against H. pylori infection, limiting the deleterious effects of Th1 proinflammatory cytokines, and ultimately modifying the outcome of the infection. Our current studies are focused on defining the mechanisms through which eosinophils may alter the outcome of H. pylori-induced diseases.
Acknowledgments
We thank our staff members in Colombia for the recruitment of patients and Drs. Guillermo Zarama and Jose L. Realpe for the collection of the gastric biopsy samples. This work was supported by grants from the National Cancer Institute (PO1CA028842, RO1DK58587, RO1CA77955, RO1DK73902). Morphometric analysis was performed in part using the Vanderbilt University Medical Center Cell Imaging Shared Resource.
Abbreviations
- CI
confidence interval
- HE
hematoxylin and eosin
- IL
interleukin
- IM
intestinal metaplasia
- MAG
multifocal atrophic gastritis without intestinal metaplasia
- MC
mast cells
- MN
mononuclear cells
- NAG
non-atrophic gastritis
- OR
odds ratio
- PCR
polymerase chain reaction
- PMN
polymorphonuclear neutrophils
- RT
room temperature
- Th
T helper
Footnotes
Publisher's Disclaimer: This is a PDF file of an unedited manuscript that has been accepted for publication. As a service to our customers we are providing this early version of the manuscript. The manuscript will undergo copyediting, typesetting, and review of the resulting proof before it is published in its final citable form. Please note that during the production process errors may be discovered which could affect the content, and all legal disclaimers that apply to the journal pertain.
Disclosure/Conflict of interest: None declared
References
- 1.Rothenberg ME, Hogan SP. The eosinophil. Annu Rev Immunol. 2006;24:147–74. doi: 10.1146/annurev.immunol.24.021605.090720. [DOI] [PubMed] [Google Scholar]
- 2.Bachelet I, Levi-Schaffer F, Mekori YA. Mast cells: not only in allergy. Immunol Allergy Clin North Am. 2006;26:407–25. doi: 10.1016/j.iac.2006.05.007. [DOI] [PubMed] [Google Scholar]
- 3.Puxeddu I, Ribatti D, Crivellato E, Levi-Schaffer F. Mast cells and eosinophils: a novel link between inflammation and angiogenesis in allergic diseases. J Allergy Clin Immunol. 2005;116:531–6. doi: 10.1016/j.jaci.2005.06.007. [DOI] [PubMed] [Google Scholar]
- 4.Munitz A, Levi-Schaffer F. Eosinophils: ‘new’ roles for ‘old’ cells. Allergy. 2004;59:268–75. doi: 10.1111/j.1398-9995.2003.00442.x. [DOI] [PubMed] [Google Scholar]
- 5.Dixon MF, Genta RM, Yardley JH, Correa P. Classification and grading of gastritis. The updated Sydney System. International Workshop on the Histopathology of Gastritis, Houston 1994. Am J Surg Pathol. 1996;20:1161–81. doi: 10.1097/00000478-199610000-00001. [DOI] [PubMed] [Google Scholar]
- 6.Furuta GT. Emerging questions regarding eosinophil's role in the esophagogastrointestinal tract. Curr Opin Gastroenterol. 2006;22:658–63. doi: 10.1097/01.mog.0000245530.35518.3e. [DOI] [PubMed] [Google Scholar]
- 7.Fenoglio-Preiser CM, Lantz PE, Listrom MB, Davis M, Rilke FO, editors. Gastrointestinal pathology: an atlas and text. 2nd ed. Lippincott-Raven; Philadelphia, PA: 1999. [Google Scholar]
- 8.Nakajima S, Bamba N, Hattori T. Histological aspects and role of mast cells in Helicobacter pylori-infected gastritis. Aliment Pharmacol Ther. 2004;20(Suppl 1):165–70. doi: 10.1111/j.1365-2036.2004.01974.x. [DOI] [PubMed] [Google Scholar]
- 9.Moorchung N, Srivastava AN, Gupta NK, Malaviya AK, Achyut BR, Mittal B. The role of mast cells and eosinophils in chronic gastritis. Clin Exp Med. 2006;6:107–14. doi: 10.1007/s10238-006-0104-9. [DOI] [PubMed] [Google Scholar]
- 10.Schistosomes, liver flukes and Helicobacter pylori. Vol. 61. IARC Press; Lyon: 1994. IARC Monographs on the evaluation of carcinogenic risks to humans. pp. 177–240. [PMC free article] [PubMed] [Google Scholar]
- 11.Correa P, Haenszel W, Cuello C, Tannenbaum S, Archer M. A model for gastric cancer epidemiology. Lancet. 1975;2:58–60. doi: 10.1016/s0140-6736(75)90498-5. [DOI] [PubMed] [Google Scholar]
- 12.Correa P, Cuello C, Duque E, et al. Gastric cancer in Colombia. III. Natural history of precursor lesions. J Natl Cancer Inst. 1976;57:1027–35. doi: 10.1093/jnci/57.5.1027. [DOI] [PubMed] [Google Scholar]
- 13.Camargo MC, Yepez MC, Ceron C, et al. Age at acquisition of Helicobacter pylori infection: comparison of two areas with contrasting risk of gastric cancer. Helicobacter. 2004;9:262–70. doi: 10.1111/j.1083-4389.2004.00221.x. [DOI] [PubMed] [Google Scholar]
- 14.Whary MT, Sundina N, Bravo LE, et al. Intestinal helminthiasis in Colombian children promotes a Th2 response to Helicobacter pylori: possible implications for gastric carcinogenesis. Cancer Epidemiol Biomarkers Prev. 2005;14:1464–9. doi: 10.1158/1055-9965.EPI-05-0095. [DOI] [PubMed] [Google Scholar]
- 15.Rugge M, Correa P, Dixon MF, et al. Gastric dysplasia: the Padova international classification. Am J Surg Pathol. 2000;24:167–76. doi: 10.1097/00000478-200002000-00001. [DOI] [PubMed] [Google Scholar]
- 16.Mera R, Fontham ET, Bravo LE, et al. Long term follow up of patients treated for Helicobacter pylori infection. Gut. 2005;54:1536–40. doi: 10.1136/gut.2005.072009. [DOI] [PMC free article] [PubMed] [Google Scholar]
- 17.Sicinschi LA, Correa P, Peek RM, Jr, et al. Helicobacter pylori genotyping and sequencing using paraffin-embedded biopsies from residents of Colombian areas with contrasting gastric cancer risks. Helicobacter. 2008;13:135–45. doi: 10.1111/j.1523-5378.2008.00554.x. [DOI] [PMC free article] [PubMed] [Google Scholar]
- 18.Hanley JA, McNeil BJ. The meaning and use of area under a Receiver Operating Characteristic (ROC) curve. Radiology. 1982;143:29–36. doi: 10.1148/radiology.143.1.7063747. [DOI] [PubMed] [Google Scholar]
- 19.DeLong, DeLong, Clarke-Pearson Comparing the areas under two or more correlated receiver operating curves: A nonparametric approach. Biometrics. 1988;44:837–45. [PubMed] [Google Scholar]
- 20.de Vries AC, Haringsma J, Kuipers EJ. The detection, surveillance and treatment of premalignant gastric lesions related to Helicobacter pylori infection. Helicobacter. 2007;12:1–15. doi: 10.1111/j.1523-5378.2007.00475.x. [DOI] [PubMed] [Google Scholar]
- 21.Ernst PB, Gold BD. The disease spectrum of Helicobacter pylori: the immunopathogenesis of gastroduodenal ulcer and gastric cancer. Annu Rev Microbiol. 2000;54:615–40. doi: 10.1146/annurev.micro.54.1.615. [DOI] [PubMed] [Google Scholar]
- 22.Goll R, Gruber F, Olsen T, et al. Helicobacter pylori stimulates a mixed adaptive immune response with a strong T-regulatory component in human gastric mucosa. Helicobacter. 2007;12:185–92. doi: 10.1111/j.1523-5378.2007.00495.x. [DOI] [PubMed] [Google Scholar]
- 23.Dixon H, Blanchard C, Deschoolmeester ML, et al. The role of Th2 cytokines, chemokines and parasite products in eosinophil recruitment to the gastrointestinal mucosa during helminth infection. Eur J Immunol. 2006;36:1753–63. doi: 10.1002/eji.200535492. [DOI] [PubMed] [Google Scholar]
- 24.Wang TN, Chiang W, Tseng HI, et al. The polymorphisms of eotaxin 1 and CCR3 genes influence on serum IgE, eotaxin levels and mild asthmatic children in Taiwan. Allergy. 2007;62:1125–30. doi: 10.1111/j.1398-9995.2007.01485.x. [DOI] [PubMed] [Google Scholar]
- 25.Yamamoto N, Sugiura H, Tanaka K, Uehara M. Heterogeneity of interleukin 5 genetic background in atopic dermatitis patients: significant difference between those with blood eosinophilia and normal eosinophil levels. J Dermatol Sci. 2003;33:121–6. doi: 10.1016/s0923-1811(03)00149-x. [DOI] [PubMed] [Google Scholar]
- 26.Pascal RR, Gramlich TL, Parker KM, Gansler TS. Geographic variations in eosinophil concentration in normal colonic mucosa. Mod Pathol. 1997;10:363–5. [PubMed] [Google Scholar]
- 27.Elliott DE, Summers RW, Weinstock JV. Helminths as governors of immune-mediated inflammation. Int J Parasitol. 2007;37:457–64. doi: 10.1016/j.ijpara.2006.12.009. [DOI] [PubMed] [Google Scholar]
- 28.Fox JG, Beck P, Dangler CA, et al. Concurrent enteric helminth infection modulates inflammation and gastric immune responses and reduces helicobacter-induced gastric atrophy. Nat Med. 2000;6:536–42. doi: 10.1038/75015. [DOI] [PubMed] [Google Scholar]
- 29.Du Y, Agnew A, Ye XP, Robinson PA, Forman D, Crabtree JE. Helicobacter pylori and Schistosoma japonicum co-infection in a Chinese population: helminth infection alters humoral responses to H. pylori and pepsinogen I/II ratio. Microbes Infect. 2006;8:52–60. doi: 10.1016/j.micinf.2005.05.017. [DOI] [PubMed] [Google Scholar]
- 30.Zaccone P, Fehervari Z, Phillips JM, Dunne DW, Cooke A. Parasitic worms and inflammatory diseases. Parasite Immunol. 2006;28:515–23. doi: 10.1111/j.1365-3024.2006.00879.x. [DOI] [PMC free article] [PubMed] [Google Scholar]
- 31.Henderson JP, Byun J, Williams MV, et al. Bromination of deoxycytidine by eosinophil peroxidase: a mechanism for mutagenesis by oxidative damage of nucleotide precursors. Proc Natl Acad Sci USA. 2001;98:1631–6. doi: 10.1073/pnas.041146998. [DOI] [PMC free article] [PubMed] [Google Scholar]
- 32.Montemurro P, Nishioka H, Dundon WG, et al. The neutrophil-activating protein (HPNAP) of Helicobacter pylori is a potent stimulant of mast cells. Eur J Immunol. 2002;32:671–6. doi: 10.1002/1521-4141(200203)32:3<671::aid-immu671>3.3.co;2-x. [DOI] [PubMed] [Google Scholar]
- 33.Supajatura V, Ushio H, Wada A, et al. Cutting edge: VacA, a vacuolating cytotoxin of Helicobacter pylori, directly activates mast cells for migration and production of proinflammatory cytokines. J Immunol. 2002;168:2603–7. doi: 10.4049/jimmunol.168.6.2603. [DOI] [PubMed] [Google Scholar]
- 34.Velin D, Bachmann D, Bouzourene H, Michetti P. Mast cells are critical mediators of vaccine-induced Helicobacter clearance in the mouse model. Gastroenterology. 2005;129:142–55. doi: 10.1053/j.gastro.2005.04.010. [DOI] [PubMed] [Google Scholar]
- 35.Xu X, Rivkind A, Pikarsky A, Pappo O, Bischoff SC, Levi-Schaffer F. Mast cells and eosinophils have a potential profibrogenic role in Crohn disease. Scand J Gastroenterol. 2004;39:440–7. doi: 10.1080/00365520310008566. [DOI] [PubMed] [Google Scholar]