

Summary
We monitored single-neuron activity in the orbitofrontal cortex of rats performing a time-discounting task in which the spatial location of the reward predicted whether the delay preceding reward delivery would be short or long. We found that rewards delivered after a short delay elicited a stronger neuronal response than those delivered after a long delay in most neurons. Activity in these neurons was not influenced by reward size when delays were held constant. This was also true for a minority of neurons that exhibited sustained increases in firing in anticipation of delayed reward. Thus, encoding of time-discounted rewards in orbitofrontal cortex is independent of the encoding of absolute reward value. These results are contrary to the proposal that orbitofrontal neurons signal the value of delayed rewards in a common currency and instead suggest alternative proposals for the role this region plays in guiding responses for delayed versus immediate rewards.
Introduction
Animals prefer an immediate reward over a delayed one (Cardinal et al., 2001; Evenden and Ryan, 1996; Herrnstein, 1961; Ho et al., 1999; Kahneman and Tverskey, 1984; Kalenscher et al., 2005; Lowenstein, 1992; Mobini et al., 2002; Thaler, 1981; Winstanley et al., 2004). This time-discounting function is evident in studies that ask subjects to choose between small rewards delivered immediately and a larger reward delivered after some delay. Since the total length of each trial is held constant, the optimal strategy is to always choose the large reward. However, in all species tested thus far, normal subjects fail to follow this strategy, instead biasing their choices toward the small, immediate reward as the delay to the large reward becomes longer. This pattern of behavior has been termed “impulsive choice” and indicates that neural circuits encoding reward value may respond disproportionately to rewards that are readily available. Damage to corticolimbic regions disrupts the breakpoint at which subjects choose the small reward over the larger delayed reward, typically causing animals to behave more impulsively (i.e., choosing the small immediate reward at shorter delays) (Cardinal et al., 2001, 2004; Mobini et al., 2002; Winstanley et al., 2004). The orbitofrontal cortex (OFC) is unique among these areas in that lesions to this region can result in less impulsive behavior, particularly in well-trained rats (Winstanley et al., 2004).
One proposed explanation for this result is that OFC is critical for discounting the value of the delayed reward (Winstanley et al., 2004), just as OFC is important for appropriate behavior after reward devaluation in other settings (Baxter et al., 2000; Izquierdo et al., 2004; Pickens et al., 2003; Schoenbaum and Setlow, 2004). A simple prediction from this model is that neurons in OFC should respond less to delayed than to immediate rewards in well-trained animals. Furthermore, if this discounting function is part of a broader role for OFC in tracking the value of expected outcomes in a kind of common currency—allowing one to compare, say, apples and oranges (Kringelbach, 2005; Montague and Berns, 2002)—then the effect of delay on neural activity in OFC should covary with the effect of other, more direct manipulations of reward value.
To test these simple predictions, we recorded single-unit activity in the OFC of rats performing a task in which future decisions were based on when (after a short or long delay) or what (big or small) reward was delivered on previous trials. This task allowed us to isolate changes in neural activity related to reward size from changes in neural activity related to time to reward. The overall goal was to determine if the neural representation of the reward during its delivery was affected by the delay preceding it, whether this effect was consistent with the time-discounting function proposed for OFC, and whether this effect covaried with an independent assessment of the impact of reward size on neuronal activity. We found that population activity to the reward was discounted by the length of delay preceding it, but was unaffected by the size of the reward. Furthermore, while most OFC neurons did fire less in response to the delayed reward, a small but significant proportion of the neurons did not, instead exhibiting a progressive increase in firing in anticipation of delayed rewards. These results are contrary to the proposal that orbitofrontal neurons signal the value of delayed rewards in a common currency, and instead suggest alternative proposals for the role this region plays in guiding responses for delayed versus immediate rewards.
Results
We trained rats to respond to one of two adjacent wells after nose poking in a central odor port. On a given trial, the rat was (1) forced to go to the left to get a reward, (2) forced to go to the right to get a reward, or (3) allowed to choose between the two wells. These trial types were signaled by the odor presented in the odor port at the start of the trial and allowed us to control which well the animal responded to (using forced choice trials) and to determine the rat’s preference for the differently valued sides (using free choice trials). Within this basic design, we independently manipulated the length of the delay preceding reward delivery and the size of the reward associated with a given side over four trial blocks in each session (Figure 1). Thus, within a direction, for each neuron, we were able to determine if the neural representation of reward recorded in OFC was impacted by the delay, and if this time-discounting effect covaried with the effect of reward size on neuronal activity.
Figure 1. Experimental Design.
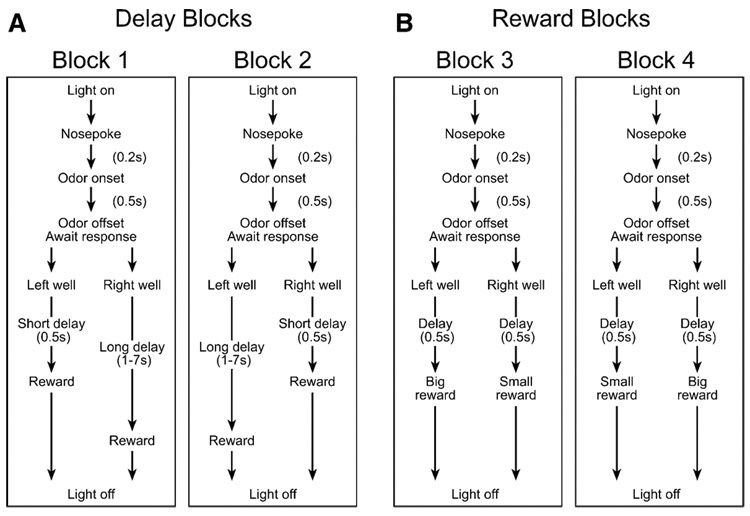
Choice task during which we varied (A) the delay preceding reward delivery and (B) the size of the reward. Figure shows the sequence of events in each trial in four blocks in which we manipulated the time to reward or the size of the reward. See Experimental Procedures for a description of the task.
Behavior Reflects the Rats’ Preference for Shorter Delays and Larger Rewards
After training, during the period when neuronal data were being collected, all rats performed accurately, selecting the correct well on 97% of forced choice trials. More importantly, as the data shown in Figure 2 illustrates, our choice task was successful in re-producing the behavior that has been reported in previous time-discounting studies. Specifically, the rats’ behavior was biased toward the well leading to the more immediate reward. This bias was evident in the rats’ free choice behavior, which adapted rapidly to favor choices to the well associated with reward after the short delay. This is illustrated in Figure 2, which shows the average choice rate over all sessions for the ten trials preceding and the 28 trials after reversal of the associations between the wells and the delays (Figure 1A: block 1:2). Prior to the switch, rats chose the well leading to the more immediate reward on approximately 85% of the trials (short delay). After the switch, rats consistently reestablished this bias for the well associated with the short delay after 10–15 trials. Overall, rats chose the well associated with the short delay 74% of the time (Figure 2A; inset). In addition, the rats also exhibited significantly shorter reaction times (t test; p < 0.001) and a higher percentage of correct scores (t test; p < 0.001) on forced choice trials toward the well associated with the short delay, indicating that the rats’ behavior was influenced by delay length on forced as well as free choice trials (Figures 2B and 2C).
Figure 2. Impact of Delay Length and Reward Size on Behavior.
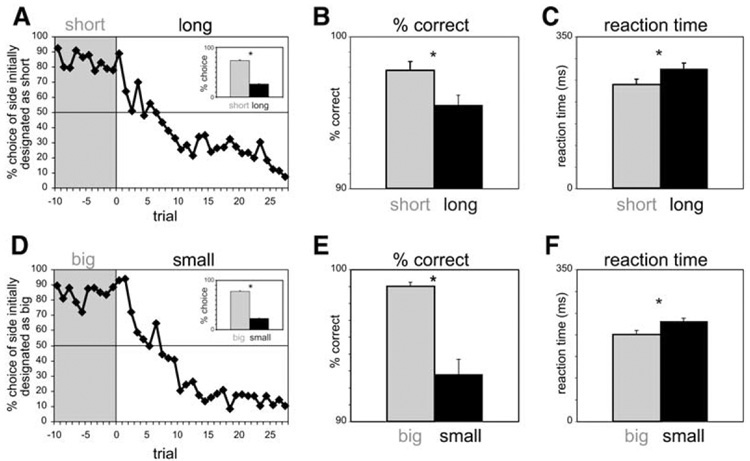
(A) Average choice rate, collapsed across direction, for all sessions for trials before and after the switch from short to long delay. (Inset) The height of each bar indicates the percent choice of short delay and long delay taken over all choice trials.
(B and C) The height of each bar indicates the percent correct (B) and reaction time (C) across all recording sessions in all rats on short delay (gray) and long delay (black) forced choice trials.
(D–F) Impact of reward size on the same behavior measures described in (A)–(C). *p < 0.05, t test. Error bars = SE.
Reward size had a similar impact on these behavioral measures, consistent with the theory that the delay effects reflect a value judgment. Rats chose the big reward over the small reward in 77% of all choice trials and switched behavior rapidly between blocks (Figure 2D). In addition, they also exhibited significantly shorter reaction times (t test; p < 0.001) and a higher percentage of correct scores (t test; p < 0.001) on forced choice trials toward the well associated with the big reward (Figures 2E and 2F).
Neuronal Activity in OFC Is Directionally Selective
We recorded 302 neurons in the orbital and agranular insular regions over the course of 74 sessions in four rats (Figure 3A). It has been shown in both primates and rats that neurons in these regions fire several seconds before reward and subside approximately 1 s later (Roesch and Olson, 2004, 2005; Schoenbaum et al., 1998, 1999; Schoenbaum and Eichenbaum, 1995; Tremblay and Schultz, 1999). To identify this population, we defined a trial epoch starting 250 ms prior to reward delivery and ending 1 s after reward delivery. This “reward epoch” captures both anticipation and delivery of reward (see Experimental Procedures). To quantify the number of cells that exhibited a higher firing rate during this period, we performed a one-sided t test comparing firing rate during the reward epoch to baseline activity. Of the 302 neurons recorded, 159 (53%) exhibited an increase in firing rate during reward. Surprisingly, many of these neurons fired differently depending on the spatial location of the reward (left versus right). That is, with all other variables held constant (i.e. reward size and delay length), many neurons signaled reward delivery for only one spatial location. We will refer to this spatial location as the cell’s “preferred direction.” In the remainder of the text, population activity will be indexed to each neuron’s preferred direction in order to average across cells. This is illustrated in Figure 3, which provides a qualitative description of neural activity averaged over all 159 neurons responsive during the reward epoch. Note that when reward and delay were held constant while direction varied (compare dashed versus solid lines of same color in Figures 3B–3D), activity was higher, by definition, in the preferred direction. Spatial selectivity in OFC was surprising because it has rarely been described; however, in past studies response direction was not a predictor of reward value (Hikosaka and Watanabe, 2000; Roesch and Olson, 2004, 2005; Rolls, 2000; Schoenbaum et al., 1998, 1999; Tremblay and Schultz, 1999, 2000; Wallis and Miller, 2003) or it was confounded with cue-reward associations (Lipton et al., 1999). By contrast, our task explicitly linked the direction or place of the response to differently valued rewards. Notably, spatial selectivity in rat OFC has been recently reported at the Annual Meeting of the Society for Neuroscience (Feierstein et al., 2005, SFN Abstracts, abstract) using a similar paradigm. Since this directional effect is not the main focus of the report, additional analyses are provided in the Supplemental Data.
Figure 3. Impact of Delay Length and Reward Size on All 159 Reward-Related Neurons.
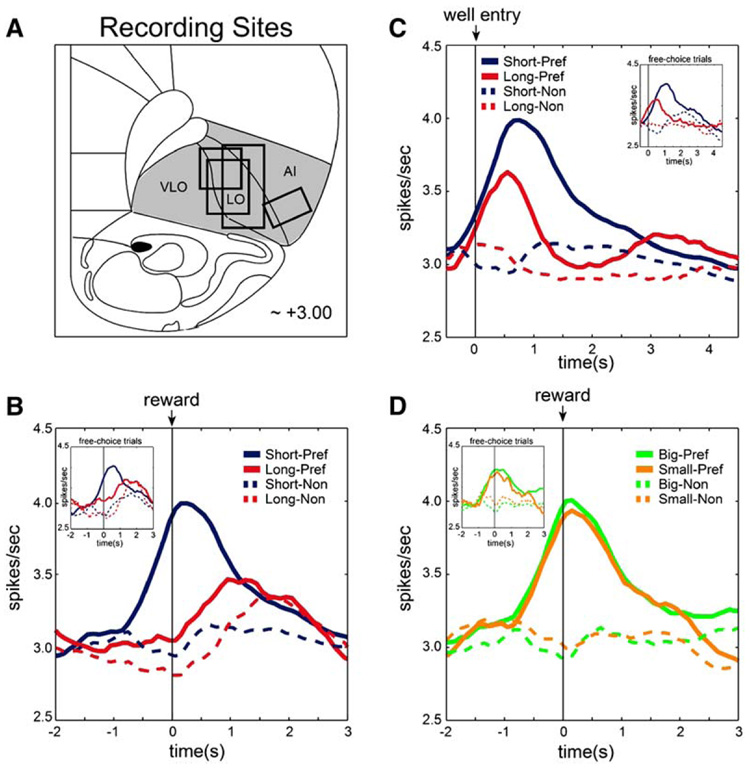
(A) Location of recording sites in rat OFC. Vertical bars on the drawing indicate the center of the electrode track in each rat; boxes indicate approximate extent of recording sessions vertically during transition through each area and give an estimate of the spread of the wires (~1 mm).
(B and C) Curves representing mean population firing rate during performance of forced choice trials for all 159 reward-responsive neurons as a function of time under conditions where delay length varied (short = blue, long = red). (Data is aligned on reward delivery in [B] and well entry in [C]). (D) Curves representing mean population firing rate during performance of forced choice trials for the same 159 reward-responsive neurons as a function of time under conditions where magnitude of the reward varied (big = green, small = orange). Data is aligned on reward delivery. Solid and dashed lines indicate the neuron’s preferred and nonpreferred direction. For each neuron, the direction that yielded the stronger response (averaged over all trials) was designated as preferred. (Insets) Impact of delay length ([B] and [C]) and reward size (D) on 104 reward-responsive neurons during performance of free choice trials only. Data in insets include sessions during which rats performed at least two free choice trials per condition.
Due to this impact of direction on neuronal firing, we analyzed the effect of delay length and reward size on reward-related activity for each direction separately. That is, for each direction, we asked whether neuronal activity was significantly influenced by delay length and reward size (t test; p < 0.05). Since the rats chose long delay and small reward less often (see Figure 2), this analysis was performed on forced choice trials where the number of trials collected within each block was evenly distributed across conditions. Forced choice trials were interleaved with the free choice trials and provided an unbiased sample of neuronal data for both left and right directions. Note that since we analyzed data for each direction separately, spatial selectivity had no impact on the following analysis of delay length and reward size.
Impact of Delay and Reward Size on Reward-Responsive Activity in OFC
In Figure 3, effects of elapsed delay length and reward size are evident in differences in firing rate between trials in which the response direction was the same but delay length (Figures 3B and 3C) or reward size (Figure 3D) varied (indicated by different colors). For rewards delivered in the preferred direction (solid lines), population activity increased before and during delivery of the reward, suggesting that this signal represents the delivery of the expected reward. Although strong after short delays (solid blue), reward-related activity was both deferred and reduced in magnitude after long delays (Figure 3B; solid red). This activity peaked shortly after reward delivery (~1 s) but prior to well exit, which occurred, on average, 6.0467 s (SD = 1.3565) after reward delivery. To be certain that critical information about long delay trials was not represented earlier in the delay rather than during reward delivery, we also aligned activity to well entry (Figure 3C). When the data are plotted this way, there is an increase in activity on long trials at the time of the response, approximately when reward would have occurred on short trials. This activity peak will be considered in the next section; however, it was weaker than that observed in the short trials. Thus, regardless of alignment, activity was stronger under conditions of short delay (Figures 3B and 3C). Interestingly, activity in these same cells did not distinguish between big and small rewards when the delay was held constant and reward size varied (Figure 3D). Thus, across the entire population of reward-responsive OFC neurons, activity was stronger for rewards delivered immediately, but did not differ for differently sized rewards, even though in each case this information affected the rats’ choice behavior similarly (Figure 2). In this regard, it is important to note that although these patterns were evident in data from forced choice trials, similar patterns were observed during performance of free choice trials (Figures 3B–3D; insets).
To quantify these observations at the single-cell level we computed, for each neuron, the average firing rate during the reward epoch. We then asked whether single neurons fired significantly (t test; p < 0.05) more or less for rewards delivered after a short delay as compared with a long delay. This comparison was made independently for each direction. The results of this analysis are reported in Table 1 and summarized in Figure 4. Consistent with the qualitative assessment of population activity illustrated in Figure 3, the number of cells that fired significantly (t test) more strongly for reward after a short delay (n = 65) outnumbered those showing the opposite trend (n = 27) (Figures 4A and 4E; blue versus red; Table 1A). Moreover, as indicated by the population responses in Figure 3, selectivity was typically observed in only one spatial location. Of the 65 neurons that fired significantly more strongly after shorter delays, 52 did so in one direction but not the other (Table 1A; see the Supplemental Data for additional material on directionality).
Table 1.
Incidence of Significant Effects of Delay Length and Reward Size
| A Delay Length | |||||
| RIGHT | |||||
| S>L | L>S | None | |||
| LEFT | S>L | 6(4%) | 5(3%) | 26(16%) | 37(23%) |
| L>S | 2(1%) | 5(3%) | 8(5%) | 15(9%) | |
| None | 26(16%) | 7(4%) | 74(47%) | ||
| 34(21%) | 17(11%) | ||||
| B Reward Size | |||||
| RIGHT | |||||
| B>S | S>B | None | |||
| LEFT | B>S | 1(1%) | 4(3%) | 14(9%) | 19(12%) |
| S>B | 2(1%) | 5(3%) | 7(4%) | 14(9%) | |
| None | 9(6%) | 7(3%) | 110(69%) | ||
| 12(8%) | 16(16%) | ||||
Counts of neurons exhibiting significant effects in a t test taking firing rate during the reward epoch as the dependent variable and employing, as factors, (A) delay length (short or long) or (B) reward size big or small) independently for left and right. In the text, neurons were categorized as short-preferring (n = 65) or long-preferring (n = 27) if they fired significantly more strongly for rewards delivered after a short or a long delay in at least one direction, respectively. Likewise, neurons are categorized as big-preferring (n = 30) or small-preferring (n = 25) if they fired significantly more strongly for big or small rewards in at least one direction, respectively. The reward epoch started 250 ms prior to reward and ended 1000 ms after reward. This epoch encompassed the anticipation and delivery of reward. S > L or L > S: firing rate significantly greater for short than for long delay conditions or vice versa. B > S or S > B: firing rate significantly greater for big than for small reward conditions or vice versa.
Figure 4. Incidence of Significant Effects of Delay Length and Reward Size.
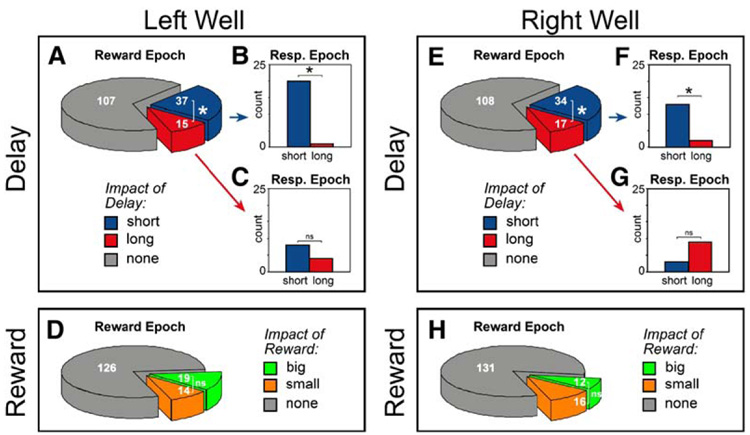
Incidence of significant effects of delay length (top panels) and reward size (bottom panels) for responses made to the left ([A]–[D]) and right well ([E]–[H]). This analysis was performed independently for each direction. For counts of neurons that exhibited selectivity in both directions, see Table 1. (Top panels) Pie charts represent counts of neurons exhibiting significant effects in a t test (p < 0.05), taking firing rate during the “reward epoch” as the dependent variable and employing delay length (short or long) as a factor. Bar graphs represent counts of neurons exhibiting significant effects of delay (t test; p < 0.05) during the response epoch. Bar graphs are split into two categories, based on their selectivity during the reward epoch: ([B] and [F]) those that fired more for rewards delivered after a short delay and ([C] and [G]) those that fired more for rewards delivered after a long delay. The reward epoch started 250 ms prior to reward and ended 1000 ms after reward. The response epoch started from 250 to 1500 ms after a response at the fluid well. (Bottom panels) Counts of neurons exhibiting significant effects in a t test (p < 0.05), taking firing rate during the reward epoch as the dependent variable and employing reward size (big and small) as a factor. Blue: short > long. Red: long > short. Green: big > small. Orange: small > big. * p < 0.05; chi-square.
The impact of delay was highly significant in the data from all rats combined (chi-square test, p < 0.0001) and individually in the data from three of the four rats (chi-square test, p < 0.0001). Furthermore, these findings do not significantly differ if the reward epoch is broken down into an anticipatory epoch (250 ms prior to reward delivery) or a delivery epoch (1000 ms after reward delivery) (chi-square; p = 0.8344). An equivalent analysis was performed for reward blocks during trials where the delay was held constant but reward size varied. Although the counts of neurons exhibiting a significant impact of reward size (t test) were significantly greater that one would expect by chance alone (chi-square, p < 0.0001), the number of cells (Table 1B) showing a significant increase in firing rate for large reward was not greater than the number that exhibited a significant increase in firing rate for a small reward overall or in individual rats (Figures 4D and 4H, green versus yellow; chi-square test, p = 0.4228; Table 1B).
Finally, to determine whether individual neurons that fired more strongly (or weakly) in response to the reward delivered after a short delay might have also fired more strongly (or weakly) in response to the large reward, we computed, for each neuron, two normalized firing rate indices to reflect the impact of delay length and reward size on neuronal activity during the reward epoch. The delay index (delay index = [short − long]/[short + long]) ranged from −1 to 1, and was positive for cells that fired more strongly for rewards delivered immediately and negative for cells that fired more strongly for rewards delivered after longer delays. Likewise, the reward index (reward index = [big − small]/[big + small]) ranged from −1 to 1, and was positive for cells that fired more strongly for large rewards and negative for cells that fired more strongly for small rewards. As expected from the results described in Figure 3, plotting the delay index against the reward index for all 159 neurons yielded no correlation in either the preferred (r2 = 0.0051; p = 0.3716) or nonpreferred direction (r2 = 0.0052; p = 0.3687). Thus, time-discounted activity did not covary with activity related to reward size for the overall population of reward-responsive OFC neurons. Individual populations will be considered in the following sections.
Most Neurons in OFC Discount Rewards after Longer Delays
In the population described above, 65 (41%) neurons fired significantly more for rewards delivered after short delays (Table 1A). As a basis for qualitative assessment of the effect of delay on the activity of these neurons, we constructed population curves for these 65 neurons (Figure 5A), representing average firing rate as a function of time, under conditions in which the reward was delivered after a short delay (blue) or a long delay (red) for preferred (solid) and nonpreferred directions (dashed). Activity is aligned on well entry in order to illustrate the pattern of neuronal activity over time. To complement the population histogram, Figure 5B provides a single-cell example, plotting neural activity in the last ten trials in a block in which a reward was delivered in the cell’s preferred direction after 500 ms (blue), followed by 35 trials in which the reward was delayed by 1–4 s (red).
Figure 5. Population of OFC Neurons that Fired More Strongly after Short Delays.
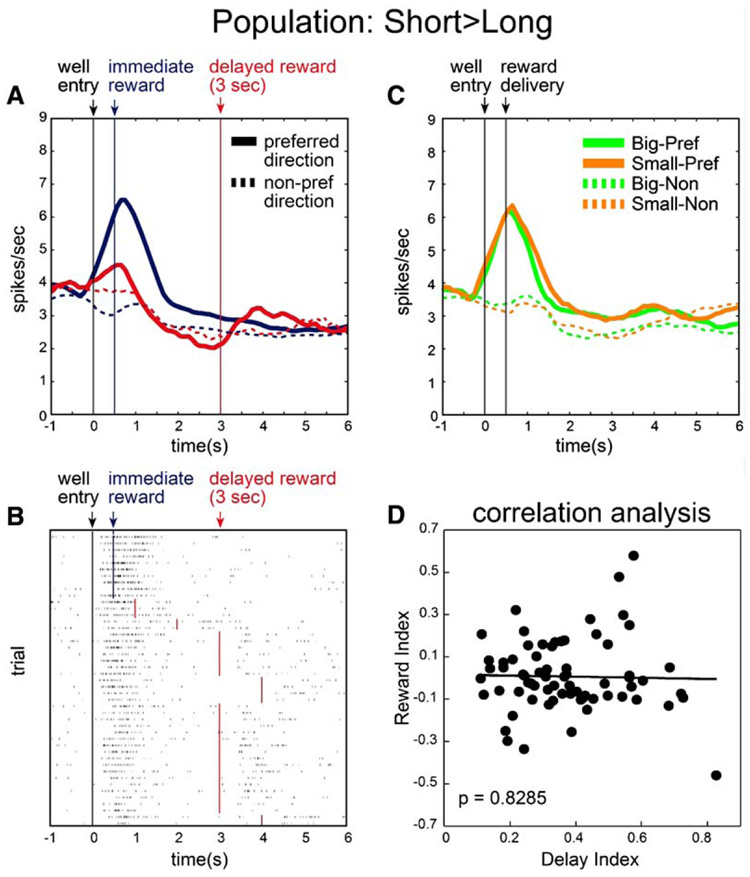
(A) Population histogram representing firing rate as a function of time during the trial for neurons that fired more strongly during the reward epoch after short delays (n = 65). Activity is aligned on well entry. We plot the 3 s delay as an example of delayed reward because it was included in all recording sessions. Blue: short. Red: long. Solid: preferred direction. Dashed: nonpreferred direction. (B) Single-cell example of a short delay-preferring neuron. Activity is plotted for the last ten trials in a block in which reward was delivered in the cell’s preferred direction after 500 ms (blue), followed by trials in which the reward was delayed by 1–4 s (red). Each row represents a single trial, each tick mark represents a single action potential, and the colored lines indicate when reward was delivered. (C) Population histogram of same 65 neurons (shown in [A]) during trials when reward size varied. Green: big. Orange: small. Solid: preferred direction. Dashed: nonpreferred direction. (D) Relation of firing dependent on delay length to firing dependent on reward size for those neurons that fired more strongly after short delays. The delay index and reward index are computed on the basis of firing during the reward epoch. Delay index = (S − L)/(S + L), where S and L represent firing rates on short and long delay trials, respectively. Reward index = (B − S)/(B + S), where B and S represent firing rates on big and small reward trials, respectively.
Under short delay conditions, these neurons fired in anticipation of and during delivery of reward (blue). As we noted earlier, there was an increase in activity just after well entry on long delay trials (red) at the time when reward would have been delivered on a short delay trial. While such activity could reflect a correlate of the motor response to well entry, it may also represent the expectation that the reward will still be delivered after a short delay. Indeed, in the single-cell example in Figure 5B, this activity declines across the delay block; such a decline would be more consistent with a representation of expected reward, which wanes during the training block, than with a representation of the response, which presumably does not change. A regression analysis on activity during this period showed that this was generally true for this population of neurons (see Supplemental Data).
Regardless of interpretation, it is important to note that under long delay conditions, the average firing rate during the response period was attenuated as compared with short delay conditions. To examine whether this change was typical for neurons in this population, we computed, for each neuron, the average firing rate from 250 to 1500 ms after a response at the fluid well (a frame of time we refer to as the “response epoch”). For short delay trials, this epoch is equivalent to the reward epoch, including activity just before and during reward delivery; however, for long delay trials, this epoch differs from the reward epoch, instead capturing activity just after the response and when reward would have been delivered on short delay trials. Of those neurons that fired significantly more strongly for short delay conditions during the reward epoch (37 on the left, 34 on the right), nearly half showed the same relationship when comparing activity during the response epoch (54% on the left, 38% on the right) (Figures 4B and 4F; blue).
Meanwhile, the initial increase in activity observed after well entry on long delay trials (red) was followed by a progressive decrease in firing rate until reward was delivered (Figures 5A and 5B). Only a weak burst of activity was elicited after the delayed reward was delivered. Even if one adds the two temporally distinct neural responses observed on long trials, the sum still does not equal the increase in firing observed after short delays. In fact, the sum of the average firing rates elicited during the response epoch and reward epoch under long trials was significantly lower than firing rates elicited after the short delay (t test; p < 0.05) when compared with baseline rates. This effect was partly due to the progressive decrease in firing rate during the long delay, which fell significantly below baseline prior to reward delivery (t test; 250 ms prior to reward versus baseline; p < 0.05).
Rewards received after short delays are commonly thought to be more valuable than rewards delivered after a long delay. Certainly, these animals preferred short delays over long delays (Figure 2). To test whether the neurons that fired more strongly to short rewards were simply encoding reward value, we plotted neural activity in those neurons in blocks where delay length was held constant but reward size varied (Figure 5C). This figure shows that, as a population, these neurons did not fire more strongly for the larger reward. Furthermore, there was no correlation between neural activity based on reward size and delay length (Figure 5D). This is despite the fact that the rats preferred the big rewards over the small rewards, just as they had the short delays over the long delays (Figure 2). Thus, neurons that fired more strongly after shorter delays did not appear to represent the higher value of an immediate reward, at least as reflected by the response of these neurons to reward size.
Some Neurons in OFC Increase Firing in Expectation of Delayed Rewards
Of course, not all neurons fired more strongly for immediate reward. As illustrated in Figure 4, 27 neurons (17%) fired significantly more strongly for rewards delivered after longer delays (Table 1A; L > S). Although the average firing rate of these neurons were similar to short-preferring cells, reaching a peak firing rate of 6–7 spikes per second (Figure 5A), their impact on the overall population (Figures 3B and 3C) was not evident because they were in the minority (Figures 4D and 4H; Table 1A).
Like neurons that fired more strongly after shorter delays, these neurons fired in anticipation of and during delivery of reward (Figure 6A). However, when reward was delayed, activity in this population bridged the delay, continuing to increase until its delivery (Figures 6A and 6B). This anticipatory activity can be observed in both the single-cell example (Figure 6B) and across the population (Figure 6A). This population also differed from the other population of reward-responsive neurons in that activity was similar just after well entry. Consistent with this observation, roughly equal numbers of neurons fired significantly more or less strongly during the response epoch (Figures 4C and 4G).
Figure 6. Population of OFC Neurons that Fired More Strongly after Long Delays.
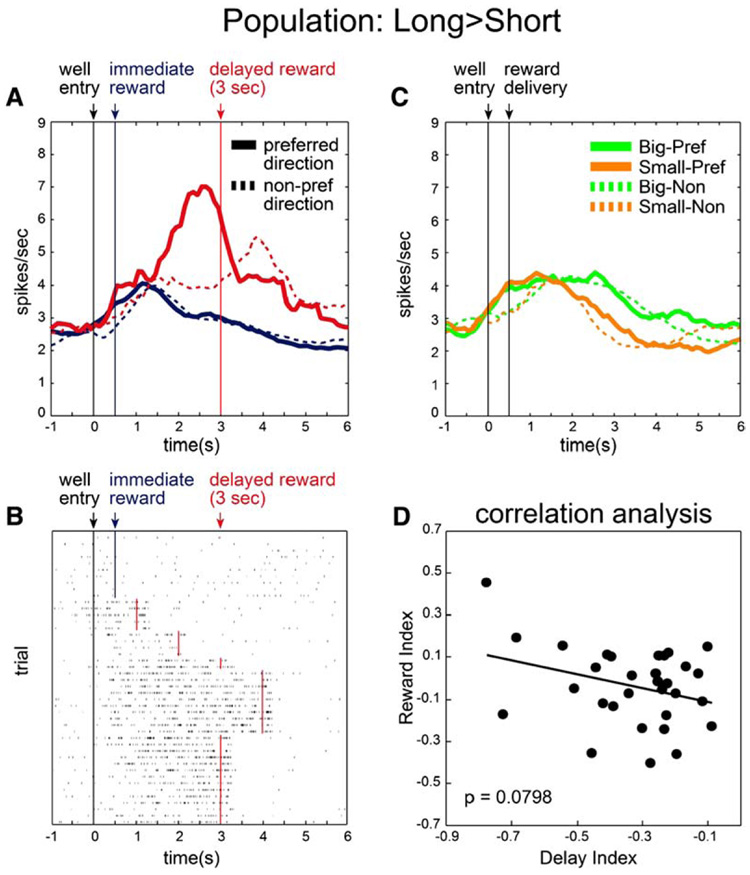
(A) Population histogram representing firing rate as a function of time during the trial for neurons that fired more strongly during the reward epoch after long delays (n = 27).
(B) Single-cell example.
(C) Population histogram of same 27 neurons (shown in [A]) during trials when delay was held constant but reward size varied.
(D) Relation of firing dependent on delay length to firing dependent on reward size for those neurons that fired more strongly after long delays. Average baseline firing rate and distribution of baseline firing rates for neurons recorded in this group (3.130 spikes/s) were not significantly different from those reported in Figure 5 (2.864 spikes/s; Wilcoxon, p = 0.4062). Conventions are the same as in Figure 5.
Finally, we asked whether activity in these neurons might vary according to the value of the delayed reward, firing more strongly for smaller rewards relative to big rewards. Figure 6C plots activity in this population of neurons in trials where the delay was held constant but reward size varied. As this plot shows, activity was not stronger for smaller reward. Instead, there was a nonsignificant trend in the opposite direction (Figure 6D; p = 0.0798), in part due to persistent activity after larger rewards. Thus, those neurons that fired more strongly for delayed rewards did not appear to represent the lower value of a delayed reward, at least as reflected by the response of these neurons to reward size.
Activity in OFC Biases Future Choice Behavior
These results demonstrate that for the majority of OFC neurons, rewards delivered after short delays elicit a stronger neuronal response than those delivered after long delays. Such a signal may bias behavior toward rewards received immediately. To address this issue we reanalyzed all 159 reward-responsive neurons to determine if delay-related neuronal activity was also correlated with future choice probability. Since the relationship between delay length and choice probability are intertwined, we used a multiple least-squares regression approach to optimize the parameters of two models representing firing rate as a function of choice probability and delay length: (1) a reduced model incorporating delay length only and (2) a full model incorporating both. This analysis was carried out for each neuron and independently for each direction. We compared the reduced model to the full model using a nested F-test (see Experimental Procedures). Then we calculated the percentage of neurons that showed a significant improvement of fit when the variable of choice probability was added to the model (Figure 7). Of the 65 neurons that exhibited a negative correlation between firing rate and delay in this model (i.e. stronger firing for shorter delays), 27 demonstrated a significant improvement of fit (p < 0.05) when the variable of choice probability was added to the model. Of those, the number of neurons exhibiting a positive correlation (n = 20) significantly outnumbered those showing the opposite effect (n = 7) (Figure 7B; chi-square, p < 0.05). Thus, for a disproportionate number of single cells, stronger activity after short delays was correlated with an increased tendency of the rat to choose the short delay on future free choice trials. This was not true for the 20 neurons that exhibited a significant positive correlation with delay length—that is, those that fired more strongly after long delays (Figure 7A; red). Only a few neurons from this population showed a significant correlation with future choice probability (five negative versus three positive) when delay was factored out (Figure 7C).
Figure 7. Dependency of Firing Rate during the Reward Epoch on Delay Length and Future Choice Probability as Revealed by Multiple Regression Analysis.
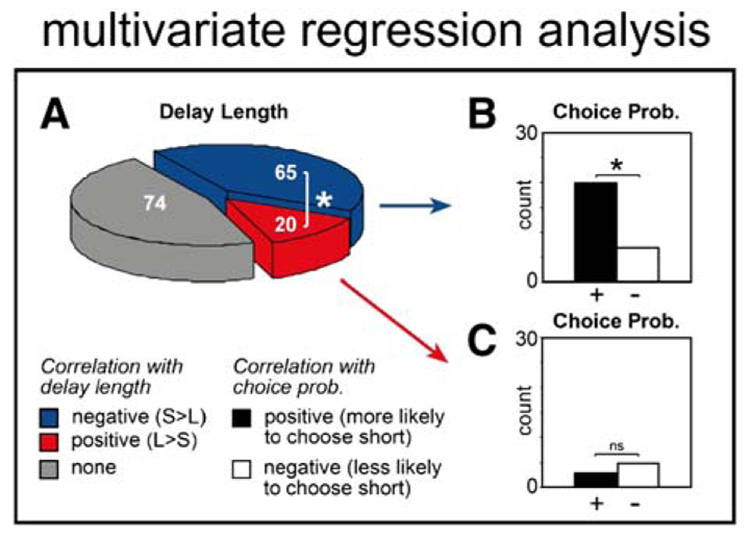
(A) Blue and red represent cases in which the correlation between firing rate and delay length was negative (stronger firing for short delay) or positive (stronger firing for long delay), respectively.
(B and C) Each bar represents the number of neurons in which the correlation between firing rate and future choice probability was positive (more likely to choose direction associated with short delay) or negative (less likely to choose direction associated with short delay) for those cells that also showed (B) a negative or (C) a positive correlation with delay length. * p < 0.05; chi-square.
Discussion
We monitored single-neuron activity in the OFC of rats that performed a variant of a time-discounting task in which the spatial location of the reward predicted whether the delay preceding reward delivery would be short or long and, in a separate block of trials, whether the reward size would be big or small. Delay length and reward size were counterbalanced across spatial locations within a single recording session, and the rats changed their behavior as we manipulated these variables, reliably showing their preference for big over small and immediate over delayed rewards by a number of different behavioral measures (latency, accuracy, and free choice).
We found that the majority of the reward-responsive neurons in well-trained rats (and in the overall population) fired less in anticipation of and during delivery of a delayed reward than for an immediate reward. Activity in these neurons “discounted” the delayed reward. As noted by Montague and Berns (2002), delayed rewards might be discounted either because of the opportunities that are lost in waiting for them or because of the inherent uncertainty in any prediction regarding future events. Delayed rewards in our task could have been discounted due to both of these factors. Obviously, there may have been opportunity costs—other activities not pursued—associated with waiting in the well for the delayed reward. In addition, while there was no inherent uncertainty in our task regarding whether or not the delayed reward would be delivered, uncertainty might have played some role inasmuch as the precise timing of the delayed reward was less consistent than that of the immediate reward. Uncertainty has been shown to modulate BOLD responses in OFC in human subjects (Berns et al., 2001; Critchley et al., 2001; Hsu et al., 2005). Whether diminished activity in this population reflected lost opportunities or the uncertainty associated with future predictions, it provided predictive information concerning the choice bias of the rats on upcoming free choice trials. Thus, the greater the discounting function in these neurons, the more likely the rat was to choose the immediate reward on upcoming trials.
Moreover, because we manipulated time to reward and reward size independently, we were able to demonstrate that activity related to the time to reward, which might be involved in the time-discounting function of OFC, did not covary with the absolute value of the reward, despite the fact that neurons in OFC were significantly influenced by the size of the reward in these trial blocks. Although many neurons did show selectivity for reward size (see Table 1B), there was no preference for one over the other. Even in the population of neurons that did fire more strongly for large rewards, effects of reward size and delay length were not correlated (see Figure S2 in the Supplemental Data). These results have implications for what information OFC neurons encode about delayed rewards and also for how that encoding contributes to discounting behavior. We will consider these two aspects of our results separately.
OFC Neurons Do Not Integrate Time to Reward into a Single Representation of Reward Value
These results demonstrate that OFC does not encode the value of discounted rewards in some sort of common currency, at least at the level of single cells. This is a critical finding, because recent proposals have suggested that OFC neurons provide a context-free representation of the value of rewards so that animals can compare different alternatives or goals. This hypothesis is consistent with single-unit recording work (Critchley and Rolls, 1996; Hikosaka and Watanabe, 2000; Roesch and Olson, 2004, 2005; Rolls, 1996; Schoenbaum et al., 1998, 1999; Tremblay and Schultz, 1999; Wallis and Miller, 2003) and functional imaging studies that show activity in OFC to be related to the value of different goals or outcomes (Arana et al., 2003; Gottfried et al., 2003; Kringelbach, 2005; Montague and Berns, 2002; O’Doherty et al., 2001, 2003). However, imaging data cannot distinguish different neural populations that are in close approximation, such as those we have demonstrated here, and few single-unit recording studies have compared the effects of value manipulations that directly affect actual reward value with those related to other factors known to influence behavior, such as time (Kalenscher et al., 2005; Roesch and Olson, 2005) or reward preference (Critchley and Rolls, 1996; Tremblay and Schultz, 1999). Here we show that OFC neurons do not appear to transform delay-related information into a generic measure of reward value, since cells that fired more (or less) in response to an immediate reward did not also fire more (or less) in response to a larger reward.
That the time-discounted signal did not vary with size of reward indicates that these signals are maintained separately in OFC neurons for differently valued versus delayed rewards. Interestingly, one of us (M.R.) has previously reported that activity in primate OFC elicited in response to visual cues associated with differently delayed or sized rewards does covary (Roesch and Olson, 2005). We also saw cue-related activity which varied with delay and size; however, as for reward-related activity, these two effects did not covary (see the Supplemental Data). This study differed in several important ways from the current report in which activity related to these variables failed to show any relationship. First, the procedure in the older study encouraged associations between the cues and the differently delayed or sized rewards, since the delay-cue was presented before each trial and during the actual delay. This would be analogous to presentation of the odor during the delay in our task and may have encouraged stronger cue-outcome associations, not present in our study, since the cue is present at outcome delivery. Second, and perhaps more importantly, the total length of each trial was not held constant in the primate study; thus, the shorter delays actually were more valuable. In other words, if monkeys were given the choice (which they weren’t), the optimal strategy would have been to choose the short delay. By contrast, in the present study we held the total length of each trial constant; the choice of the shorter delay had to be based on its subjective value alone.
Of course, any number of different task manipulations might be predicted to cause greater covariance in signaling of differently delayed or sized rewards in OFC than we have observed here. However, the fact that we were able to dissociate the effects of these two variables on single-unit activity in OFC indicates that value alone cannot be the fundamental unit of processing in these neurons. In this regard, it is noteworthy that mathematical models of value typically treat size and delay as separate variables in their equations (Kheramin et al., 2002).
The Role of OFC in Delayed Discounting May Reflect Dissociable Roles in Supporting Learning and Guiding Behavior
Cardinal et al. (2004) have proposed that impulsive choice may emerge either as a result of altered sensitivity to reward magnitude, time to reward, or both. Notably, damage to critical associative learning nodes, such as nucleus accumbens (NA) or basolateral amygdala (ABL), indicates that the influence of these variables can be dissociated. Specifically, rats with lesions in these areas are able to choose appropriately between large and small rewards but respond impulsively when there is a delay before the large reward (Cardinal et al., 2001; Winstanley et al., 2004). Based on these results and results showing a delay-dependent deficit in instrumental learning in accumbens-lesioned rats (Cardinal and Cheung, 2005), these researchers have proposed that damage to these areas causes impulsive behavior because it disrupts normal mechanisms for encoding and activating associations that reflect the value of delayed rewards (Cardinal et al., 2004). As a result, the rats are “hypersensitive” to these delays.
Yet damage to OFC has been reported to cause either impulsive or perseverative behavior in delayed discounting tasks, depending on whether that damage is sustained before or after learning (Mobini et al., 2002; Winstanley et al., 2004). We have speculated that this may reflect a dual role for output from OFC in both discounting delayed rewards and supporting new learning for them by bridging the gap between their delivery and predictive cues or responses (Schoenbaum and Roesch, 2005). Here we have shown two dissociable neural populations in OFC that map onto these two roles during delayed responding. One population of neurons fired more for immediate rewards, while a second, smaller population fired more for delayed rewards.
Activity in the first population, which fired more for immediate rewards, provided the dominant signal from OFC. Output from these neurons would be well-positioned to interact with established associative representations in NA or ABL, both of which receive direct projections from OFC (Groenewegen et al., 1987, 1990; Haber et al., 1995; Kita and Kitai, 1990; Kolb, 1984; Krettek and Price, 1977; McDonald, 1991; Schoenbaum et al., 2006; Shi and Cassell, 1998), and bias response toward immediate rewards. This interaction would result in normal levels of impulsivity. Consistent with this proposal, activity in many of these neurons predicted future behavior on choice trials in our well-trained rats.
This model would be consistent with reports that damage to OFC, sustained after learning, results in less impulsive behavior (Winstanley et al., 2004), since this damage would eliminate the dominant discounting signal from OFC in well-trained animals. Without this signal, cues that predict the delayed reward would more strongly control behavior. Indeed, the importance of interactions between prefrontal regions and NA is highlighted by recent data from Goto and Grace (2005), who have reported that D2 antagonists increase the efficacy of prefrontal input to accumbens, while compounds that interact with D1 receptors have no effect. This observation combined with reports that D2, but not D1, antagonists induce impulsive choice suggests that this synapse is particularly critical in integrating associative information with time-discounting signals from prefrontal areas (Wade et al., 2000). If this is correct, then lesions that disrupted associative learning in NA and ABL would be expected to cause more impulsive behavior (Cardinal et al., 2001; Winstanley et al., 2004), since discounting signals from OFC could then act unopposed through connections to other prefrontal regions or motor areas.
However, there was also a second, smaller population of neurons that fired more in response to delayed rewards. Unlike the dominant population we have just discussed, activity in these cells increased across the delay, in expectation of the delayed outcome, thereby bridging the gap between the response and the delayed reward. This population may support the formation of new associations for delayed rewards in NA, ABL, and elsewhere. Such a role for outcome-expectant activity in OFC would be consistent with theoretical accounts of reinforcement learning (Cardinal et al., 2004) and with results showing deficient associative encoding in these downstream areas after damage to OFC (Saddoris et al., 2005). Moreover, a role for OFC in supporting associative learning for delayed rewards in NA and ABL would be consistent with reports that damage to OFC, sustained before rather than after learning, causes impulsive rather than perseverative behavior (Mobini et al., 2002). The loss of this learning signal would cause impulsive behavior due to weaker associations in NA and ABL for the cues or responses predicting the delayed reward. Notably, this would be the same effect caused by direct damage to these areas (Cardinal et al., 2001; Winstanley et al., 2004). This signal was relatively negligible in our study, perhaps because the prolonged training our rats underwent prior to recording.
Interestingly, new data from Rushworth, Walton, and colleagues suggests that OFC may play a role in encouraging response for delayed reward beyond initial sessions. They reported in an abstract that rats given some training (~200 trials over ~30 sessions) in an instrumental delayed discounting task still showed impulsive responding after OFC lesions (Rudebeck et al., 2006). This amount of training, though substantial, is still far less than rats in either the Winstanley study (Winstanley et al., 2004), which completed ~2000 trials over 60 sessions before lesions were made, or in the current study, which completed 5000–10,000 trials over 15–30 sessions before recording. Notably, with further training in which the OFC-lesioned rats were forced to respond at extended delays, the impulsivity disappeared. These findings are consistent with the proposal that OFC initially facilitates learning for delayed rewards, but that over time this role becomes less important. Indeed it would appear that with sufficient practice, other brain areas can completely compensate for the loss of OFC, at least when substantial training is given after the lesions are made. Of course, the requirement for learning might be prolonged, depending on how the task is run, and other factors could influence which role OFC may play in a particular task (e.g. amount of experience with changing delays or with forced versus free choice trials). We would predict that activity in neurons that prefer delayed rewards should be the dominant output from OFC as long as the behavior indicates that OFC is critical for encouraging response for the delayed outcome. Furthermore, the output of these neurons should correlate with choice behavior in these settings.
Experimental Procedures
Subjects
Male Long-Evans rats were obtained at 175–200g from Charles River Labs, (Wilmington, MA). Rats were tested at the University of Maryland School of Medicine in accordance with SOM and NIH guidelines.
Surgery and Histology
Using aseptic, stereotaxic surgical techniques, a drivable bundle of ten, 25 µm diameter FeNiCr wires (Stablohm 675, California Fine Wire, Grover Beach, CA) was chronically implanted dorsal to OFC in the left hemisphere at 3.0 mm anterior to bregma, 3.2 mm laterally, and 4.0 mm ventral to the surface of the brain in each rat. Immediately prior to implantation, these wires were freshly cut with surgical scissors to extend ~1 mm beyond the cannula and electroplated with platinum (H2PtCl6, Aldrich, Milwaukee, WI) to an impedance of ~300 kΩ. The final electrode position was marked by passing a 15 µA current through each electrode. The rats were then perfused, and their brains removed and processed for histology using standard techniques (Schoenbaum et al., 1999).
Time-Discounting Choice Task
Recording was conducted in aluminum chambers approximately 18” on each side with sloping walls narrowing to an area of 12” × 12” at the bottom. A central odor port was located above and two adjacent fluid wells were on a panel in the right wall of each chamber. Two lights were located above the panel. The odor port was connected to an air flow dilution olfactometer to allow the rapid delivery of olfactory cues. Task control was implemented via computer. Odors where chosen from compounds obtained from International Flavors and Fragrances (New York, NY).
The basic design of a trial is illustrated in Figure 1. Trials were signaled by illumination of the panel lights inside the box. When these lights were on, a nose poke into the odor port resulted in delivery of the odor cue to a small hemicylinder located behind this opening. One of three different odors was delivered to the port on each trial, in a pseudorandom order. At odor offset, the rat had 3 s to make a response at one of the two fluid wells located below the port. One odor instructed the rat to go to the left to get a reward, a second odor instructed the rat to go to the right to get a reward, and a third odor indicated that the rat could obtain a reward at either well. Odors were presented in a pseudorandom sequence such that the free choice odor was presented on 7/20 trials and the left/right odors were presented in equal numbers (± over 250 trials). In addition, the same odor could be presented on no more than 3 consecutive trials.
Once the rats were shaped to perform this basic task, we introduced blocks in which we independently manipulated the size of the reward delivered at a given side and the length of the delay preceding reward delivery. Once the rats were able to maintain accurate responses through these manipulations, we began recording sessions. For recording, one well was randomly designated as short and the other long at the start of the session (Figure 1A, block 1). In the second block of trials these contingencies were switched (Figure 1A, block 2). The length of the delay under long conditions abided by the following algorithm. The side designated as long started off providing a delay of 1 s and increased by 1 s every time that side was chosen until it became 3 s. If the rat continued to choose that side, the length of the delay increased by 1 s up to a maximum of 7 s. If the rat chose the side designated as long less than eight out of the last ten choice trials, then the delay was reduced by 1 s to a minimum of 3 s. In later blocks we held the delay preceding reward delivery constant while manipulating the size of the expected reward (Figure 1B). The reward was a 0.05 ml bolus of 10% sucrose solution. For a big reward, an additional bolus was delivered after 500 ms. At least 60 trials per block were collected for each neuron.
Single-Unit Recording
Procedures were the same as described previously (Roesch et al., 2006). Active wires were selected and a session was begun. If no activity was detected, the rat was removed, and the electrode assembly was advanced 40 or 80 µm. Otherwise, the electrode was advanced at the end of the session.
Neural activity was recorded using two identical Plexon Multichannel Acquisition Processor systems (Dallas, TX), interfaced with odor discrimination training chambers described above.
Statistical Data Analysis
Units were sorted using Offline Sorter software from Plexon Inc (Dallas, TX), using a template matching algorithm. Sorted files were then processed in Neuroexplorer to extract unit timestamps and relevant event markers. These data were subsequently analyzed in Matlab (Natick, MA) to examine reward-related activity as defined by an epoch starting 250 ms prior to reward delivery and ending 1 s after reward delivery. We chose an all-inclusive (anticipation and delivery of reward) epoch because we were interested in capturing the neuronal correlate that is thought to represent a signal of reward delivery, which in past studies has included both anticipation and delivery of reward. We chose 250 ms prior to reward delivery because it was half the delay on short delay trials, which was 500 ms. This prevented any contamination from residual response-related activity. We choose 1 s after reward, which included both the delivery of small and large rewards, to capture activity related to reward delivery. We did not extend past 1 s to avoid any activity that may be more related to taste (Katz et al., 2001; 2002) and to avoid contamination from behaviors or events that could occur if the rat had left the well. Rats never left the well before 1 s.
We also analyzed activity during a response epoch. This epoch encompassed the average firing rate from 250 to 1500 ms after a response at the fluid well. For short delay trials, this epoch is equivalent to the reward epoch, including activity just after the response and during reward delivery; however, for long delay trials it captured activity just after the response and when reward would have been delivered on short delay trials.
Firing activity (spikes/second) was analyzed on trials when rats chose the more valued well (short and big) in at least four of the last six choice trials. Cells were first categorized as being reward-related if they exhibited a significant increase (one-sided t test) in activity during the reward epoch (1.25 s) as compared with an equivalent baseline epoch (baseline activity was taken as the 1.25 s prior to well exit). These two epochs did not overlap. On average, the interval between reward onset and well exit was 5.6 s (SD = 1.7). The impact of delay (short [0.5 s] versus long [1–7 s]) on single neurons during delay blocks (Figure 1A) was measured by t test (p < 0.05) separately for each direction (Table 1A) using forced choice trials only. A similar analysis was performed for reward size (big versus small). A Pearson chi-square test (p < 0.05) was used to compare the proportions of neurons.
To determine whether activity depended on choice probability when the effects of delay length were factored out, we performed a multivariate regression analysis, fitting two models: (1) Y = a0 + a1DELAY and (2) Y = a0 + a1DELAY + a2 CHOICE PROBABILITY, where Y was the firing rate during the reward epoch described above. Data was taken from both forced choice and choice trials. The variable DELAY ranged from 500 ms to 7000 ms. The variable CHOICE PROBABILITY was determined by taking the percent choice of short over the next five choice trials. To determine whether adding the variable CHOICE PROBABILITY produced a significant improvement in performance, we compared model 2 to model 1. Significance was assessed with an F-test using
where k = 1 was the difference in degrees of freedom between the two models, n = 1 was the number of neurons, and m was the number of trials on which the analysis was based. SSfull and SSred were the residual sums of squares resulting when the data were fitted with the full model and the reduced model, respectively. The criterion for statistical significance was taken as p ≤ 0.05.
Supplementary Material
Acknowledgments
We are grateful to Drs. Michela Gallagher, Peter Holland, and Thomas Stalnaker for their comments on these data, and to Dr. Stephen Warrenburg at International Flavors and Fragrances for his assistance with obtaining odor compounds. This work was supported by grants from the NIDA (R01-DA015718, G.S.) and NINDS (T32-NS07375, M.R.R).
Footnotes
Supplemental Data The Supplemental Data for this article can be found online at http://www.neuron.org/cgi/content/full/51/4/509/DC1/.
References
- Arana FS, Parkinson JA, Hinton E, Holland AJ, Owen AM, Roberts AC. Dissociable contributions of the human amygdala and orbitofrontal cortex to incentive motivation and goal selection. J. Neurosci. 2003;23:9632–9638. doi: 10.1523/JNEUROSCI.23-29-09632.2003. [DOI] [PMC free article] [PubMed] [Google Scholar]
- Baxter MG, Parker A, Lindner CC, Izquierdo AD, Murray EA. Control of response selection by reinforcer value requires interaction of amygdala and orbital prefrontal cortex. J. Neurosci. 2000;20:4311–4319. doi: 10.1523/JNEUROSCI.20-11-04311.2000. [DOI] [PMC free article] [PubMed] [Google Scholar]
- Berns GS, McClure SM, Pagnoni G, Montague PR. Predictability modulates human brain response to reward. J. Neurosci. 2001;21:2793–2798. doi: 10.1523/JNEUROSCI.21-08-02793.2001. [DOI] [PMC free article] [PubMed] [Google Scholar]
- Cardinal RN, Cheung TH. Nucleus accumbens core lesions retard instrumental learning and performance with delayed reinforcement in the rat. BMC Neurosci. 2005;6:9. doi: 10.1186/1471-2202-6-9. [DOI] [PMC free article] [PubMed] [Google Scholar]
- Cardinal RN, Pennicott DR, Sugathapala CL, Robbins TW, Everitt BJ. Impulsive choice induced in rats by lesions of the nucleus accumbens core. Science. 2001;292:2499–2501. doi: 10.1126/science.1060818. [DOI] [PubMed] [Google Scholar]
- Cardinal RN, Winstanley CA, Robbins TW, Everitt BJ. Limbic corticostriatal systems and delayed reinforcement. Ann. N Y Acad. Sci. 2004;1021:33–50. doi: 10.1196/annals.1308.004. [DOI] [PubMed] [Google Scholar]
- Critchley HD, Rolls ET. Olfactory neuronal responses in the primate orbitofrontal cortex: analysis in an olfactory discrimination task. J. Neurophysiol. 1996;75:1659–1672. doi: 10.1152/jn.1996.75.4.1659. [DOI] [PubMed] [Google Scholar]
- Critchley HD, Mathias CJ, Dolan RJ. Neural activity in the human brain relating to uncertainty and arousal during anticipation. Neuron. 2001;29:537–545. doi: 10.1016/s0896-6273(01)00225-2. [DOI] [PubMed] [Google Scholar]
- Evenden JL, Ryan CN. The pharmacology of impulsive behaviour in rats: the effects of drugs on response choice with varying delays of reinforcement. Psychopharmacology (Berl.) 1996;128:161–170. doi: 10.1007/s002130050121. [DOI] [PubMed] [Google Scholar]
- Goto Y, Grace AA. Dopaminergic modulation of limbic and cortical drive of nucleus accumbens in goal-directed behavior. Nat. Neurosci. 2005;8:805–812. doi: 10.1038/nn1471. [DOI] [PubMed] [Google Scholar]
- Gottfried JA, O’Doherty J, Dolan RJ. Encoding predictive reward value in human amygdala and orbitofrontal cortex. Science. 2003;301:1104–1107. doi: 10.1126/science.1087919. [DOI] [PubMed] [Google Scholar]
- Groenewegen HJ, Vermeulen-Van der Zee E, te Kortschot A, Witter MP. Organization of the projections from the subiculum to the ventral striatum in the rat. A study using anterograde transport of Phaseolus vulgaris leucoagglutinin. Neuroscience. 1987;23:103–120. doi: 10.1016/0306-4522(87)90275-2. [DOI] [PubMed] [Google Scholar]
- Groenewegen HJ, Berendse HW, Wolters JG, Lohman AHM. The anatomical relationship of the prefrontal cortex with the striatopallidal system, the thalamus and the amygdala: evidence for a parallel organization. Prog. Brain Res. 1990;85:95–118. doi: 10.1016/s0079-6123(08)62677-1. [DOI] [PubMed] [Google Scholar]
- Haber SN, Kunishio K, Mizobuchi M, Lynd-Balta E. The orbital and medial prefrontal circuit through the primate basal ganglia. J. Neurosci. 1995;15:4851–4867. doi: 10.1523/JNEUROSCI.15-07-04851.1995. [DOI] [PMC free article] [PubMed] [Google Scholar]
- Herrnstein RJ. Relative and abflute strength of response as a function of frequency of reinforcement. J. Exp. Anal. Behav. 1961;4:267–272. doi: 10.1901/jeab.1961.4-267. [DOI] [PMC free article] [PubMed] [Google Scholar]
- Hikosaka K, Watanabe M. Delay activity of orbital and lateral prefrontal neurons of the monkey varying with different rewards. Cereb. Cortex. 2000;10:263–271. doi: 10.1093/cercor/10.3.263. [DOI] [PubMed] [Google Scholar]
- Ho MY, Mobini S, Chiang TJ, Bradshaw CM, Szabadi E. Theory and method in the quantitative analysis of “impulsive choice” behaviour: implications for psychopharmacology. Psychopharmacology (Berl.) 1999;146:362–372. doi: 10.1007/pl00005482. [DOI] [PubMed] [Google Scholar]
- Hsu M, Bhatt M, Adolphs R, Tranel D, Camerer CF. Neural systems responding to degrees of uncertainty in human decision-making. Science. 2005;310:1624–1625. doi: 10.1126/science.1115327. [DOI] [PubMed] [Google Scholar]
- Izquierdo AD, Suda RK, Murray EA. Bilateral orbital prefrontal cortex lesions in rhesus monkeys disrupt choices guided by both reward value and reward contingency. J. Neurosci. 2004;24:7540–7548. doi: 10.1523/JNEUROSCI.1921-04.2004. [DOI] [PMC free article] [PubMed] [Google Scholar]
- Kahneman D, Tverskey A. Choices, values, and frames. Am. Psychol. 1984;39:341–350. [Google Scholar]
- Kalenscher T, Windmann S, Diekamp B, Rose J, Gunturkun O, Colombo M. Single units in the pigeon brain integrate reward amount and time-to-reward in an impulsive choice task. Curr. Biol. 2005;15:594–602. doi: 10.1016/j.cub.2005.02.052. [DOI] [PubMed] [Google Scholar]
- Katz DB, Simon SA, Nicolelis MA. Dynamic and multimodal responses of gustatory cortical neurons in awake rats. J. Neurosci. 2001;21:4478–4489. doi: 10.1523/JNEUROSCI.21-12-04478.2001. [DOI] [PMC free article] [PubMed] [Google Scholar]
- Katz DB, Nicolelis MA, Simon SA. Gustatory processing is dynamic and distributed. Curr. Opin. Neurobiol. 2002;12:448–454. doi: 10.1016/s0959-4388(02)00341-0. [DOI] [PubMed] [Google Scholar]
- Kheramin S, Body S, Mobini S, Ho MY, Velazquez-Martinez DN, Bradshaw CM, Szabadi E, Deakin JF, Anderson IM. Effects of quinolinic acid-induced lesions of the orbital prefrontal cortex on inter-temporal choice: a quantitative analysis. Psychopharmacology (Berl.) 2002;165:9–17. doi: 10.1007/s00213-002-1228-6. [DOI] [PubMed] [Google Scholar]
- Kita H, Kitai ST. Amygdaloid projections to the frontal cortex and the striatum in the rat. J. Comp. Neurol. 1990;298:40–49. doi: 10.1002/cne.902980104. [DOI] [PubMed] [Google Scholar]
- Kolb B. Functions of the frontal cortex of the rat: a comparative review. Brain Res. Brain Res. Rev. 1984;8:65–98. doi: 10.1016/0165-0173(84)90018-3. [DOI] [PubMed] [Google Scholar]
- Krettek JE, Price JL. Projections from the amygdaloid complex to the cerebral cortex and thalamus in the rat and cat. J. Comp. Neurol. 1977;172:225–254. doi: 10.1002/cne.901720408. [DOI] [PubMed] [Google Scholar]
- Kringelbach ML. The human orbitofrontal cortex: linking reward to hedonic experience. Nat. Rev. Neurosci. 2005;6:691–702. doi: 10.1038/nrn1747. [DOI] [PubMed] [Google Scholar]
- Lipton PA, Alvarez P, Eichenbaum H. Crossmodal associative memory representations in rodent orbitofrontal cortex. Neuron. 1999;22:349–359. doi: 10.1016/s0896-6273(00)81095-8. [DOI] [PubMed] [Google Scholar]
- Lowenstein GEJ. Choice over Time. New York: Russel Sage Foundation; 1992. [Google Scholar]
- McDonald AJ. Organization of the amygdaloid projections to the prefrontal cortex and associated striatum in the rat. Neuroscience. 1991;44:1–14. doi: 10.1016/0306-4522(91)90247-l. [DOI] [PubMed] [Google Scholar]
- Mobini S, Body S, Ho MY, Bradshaw CM, Szabadi E, Deakin JF, Anderson IM. Effects of lesions of the orbitofrontal cortex on sensitivity to delayed and probabilistic reinforcement. Psychopharmacology (Berl.) 2002;160:290–298. doi: 10.1007/s00213-001-0983-0. [DOI] [PubMed] [Google Scholar]
- Montague PR, Berns GS. Neural economics and the biological substrates of valuation. Neuron. 2002;36:265–284. doi: 10.1016/s0896-6273(02)00974-1. [DOI] [PubMed] [Google Scholar]
- O’Doherty J, Kringelbach ML, Rolls ET, Hornak J, Andrews C. Abstract reward and punishment representations in the human orbitofrontal cortex. Nat. Neurosci. 2001;4:95–102. doi: 10.1038/82959. [DOI] [PubMed] [Google Scholar]
- O’Doherty J, Critchley H, Deichmann R, Dolan RJ. Dissociating valence of outcome from behavioral control in human orbital and ventral prefrontal cortices. J. Neurosci. 2003;23:7931–7939. doi: 10.1523/JNEUROSCI.23-21-07931.2003. [DOI] [PMC free article] [PubMed] [Google Scholar]
- Pickens CL, Setlow B, Saddoris MP, Gallagher M, Holland PC, Schoenbaum G. Different roles for orbitofrontal cortex and basolateral amygdala in a reinforcer devaluation task. J. Neurosci. 2003;23:11078–11084. doi: 10.1523/JNEUROSCI.23-35-11078.2003. [DOI] [PMC free article] [PubMed] [Google Scholar]
- Roesch MR, Olson CR. Neuronal activity related to reward value and motivation in primate frontal cortex. Science. 2004;304:307–310. doi: 10.1126/science.1093223. [DOI] [PubMed] [Google Scholar]
- Roesch MR, Olson CR. Neuronal activity in primate orbitofrontal cortex reflects the value of time. J. Neurophysiol. 2005;94:2457–2471. doi: 10.1152/jn.00373.2005. [DOI] [PubMed] [Google Scholar]
- Roesch MR, Stalnaker TA, Schoenbaum G. Associative encoding in anterior piriform cortex versus orbitofrontal cortex during odor discrimination and reversal learning. Cereb. Cortex. 2006 doi: 10.1093/cercor/bhk009. in press. Published online May 12, 2006. [DOI] [PMC free article] [PubMed] [Google Scholar]
- Rolls ET. The orbitofrontal cortex. Philos. Trans. R. Soc. Lond. B Biol. Sci. 1996;351:1433–1443. doi: 10.1098/rstb.1996.0128. [DOI] [PubMed] [Google Scholar]
- Rolls ET. The orbitofrontal cortex and reward. Cereb. Cortex. 2000;10:284–294. doi: 10.1093/cercor/10.3.284. [DOI] [PubMed] [Google Scholar]
- Rudebeck PH, Walton ME, Smyth AN, Bannerman DM, Rushworth MFS. Separate neural pathways process different decision costs. Nat. Neurosci. 2006 doi: 10.1038/nn1756. in press. [DOI] [PubMed] [Google Scholar]
- Saddoris MP, Gallagher M, Schoenbaum G. Rapid associative encoding in basolateral amygdala depends on connections with orbitofrontal cortex. Neuron. 2005;46:321–331. doi: 10.1016/j.neuron.2005.02.018. [DOI] [PubMed] [Google Scholar]
- Schoenbaum G, Eichenbaum H. Information coding in the rodent prefrontal cortex. I. Single-neuron activity in orbitofrontal cortex compared with that in pyriform cortex. J. Neurophysiol. 1995;74:733–750. doi: 10.1152/jn.1995.74.2.733. [DOI] [PubMed] [Google Scholar]
- Schoenbaum G, Setlow B. Cocaine makes actions insensitive to outcomes but not extinction: implications for altered orbitofrontal-amygdalar function. Cereb. Cortex. 2004;15:1162–1169. doi: 10.1093/cercor/bhh216. [DOI] [PubMed] [Google Scholar]
- Schoenbaum G, Roesch M. Orbitofrontal cortex, associative learning, and expectancies. Neuron. 2005;47:633–636. doi: 10.1016/j.neuron.2005.07.018. [DOI] [PMC free article] [PubMed] [Google Scholar]
- Schoenbaum G, Chiba AA, Gallagher M. Orbitofrontal cortex and basolateral amygdala encode expected outcomes during learning. Nat. Neurosci. 1998;1:155–159. doi: 10.1038/407. [DOI] [PubMed] [Google Scholar]
- Schoenbaum G, Chiba AA, Gallagher M. Neural encoding in orbitofrontal cortex and basolateral amygdala during olfactory discrimination learning. J. Neurosci. 1999;19:1876–1884. doi: 10.1523/JNEUROSCI.19-05-01876.1999. [DOI] [PMC free article] [PubMed] [Google Scholar]
- Schoenbaum G, Roesch MR, Stalnaker TA. Orbitofrontal cortex, decision-making and drug addiction. Trends Neurosci. 2006;29:116–124. doi: 10.1016/j.tins.2005.12.006. [DOI] [PMC free article] [PubMed] [Google Scholar]
- Shi CJ, Cassell MD. Cortical, thalamic, and amygdaloid connections of the anterior and posterior insular cortices. J. Comp. Neurol. 1998;399:440–468. doi: 10.1002/(sici)1096-9861(19981005)399:4<440::aid-cne2>3.0.co;2-1. [DOI] [PubMed] [Google Scholar]
- Thaler R. Some empirical evidence on dynamic inconsistency. Econ. Lett. 1981;8:201–207. [Google Scholar]
- Tremblay L, Schultz W. Relative reward preference in primate orbitofrontal cortex. Nature. 1999;398:704–708. doi: 10.1038/19525. [DOI] [PubMed] [Google Scholar]
- Tremblay L, Schultz W. Reward-related neuronal activity during go-nogo task performance in primate orbitofrontal cortex. J. Neurophysiol. 2000;83:1864–1876. doi: 10.1152/jn.2000.83.4.1864. [DOI] [PubMed] [Google Scholar]
- Wade TR, deWit H, Richards JB. Effects of dopaminergic drugs on delayed reward as a measure of impulsive behavior in rats. Psychopharmacology (Berl.) 2000;150:90–101. doi: 10.1007/s002130000402. [DOI] [PubMed] [Google Scholar]
- Wallis JD, Miller EK. Neuronal activity in primate dorsolateral and orbital prefrontal cortex during performance of a reward preference task. Eur. J. Neurosci. 2003;18:2069–2081. doi: 10.1046/j.1460-9568.2003.02922.x. [DOI] [PubMed] [Google Scholar]
- Winstanley CA, Theobald DE, Cardinal RN, Robbins TW. Contrasting roles of basolateral amygdala and orbitofrontal cortex in impulsive choice. J. Neurosci. 2004;24:4718–4722. doi: 10.1523/JNEUROSCI.5606-03.2004. [DOI] [PMC free article] [PubMed] [Google Scholar]
Associated Data
This section collects any data citations, data availability statements, or supplementary materials included in this article.