

Abstract
The persistent environmental contaminant and immunotoxicant, 2,3,7,8-tetrachlorodibenzo-p-dioxin (TCDD), markedly suppresses humoral immune responses. We recently reported impaired down-regulation of paired box 5 (Pax5), a repressor of B cell differentiation and concomitant suppression of the immunoglobulin M (IgM) response by TCDD in the murine CH12.LX B cell line. The objectives of the current study were to determine the impact of TCDD treatment on molecular outcomes characteristic of terminal B cell differentiation and to assess the role that Pax5 isoforms play in the suppression of B cell differentiation by TCDD. Here we show the highly abundant full-length Pax5 isoform, Pax5a, and at least two additional modestly expressed Pax5 isoforms were expressed in CH12.LX and splenic B cells. In LPS-activated B cells, all of the identified Pax5 isoforms were synchronously down-regulated and in the presence of TCDD co-treatment were abnormally and synchronously elevated, suggesting a common mechanism of regulation. Furthermore, B cell differentiation markers x-box protein 1 and major histocompatibility complex class II showed that the levels to which Pax5 was de-repressed by TCDD were sufficient to impair B cell differentiation and immunoglobulin gene expression. Confirming the involvement of Pax5, ectopic expression of Pax5a in the LPS-activated CH12.LX cells closely mimicked the suppression of the IgM response by TCDD. In summary, our results demonstrate a critical role by Pax5a in the TCDD-mediated impairment of B cell differentiation and the suppression of the humoral immune response.
Introduction
Suppression of primary humoral immune responses is one of the most sensitive sequela associated with exposure to 2,3,7,8-tetrachlorodibenzo-p-dioxin (TCDD), a ubiquitous environmental contaminant. This suppression is characterized by a striking reduction in plasma cell formation and immunoglobulin M (IgM) secretion, and is mediated through a direct effect by TCDD on B cells (Holsapple et al., 1986; Sulentic et al., 1998). TCDD serves as a ligand for the basic-helix-loop-helix/periodicity/aryl hydrocarbon receptor nuclear translocator/simpleminded family protein, aryl hydrocarbon receptor (AHR) (Hankinson, 1995). Previous studies in mice and B cell lines that differ in AHR expression demonstrated the involvement of AHR in the suppression of humoral immune responses (Vecchi et al., 1983; Kerkvliet et al., 1990; Sulentic et al., 1998; Sulentic et al., 2000). The AHR is a 95–110 kDa cytoplasmic receptor (Burbach et al., 1992) that exists as part of a multimeric complex composed of dimers of heat shock protein 90, and the AHR interactive protein (Bell and Poland, 2000; Petrulis and Perdew, 2002). Binding of TCDD to the AHR results in the dissociation of AHR from the cytosolic complex, and nuclear translocation of the receptor where it releases heat shock protein 90 subunits and undergoes dimerization with aryl hydrocarbon nuclear translocator (ARNT) (Whitelaw et al., 1995; Rowlands and Gustafsson, 1997). The interaction of the AHR/ARNT dimers with dioxin response elements within gene regulatory domains leads to changes in gene expression (Hankinson, 1995), and has been postulated to mediate many of the toxic effects produced by TCDD.
Activation by antigen or via polyclonal activators (e.g., lipopolysaccharide) induces B cells to undergo cycles of intense proliferation (i.e., clonal expansion), followed by terminal differentiation into plasma cells. Terminally differentiated plasma cells specialize in secretion of antigen-specific immunoglobulins. A number of phenotypic changes distinguish terminally differentiated plasma cells from the resting B cells (Calame et al., 2003). Notably, plasma cells exhibit diminished expression of surface proteins involved in B cell activation, one of the best characterized being major histocompatibility complex (MHC) class II (Dellabona et al., 1989). In addition, plasma cells exhibit expanded endoplasmic reticulum, increased mitochondrial mass and function, and increased ribosome content, all of which facilitate their capability for massive protein secretion (Shaffer et al., 2004). The expansion of the protein-generating machinery allows for high-level expression of immunoglobulin heavy chain (IgH), κ (Igκ)-light chain and J chain (IgJ) genes, which are then assembled into IgM pentamers and secreted from the cell. Transcription factor x-box protein 1 (XBP-1) plays a central role in the IgM secretion process by activating a battery of genes responsible for protein trafficking and secretion (Reimold et al., 2001; Shaffer et al., 2004). Expression of XBP-1, as well as MHC class II, IgH, Igκ, IgJ and many additional genes is regulated, in part, by the transcription factor paired box 5 (Pax5) (Kozmik et al., 1992); (Horcher et al., 2001); (Reimold et al., 1996); (Singh and Birshtein, 1993); (Sato et al., 2004; Rinkenberger et al., 1996). Pax5 is known to induce genes responsible for the mature B cell phenotype, while suppressing genes involved in their terminal differentiation into plasma cells. Consequently, suppression of Pax5 promotes the terminal B cell differentiation program (Nera et al., 2006).
The impairment of the functional outcome of B cell differentiation, (i.e., IgM secretion) by TCDD was previously shown to occur at TCDD concentrations that only modestly suppressed B cell proliferation, giving rise to the notion that TCDD impairs terminal B cell differentiation (Holsapple et al., 1986; Luster et al., 1988). However, little is known about the mechanism by which TCDD-mediated suppression of B cell differentiation occurs, and what other aspects of B cell differentiation, besides the IgM response, are impacted by TCDD treatment. In previous studies TCDD treatment of LPS-activated CH12.LX cells was shown to markedly reduce the mRNA levels of IgH, Igκ and IgJ as well as protein levels of XBP-1 (Yoo et al., 2004). In activated B cells treated with TCDD, Pax5 mRNA and protein levels remained abnormally elevated, and also maintained abnormally high DNA binding activity as identified in nuclear extracts (Yoo et al., 2004). In addition to transcriptional regulation, the expression of Pax5 can be modulated by mechanisms involving post-transcriptional modifications (Lin et al., 2002; Zwollo et al., 1997). Post-transcriptional splicing of Pax5 mRNA generates isoforms lacking functionally important domains, i.e. Pax5b, Pax5d, Pax5e (Zwollo et al., 1997), which have been shown to result in suppression (Pax5d) or enhancement (Pax5e) (Lowen et al., 2001) of the activity of the full length Pax5 isoform, also termed Pax5a. The objectives of the current study were to characterize the impact of TCDD treatment on molecular outcomes characteristic of terminal B cell differentiation and to assess the role that Pax5 isoforms play in the suppression of B cell differentiation by TCDD.
Methods
Chemicals
TCDD, in 100% dimethylsulfoxide (DMSO), was purchased from AccuStandard (New Heaven, CT). DMSO and LPS were purchased from Sigma (St. Louis, MO).
Mice
Virus-free, female B6C3F1mice (six weeks old) were purchased from Charles River (Portage, MI). On arrival mice were randomly grouped five per plastic cage with sawdust bedding. Mice had free access to food (Purina certified laboratory chow) and water at all times. The mouse holding rooms were maintained at 21–24 °C and 40–60% relative humidity with a 12-h light/dark cycle. All the experimental procedures and conditions were performed according to the guidelines of the All University Committee on Animal Use and Care at Michigan State University (East Lansing, MI).
Cell Line
CH12.LX B cell line was derived from the murine B cell lymphoma, CH12, which arose in B10.H-2aH-4bP/Wts mice (B10.A X B10.129) and has been previously characterized (Bishop and Haughton, 1986). CH12.LX cells were maintained in RPMI-1640 (Gibco BRL, Grand Island, NY) supplemented with 10% bovine calf serum (Hyclone, Logan, UT), 13.5 mM HEPES, 23.8 mM sodium bicarbonate, 100 units/ml penicillin, 100 μg/ml streptomycin, 2 mM L-glutamine, 0.1 mM nonessential amino acids, 1.0 mM sodium pyruvate, and 50 μM 2-mercaptoethanol. Cells (1 × 10⁵/ml) were activated with 5 μg/ml LPS, and treated with 0.01% DMSO or TCDD for indicated times.
Flow Cytometric Analysis
Cells were harvested from culture at the indicated times by centrifugation at 300 × g for 10 min at 4 °C, washed twice in ice-cold 1x HBSS and stained using BD Cytofix/Cytoperm kit (BD Pharmingen, San Diego, CA) according to the manufacturer’s instructions. Briefly, cells were incubated with 1 μg/106 cells of purified rat anti-mouse CD16/CD32 monoclonal antibody (BD Pharmingen, San Diego, CA) for 15 min at 4 °C to prevent non-specific binding, then stained with surface marker detection antibody (anti-FITC-conjugated mouse anti-mouse I-AP or anti-APC-conjugated anti-mouse CD19) or a respective isotype control (BD Pharmingen, San Diego, CA). To exclude non-viable cells, 2 μl of 7-amino-actinomycin D (7-AAD) solution (Sigma-Aldrich, St. Louis, MO) containing 1 mg 7-AAD, 50 μl methanol, 950 μl HBSS were added simultaneously with detection antibodies to the cells in 50 μl of staining buffer. The cells were then fixed, washed and maintained in staining buffer containing 10 mM actinomycin D (Sigma-Aldrich, St. Louis, MO) to prevent 7-AAD leakage from fixed cells. For the detection of nuclear Pax5 protein, cells were fixed and permeabilized prior to staining with anti-Pax5 antibody, or isotype control (Santa Cruz Biotechnologies, Santa Cruz, CA). Fluorescence detection was performed using a BD FACSCalibur flow cytometer (BD Biosciences, CA) on 10,000 viable cells per sample. Data analysis was performed using BD CellQuest Pro Software (BD Biosciences, CA).
In vitro polyclonal IgM AFC response
Single cell suspensions of splenocytes from naïve mice were adjusted to 1 × 10⁶ cells/ml in RPMI 1640 (Invitrogen, Carlsbad, CA) supplemented with 10% BCS (Hyclone, Utah), 100 units penicillin/ml, 100 μg streptomycin/ml and 50 μM 2-mercaptoethanol. Spleen cells were transferred to 48 well culture plates in 500 μl aliquots with four wells per treatment group. TCDD (3, 10 or 30 nM) and/or vehicle (0.01% DMSO) were added directly to each well in 5 μl aliquots. The splenocytes were sensitized with 10 μg/ml LPS and cultured for 3 days in a pressurized chamber at 5.0 psi containing 10% O2, 7% CO2 and 83% N2 gas mixture with continuous rocking at 37°C. Enumeration of the IgM AFC response was performed using trinitrophenol-haptenated sRBC as previously described (Kaminski and Stevens, 1992). A 100 μl aliquot of resuspended splenocytes from each well was added to a glass (12 × 75 mm) heated culture tube containing 350 μl of 0.5% dissolved agar (DIFCO, Detroit, MI) and 25 μl of indicator haptenated sRBC. Upon removal from the heated water bath, 25 μl of guinea pig complement was added, the tube vortex mixed and the cell mixture poured onto a 100 × 15 mm petri dish and immediately covered with a 45 × 50 mm glass cover slip. Upon solidification of the agar, the petri dishes were placed in a humidified 37 °C incubator overnight to allow for plaque formation. The number of splenocytes from each spleen was determined using a Coulter Counter (Beckman-Coulter, Fullerton, CA). Results are expressed as AFC/106 viable splenocytes ± SE. Splenocyte viability was measured using pronase (EMD Biosciences, San Diego, CA) as described previously (Lee et al., 1995). Briefly, after 3 days of culture, splenocytes were resuspended and 100 μl of the cell suspension was incubated with an equal volume of pronase for 10 min at 37 °C. Following the incubation, the splenocyte solution was diluted with 10 ml Isoton (Beckman-Coulter, Fullerton, CA) and the cells counted on a Coulter Counter. The percent of nonviable cells was determined by comparing the cell counts for each sample with and without pronase: (cell counts without pronase − cell counts with pronase)/(cell counts without pronase) × 100.
Purification of splenic B cells
Spleens were removed aseptically and made into a single cell suspension. B Cells were then isolated using B Cell Isolation Kit (Miltenyi Biotec Inc, Auburn, CA), following the manufacturer’s protocol. Briefly, 40 μL of MACS buffer (phosphate buffered saline solution or PBS, pH7.2, supplemented with 0.5% BSA and 2 mM EDTA, 4 °C) per 107 cells was used to suspend the splenocytes, and 10 μL of Biotin-Antibody Cocktail (Miltenyi Biotec Inc, Auburn, CA) per 107 cells was added to label non-B cells. After incubation at 4–8 °C for 10 min, 30 μL of buffer and 20 μL of Anti-Biotin Microbeads (Miltenyi Biotec Inc, Auburn, CA) per 107 cells were added. The cell suspension was incubated for another 15 min at 4–8 °C, washed with 10–20 times the labeling volume and then centrifuged at 300 × g for 5 min. The cell pellet was finally resuspended in 500 μL of buffer per 1 × 10⁸ cells, and passed through the pre-rinsed LS column (Miltenyi Biotec Inc, Auburn, CA), followed by four washes of the column with 3 mL of buffer. The entire effluent containing the purified B cell fraction was collected. The purity of the isolated B cells was evaluated using flow cytometry to enumerate the percentage of CD19+ cells through directly labeling with FITC- conjugated anti-CD19 antibody (BD Biosciences, San Jose, CA).
Real Time PCR
Total RNA was isolated from naïve or LPS-activated cells using a SV Total RNA Isolation kit (Promega, Madison, WI). To synthesize cDNA, 1,000 ng/sample of total RNA was incubated with 600 ng random primer (Invitrogen, Carlsbad, CA) in 10 μl endonuclease-free water at 70 °C for 10 min, cooled on ice for 10 min and reverse transcribed in 20 μl 1X First Strand Synthesis buffer (Invitrogen, Carlsbad, CA), containing 0.2 mM dNTPs, 10 mM DTT, and 200 U SuperScript II reverse transcriptase (Invitrogen, Carlsbad, CA). The reaction mixture was incubated at 42 °C for 60 min and the reaction was stopped by incubation at 75 °C for 15 min. Real time PCR detection was performed using TaqMan primers and probes (Table 1). The PCR cycling conditions were as follows: initial denaturation and enzyme activation for 10 min at 95°C, followed by 40 cycles of 95 °C for 15 s and 60 °C for 1 min. Detection of PCR transcripts was performed on a PE Applied Biosystems PRISM 7900HT Sequence Detection System (Foster City, CA). The absolute copy number for each of the Pax5 amplicons in naïve CH12.LX cells was calculated by standard curve method. The relative levels of Pax5 amplicons during the 72 h time course were calculated by the comparative CT method using 18S ribosomal subunit expression in order to control for differences in loading. Primers for the detection of alternative spliced XBP-1 isoforms (XBP-1s/u) were designed to span the 26-nucleotide splice site in XBP-1 mRNA (Table 1). Detection of XBP-1 spliced and unspliced forms was achieved by resolution of PCR products on a 4% agarose gel. All primers and probes were ordered from Applied Biosystems (Foster City, CA).
TABLE 1.
PCR primers and probes (5Õto 3Õ)
| Name | Forward Primer | Reverse Primer | Probe |
|---|---|---|---|
| Pax 5 (Total) | CGCCAAAACCCTACCATGTT | GGGCACAGTGTCATTGTCACA | N/A |
| Pax5, I | CCCGACTCCTCGGACCAT | AGTGGCCGTCCATTCAC
AAAA |
CTCCTCCATGTCCTGTCCTG |
| Pax5, II | CGACTCCTCGGACCATCAG | CTTCCTGTCTCATAATA
CC |
CAATCACCCCCGGCTTGA |
| Pax5, III | CGACACCAACAAACGCAA
GA |
CCGGAAGTGAGTGGCC
ATT |
ACTCCTGAATACCTTCATC
CC |
| Pax5, IV | GCATCCCCACCCGGAAT | CCTTCTGCGAGGGTTC
CA |
CACCTAGCAGGGTCTGTG |
| IgH | CAATGAGGTGCACAAACATCCA | AGCCACTGCACACTGATGTCT
G |
N/A |
| Igκ | GGAAGATTGATGGCAGTGAACG | ACTCGTCCTTGGTCAACGTGA
G |
N/A |
| J chain | TGAGACCAAAATGGTGCAAG | ACTTCTGGGTGCAAATGGAG | N/A |
| XBP-1 total | GAGCCCGGAGGAGAAAGC | TCTGCGCTGCTACTCTG
TTTT |
CTGCGGAGGAAACTG |
| XBP-1s/u | ACACGCTTGGGAATGGAC
AC |
CCATGGGAAGATGTTC
TGGG |
N/A |
Isolation of Pax5a cDNA
cDNA was obtained by PCR amplification of total RNA isolated from CH12.LX cells. Total RNA was extracted with SV Total RNA Isolation kit (Promega, Madison, WI) and first strand cDNA was synthesized by reverse transcription using a High Capacity cDNA Reverse Transcription kit (Applied Biosystems, Foster City, CA). PCR was carried out as follows: one initial denaturing step 2 min at 94 °C followed by denaturation for 30 sec at 94°C, annealing 30 sec at 58 °C and extension for 90 sec at 72 °C during 30 cycles in the presence of Pfu polymerase (Stratagene, La Jolla, CA) under the conditions suggested by the supplier (at a final primer concentration of 0.5μM). Sequences of the primers designed for this PCR reaction were: 5′-CTGTCCATTTCATCAAGTCCTGA-3′ and 5′-ACCGTCACTACCCTCAGAG-3′. The resulting PCR product of 1.2 kb was separated in 1% agarose gel electrophoresis in 1X TBE buffer and stained with ethidium bromide at 1μg/ml. The PCR fragment was eluted from agarose using the QIAquick gel extraction kit (Qiagen, Valencia, CA).
Cloning and Ectopic Expression for Pax5a cDNA
Pax5a cDNA generated as described above was inserted into the pcDNA 3.1 V5-His-TOPO vector (Invitrogen, Carlsbad, CA) according to the manufacturer’s protocol. The new Pax5a-V5-His tag vector sequence was confirmed by sequencing. Further PCR reactions, in which Pax5a-V5-His vector was used as template, were performed to generate a new Pax5a expression plasmid, Pax5a-V5-His-GFP. The primer used for 5′-end cloning was: 5′-CTC ACT ATA GGG AGA TCT AAG CTG GCT AGT-3′ (BglII restriction site is underlined); for the 3′end cloning: 5′-TGA TCA GCG GGT TTA AAA GCT TTG GGA TGG TG-3′ (HindIII restriction site is underlined). PCR products of 1.38 kb were obtained and isolated as described above. Pax-5a-V5-His PCR fragment was then cloned into the vector phCMV-C-GFP (Genlantis, San Diego, CA) by a standard ligation reaction using T4-DNA ligase (New England Biolabs, Ipswich, MA). The phCMV vector from Genlantis contains an optimized CMV promoter - intron sequences and a kanamycin/neomycin resistance gene for generation of stable cell lines.
Transfection of Pax5a-V5-His-GFP
CH12.LX cells (2.5 × 10⁶) were transfected with 5 μg of each plasmid using Amaxa Nucleofector (Amaxa Inc., Gaithersburg, MD). Cells, DNA and 100 μl of 90:20 (solution V: supplement) were mixed and electroporated using program A-20 following manufacturer’s recommendations. A total number of 2.5 × 10⁷ cells were used in each experiment. The backbone plasmid, phCMV-C-GFP, was used as a control in all transfection experiments. After electroporation, cells were incubated at 37 °C in an atmosphere of 5% CO2 for 8 h. Eight hours post transfection cells were collected and sorted by flow cytometry for GFP-expressing cells. Cells that showed fluorescence above the level of fluorescence of naïve CH12.LX cells were isolated using a BD Facs-Caliber (BD Biosciences, San Jose, CA). The isolated cells were counted, and LPS-activated for assessments of IgM secretion as determined by ELISA. An aliquot of the sorted cells was also used to prepare protein extracts in order to determinate endogenous/ectopic Pax5a levels by Western blotting and by flow cytometry.
IgM ELISA
IgM ELISA was performed as previously described (Sulentic et al., 1998). Briefly, transfected and non-transfected CH12.LX cells were aliquoted at 1 × 10⁴ cells/ml into a 48 well culture plate and activated with 5 μg/ml LPS. The supernatants collected at 48 and 72 h post LPS-activation were loaded into ELISA plates coated with goat-anti-IgM (Sigma-Aldrich, St. Louis, MO) and assayed for IgM using anti-goat-HRP-IgM secondary antibody (Sigma-Aldrich). Kinetic colorimetric detection was performed over a 1 h period using a KC-4 automated microplate reader with a 405-nm filter (Bio-Tek, Winooski, VT). The concentration of IgM in each sample was calculated from a standard curve generated from the absorbance readings of IgM standards of known concentrations and normalized to cell number. Each experimental group was assessed in quadruplicate. Treatment groups included naïve CH12.LX cells, electroporated CH12.LX cells in the absence of plasmid and CH12.LX cells electroporated in the presence of either phCMV-Pax5-GFP or phCMV-GFP (control plasmid).
Western Blotting
Proteins were extracted from transfected cells before and after sorting by flow cytometry. Protein extracts were resolved on 4–12% Nu-Page gradient gel (Invitrogen) and then transferred to a nitrocellulose membrane (Amersham-Pharmacia). Immunoblotting was performed using anti-β-actin and anti-Pax5 antibodies (Santa Cruz, Santa Cruz, CA). West Pico super signal reagent (Pierce, Rockford, IL) was used for protein detection.
Statistical Analysis of Data
Mean ± S.E. was determined for each treatment group of a given PCR or ELISA experiment. Statistical differences between groups in each experiment were determined by a two-way ANOVA followed by Bonferroni post-hoc test for PCR experiments and by a one-way ANOVA followed by Bonferroni post-hoc test for ELISA experiments.
RESULTS
TCDD decreases the levels of XBP-1 in LPS-activated B cells
Previous studies in LPS-activated CH12.LX cells demonstrated robust suppression of the humoral IgM response by TCDD, which correlated with a marked reduction in XBP-1 protein levels (Yoo et al., 2004). To extend this observation as well as to confirm that our finding was not an artifact of the CH12.LX cell model, similar studies were performed using primary mouse splenocytes. Time course studies employing real-time PCR showed that XBP-1 mRNA levels in LPS-activated spleen cells were modest at 24 h post activation and increased in a time-dependent manner over 72 h attaining a 20-fold increase when compared to freshly isolated naïve resting splenocytes (Fig. 1A). In the presence of TCDD, XBP-1 mRNA levels still increased over the 72 h time period of culture but were markedly reduced at 72 h when compared to the time matched vehicle controls. Concentration response studies were also performed at 72 h post LPS-activation in splenocytes and demonstrated a marked and concentration-dependent reduction in XBP-1 mRNA levels with TCDD treatment, when compared to the vehicle control group (Fig. 1B). Time course studies were also performed in CH12.LX cells. As observed in splenocytes, XBP-1 mRNA levels were induced in the LPS-activated cells between 24 and 72 h as compared to the time-matched naïve controls (Fig. 1C) and with TCDD treatment the LPS-induced XBP-1 mRNA levels at 48 and 72 h were significantly attenuated when compared to LPS treatment alone.
Figure 1.
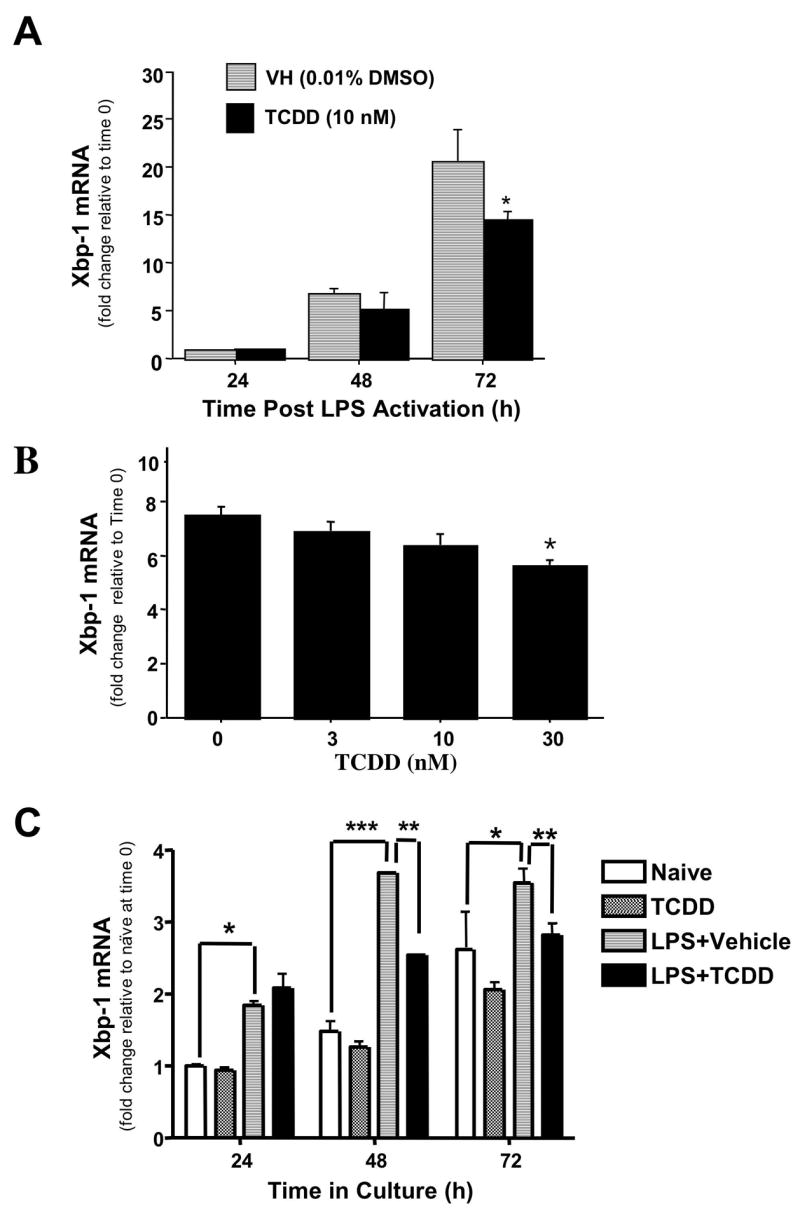
Effects of TCDD on XBP-1 mRNA levels in splenocytes and CH12.LX cells. (A) Splenocytes were activated with LPS (10 μg/ml) in the presence TCDD (10 nM) or vehicle (0.01% DMSO). Splenocytes were harvested at 24, 48 or 72 h for isolation of RNA. (B) Splenocytes were activated with LPS (10 μg/ml) in the presence TCDD (3, 10 or 30 nM) or vehicle (0.01% DMSO). Splenocytes were harvested at 72 h for isolation of RNA. C) Naïve or LPS (5 μg/ml)-activated CH12.LX cells were treated with TCDD (10 nM) or vehicle (0.01% DMSO). Cells were harvested at 24, 48 or 72 h and RNA was isolated. Quantitative RT-PCR was performed to determine the total levels of XBP-1 transcripts. 18S was used as a loading control. The fold-change in XBP-1 mRNA levels relative to naïve samples at 24 h, which was arbitrarily given the value of 1, is represented on y-axis. Results represent the mean ± S.E. of triplicate determinations in each treatment group from at least three separate experiments. Statistical significance is denoted as * p<0.05, ** p<0.01, *** p<0.001.
Additional studies were performed in order to determine whether LPS and/or TCDD treatment affects the post-transcriptional modification of XBP-1. Transcriptional activity of XBP-1 is known to be enhanced by a splicing event, which removes a 26-nt-long fragment from XBP-1 mRNA, resulting in an open reading frame shift and yielding a larger XBP-1 protein that is more potent as a transcription factor (Calfon et al., 2002). Amplification of XBP-1 mRNA from CH12.LX cells activated with LPS in the presence or absence of TCDD by PCR primers that span the splice region detected two amplicons, a 171 bp amplicon representing the unspliced (XBP-1u) and a 145 bp amplicon representing the active spliced form of XBP-1 (XBP-1s) (Fig. 2A). Two bands were observed following LPS treatment of CH12.LX cells at 24, 48 and 72 h indicating that both splice variants were present. In contrast, TCDD treatment significantly reduced the amount of the XBP-1s isoform at 48 and 72 h. Similar studies were also conducted in which mRNA levels for XBP-1u and XBP-1s were assessed at 72 h post LPS activation of splenocytes in the presence of increasing concentrations of TCDD. Due to the fact that resting primary lymphocytes cannot be maintained in a viable state for 72 h in culture, mRNA levels for XBP-1u and XBP-1s were determined in freshly isolated splenocytes at time 0 (i.e., immediately prior to LPS activation) to serve as an additional comparative control. In the resting spleen cell preparation, XBP-1u was strongly expressed with modest amounts of XBP-1s being detected (Fig. 2B). In LPS-activated splenocytes, XBP-1u continued to be the predominantly expressed form of XPB-1; however, an increase in XBP-1s was visualized when compared to resting (no LPS) splenocytes. Moreover, the magnitude of XBP-1s mRNA was attenuated with increasing concentrations of TCDD. Taken together, the results presented here demonstrate that the suppression of XBP-1 protein levels by TCDD previously reported closely correlates with the decreased level of total steady state XBP-1 mRNA and the more active XBP-1s in both CH12.LX cells and primary splenocytes.
Figure 2.
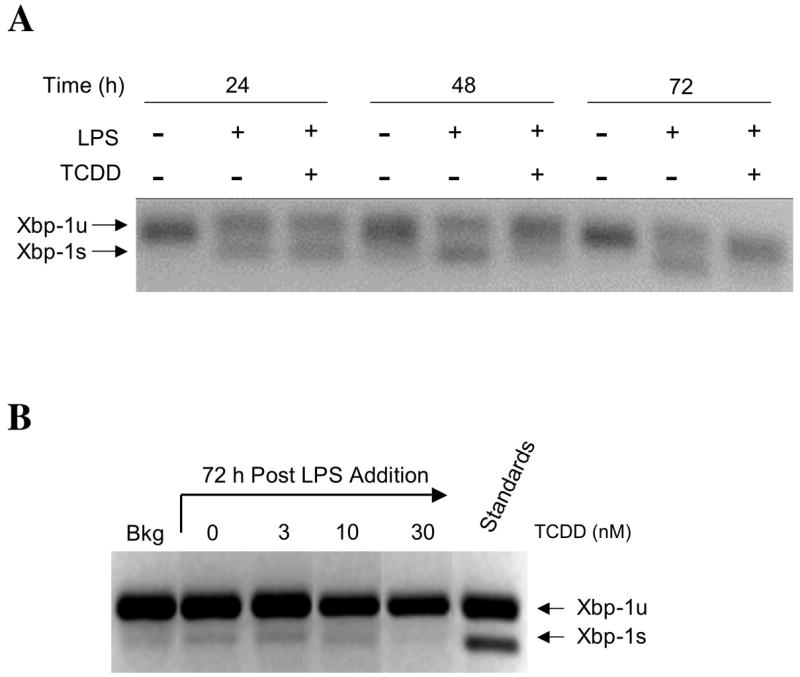
Effects of TCDD on mRNA levels of the unspliced and spliced forms of XBP1 in LPS activated CH12LX cells and splenocytes. The LPS-activated (a) CH12.LX cells and (B) splencytes were harvested at the indicated times after TCDD and/or vehicle treatment. The isolated RNA was amplified by RT-PCR using primers spanning a splicing site, and resulting XBP-1 amplicons were resolved on 4% agarose gel. Data are representative of at least three separate experiments.
TCDD attenuates cell surface MHC class II down-regulation in LPS-activated CH12.LX cells
An additional event closely associated with terminal differentiation of B cells is the down-regulation of MHC class II on the cell membrane. Levels of surface MHC class II in LPS-activated CH12.LX cells and in splenic B cells (i.e., CD19+), in presence and absence of TCDD, were monitored by flow cytometry. LPS-activation induced a down-regulation of MHC class II on the CH12.LX cell surface between 24 and 72 h of culture when compared to the time matched naïve control (Fig. 3), consistent with B cell differentiation. Conversely, TCDD treatment attenuated the LPS-induced down-regulation of MHC class II at 24 and 48 h of culture when compared to the time-matched LPS control, suggesting suppression of B cell differentiation by TCDD. Due to the differences in the peak day of the LPS-induced IgM response between CH12.LX cells (48 h) and splenic B cells (72h), MHC class II expression was assessed in primary B cells at 72 h. As in CH12.LX cells, MHC class II expression was down-regulated in response to LPS treatment, when compared to freshly isolated naïve splenic B cells (Table II). Conversely, LPS activation in the presence of TCDD resulted in the attenuation of MHC class II down-regulation, when compared to LPS-activated B cells treated with vehicle only.
Figure 3.
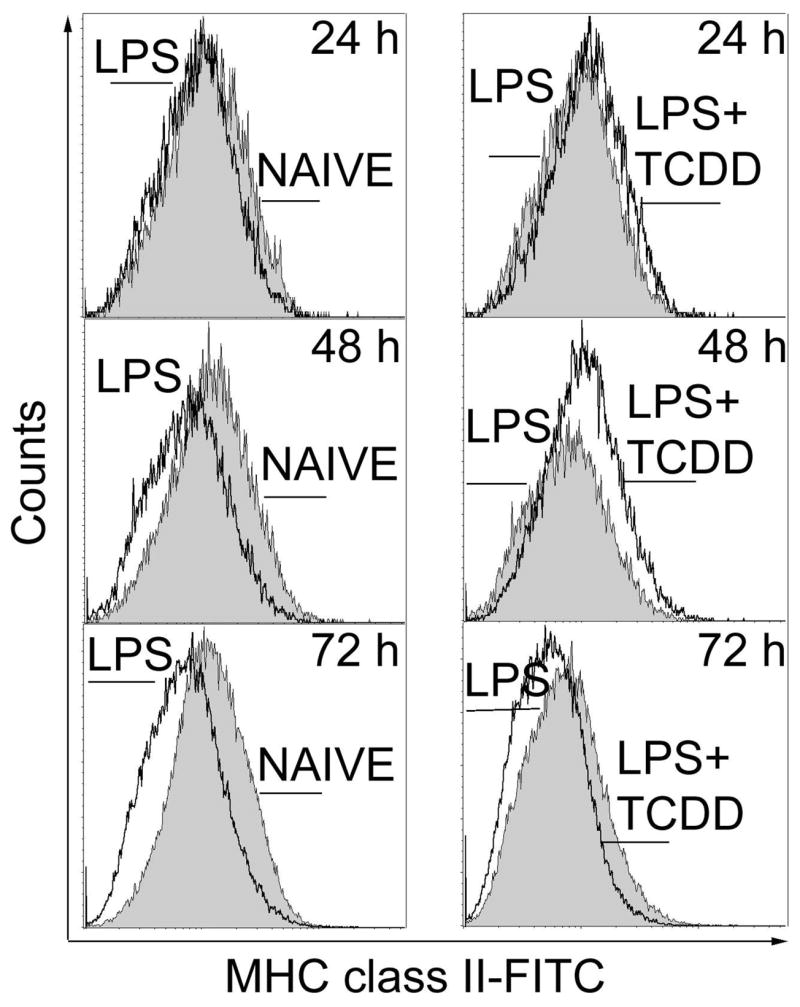
Flow cytometric analysis of cell surface expression of MHC class II protein in LPS-activated CH12.LX cells. Naïve or LPS (5 μg/ml)-activated CH12.LX cells were treated with TCDD (10 nM) or vehicle (0.01% DMSO). Cells were harvested at 24, 48 and 72 h, incubated with anti-MHC class II (I-AP)-FITC or isotype control antibodies and analyzed by flow cytometry. Results are representative of triplicate determinations in each treatment group from three separate experiments.
Table 2.
Flow cytometric analysis for surface expression of Pax5 and MHC class II proteins in LPS-activated splenocytes. LPS (10 μg/ml)-activated splenocytes were treated with TCDD (3, 10, 30 nM) or vehicle (0.01% DMSO) for 72 h. Freshly isolated resting splenocytes, signified as ‘Background’, were included as an additional comparative control. The harvested splenocytes were incubated with either anti-Pax5-FITC or isotype control antibody or anti-MHC class II (I-Ap)-FITC and anti-CD19 or appropriate isotype control antibodies and analyzed by flow cytometry. Results are representative of triplicate determinations in each treatment group from two separate experiments.
| TREATMENT | Pax5+ | I-Ap+ / CD19+ |
|---|---|---|
|
| ||
| Background | 61.9 ± 0.8 | 54.5 ± 3.2 |
| Vehicle (DMSO 0.02%) | 23.8 ± 1.1 | 30.2 ± 0.8 |
| TCDD 3 nM | 26.9 ± 1.6 | 33.4 ± 0.4 |
| 10 nM | 27.2 ± 2.1 | 34.5 ± 0.4 |
| 30 nM | 34.6 ± 0.9* | 41.9 ± 0.3* |
| Isotype Control | 1.5 | Not Detectable |
TCDD attenuates the LPS-induced down-regulation of Pax5 protein in LPS-activated CH12.LX cells
We also examined the impact of TCDD on Pax5, a repressor of B cell differentiation. Expression of Pax5 protein was characterized in splenic B cells and CH12.LX cells by flow cytometry facilitating the evaluation of individual cells in contrast to prior Western blotting studies we performed exclusively in CH12.LX cells (Yoo et al., 2004), an approach that is limited since the mean expression is determined in a large number of pooled cells. LPS-activated CH12.LX exhibited a gradual reduction in Pax5 protein between 24 and 72 h (Fig. 4). By contrast, in the CH12.LX cells that were LPS-activated in the presence of TCDD, Pax5 protein levels remained abnormally elevated compared to the time-matched LPS-activated control. Flow cytometric analysis of Pax5 in splenocytes yielded a remarkably similar profile of expression as observed in CH12.LX cells. Splenocytes when assayed 72 h post LPS activation possessed a markedly reduced number of Pax5+ cells compared to freshly isolated resting naïve spleen cells (Table II). Conversely, splenocytes that were LPS-activated in the presence of increasing concentrations of TCDD showed a concentration-dependent increase in the number of Pax5+ cells and confirm that TCDD-treatment impairs Pax5 regulation in splenic B cells as well as CH12.LX cells.
Figure 4.
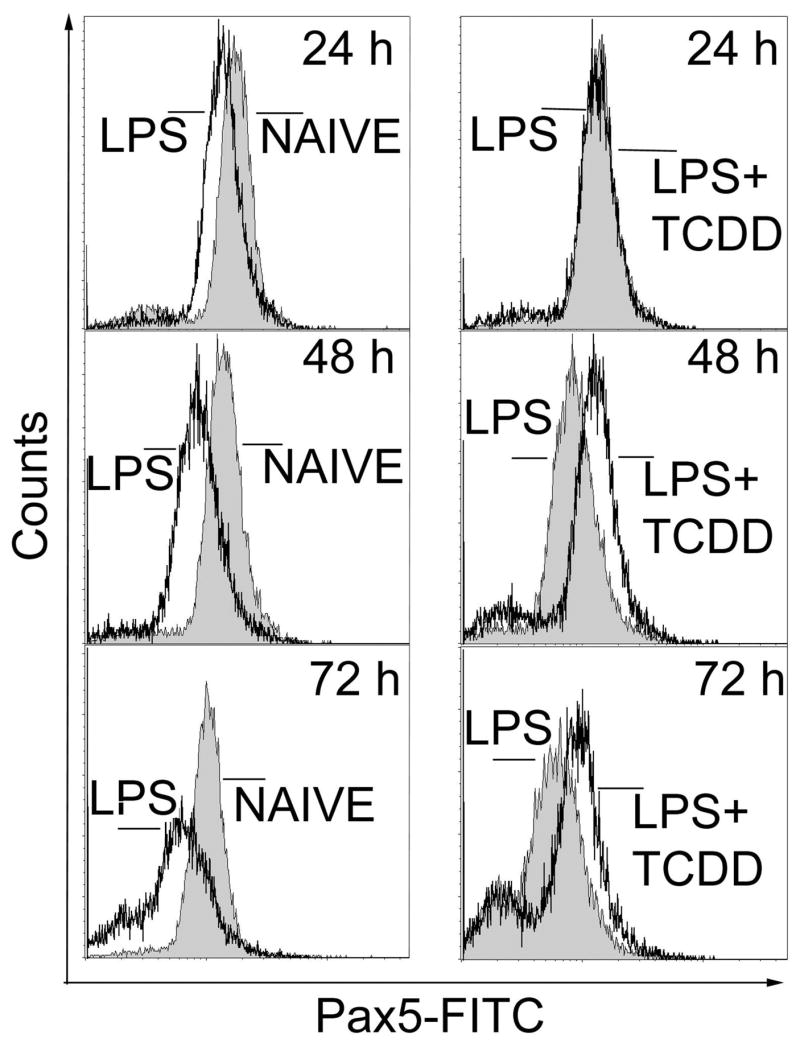
Flow cytometric analysis of Pax-5 in LPS-activated CH12.LX cells. Naïve or LPS (5 μg/ml)-activated CH12.LX cells were treated with TCDD (10 nM) or vehicle (0.01% DMSO). Cells were harvested at 24, 48 and 72 h, incubated with anti-Pax5-FITC or isotype control antibodies and analyzed by flow cytometry. Results are representative of triplicate determinations in each treatment group from three separate experiments.
Due to the fact that Pax5 is primarily regulated at the transcriptional level, real time PCR was employed to analyze the mRNA levels of Pax5 in LPS-activated spleen cells in the absence and presence of TCDD. LPS activation produced a decrease in Pax5 mRNA levels in splenocytes at 72 h (Fig. 5A). Conversely, splenocytes activated with LPS in the presence of TCDD showed a significant elevation in Pax5 mRNA levels at 48 h and 72 h when compared to the respective time-matched controls. To establish whether the elevated levels of Pax5 were in fact due to TCDD treatment, concentration responses studies were performed at 72 h post-LPS activation, as this was the time at which there was the greatest difference in Pax5 mRNA levels between vehicle and TCDD treatment. Indeed, a concentration-dependent increase in Pax5 mRNA levels was observed in TCDD-treated splenocytes, when compared to the vehicle control cells (Fig. 5B).
Figure 5.

The effects of TCDD treatment on Pax5 mRNA levels in LPS activated splenocytes. (A) Splenocytes were activated with LPS (10 μg/ml) and cultured for 24, 48 or 72 h in the presence of TCDD (10 nM) or vehicle (0.01 % DMSO). (B) Splenocytes were activated with LPS (10 μg/ml) and cultured for 72 in the presence of TCDD (3, 10 or 30 nM) and/or vehicle (0.01 % DMSO). At the end of culture, the splenocytes were harvested and mRNA isolated. Quantitative RT-PCR was performed to determine the total levels of Pax5 transcripts. 18S was used as a loading control. The fold-change in Pax5 mRNA levels relative to naïve samples at 24 h, which was arbitrarily given the value of 1, is represented on y-axis. Results represent the mean ± S.E. of triplicate determinations in each treatment group from at least two separate experiments. Statistical significance is denoted as * p<0.05.
Characterization of Pax5 isoforms in CH12.LX cells
In light of the altered Pax5 expression observed by flow cytometry and by real-time PCR, studies were undertaken to further characterize the effect of TCDD on Pax5 regulation. Specifically, we examined the role of the alternative splicing in the deregulation of Pax5 by TCDD (Fig. 6A). PCR primers and Taqman probe sets were designed to differentially spliced regions in Pax5 mRNA to determine whether the aforementioned splice events occur in CH12.LX cells and in purified splenic B cells (Fig. 6B). In naïve CH12.LX cells and primary B cells four distinct Pax5 amplicons, I, II, III and IV, representative of at least three Pax5 isoforms, were detected (Fig. 6C). Furthermore, the expression of amplicons I and III was approximately one hundred-fold greater than the expression of amplicons II and IV, demonstrating that Pax5a is the major isoform expressed in resting CH12.LX cells and primary B cells. Equally notable was the remarkable similarity between splenic B cells and CH12.LX cells in their profiles of mRNA levels for each of the Pax5 isoforms.
Fig. 6.

Characterization of Pax5 isoforms in purified splenic B cells or CH12.LX cells. A) Structure of Pax5 isoforms that have been previously characterized in B cells (Zwollo et al., 1997). B) Location of TaqMan primers and probes utilized for the detection of Pax5 amplicons I, II, III and IV in CH12.LX cells. C) Four Pax5 splice variants, identified by amplicons I, II, III and IV, are present in resting splenic B cells and CH12.LX cells. Total mRNA from naïve CH12.LX cells was analyzed by quantitative RT-PCR. Copy number was determined for each amplicon using amplicon standard curves. Results represent the mean ± S.E. of triplicate determinations in each treatment group from two separate experiments.
Additional studies performed in CH12.LX cells showed that the levels of amplicons I, II and III were down-regulated by LPS between 24 and 72 h, as determined by real-time quantitative PCR (Fig. 7). Conversely, in presence of 10 nM TCDD, a concentration that produces approximately 50% suppression of the LPS-induced IgM response with no effect on CH12.LX cell viability (Yoo et al., 2004), amplicons I, II and III were abnormally elevated at 48 and 72 h when compared with the time-matched LPS-activated control. Amplicon IV, representative of the Pax5 novel sequence, was suppressed by LPS-activation at 24 h, but the effect of LPS at 48 and 72 h and the effect of TCDD between 24 and 72 h were not significant. Collectively, the synchronous temporal profile of expression for Pax5 amplicons I, II, III and IV ruled out post-transcriptional regulation of the Pax5 gene by alternative splicing at exon 2 or exons 6–10 as a result of LPS-activation or TCDD treatment, and identified Pax5a as the most abundant Pax5 isoform in B cells.
Figure 7.

Levels of Pax5 amplicons I, II, III and IV in LPS-activated CH12.LX cells are altered by TCDD treatment. CH12.LX cells were activated with LPS (5 μg/ml) in the presence of TCDD (10 nM) or vehicle (0.01% DMSO), harvested at the indicated times post LPS-activation and analyzed for the levels of Pax5 amplicons I (A), II (B), III (C) and IV (D) (as defined in figure legend 6). 18S ribosomal subunit amplification was used as a loading control. The fold-change in Pax5 transcript levels relative to untreated samples at 24 h, which was arbitrarily given the value of 1, is represented on y-axis. Results represent the mean ±S.E. of triplicate determinations in each treatment group from at least three separate experiments. Statistical significance was determined using a two-way ANOVA and Bonferroni post-hoc test. Statistical significance is denoted as * p<0.05, ** p<0.01, *** p<0.001.
The effect of TCDD treatment on IgH, Igκ and IgJ, three downstream targets of Pax5-mediated repression
If dysregulation of Pax5 is mechanistically involved in the TCDD-mediated suppression of the IgM response, as suggested due to the lack of adequate Pax5 down-regulation, a similar profile of suppressed both in magnitude and kinetics would be expected in IgH, Igκ and IgJ mRNA levels due to TCDD treatment since Pax5 has been proposed to coordinately and simultaneously repress all three chains of the IgM molecule. A time course analysis of IgH, Igκ and IgJ mRNA levels post LPS activation of splenocytes, in the presence and absence of TCDD, revealed a strikingly similar profile for all three components of IgM. During the 72 h time period post LPS treatment there was a time-dependent increase in IgH, Igκ and IgJ mRNA levels in the control splenocytes, which were decreased at 72 h in TCDD-treated cells (Fig 8). In addition, concentration response analyses with TCDD were performed at 72 h post LPS activation of splenocytes. These studies showed a concentration-dependent suppression of IgH, Igκ and IgJ mRNA levels which was strikingly similar in magnitude for all three chains of the IgM molecule and once again correlated closely with the suppression of plasma cell formation (Fig. 9 A and B).
Figure 8.

Time-dependent effects of TCDD treatment on IgH, Igκ and IgJ chain mRNA levels in LPS activated splenocytes. Splenocytes were activated with LPS (10 μg/ml) and cultured for 24, 48 or 72 h in the presence of TCDD (10 nM) or vehicle (0.01 % DMSO). At the end of culture, splenocytes were harvested and mRNA isolated. Quantitative RT-PCR was performed to determine the total levels of Pax5 transcripts. 18S was used as a loading control. The fold-change in IgH, Igκ and IgJ chain mRNA levels, relative to naïve samples at 0 h, which was arbitrarily given the value of 1, is represented on y-axis. Results represent the mean ± S.E. of triplicate determinations in each treatment group from at least two separate experiments. Statistical significance is denoted as * p<0.05.
Figure 9.

Concentration-dependent effects of TCDD treatment on IgH, Igκ and IgJ chain mRNA levels and the IgM antibody forming cell response in LPS activated splenocytes. Splenocytes were activated with LPS (10 μg/ml) and cultured for 72 in the presence of TCDD (3, 10 or 30 nM) and/or vehicle (0.01 % DMSO). At the end of culture, the splenocytes were harvested and (A) mRNA isolated or (B) assayed for IgM AFCs. Quantitative RT-PCR was performed to determine the total levels of IgH, Igκ and IgJ chain transcripts. 18S was used as a loading control. The fold-change in Pax5 mRNA levels, relative to naïve samples at 0 h, which was arbitrarily given the value of 1 and is represented on y-axis. Results represent the mean ± S.E. of triplicate determinations in each treatment group. Statistical significance is denoted as * p<0.05. For the plaque assay, The splenocytes were harvested from quadruplicate cultures enumerating for number of AFC; spleen cell viability and total recovered cells/culture were also determined. The results from quadruplicate determinations are expressed as the mean AFC per 106 recovered viable cells ± SE. *p < 0.05. The results are representative of duplicate independent experiments.
Ectopic expression of Pax5a suppressed LPS-induced IgM secretion by CH12.LX cells
As proof of principle to confirm that the abnormal elevation of Pax5 levels, specifically Pax5a, observed in CH12.LX cells when activated in the presence of TCDD is a crucial molecular event in the suppression of B cell differentiation and IgM production by TCDD, CH12.LX cells were transiently transfected with a Pax5a expression plasmid, phCMV-Pax5a-GFP, or with a vector control, phCMV-GFP, and assayed for LPS-induced IgM secretion. To select for the ectopic Pax5a-expressing cells we enriched by sorting for the GFP positive using flow cytometry. The GFP-positive cells were then LPS-activated and assayed at 48 h for supernatant IgM, the peak time of IgM secretion for CH12.LX cells. Elevated Pax5 expression in transfected CH12.LX cells was confirmed by flow cytometry and by Western blotting. CH12.LX cells transfected with phCMV-Pax5a-GFP plasmid showed a shift in the peak fluorescence intensity, identifying a second population of CH12.LX cells expressing Pax5a-GFP fusion protein (Fig. 10A). In figure 10B endogenous Pax5 protein was identified as a 48 kDa immunoreactive band. A Pax5a-GFP 77 kDa immunoreactive band was detected only in the sorted and non-sorted CH12.LX cells transfected with phCMV-Pax5a-GFP (lanes 3 and 5). Due to the small amount of sample obtained after the sorting step, endogenous Pax5 protein levels were less visible in lanes 4 and 5, but were both concordant with the β-actin levels observed for each sample. The suppression of IgM secretion by ectopic expression of Pax5a-GFP was confirmed by measuring supernatant IgM using an ELISA (Fig. 10B). CH12.LX cells ectopically expressing Pax5a showed a greater than 90% suppression of the LPS-induced IgM response when compared to GFP expressing control cells (Fig. 10C). In addition, electroporation or transient transfection with the vector control, phCMV-GFP, did not affect the levels of IgM secreted by CH12.LX cells in response to LPS-activation.
Figure 10.
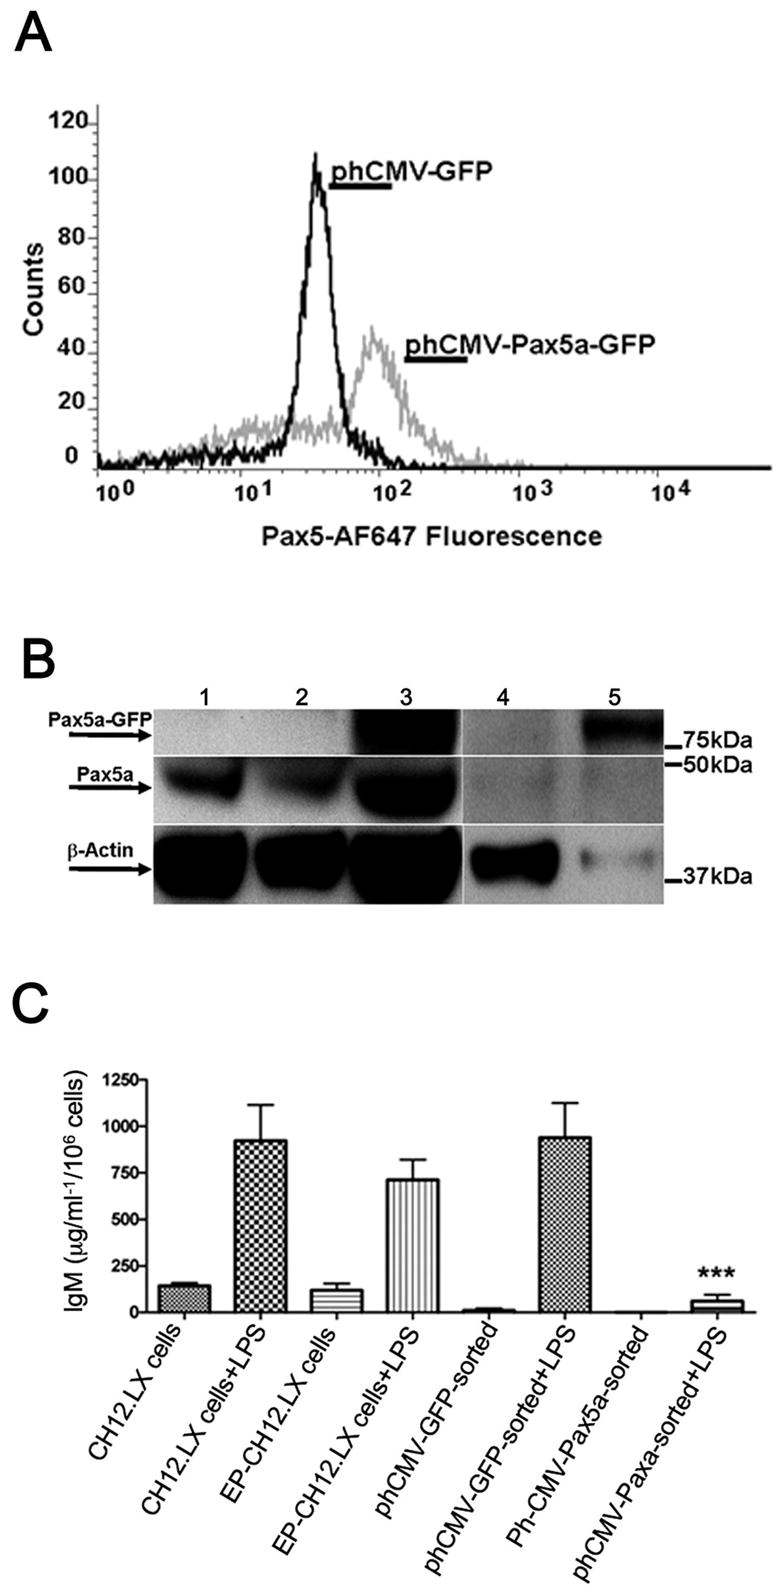
Ectopic expression of Pax5a-GFP in CH12.LX cells suppressed the IgM response. CH12.LX cells were transfected with phCMV-Pax5a-GFP plasmid or phCMV-GFP plasmid control by electroporation. Cell cultures were harvested 8 h post transfection and enriched for GFP-positive cells by flow cytometry. A) Pax5 protein expression in GFP-enriched cultures was determined by immunofluorescent staining with anti-Pax5-AF-647 antibody. B) Pax5a-GFP expression was demonstrated by Western blotting using anti-Pax5 and anti-β-actin antibodies. Experimental groups are: lane 1 - CH12.LX cells; lane 2 - CH12.LX cells transfected with phCMV-GFP, non-sorted; lane 3 - CH12.LX cells transfected with phCMV-Pax5a-GFP non-sorted; lane 4 - CH12.LX cells transfected with phCMV-GFP, sorted; lane 5 - CH12.LX cells transfected with phCMV-Pax5a-GFP sorted. Immunoreactive bands were detected for endogenous Pax5 (~ 48kDa), ectopically expressed Pax5a-GFP (~ 77kDa) and β-actin (~ 38kDa), a loading control. C) IgM ELISA was performed in CH12.LX cells transfected with the Pax5a-GFP plasmid post activation with LPS (5 μg/ml). Naïve and electroporated (EP) CH12.LX cells were used as transfection control. Results represent the mean ± S.E. of quadruplicate determinations in each treatment group from at least three separate experiments. Statistical significance is denoted as *** p<0.001.
Discussion
The suppression of humoral immune responses is one of the most sensitive sequela associated with TCDD exposure. Previous studies have demonstrated that B cells are directly targeted by TCDD (Holsapple et al., 1986; Sulentic et al., 1998) and that the AHR is required for suppression of the IgM response (Vecchi et al., 1983; Kerkvliet et al., 1990; Sulentic et al., 1998). However, the molecular mechanism responsible for the suppression of humoral immune responses by TCDD remains undeciphered. The present findings support the hypothesis that suppression of the IgM response by TCDD occurs, at least in part, due to altered regulation of the transcriptional repressor of B cell differentiation, Pax5. Here we demonstrate that TCDD treatment induces de-repression of the prevalent Pax5 isoform, Pax5a, while concomitantly altering B cell differentiation as assessed by two distinct markers XBP-1 and MHC class II, as well as by direct measurements of B cell differentiation including mRNA levels for the immunoglobulin genes, IgH, Igκ and IgJ chain, IgM secretion and enumeration of plasma cell formation. Moreover, we provide direct evidence showing that abnormal elevation of Pax5a in CH12.LX cells, by ectopic expression, mimics the effects produced by TCDD as demonstrated by robust suppression of the LPS-induced IgM response.
As B cells terminally differentiate into plasma cells, their secretory capacity dramatically increases, a process involving the induction of XBP-1, especially its most active form, the splice variant, XBP-1s (Reimold et al., 2001). By monitoring the expression of XBP-1 and MHC class II we were able to assess the extent of differentiation in LPS-activated primary B cells and in CH12.LX cells after TCDD treatment while also characterizing whether the mechanistic aspects of B cell differentiation represented by these factors are altered by TCDD treatment. Indeed, both the XBP-1 and XBP-1s, were induced in LPS-activated B cells consistent with B cell differentiation. Conversely, LPS-activated B cells treated with TCDD, showed marked suppression of XBP-1, total XBP-1, XBP-1u and XBP-1s. Suppression of XBP-1u and XBP-1s was concordant with the abnormally elevated levels of the direct upstream regulator of the XBP-1 gene, Pax5 that was detected in the presence of TCDD. These results are in agreement with the previously reported suppression of XBP-1 at the protein level by TCDD (Yoo et al., 2004) and suggest repressed transcription of XBP-1 in LPS-activated B cell in the presence of TCDD.
During terminal differentiation the molecular components of the B cell activation pathway, such as CD19 and MHC class II are down-regulated (de Rie et al., 1989; Dellabona et al., 1989), as plasma cells are insensitive to antigenic activation. In fact, terminally differentiated B cells can be discriminated from undifferentiated B cells by a marked reduction in their expression of MHC class II (Dellabona et al., 1989). The dependence of MHC class II expression on Pax5 has been previously demonstrated, as Pax5-deficient cells express surface MHC class II at abnormally low levels (Horcher et al., 2001). In splenic B cells as well as in CH12.LX cells we consistently observed that TCDD treatment impaired LPS-induced down-regulation of surface MHC class II expression. In CH12.LX cells, the attenuated down-regulation of MHC class II was apparent as early as 24 h and persisted throughout the 48 h culture period. In splenic B cells, TCDD-mediated attenuation most pronounced at 72 h after LPS-activation. The impairment of MHC class II down-regulation again is mechanistically consistent with the elevated Pax5 levels observed in this study and our working hypothesis that TCDD impairs B cell differentiation.
In order to gain greater insight into the putative role of Pax5 in TCDD-induced suppression of B cell differentiation, a PCR-based approach was used to determine which Pax5 isoforms were expressed and whether TCDD treatment can differentially regulate these isoforms. Our rationale for this approach was based on the fact that post-transcriptional splicing of Pax5 mRNA generates isoforms lacking functional domains, i.e. Pax5b, Pax5d, Pax5e (Zwollo et al., 1997), which have been shown to suppress (Pax5d) or enhance (Pax5e) (Lowen et al., 2001) the activity of the full length Pax5a. Indeed, the expression of multiple Pax5 isoforms was identified in splenic B cells and CH12.LX cells and yielded two important observations. First, in LPS-activated TCDD-treated B cells, the kinetic profiles of all Pax5 isoforms after TCDD treatment were very similar, indicating a common mechanism of modulation by TCDD. Second, in naïve, as well as in LPS-activated and/or TCDD-treated B cells, Pax5a remained the most abundant of all of the Pax5 isoforms detected. In fact, the present PCR analysis demonstrates that in comparison to the full length Pax5a, which has been implicated in the transcriptional repression of IgH (Singh and Birshtein, 1993; Neurath et al., 1994), IgJ (Rinkenberger et al., 1996), Igκ (Weaver and Baltimore, 1987; Sato et al., 2001), XBP-1 (Reimold et al., 1996) and MHC class II (Horcher et al., 2001) genes, Pax5 isoforms, Pax5b, Pax5d and Pax5e, are minor constituents of the Pax5 cellular pool in splenic B cells and CH12.LX cells. It is also notable that the profile of Pax5 isoform expression was strikingly similar between CH12.LX cells and splenic B cells. To further confirm the critical role of elevated Pax5 levels in the suppression of the IgM response by TCDD, transient transfection experiments were performed in which ectopic Pax5a was expresses in CH12.LX. The sustained elevation of Pax5a achieved through ectopic expression in CH12.LX cells mimicked the suppression of the LPS-induced IgM response produced by TCDD. These findings are consistent with the observation that in TCDD-treated B cells, concomitant with elevated Pax5 levels, there is a significant decrease not only in IgM secretion and plasma cell formation, but also a marked attenuation in the LPS induction of mRNA levels for IgH, Igκ and IgJ chains.
The importance of Pax5 dysregulation by TCDD, beyond suppression of the IgM response, is presently unclear; however, it is noteworthy that Pax5 has been implicated in B lymphomagenesis, which is characterized by uncontrolled proliferation of lymphoid precursors that have failed to complete their differentiation program (Krenacs et al., 1998; Yu et al., 2003; Cozma et al., 2007). In fact, Pax5 has been found to be highly expresses in most non-Hodgkin’s lymphomas while in very few acute leukemias. Kernancs and co-workers reported that of 102 B cell non-Hodgkin’s lymphomas examined, 83 were positive for nuclear Pax5 with high levels of nuclear Pax5 especially associated with large-cell lymphomas (Krenacs et al., 1998). The specific mechanism responsible for Pax5 overexpression in B cell lymphomas has been associated, at least in part, with mutations in regulatory sequences surrounding exon-1B. It is presently unclear whether exposure to TCDD can lead to sustained Pax5 elevation in B cells and their precursors (Gaidano et al., 2003). Nevertheless, the findings by Kernancs and coworkers are intriguing in light of several epidemiological studies reporting a positive, although in most cases a weak, association between non-Hodgkin’s lymphomas and exposure to certain classes of chemicals including phenoxyacetic acids, chlorophenols, dioxins, dibenzofurans and polychlorinated biphenyls (Rothman et al., 1997; Hardell et al., 1998; Viel et al., 2000; Floret et al., 2003; Engel et al., 2007).
In summary, this investigation shows that at concentrations of TCDD that produce a marked suppression of the IgM response, there is an attenuation of MHC class II down-regulation as well as impaired up-regulation of XBP-1, both of which are hallmarks of B cell differentiation. Concomitant with this TCDD-mediated impairment in the B cell differentiation program there is synchronous elevated expression of all Pax5 isoforms with the full-length isoform, Pax5a, being most abundant. We further show that transient expression of ectopic Pax5a strongly suppressed IgM secretion in CH12.LX cells. Also notable were the similarities observed in all of the responses measured in this current report when comparing splenic B cells and the CH12.LX cells, a cell line that has been widely used for studies of B cell differentiation and which we have used for elucidating the effects of TCDD on impairment of B cell differentiation. What is presently unclear and the focus of our ongoing investigations is whether dysregulation of Pax5 by TCDD is mediated directly by the AHR via regulatory regions within the Pax5 gene or whether it is through effects on upstream regulators of Pax5. Collectively, these studies demonstrate that the suppression of the IgM response by TCDD is due, at least in part, to the impairment of B cell differentiation by dysregulation of Pax5 resulting in high-level expression of the Pax5a isoform, a potent repressor of XBP-1, IgH, Igκ and the IgJ chain.
Acknowledgments
We thank Dr. Barbara L.F. Kaplan for critical review of this manuscript and Kimberly Hambleton for assistance in the submission of this manuscript for publication.
This work was supported by NIH grants R01ES2520-22, T32ES07255-17 and P42ES04911.
Abbreviations
- TCDD
2,3,7,8-tetrachlorodibenzo-p-dioxin
- LPS
lipopolysaccharide
- Pax5
paired box gene 5
- XBP-1
X-box protein-1
- MHC
major histocompatibility complex
- CD
cluster of differentiation
- PCR
polymerase chain reaction
- EMSA
electrophoretic mobility shift assay
- ELISA
enzyme-linked immunosorbent assay
- DRE
dioxin response element
- AHR
aryl hydrocarbon receptor
- IgH
immunoglobulin heavy chain
- Igκ
immunoglobulin κ light chain
- IgJ
immunoglobulin joining chain
- 7-AAD
7-aminoactinomycin-D
- ARNT
aryl hydrocarbon nuclear translocator
References
- Bell DR, Poland A. Binding of aryl hydrocarbon receptor (AhR) to AhR-interacting protein. The role of hsp90. J Biol Chem. 2000;275:36407–36414. doi: 10.1074/jbc.M004236200. [DOI] [PubMed] [Google Scholar]
- Bishop GA, Haughton G. Induced differentiation of a transformed clone of Ly-1+ B cells by clonal T cells and antigen. Proc Natl Acad Sci U S A. 1986;83:7410–7414. doi: 10.1073/pnas.83.19.7410. [DOI] [PMC free article] [PubMed] [Google Scholar]
- Burbach KM, Poland A, Bradfield CA. Cloning of the Ah-receptor cDNA reveals a distinctive ligand-activated transcription factor. Proc Natl Acad Sci U S A. 1992;89:8185–8189. doi: 10.1073/pnas.89.17.8185. [DOI] [PMC free article] [PubMed] [Google Scholar]
- Calame KL, Lin KI, Tunyaplin C. Regulatory mechanisms that determine the development and function of plasma cells. Annu Rev Immunol. 2003;21:205–230. doi: 10.1146/annurev.immunol.21.120601.141138. [DOI] [PubMed] [Google Scholar]
- Calfon M, Zeng H, Urano F, Till JH, Hubbard SR, Harding HP, Clark SG, Ron D. IRE1 couples endoplasmic reticulum load to secretory capacity by processing the XBP-1 mRNA. Nature. 2002;415:92–96. doi: 10.1038/415092a. [DOI] [PubMed] [Google Scholar]
- Cozma D, Yu D, Hodawadekar S, Azvolinsky A, Grande S, Tobias JW, Metzgar MH, Paterson J, Erikson J, Marafioti T, Monroe JG, Atchison ML, Thomas-Tikhonenko A. B cell activator PAX5 promotes lymphomagenesis through stimulation of B cell receptor signaling. J Clin Invest. 2007;117:2602–2610. doi: 10.1172/JCI30842. [DOI] [PMC free article] [PubMed] [Google Scholar]
- de Rie MA, Schumacher TN, van Schijndel GM, van Lier RA, Miedema F. Regulatory role of CD19 molecules in B-cell activation and differentiation. Cell Immunol. 1989;118:368–381. doi: 10.1016/0008-8749(89)90385-7. [DOI] [PubMed] [Google Scholar]
- Dellabona P, Latron F, Maffei A, Scarpellino L, Accolla RS. Transcriptional control of MHC class II gene expression during differentiation from B cells to plasma cells. J Immunol. 1989;142:2902–2910. [PubMed] [Google Scholar]
- Engel LS, Laden F, Andersen A, Strickland PT, Blair A, Needham LL, Barr DB, Wolff MS, Helzlsouer K, Hunter DJ, Lan Q, Cantor KP, Comstock GW, Brock JW, Bush D, Hoover RN, Rothman N. Polychlorinated biphenyl levels in peripheral blood and non-Hodgkin’s lymphoma: a report from three cohorts. Cancer Res. 2007;67:5545–5552. doi: 10.1158/0008-5472.CAN-06-3906. [DOI] [PubMed] [Google Scholar]
- Floret N, Mauny F, Challier B, Arveux P, Cahn JY, Viel JF. Dioxin emissions from a solid waste incinerator and risk of non-Hodgkin lymphoma. Epidemiology. 2003;14:392–398. doi: 10.1097/01.ede.0000072107.90304.01. [DOI] [PubMed] [Google Scholar]
- Gaidano G, Pasqualucci L, Capello D, Berra E, Deambrogi C, Rossi D, Maria Larocca L, Gloghini A, Carbone A, Dalla-Favera R. Aberrant somatic hypermutation in multiple subtypes of AIDS-associated non-Hodgkin lymphoma. Blood. 2003;102:1833–1841. doi: 10.1182/blood-2002-11-3606. [DOI] [PubMed] [Google Scholar]
- Hankinson O. The aryl hydrocarbon receptor complex. Annu Rev Pharmacol Toxicol. 1995;35:307–340. doi: 10.1146/annurev.pa.35.040195.001515. [DOI] [PubMed] [Google Scholar]
- Hardell L, Lindstrom G, van Bavel B, Fredrikson M, Liljegren G. Some aspects of the etiology of non-Hodgkin’s lymphoma. Environ Health Perspect. 1998;106 Suppl 2:679–681. doi: 10.1289/ehp.98106679. [DOI] [PMC free article] [PubMed] [Google Scholar]
- Holsapple MP, Dooley RK, McNerney PJ, McCay JA. Direct suppression of antibody responses by chlorinated dibenzodioxins in cultured spleen cells from (C57BL/6 x C3H)F1 and DBA/2 mice. Immunopharmacology. 1986;12:175–186. doi: 10.1016/0162-3109(86)90001-9. [DOI] [PubMed] [Google Scholar]
- Horcher M, Souabni A, Busslinger M. Pax5/BSAP maintains the identity of B cells in late B lymphopoiesis. Immunity. 2001;14:779–790. doi: 10.1016/s1074-7613(01)00153-4. [DOI] [PubMed] [Google Scholar]
- Kaminski NE, Stevens WD. The role of metabolism in carbon tetrachloride-mediated immunosuppression. In vitro studies. Toxicology. 1992;75:175–188. doi: 10.1016/0300-483x(92)90156-9. [DOI] [PubMed] [Google Scholar]
- Kerkvliet NI, Steppan LB, Brauner JA, Deyo JA, Henderson MC, Tomar RS, Buhler DR. Influence of the Ah locus on the humoral immunotoxicity of 2,3,7,8-tetrachlorodibenzo-p-dioxin: evidence for Ah-receptor-dependent and Ah-receptor-independent mechanisms of immunosuppression. Toxicol Appl Pharmacol. 1990;105:26–36. doi: 10.1016/0041-008x(90)90356-y. [DOI] [PubMed] [Google Scholar]
- Kozmik Z, Wang S, Dorfler P, Adams B, Busslinger M. The promoter of the CD19 gene is a target for the B-cell-specific transcription factor BSAP. Mol Cell Biol. 1992;12:2662–2672. doi: 10.1128/mcb.12.6.2662. [DOI] [PMC free article] [PubMed] [Google Scholar]
- Krenacs L, Himmelmann AW, Quintanilla-Martinez L, Fest T, Riva A, Wellmann A, Bagdi E, Kehrl JH, Jaffe ES, Raffeld M. Transcription factor B-cell-specific activator protein (BSAP) is differentially expressed in B cells and in subsets of B-cell lymphomas. Blood. 1998;92:1308–1316. [PubMed] [Google Scholar]
- Lee M, Yang KH, Kaminski NE. Effects of putative cannabinoid receptor ligands, anandamide and 2-arachidonyl-glycerol, on immune function in B6C3F1 mouse splenocytes. J Pharmacol Exp Ther. 1995;275:529–536. [PubMed] [Google Scholar]
- Lin KI, Angelin-Duclos C, Kuo TC, Calame K. Blimp-1-dependent repression of Pax-5 is required for differentiation of B cells to immunoglobulin M-secreting plasma cells. Mol Cell Biol. 2002;22:4771–4780. doi: 10.1128/MCB.22.13.4771-4780.2002. [DOI] [PMC free article] [PubMed] [Google Scholar]
- Lowen M, Scott G, Zwollo P. Functional analyses of two alternative isoforms of the transcription factor Pax-5. J Biol Chem. 2001;276:42565–42574. doi: 10.1074/jbc.M106536200. [DOI] [PubMed] [Google Scholar]
- Luster MI, Germolec DR, Clark G, Wiegand G, Rosenthal GJ. Selective effects of 2,3,7,8-tetrachlorodibenzo-p-dioxin and corticosteroid on in vitro lymphocyte maturation. J Immunol. 1988;140:928–935. [PubMed] [Google Scholar]
- Nera KP, Kohonen P, Narvi E, Peippo A, Mustonen L, Terho P, Koskela K, Buerstedde JM, Lassila O. Loss of Pax5 promotes plasma cell differentiation. Immunity. 2006;24:283–293. doi: 10.1016/j.immuni.2006.02.003. [DOI] [PubMed] [Google Scholar]
- Neurath MF, Strober W, Wakatsuki Y. The murine Ig 3′ alpha enhancer is a target site with repressor function for the B cell lineage-specific transcription factor BSAP (NF-HB, S alpha-BP) J Immunol. 1994;153:730–742. [PubMed] [Google Scholar]
- Petrulis JR, Perdew GH. The role of chaperone proteins in the aryl hydrocarbon receptor core complex. Chem Biol Interact. 2002;141:25–40. doi: 10.1016/s0009-2797(02)00064-9. [DOI] [PubMed] [Google Scholar]
- Reimold AM, Iwakoshi NN, Manis J, Vallabhajosyula P, Szomolanyi-Tsuda E, Gravallese EM, Friend D, Grusby MJ, Alt F, Glimcher LH. Plasma cell differentiation requires the transcription factor XBP-1. Nature. 2001;412:300–307. doi: 10.1038/35085509. [DOI] [PubMed] [Google Scholar]
- Reimold AM, Ponath PD, Li YS, Hardy RR, David CS, Strominger JL, Glimcher LH. Transcription factor B cell lineage-specific activator protein regulates the gene for human X-box binding protein 1. J Exp Med. 1996;183:393–401. doi: 10.1084/jem.183.2.393. [DOI] [PMC free article] [PubMed] [Google Scholar]
- Rinkenberger JL, Wallin JJ, Johnson KW, Koshland ME. An interleukin-2 signal relieves BSAP (Pax5)-mediated repression of the immunoglobulin J chain gene. Immunity. 1996;5:377–386. doi: 10.1016/s1074-7613(00)80263-0. [DOI] [PubMed] [Google Scholar]
- Rothman N, Cantor KP, Blair A, Bush D, Brock JW, Helzlsouer K, Zahm SH, Needham LL, Pearson GR, Hoover RN, Comstock GW, Strickland PT. A nested case-control study of non-Hodgkin lymphoma and serum organochlorine residues. Lancet. 1997;350:240–244. doi: 10.1016/S0140-6736(97)02088-6. [DOI] [PubMed] [Google Scholar]
- Rowlands JC, Gustafsson JA. Aryl hydrocarbon receptor-mediated signal transduction. Crit Rev Toxicol. 1997;27:109–134. doi: 10.3109/10408449709021615. [DOI] [PubMed] [Google Scholar]
- Sato H, Saito-Ohara F, Inazawa J, Kudo A. Pax-5 is essential for kappa sterile transcription during Ig kappa chain gene rearrangement. J Immunol. 2004;172:4858–4865. doi: 10.4049/jimmunol.172.8.4858. [DOI] [PubMed] [Google Scholar]
- Sato H, Wang D, Kudo A. Dissociation of Pax-5 from KI and KII sites during kappa-chain gene rearrangement correlates with its association with the underphosphorylated form of retinoblastoma. J Immunol. 2001;166:6704–6710. doi: 10.4049/jimmunol.166.11.6704. [DOI] [PubMed] [Google Scholar]
- Shaffer AL, Shapiro-Shelef M, Iwakoshi NN, Lee AH, Qian SB, Zhao H, Yu X, Yang L, Tan BK, Rosenwald A, Hurt EM, Petroulakis E, Sonenberg N, Yewdell JW, Calame K, Glimcher LH, Staudt LM. XBP1, downstream of Blimp-1, expands the secretory apparatus and other organelles, and increases protein synthesis in plasma cell differentiation. Immunity. 2004;21:81–93. doi: 10.1016/j.immuni.2004.06.010. [DOI] [PubMed] [Google Scholar]
- Singh M, Birshtein BK. NF-HB (BSAP) is a repressor of the murine immunoglobulin heavy-chain 3′ alpha enhancer at early stages of B-cell differentiation. Mol Cell Biol. 1993;13:3611–3622. doi: 10.1128/mcb.13.6.3611. [DOI] [PMC free article] [PubMed] [Google Scholar]
- Sulentic CE, Holsapple MP, Kaminski NE. Aryl hydrocarbon receptor-dependent suppression by 2,3,7, 8-tetrachlorodibenzo-p-dioxin of IgM secretion in activated B cells. Mol Pharmacol. 1998;53:623–629. [PubMed] [Google Scholar]
- Sulentic CE, Holsapple MP, Kaminski NE. Putative link between transcriptional regulation of IgM expression by 2,3,7,8-tetrachlorodibenzo-p-dioxin and the aryl hydrocarbon receptor/dioxin-responsive enhancer signaling pathway. J Pharmacol Exp Ther. 2000;295:705–716. [PubMed] [Google Scholar]
- Vecchi A, Sironi M, Canegrati MA, Recchia M, Garattini S. Immunosuppressive effects of 2,3,7,8-tetrachlorodibenzo-p-dioxin in strains of mice with different susceptibility to induction of aryl hydrocarbon hydroxylase. Toxicol Appl Pharmacol. 1983;68:434–441. doi: 10.1016/0041-008x(83)90288-0. [DOI] [PubMed] [Google Scholar]
- Viel JF, Arveux P, Baverel J, Cahn JY. Soft-tissue sarcoma and non-Hodgkin’s lymphoma clusters around a municipal solid waste incinerator with high dioxin emission levels. Am J Epidemiol. 2000;152:13–19. doi: 10.1093/aje/152.1.13. [DOI] [PubMed] [Google Scholar]
- Weaver D, Baltimore D. B lymphocyte-specific protein binding near an immunoglobulin kappa-chain gene J segment. Proc Natl Acad Sci U S A. 1987;84:1516–1520. doi: 10.1073/pnas.84.6.1516. [DOI] [PMC free article] [PubMed] [Google Scholar]
- Whitelaw ML, McGuire J, Picard D, Gustafsson JA, Poellinger L. Heat shock protein hsp90 regulates dioxin receptor function in vivo. Proc Natl Acad Sci U S A. 1995;92:4437–4441. doi: 10.1073/pnas.92.10.4437. [DOI] [PMC free article] [PubMed] [Google Scholar]
- Yoo BS, Boverhof DR, Shnaider D, Crawford RB, Zacharewski TR, Kaminski NE. 2,3,7,8-Tetrachlorodibenzo-p-dioxin (TCDD) alters the regulation of Pax5 in lipopolysaccharide-activated B cells. Toxicol Sci. 2004;77:272–279. doi: 10.1093/toxsci/kfh013. [DOI] [PubMed] [Google Scholar]
- Yu D, Allman D, Goldschmidt MH, Atchison ML, Monroe JG, Thomas-Tikhonenko A. Oscillation between B-lymphoid and myeloid lineages in Myc-induced hematopoietic tumors following spontaneous silencing/reactivation of the EBF/Pax5 pathway. Blood. 2003;101:1950–1955. doi: 10.1182/blood-2002-06-1797. [DOI] [PMC free article] [PubMed] [Google Scholar]
- Zwollo P, Arrieta H, Ede K, Molinder K, Desiderio S, Pollock R. The Pax-5 gene is alternatively spliced during B-cell development. J Biol Chem. 1997;272:10160–10168. doi: 10.1074/jbc.272.15.10160. [DOI] [PubMed] [Google Scholar]