

Abstract
The aim of this study was to investigate whether a cationic polyelectrolyte; poly(ethylene glycol) PEG-b-poly(l-histidine) diblock copolymer [PEG-polyHis] can stabilize insulin, at the aqueous/methylene chloride interface formed during the microencapsulation process. Insulin aggregation at this interface was monitored spectrophotometrically at 276 nm. The effects of protein concentration, pH of the aqueous medium, and the presence of poly(lactic-co-glycolic acid) [PLGA] in methylene chloride (MC) on insulin aggregation were observed. For the 2.0 mg/ml insulin solutions in phosphate buffer (PB), the effect of addition of Pluronic F-127 as a positive control and addition of PEG-polyHis as a novel excipient in PB was also evaluated at various insulin/polymeric excipient weight ratios. The conformation of insulin protected by PEG-polyHis and recovered after interfacial exposure was evaluated via circular dichroism (CD) spectroscopy.
Greater loss in soluble insulin was observed with increasing insulin concentrations. pH 6.0 was selected for optimal ionic interactions between insulin and PEG-polyHis based on zeta potential and particle size studies. pH 4.5 and 7.4 (no ionic complexation between insulin and PEG-polyHis) were selected as controls to compare the stabilization effect of PEG-polyHis with that at pH 6.0. Incubation of PEG-polyHis with insulin at pH 6.0 drastically reduced protein aggregation, even in the presence of PLGA. PEG-polyHis and F-127 reduced insulin aggregation in non-complexing pH conditions pointing to the role played by PEG in modulation of insulin adsorption at the interface. Far-UV (205-250 nm) circular dichroism (CD) study revealed negligible qualitative effects on soluble insulin’s secondary structure after interfacial exposure. RP-HPLC and size-exclusion HPLC showed no deamidation of insulin or formation of soluble high molecular weight transformation products respectively. MALDI-TOF mass spectrometry confirmed the results from chromatographic procedures. Radioimmunoassay carried out on select samples showed that recovered soluble insulin had retained its immunoreactivity.
An experimental method to simulate interfacial denaturation of proteins was designed for assessment of protein stability at the interface and screening for novel protein stabilizers. Understanding and manipulation of such polyelectrolyte-insulin complexation will likely play a role in insulin controlled delivery via microspheres formulation(s).
Keywords: Insulin aggregation, Polymeric excipients, Ionic complexation, PEG-b-poly(l-histidine), Aqueous/organic interface
Introduction
Development of an injectable controlled-release system for a protein may involve encapsulation in microspheres prepared from nontoxic, nonimmunogenic, biocompatible and biodegradable polymers such as poly(lactic-co-glycolic acid) (PLGA).1-4 For microencapsulation, an aqueous protein solution is emulsified into an organic solvent such as methylene chloride (MC) containing PLGA to form the primary water/oil emulsion. Formation of a primary w/o emulsion is considered the main cause of protein inactivation and aggregation.5-7 One approach to tackle protein instability during microspheres formulation is to add stabilizing excipients such as polyols, surfactants, and poly(ethylene glycol) to the inner aqueous core that compete with the proteins for the aqueous/organic solvent interface and can prevent emulsification-induced protein denaturation and aggregation. 7-12
Recombinant human insulin was chosen as an unstable therapeutic protein. Insulin-surface/interface interactions can induce conformational changes and aggregation; resulting in inactivation of insulin.13-14 A study by Kwon et al. showed that the rate of insulin aggregation induced at the MC-water interface was an order of magnitude higher than the control conditions using an aqueous solution. The effect of nonionic (dodecyl maltoside (DDM)) and anionic (sodium dodecyl sulfate (SDS)) surfactant in a buffer were also evaluated at various insulin/surfactant molar ratios.15 DDM failed to delay insulin aggregation at all ratios used, whereas less than 10% change in %T was observed in 1 hour when a 10-20 fold of SDS was used. Previous studies using ionic complexation of insulin with SDS and polymethacrylic acid reported better encapsulation efficiencies of insulin presumably based upon greater retention of insulin stability at the w/o interface.16-17
This study is aimed at investigating the effect of poly(ethylene glycol)-b-poly(l-histidine) (PEG-polyHis: a cationic polyelectrolyte) on reduction of aggregation of insulin at the interface and is depicted in figure 1. The imidazole ring in histidine has an electron pair on the unsaturated nitrogen that endows polyHis with an amphoteric nature by rapid and reversible protonation-deprotonation (Fig. 2). In a previous study from our group, PEG-polyHis significantly improved the stability of BSA both in aqueous solutions and in PLGA microspheres.18 A systematic attempt for understanding the factors affecting aggregation of insulin, to analyze the effect of individual parameters such as insulin concentration, the presence of PLGA, and the stabilization effects of ionic and nonionic polymeric excipients is reported here.
Figure 1.

Chemical structure of the diblock copolymer PEG-poly(l-Histidine). * indicates the lone pair of electrons available for reversible protonation.
Figure 2.

Ionic interactions between Insulin and PEG - polyHis are expected to prevent contacts of insulin with methylene chloride. I - II shows interfacial aggregation of insulin on methylene chloride layer. III depicts competition between PEG-polyHis and insulin for the interfacial area. IV - V shows protection of insulin against interfacial stresses an organic solvent via complexation.
Experimental Section
Materials
Insulin, recombinant human, USP (potency ≥ 27.5 U/mg, zinc content ≤ 1.08%), was purchased from Sigma Chemical Co., (St. Louis, MO). Pluronic F-127 (abbreviated as F-127 hereafter) was purchased from BASF Group (New Jersey). F-127 defines a block copolymer that is a solid, has a PO block of 3600 Da, and 70% weight of EO.19 PLGA [lactide:glycolide (L:G) ratio = 50:50, MW = 40 - 75 kDa] was purchased from Sigma-Aldrich, (St. Louis, MO). Methylene chloride (MC) purchased from Fisher Scientific Co. was used without further purification. All buffer salts used in studies were of analytical grade and purchased from Sigma Chemical Co, (St. Louis, MO). Buffer solutions were prepared according to the standard pharmacopoeial procedures. The I125-labeled insulin radioimmunoassay (RIA) kit was purchased from MP Biomedicals, Orangeburg, NY.
PEG-polyHis Synthesis and Characterization
PEG-polyHis was synthesized and characterized as previously reported.20, 21 In brief, PEG-polyHis was synthesized by a coupling reaction between the monocarboxyl poly(ethylene glycol) (PEG-COOH) and poly(Nim-dinitrophenyl (DNP) l-His), followed by deprotection of poly((Nim-DNP l-His) block. The synthesis method includes selecting a blocking group for the primary amino group and imidazole ring of l-His and the synthesis of monomeric Nim-DNP-l-His N-carboxyanhydride NCA. Poly(Nim-DNP l-His) was synthesized by ring-opening polymerization of Nim-DNP l-His (NCA) in the presence of an amine initiator. The total molecular weight of PEG-polyHis used in this study was 7.5 kDa consisting of two blocks; PEG 2 kDa and polyHis 5.5 kDa (average degree of polymerization: 36) as determined by 1H-NMR. Polydispersity of the diblock copolymer was 1.34 as determined by MALDI-TOF. To independently confirm the apparent pKa, acid-base titration was carried out by following the protocol in a previous study.20, 25 The pH range was determined to be 6.5-7.0. PEG-polyHis may form ionic complexes with insulin within a narrow pH range based on attraction between opposite charges on insulin [isoelectric point (pI) - 5.4] and PEG-polyHis.
Preparation of Insulin Solutions
Insulin solutions were prepared by diluting a stock solution made in 0.025 M hydrochloric acid (HCl) with appropriate pH buffers (ionic strength 0.15 M) to obtain the desired insulin concentrations. The pH of the solutions was adjusted by adding either 1N sodium hydroxide (NaOH) or 1N HCl. All insulin solutions were filtered through a 0.22-μm Acrodisc™ low protein-binding syringe filter (Pall Corporation, Ann Arbor, MI, USA).
Estimation of Insulin Content in Samples
For all samples, the concentration of insulin was checked by assuming an extinction coefficient of 1.0 for 1.0 mg/ml at 276 nm by UV spectrophotometry.22 Controls included aqueous buffers (pH 4.5, 6.0 & 7.4) incorporating F-127 and PEG-polyHis, and blanks included aqueous buffers (pH 4.5, 6.0 & 7.4).
Zeta potential analyses: pH-dependent complexation
Zeta potential studies helped determine the working pH range for complexing insulin and PEG-polyHis.18 The aim was to optimize the pH that induced molecular-level interactions between insulin and PEG-polyHis such that insulin complexes could be tested against stresses encountered during agitation. PEG-polyHis concentrations were fixed at 0.5 mg/ml. Insulin concentrations were varied from 0.17 to 1.5 mg/ml. Therefore, the weight ratio of insulin to PEG-polyHis ranged from 1:3 to 3:1. It was anticipated that insulin and PEG-polyHis would form ionic complexes in a narrow pH range. Therefore, seven pHs were selected to evaluate complex formation: 4.5, 5.0, 5.5, 6.0, 6.5, 7.0, and 7.4 (0.15 M ionic strength, the physiological ionic strength).The zeta potential of uncomplexed PEG-polyHis and insulin was measured within the experimental pH range as a control. Zeta potential as a function of the weight ratio of insulin to PEG-polyHis and pH was obtained using a zetasizer (Malvern system) at 25°C. These results were used to provide evidence supporting intermolecular attraction between oppositely charged species. The aim was to optimize pH for forming ionic complexes, so that insulin complexes could be tested against interfacial stresses encountered during emulsification with an MC solution of PLGA.
Insulin fibrillation at Water/Methylene Chloride (MC) Interface under mild agitation
Insulin solutions become increasingly turbid as insulin aggregates on aqueous/MC interface.15 Thus, insulin aggregation can be detected by measuring the loss of soluble insulin by UV spectrophotometry. MC (with or without PLGA) was placed on the bottom of the glass vials (density=1.33 g/ml at room temperature), and insulin solution was gently placed on top of it. Concentrations of insulin, and polymeric excipients under investigation: PEG-polyHis and F-127 were varied. In preliminary experiments, the pH of insulin solutions was varied to estimate its effect on insulin aggregation. This helped narrow down the range of pH values to be used in aggregation studies and indirectly supported zeta potential results in selecting conditions for ionic complexation between insulin and PEG-polyHis. PLGA was added to MC at a concentration of 100 mg/ml in some studies after optimization of amounts of PEG-polyHis. Agitation was carried out at 400 rpm. Samples taken at predetermined times were transferred to an Eppendorf tube and centrifuged at 10,000 × g for 10 minutes. % soluble insulin remaining was plotted as a function of time. Comparison experiments using PEG-polyHis and F-127 (a non-ionic surfactant) to investigate their ability to reduce insulin aggregation was carried out by varying polymeric excipient/insulin weight ratios at a fixed insulin concentration in the second phase of experiments. These surfactants were added with insulin in appropriate buffer solutions.
Far-UV circular dichroism measurements
The circular dichroism (CD) spectra were recorded on AVIV 62DS spectropolarimeter equipped with a water bath operated at ambient temperature (∼24 °C). A quartz cuvette with 0.1-cm path length was used. The spectra were scanned between 205 and 250 nm: 10 scans were taken with a step size of 0.5 nm. All conformational measurements were carried out under identical conditions. Following samples were subject to spectroscopic evaluation: (1) Insulin solution freshly made (concentration=0.4 mg/ml, no interfacial exposure to MC; (2) Soluble insulin recovered after interfacial exposure to MC for 4 hr at 400 rpm, (concentration = 0.4 mg/ml).
HPLC Analyses: Characterization of Nature of Aggregates
Soluble insulin recovered after interfacial exposure was analyzed by high-performance liquid chromatography (HPLC). Reversed-phase and size-exclusion chromatography were carried out in order to detect the different degradation products in recovered soluble insulin samples (after interfacial exposure) and the aggregates present at the interface were dissolved in 6M urea and dialyzed against deionized water for a period of 4 hours in a microdialyzer (QuixSep™, Membrane Filtration Products Inc., Seguin, TX).
The chromatograph was equipped with a HPLC LC pump, an injection valve (Rheodyne), a UV-Vis detector set at the wavelength of 215 nm and an integrator combined in an Agilent 1100 series HPLC system. An Extend™ 5-μm C18 (4.6 × 250mm) (Agilent, USA) was employed. Insulin samples were analyzed by at room temperature using a binary gradient consisting of (A) water/TFA (99.9/0.1) and (B) Acetonitrile/TFA (99.9/0.1). The gradient consisted of 15% B to 65% B in 10 minutes, followed by equilibration at 15% B for 5 minutes. Flow rate was set at 1 ml/min.
For the size-exclusion chromatography (SE-HPLC), a 4 μm Zorbax™ GF-250 column (4.6 × 250 mm), (Agilent, USA) was employed. The mobile phase was an aqueous solution of 20 mM phosphate buffer with pH adjusted to 6.0 with sodium hydroxide. Flow rate was set at 0.4ml/min and analysis was carried out at room temperature.
Insulin Stability Assessment Using Matrix-Assisted Laser Desorption/ Ionization Time-of-Flight Mass Spectrometry (MALDI-TOF MS)
Soluble insulin recovered after interfacial exposure was subject to MALDI-TOF MS analyses. Spectra were obtained on a Voyager - DE STR Biospectrometry Workstation (PerCeptive Biosystems), with an α-cyano-4-hydroxycinnamic acid as the matrix. The mode of operation was linear, extraction delay time of 200 ns, and an accelerating voltage of 20,000 volts. Insulin solutions with concentrations of 60 μg/ml were mixed in 1:1 ratio with the matrix material. Following samples were subject to spectrometric evaluation: (1) Insulin solution freshly made (no interfacial exposure to MC; (2) Soluble insulin recovered after interfacial exposure to MC for 4 hr at 400 rpm, and (3) Aggregates dissolved in 6M urea and dialyzed as explained in the HPLC methods section.
Denaturation of Insulin at the Aqueous/MC Interface on Emulsification
Time-dependent Emulsification
Insulin (2.0 mg) and a fixed amount of PEG-polyHis (4.0 mg as optimized in initial studies) were added in 1 ml of buffer solutions with an appropriate pH (6.0 or 7.4), incubated for one hour at room temperature, and subsequently emulsified into PLGA solution in MC (100 mg/ml) at a 1:5 v/v water-to-MC ratio. Ultra Turrax® T25 basis model apparatus (IKA-Werke) was used at 19,000 rpm for different durations of homogenization (15, 30 or 60 seconds). The emulsions were destabilized by addition of a suitable volume of phosphate buffer, pH 7.4, ionic strength 0.15 M and phase separation allowed to occur, aided by centrifugation at 10,000 × g for 5 minutes.
PEG-polyHis concentration dependence
The effect of increasing concentration of PEG-polyHis was estimated in a method described above. The weight ratio of insulin to PEG-polyHis was changed to 1:1 (suboptimal complexation), 1:3 and 1:4 (excess amount for potential surfactant activity) in addition to the optimal 1:2 weight ratio used in the first phase. The duration of emulsification was fixed at 30 seconds as optimized earlier.
Radioimmunoassay (RIA) of Recovered Soluble Insulin
The amount of insulin in the supernatant recovered following interfacial exposure with or without polymeric excipients was determined using a commercially available human insulin RIA kit (ImmuChem™; MP Biomedicals, Orangeburg, NY) whose output was given in international insulin activity microunits per milliliter (μIU/ml). The detection range of this kit was 5.5 - 310 μIU/ml. Insulin samples were analyzed in duplicate. Appropriate controls included insulin standards incubated with polymeric excipients at similar concentrations used in the actual study. Recovered soluble insulin samples that were used in RIA analyses were initially analyzed by reversed-phase high-performance liquid chromatography (RP-HPLC) as previously described.
Results
Towards validating the proposed concept, we selected PEG-polyHis as a cationic polyelectrolyte and insulin (isoelectric point (pI) = 5.4) as a model anionic protein. Variations of solution pH can significantly alter the electrostatic interactions by altering the charge present on amino acid residues with ionizable side chains. The zeta potential results provide evidence for intermolecular interactions between PEG-polyHis and insulin. Zeta potential results coincide well with pH-dependent changes in the net charges. Both insulin and PEG-polyHis bear a net positive charge below pH 5.4 and tend to repel each other. As an example, at pH 5.0, PEG-polyHis and insulin have zeta potential values of +18 mV and +7.4 mV. Using a weight ratio of 1:2 for insulin to PEG-polyHis, overall charges added up to 24.2 mV. Complexation is not significant above pH 7.0, because PEG-polyHis becomes neutral. However, insulin and PEG-polyHis could form ionic complexes in the pH range 5.5 to 6.5 due to opposite net charges. A specific pH value, denoted in this study as critical pH (pHcrit) can be used to parametrize the results. At pHcrit = 6.0, PEG-polyHis carries a positive charge of +12.4 mV compared to a negative potential of -11.6 mV for insulin. Interactions of these two at 1:2 weight ratio had an overall zeta potential of system as -0.5 mV. Figure 3 shows zeta potential as a function of insulin to PEG-polyHis weight ratio and pH. This weight ratio and pH condition was used for interfacial stability studies.
Figure 3.

Zeta potential of insulin/PEG-polyHis complexes at room temperature: The order of symbols left to right; PEG-polyHis, insulin, insulin: PEG-polyHis = 1:3, 1:2, 1:1, 1:2, 1:3.
If insulin and PEG-polyHis interact to form optimal complexes, the value of the zeta potential should be near zero. This means that the surface charge of the complex is neutral because of charge neutralization between insulin and PEG-polyHis. At pH 5.5 the zeta potential for insulin and PEG-polyHis mixture at weight ratio 1:2 and 1:1 had values close to zero. However, the selection of pH 6.0 was based on higher interfacial stability of insulin and a greater solubility at pH 6.0 which has practical benefits in terms of the use of a higher amount of insulin that can be incorporated in the controlled-release microspheres formulation; the ultimate goal of this project. Interfacial exposure experiments carried out at lower insulin concentrations (∼ 0.5 mg/ml) in solutions at pH 5.5, 6.0, 6.6, 7.0 and 7.4 revealed a lower interfacial stability at pH 5.5 compared to pH 6.0 insulin solution. At pH 5.5, 78% of insulin was retained in the soluble form compared to 96, 98.4 and 41.6 % at pH 6.0, 6.6, and 7.4 respectively.
Insulin fibrils were formed on exposure to MC. Aggregation of insulin at the interface was measured by loss of soluble insulin in the upper layer. Figure 4 shows the effect of insulin concentration on rate of fibrillation of insulin on exposure to MC with agitation. pH 7.4 was initially selected for this study as reported in a previous study involving monomeric insulin.15 Rapid aggregation was seen at higher insulin concentrations. Insulin adsorption at the interface is enhanced by an increase in its aqueous concentration, because a greater concentration gradient facilitates the mass transfer of insulin to the interface. In general, aggregation processes are kinetically controlled and the rates of aggregation proportional to the protein concentration.13-15 An insulin concentration of ∼ 2.0 mg/ml was selected for further evaluation.
Figure 4.

Effect of insulin concentration (mg/ml) on the rate of insulin aggregation. The plot of % retention of soluble insulin as a function of time is shown. N=3.
Figure 5 shows pH-dependence of insulin loss for up to 4 hours with agitation which causes interfacial denaturation of insulin. Similar pH insulin solutions were considered as in zeta potential studies. Higher aggregation was observed at pH 7.4. Lower insulin aggregation was seen in the pH range 6.0-7.0. Acid stabilization of insulin is due to the protonation of a single site with a pKa of ∼ 7.0 and is accompanied by a change in the tertiary structure as observed by an alteration in the near-UV CD spectrum with no detectable perturbations in the secondary structure as determined by far-UV CD (results not shown here). Similar results have been reported earlier.23 pH 6.6 showed the least insulin loss compared to other pH insulin solutions. However, due to inadequate molecular interactions between insulin and PEG-polyHis at pH 6.6 (from zeta potential studies), pH 6.0 was selected for further studies.
Figure 5.

Relative insulin aggregation as a function of pH on exposure to methylene chloride layer at 400 rpm for 4 hrs. Initial insulin concentration was set at 2.03 mg/ml. N = 3
Addition of PEG-polyHis to insulin solutions at different pH (4.5, 6.0 and 7.4) improved the recovery of soluble insulin irrespective of pH. Blending PEG-polyHis with insulin at pH 7.4 and pH 4.5 reduced the insulin fibrillation process. Nearly 75% of initial insulin was recovered after agitation for 4 hours on addition of PEG-polyHis at pH 7.4. Nearly 97% of initial content of insulin was recovered at pH 6.0 on addition of an optimal or higher than optimal amounts of PEG-polyHis. Detailed results are provided in Table 1. Increasing PEG-polyHis concentration beyond 2-fold insulin concentrations at pH 6.0 did not cause significant changes in soluble insulin recovery.
Table 1.
Effect of increasing amounts of PEG-polyHis on insulin aggregation on exposure to methylene chloride (MC) (N = 3-4). Agitation rate: 400 rpm for 4 hours
| % Soluble Insulin Remaining | ||||||
|---|---|---|---|---|---|---|
| pH | No PEG-polyHis | Weight Ratio of Insulin to PEG-polyHis | ||||
| 3 : 1 | 2 : 1 | 1 : 2 | 1: 2.5 | 1 : 3 | ||
| 4.5 | 45.8 ± 4.4 | 53 ± 2.8 | 59 ± 2.8 | 62 ± 2.8 | 68 ± 4.1 | 75 ± 2.8 |
| 6.0 | 84.0 ± 2.7 | 85 ± 1.3 | 89 ± 1.8 | 97 ± 1.3 | 97± 0.7 | 96 ± 0.9 |
| 7.4 | 33.0 ± 5.9 | 48 ± 2.8 | 56 ± 3.9 | 61 ± 2.8 | 73 ± 3.4 | 75 ± 2.8 |
Addition of PLGA to MC (100 mg/ml) led to insignificant additional soluble insulin loss at pH 6.0 (97.3 ± 0.7 remaining without PLGA in MC; 95.1 ± 1.2 with PLGA). Addition of matrix-forming PLGA reduced the recovery of soluble insulin from 84% to 79% in the absence of PEG-polyHis at pH 6.0.
Comparison experiments were carried out using weight ratios of F-127 to insulin from 10:1 to 1:2. Higher F-127 amounts led to greater loss of soluble insulin at all pH studied (results not shown here). This may be attributed to initiation of association between individual Pluronics molecules leading to depletion of monomer concentration available to provide protection to denatured insulin. At pH 4.5 and 7.4, F-127 and PEG-polyHis were nearly equally effective in preventing insulin fibrillation at the interface.
Far-UV Circular Dichroism Study
To minimize the contribution of buffer and PEG-polyHis in the far-UV CD signal, the signal from the buffer, PEG-polyHis and F-127 simultaneously determined, was subtracted from the total signal. Decomplexation was carried out after phase separation to avoid changes in signal from insulin structural alteration due to molecular interactions with the diblock copolymer. Similar concentrations of insulin in phosphate buffer were used as controls for acquiring the far-UV spectra. Figure 6 shows the far-UV CD spectrum of insulin recovered in the supernatant. Negligible effects on secondary structure are seen for insulin after formulation in a primary w/o emulsion and recovery in soluble form after breaking of the emulsion and phase separation.
Figure 6.

Far-UV CD spectrum (205-250 nm) on exposure to methylene chloride layer at 400 rpm for 4 hrs. Initial insulin concentration was set at 0.4 mg/ml.
HPLC Analyses: Characterization of Nature of Aggregates
It should be noted that in this paper, the term stability referred to insulin is defined as the ability of this peptide not to undergo transformation into side-products, namely desamido-insulin and soluble covalent aggregates. Insulin stability was assessed by two chromatographic techniques: RP-HPLC, which allows the simultaneous detection of insulin and desamido-insulin and SE-HPLC, which allows the detection of insulin and its water-soluble high molecular weight transformation products (HMWTPs).
A typical RP-HPLC chromatogram is shown in figure 7, where the soluble insulin recovered from interfacial studies had an identical retention time as that of an insulin standard; this provided supportive evidence that insulin did not degrade to products of different chemical nature, such as the A21 desamido-insulin in agreement with literature data.24-26 Similarly, the aggregates dissolved in 6M urea and dialyzed against deionized water showed a similar retention time indicating that the aggregates were of noncovalent nature.
Figure 7.

RP-HPLC chromatogram of soluble insulin recovered from systems containing polymeric excipients after interfacial exposure and comparison with an insulin standard at equivalent concentrations.
Analyses of recovered soluble insulin by size-exclusion HPLC did not reveal any high molecular weight transformation products (HMWTPs= covalent aggregates). The pattern of retention of soluble insulin recovered was identical with that of an insulin standard at equivalent concentrations (Fig. 8). Similarly, aggregates dissolved in 6M urea did not show any high molecular weight transformation products as reported in previous studies.27-28
Figure 8.

SE-HPLC chromatogram of soluble insulin recovered after interfacial exposure and its comparison with an insulin standard at equivalent concentrations.
Insulin Stability Assessment Using MALDI-TOF Mass Spectrometry
In the MALDI-TOF mass spectra shown in figure 9, soluble insulin recovered from interfacial studies displayed an identical spectra with peaks at [M+H]+1 of 5808 and [M+2H]+2 of 2905 with no evidence of covalent aggregation or desamido-insulin peaks similar to an insulin standard. White aggregates formed at the interface were soluble in 6M urea indicating the noncovalent nature of aggregates. Following dissolution in 6M urea and dialysis, recovered insulin showed an identical spectral pattern confirming the noncovalent nature of aggregates.
Figure 9.

Comparison of mass spectra of (A) Insulin Standard (B) Recovered Soluble Insulin and (C) Insulin aggregates dissolved in 6M urea and dialyzed against deionized water. Masses are mentioned in brackets below the charged species listed. Initial insulin concentrations were 60 μg/ml and were diluted with the matrix material.
Denaturation of Insulin at the Aqueous/MC Interface on Emulsification
Time-dependent Emulsification
Support for importance of ionic complexation between insulin and PEG-polyHis in preventing insulin destabilization at the w/o interfaces during emulsification is evident. Complexation of insulin with PEG-polyHis at pH 6.0 (‘[c]’ system) reduced the loss of soluble insulin effectively, limiting the loss of soluble insulin to about 7% compared to 25% in samples without any PEG-polyHis. Stabilization effect at pH 6.0 may possibly be attributed to conformational rigidity for insulin provided by PEG-polyHis. Blending PEG-polyHis with insulin at pH 7.4 did not lead to major improvement in soluble insulin recovery. Nearly 22% insulin was aggregated with addition of PEG-polyHis versus 28% loss without any PEG-polyHis. Insulin aggregation at pH 6.0 was lower than at pH 7.4 even without addition of any polymeric excipient. This indicated the usefulness of carefully selecting a rational pH in minimizing interfacial stresses on exposure to an organic solvent.
The duration of shear applied during primary emulsion formation can impact the degree of aggregation and inactivation. Excessive shear duration may lead to undesirable loss of protein without any additional improvements in emulsion formation or characteristics. Kinetic studies clearly revealed that the major factor in destabilization of insulin is the exposure to a water/MC interface. Duration of homogenization plays a secondary role in aggregation process. Emulsification for 15 seconds compared to 30 seconds duration did not lead to a significant increase in soluble insulin recovered. Increasing the duration of homogenization to 60 seconds did not lead to substantial decrease in recovery of soluble insulin as shown in figure 10. Only 11% of insulin was lost in the complex system (pH 6.0) compared to 7% for 30 seconds. This may represent a 50% increase; however, the experimental error nullifies its impact. Based on these studies; it was determined that the duration of homogenization be limited to 30 seconds for future microspheres fabrication.
Figure 10.

Kinetic plot of loss of soluble insulin as a function of homogenization duration during the primary emulsion formation. Initial concentration was fixed at 2.06 mg/ml. PEG-polyHis concentration was fixed at 4.12 mg/ml (weight ratio of Insulin to PEG-polyHis was set at 1: 2). N = 3.
PEG-polyHis Concentration Dependence
Loss of 7-11% of insulin as aggregates when complexed with PEG-polyHis at pH 6.0 led to increasing the concentration of PEG-polyHis to complex with potentially unshielded insulin, which may have undergone denaturation at the interface. To test the hypothesis, PEG-polyHis was added in amounts different than those used in optimal complex formation in previous studies. Increasing the PEG-polyHis concentration beyond 2 times the amount of insulin did not lead to significant changes in recovery of soluble insulin. Addition of as much as 4 times of PEG-polyHis with respect to insulin increased the soluble insulin amount by 3 % which lies close to observations from use of twice the amount of PEG-polyHis. Results are summarized in figure 11.
Figure 11.
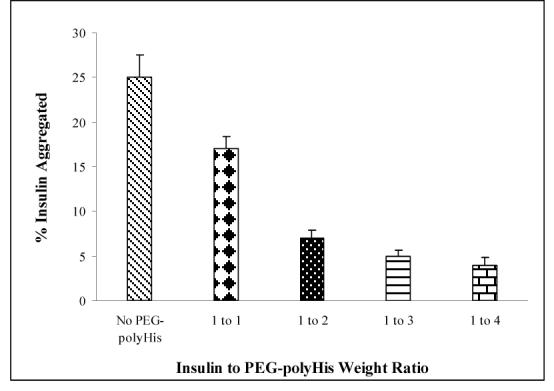
Effect of insulin to PEG-polyHistidine weight ratio on insulin aggregation. Insulin concentration was fixed at 2.07 mg/ml. N = 3
Reducing the ratio of insulin to PEG-polyHis from optimal 1:2 to 1:1 led to an additional 10% loss of soluble insulin. Importantly, higher amount of unshielded insulin present because of incomplete ionic complexation may be the primary reason for increased insulin aggregation. This finding indicates the requirement for complexation for most effective protection against aggregation of insulin and indirectly supports the zeta potential determination for an optimal weight ratio for ionic complexation to be 1:2 of insulin to PEG-polyHis.
Radioimmunoassay (RIA) of Recovered Soluble Insulin
Analyses of released insulin by RIA and RP-HPLC showed an excellent correlation between values determined from these two methods. No interference was seen from polymeric excipients. Comparative results from RP-HPLC and RIA for studies at pH 6.0 are presented in figure 12. Similar results were obtained for insulin incubation at pH 7.4 (results not shown here). Results from this study support far-UV dichroism evaluation of recovered soluble insulin in terms of retention of native structure of insulin. Recovered insulin is immunoreactive and hence has a high probability of being biologically active in streptozotocin-induced diabetic animal models. Very few studies comparing the RIA assay with UV spectrophotometry and RP-HPLC have reported similar good correlations.29-30
Figure 12.
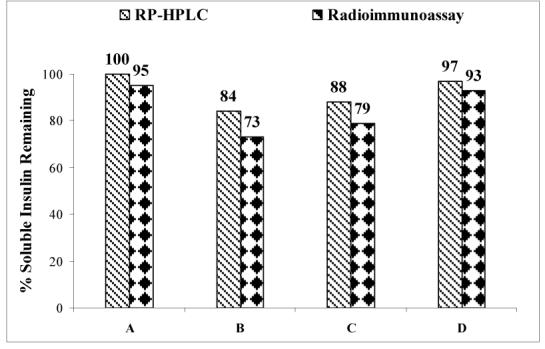
Comparison of insulin contents obtained from RP-HPLC and radioimmunoassay (RIA). Four different kinds of samples tested included an insulin standard (A), soluble insulin recovered following interfacial exposure without any polymeric excipient (B), soluble insulin recovered following interfacial exposure from systems with F-127 (C), and soluble insulin recovered following interfacial exposure from systems with PEG-polyHis at pH 6.0 (D). N = 2.
Overall, the use of polymeric excipients proved effective in retention of higher structures of insulin.
Discussion
At the interfacial region, that may have reduced hydrophobic interactions between protein molecules due to a high concentration of MC, insulin hexamers may easily dissociate to monomers when exposed to the interface and form aggregates.15, 31 To test whether the observed insulin aggregation might be caused by mechanical shear stress and/or continual creation of an air/water interface, a 2 mg/ml insulin solution was agitated under similar conditions without the addition of MC. Without MC, insulin solution showed only a 3% drop in soluble insulin content up to 4 hr. Experimental results demonstrate that agitation-associated effects (e.g., shear and continual creation of new water/air interface) do not cause significant insulin instability.
Based on reports in the literature, a rational stabilization strategy for proteins during emulsification should either prevent contacts between the protein and the aqueous/organic solvent interface, or prevent unfolding of the protein. Our hypothesis that reversible molecular shielding of insulin with PEG-polyHis by ionic complexation will protect insulin from harsh environmental conditions has been proved correct. Complexing insulin with PEG-polyHis at pH 6.0 reduced the loss of soluble insulin most effectively compared to the blend systems (pH 4.5 and 7.4). Possibly, conformational rigidity imparted by complexation at pH 6.0 plays a role in preventing destabilization of insulin. A plausible explanation is that complexation induced the formation of PEG-polyHis cover over the insulin surface and prevented direct exposure of insulin to the interfaces. PEG-polyHis protects against insulin aggregation at two non-complexing pH 4.5 and 7.4 (blend systems) pointing to the role played by PEG in modulating insulin’ interfacial adsorption. Numerous studies reported on proteins-polyelectrolytes (water-soluble polymers) complex formation have been motivated by interest in enzyme stabilization and immobilization, while protecting the catalytic activity of the active center for glucose dehydrogenase, alcohol dehydrogenase, β-galactosidase, and trypsin.32-35 It has been suggested that electrostatic interactions between the enzymes and the polymers play a dominant role in stabilization of nonenzymatic proteins as well.36-37
Because of amphipathicity and flexible conformation, proteins are surface active so that they tend to adsorb at water/organic solvent interfaces. Adding surfactants can significantly decrease adsorptive losses and subsequent protein denaturation. Pluronics have been investigated as surfactants/additives in formulating microspheres of proteins such as insulin26,28, bovine serum albumin (BSA)38-39, human growth hormone (hGH)40, and recombinant human nerve growth factor (rhNGF)41 with mixed results. Pluronics are believed to be absorbed to the abnormally exposed hydrophobic regions of the unfolded proteins, alter local hydrophobic interactions as well as alter the local surface tension in such a fashion to facilitate protein disaggregation and refolding.42 In all systems, PEG-polyHis was more effective in preventing insulin aggregation than F-127. Modest results with F-127 to protect insulin at the interface may be explained on the basis of anomalous behavior of PEG chains at the water-MC interface. PEG chains preferentially distribute in the MC layer.5, 43 The relatively hydrophobic polypropylene block and PEG may show affinity for the organic solvent, explaining its lower efficacy in preventing insulin aggregation.
In summary, a lower amount of insulin aggregates at the water/MC interface upon emulsification on complexation with PEG-polyHis. These aggregates are primarily caused by the presence of the interface, and not by other stress factors such as homogenization. The maintenance of physical stability of insulin by ionic complexation is strong evidence supporting the hypothesis that addition of PEG-polyHis to insulin can be a beneficial strategy by preventing insulin from interacting with different surfaces. The significance of PEG-polyHis does not lie exclusively in imparting interfacial stability to insulin during the primary emulsion formation in microspheres. The role of PEG-polyHis is multifunctional in the proposed microspheres formulation. Our previously published results on BSA microspheres containing similar complexes of BSA with PEG-polyHis showed that PEG-polyHis is a suitable proton scavenger (bye-products from degradation of PLGA) and helps maintain microenvironment pH above 5.0 for a 30 day period.18 This is significant from retention of stability of insulin in an otherwise deleterious microenvironment that develops during incubation of microspheres for release studies in vitro and in vivo. It has been widely reported in literature that the accumulation of acidic bye-products of degradation of PLGA is responsible for acid-induced deamidation and covalent dimer formation of insulin especially at pH 5.0 and below in the microspheres microenvironment.24, 44-46 Maintenance of pH above 5.0 by PEG-polyHis in insulin microspheres may lead to a better preservation of quality of insulin and a more complete release.
This study also demonstrates the design of experiment for routine monitoring of the time-course of insulin aggregation induced by the w/o interface and screening of novel protein stabilizers. This experimental approach can be used as a general platform for numerous proteins.
Acknowledgements
This research was supported in part by an NIH grant GM72612. We thank Dr. Yu Seok Youn for valuable discussion during preparation of the manuscript and help in chromatographic procedures for insulin. Deepa Mishra, a fellow laboratory member helped in successful instruction of the RIA procedures and analyses. Appreciation is also due to Dr. Michael Kay, Assistant Professor, Department of Biochemistry; University of Utah for his help in conducting and analyzing circular dichroism experiments, and Mike Hanson at the CORE mass spectrometry facility for the mass spectrometry analyses.
References
- 1.Varde NK, Pack DW. Microspheres for controlled release drug delivery. Expert Opin. Biol. Ther. 2004;4(1):35–51. doi: 10.1517/14712598.4.1.35. [DOI] [PubMed] [Google Scholar]
- 2.Wise DL, Trantolo DJ, Marino RT, Kitchell JP. Opportunites and challenges in the design of implantable biodegradable polymeric systems for the delivery of aitimicrobial agents and vaccines. Adv. Drug Delivery Rev. 1987;1:19–39. [Google Scholar]
- 3.Cohen S, Yoshioka T, Lucarelli M, Hwang LH, Langer R. Controlled delivery systems for proteins based on poly(lactic/glycolic acid) microspheres. Pharmaceutical Research. 1991;8:713–720. doi: 10.1023/a:1015841715384. [DOI] [PubMed] [Google Scholar]
- 4.Wang YJ, Hanson M. Parenteral formulations of peptides and proteins: Stability and stabilizers. J. Parenteral Sci. Tech. 1988;42:1–26. [Google Scholar]
- 5.van de Weert M, Hoechstetter J, Hennink WE, Crommelin DJ. The effect of a water/organic solvent interface on the structural stability of lysozyme. J. Control. Release. 2000;68:351–359. doi: 10.1016/s0168-3659(00)00277-7. [DOI] [PubMed] [Google Scholar]
- 6.Sah H. Protein behavior at the water/methylene chloride interface. J Pharm Sci. 1999;88:1320–1325. doi: 10.1021/js9900654. [DOI] [PubMed] [Google Scholar]
- 7.Sah H. Protein instability toward organic solvent/water emulsification: implications for protein microencapsulation into microspheres. PDA J. Pharm. Sci. Techno. 1999;53:3–10. [PubMed] [Google Scholar]
- 8.Perez C, De Jesus P, Griebenow K. Preservation of lysozyme structure and function upon encapsulation and release from poly(lactic-co-glycolic) acid microspheres prepared by the water-in-oil-in-water method. Int. J. Pharm. 2002;248:193–206. doi: 10.1016/s0378-5173(02)00435-0. [DOI] [PubMed] [Google Scholar]
- 9.Pean J, Boury F, Wenier-Julienne M, Menei P, Proust J, Benoit J. Why does PEG 400 co-encapsulation improve NGF stability and release from PLGA biodegradable microspheres. Pharm. Res. 1999;16:1294–1299. doi: 10.1023/a:1014818118224. [DOI] [PubMed] [Google Scholar]
- 10.Kang F, Jiang G, Hinderliter A, DeLuca P, Singh P. Lysozyme stability in primary emulsion for PLGA microsphere preparation: effect of recovery methods and stabilizing excipients. J. Pharm. Sci. 2002;19:629–633. doi: 10.1023/a:1015354028908. [DOI] [PubMed] [Google Scholar]
- 11.Perez-Rodriguez C, Montano N, Gonzalez K, Griebenow K. Stabilization of alpha-chymotrypsin at the CH2Cl2/water interface and upon water-in-oil-in-water encapsulation in PLGA microspheres. J Control. Release. 2003;89:71–85. doi: 10.1016/s0168-3659(03)00074-9. [DOI] [PubMed] [Google Scholar]
- 12.van de Weert M, Hennink WE, Jiskoot W. Protein instability in poly(lactic-co-glycolic acid) microparticles. Pharm. Res. 2000;17(10):1159–67. doi: 10.1023/a:1026498209874. [DOI] [PubMed] [Google Scholar]
- 13.Sluzky V, Tamada JA, Klibanov AM, Langer R. Kinetics of insulin aggregation in aqueous solutions upon agitation in the presence of hydrophobic surfaces. Proc. Natl. Acad. Sci. USA. 1991;88:9371–9381. doi: 10.1073/pnas.88.21.9377. [DOI] [PMC free article] [PubMed] [Google Scholar]
- 14.Sluzky V, Klibanov AM, Langer R. Mechanism of insulin aggregation and stabilization in agitated aqueous solutions. Biotechnol. Bioengg. 1992;40:895–899. doi: 10.1002/bit.260400805. [DOI] [PubMed] [Google Scholar]
- 15.Kwon YM, Baudys M, Knutson K, Kim SW. In situ study of insulin aggregation by water-organic solvent interface. Pharm. Res. 2001;18(12):1754–1759. doi: 10.1023/a:1013334916162. [DOI] [PubMed] [Google Scholar]
- 16.Bilati U, Alleman E, Doelker E. Nanoprecipitaion versus emulsion-based techniques for the encapsulation of proteins into biodegradable nanoparticles and process-related stability issues. AAPS PharmSciTech. 2005;6(4):E594–E603. doi: 10.1208/pt060474. [DOI] [PMC free article] [PubMed] [Google Scholar]
- 17.Jiang HL, Jin JF, Hu JF, Zhu KJ. Improvement of protein loading and modulation of protein release from poly(lactide-co-glycolide) micropsheres by complexation with proteins with polyanions. J. Microencapsulation. 2005;21(6):615–624. doi: 10.1080/02652040400000538. [DOI] [PubMed] [Google Scholar]
- 18.Kim JH, Taluja A, Knutson K, Bae YH. Stability of Bovine Serum Albumin complexed with PEG-poly(l-histidine) diblock copolymer in PLGA microspheres. J. Control. Rel. 2005;109:86–100. doi: 10.1016/j.jconrel.2005.09.016. [DOI] [PubMed] [Google Scholar]
- 19.Kabanov AV, Alakhov VY. Pluronic block copolymers in drug delivery: from micellar nanocontainers to biological response modifiers. Crt. Rev. in Ther. Drug Carr. Syst. 2002;19(1):1–73. doi: 10.1615/critrevtherdrugcarriersyst.v19.i1.10. [DOI] [PubMed] [Google Scholar]
- 20.Lee ES, Na K, Bae YH. Polymeric micelles for tumor pH and folate-mediated targeting. J. Control. Release. 2003;91(12):103–113. doi: 10.1016/s0168-3659(03)00239-6. [DOI] [PubMed] [Google Scholar]
- 21.Lee ES, Shin HJ, Na K, Bae YH. Poly(l-histidine)-PEG block copolymer micelles and pH-induced destabilization. J. Control. Release. 2003;90(3):363–374. doi: 10.1016/s0168-3659(03)00205-0. [DOI] [PubMed] [Google Scholar]
- 22.Ahmed A, Millett IS, Doniach S, Uversky VN, Fink AL. Stimulation of Insulin fibrillation by urea-induced intermediates. J. Biol. Chem. 2004;279(15):14999–15013. doi: 10.1074/jbc.M313134200. [DOI] [PubMed] [Google Scholar]
- 23.Bryant C, Spencer DB, Miller A, Bakaysa DL, McCune KS, Maple SR, Pekar AH, Brems DN. Acid stabilization of insulin. Biochemistry. 1993;32:8075–8082. doi: 10.1021/bi00083a004. [DOI] [PubMed] [Google Scholar]
- 24.Yamaguchi Y, Takenaga M, Kitagawa A, Ogawa Y, Mizushima Y, Igarashi R. Insulin-loaded biodegradable PLGA microcapsules: initial burst controlled by hydrophilic additives. J. Cont. Rel. 2002;81:235–249. doi: 10.1016/s0168-3659(02)00060-3. [DOI] [PubMed] [Google Scholar]
- 25.Ibrahim MA, Ismail A, Fetouh MI, Gopferich A. Stability of insulin during the erosion of ploy(lactic acid) and poly(lactic-co-glycolic acid) microspheres. J. Cont. Rel. 2005;106:241–252. doi: 10.1016/j.jconrel.2005.02.025. [DOI] [PubMed] [Google Scholar]
- 26.Blanco D, Alonso MJ. Protein encapsulation and release from poly(lactide-co-glycolide) microspheres: effect of the protein and polymer properties and of the co-encapsulation of surfactants. Europ. J. Pharm. Biopharm. 1998;45:285–294. doi: 10.1016/s0939-6411(98)00011-3. [DOI] [PubMed] [Google Scholar]
- 27.Jiang G, Qiu W, DeLuca P. Preparation and in vitro/in vivo evaluation of insulin-loaded poly(acryloyl-hydroxyethyl starch)-PLGA composite micropsheres. Pharm. Res. 2003;20(3):452–459. doi: 10.1023/a:1022668507748. [DOI] [PubMed] [Google Scholar]
- 28.Rosa GD, Iomelli R, Rotonda MIL, Moro A, Quaglia MF. Influence of the coencapsulation of different non-ionic surfactants on the properties of PLGA insulin-loaded microspheres. J. Cont. Rel. 2000;69:283–295. doi: 10.1016/s0168-3659(00)00315-1. [DOI] [PubMed] [Google Scholar]
- 29.Lougheed WD, Albisser AM, Martindale HM, Chow JC, Clement JR. Physical stability of insulin formulations. Diabetes. 1983;32:424–432. doi: 10.2337/diab.32.5.424. [DOI] [PubMed] [Google Scholar]
- 30.Ron E, Turek T, Mathiowitz E, Chasin M, Hageman M, Langer R. Controlled release of polypeptides from polyanydrides. Proc. Natl. Acad. Sci. USA. 1993;90:4176–4180. doi: 10.1073/pnas.90.9.4176. [DOI] [PMC free article] [PubMed] [Google Scholar]
- 31.Donsmark J, Jorgensen L, Mollmann S, Frokjaer S, Rischel C. Kinetics of Insulin adsorption at the oil-water interface and diffusion properties of adsorbed layers monitored using fluorescence correlation spectroscopy. Pharm. Res. 2006;23(1):148–155. doi: 10.1007/s11095-005-8636-3. [DOI] [PubMed] [Google Scholar]
- 32.Andersson MA, Hatti-Kaul R. Protein stabilizing effect of polyethyleneimine. J. Biotechnol. 1999;72:21–31. [Google Scholar]
- 33.Ganhorn AS, Green DW, Hershey AD, Gould RM, Plapp BV. Kinetic characterization of yeast alcohol dehydrogenases. J. Biol. Chem. 1987;262:3754–3761. [PubMed] [Google Scholar]
- 34.Teramoto M, Nishibue H, Ogawa H, Kozono H, Morita K, Matsuyama H. Effect of addition of water-soluble cationic polymers on thermal stability and activity of glucose dehydrogenase. Coll. Surf. B. Biointerf. 1996;7:165–171. [Google Scholar]
- 35.Teramoto M, Nishibue H, Ogawa H, Kozono H, Morita K, Matsuyama H, Kajiwara K. Efect of addition of polyethyleneimine on thermal stability and activity of glucose dehydrogenase. Appl. Microbiol. Biotechnol. 1992;38:203–208. [Google Scholar]
- 36.Kaibara K, Okazaki T, Bohidar HB, Dubin PL. pH-induced coacervation in complexes of bovine serum albumin and cationic polyelectrolytes. Biomacromolecules. 2000;1(1):100–107. doi: 10.1021/bm990006k. [DOI] [PubMed] [Google Scholar]
- 37.Xia J, Dubin PL, Kokufuta E, Havel H, Muhoberac BB. Light scattering, CD, and ligand binding studies of ferrihemoglobin-polyelectrolyte complexes. Biopolymers. 1999;50(2):153–161. doi: 10.1002/(SICI)1097-0282(199908)50:2<153::AID-BIP4>3.0.CO;2-4. [DOI] [PubMed] [Google Scholar]
- 38.Lin WJ, Huang LI. Influence of Pluronics on poly(ε-caprolactone) microparticles. J. Microencaps. 2001;18(2):191–197. doi: 10.1080/02652040010000370. [DOI] [PubMed] [Google Scholar]
- 39.Giunchedi P, Conti B, Genta I, Conte U, Puglisi G. Emulsion spray-drying for the preparation of albumin-loaded PLGA microspheres. Drug. Dev. & Indl. Pharm. 2001;27(7):745–750. doi: 10.1081/ddc-100107331. [DOI] [PubMed] [Google Scholar]
- 40.Johnson OL, Jaworowicz W, Cleland JL, Bailey L, Charnis M, Duenas E, Wu C, Shepard D, Magil S, Last T, Jones AJS, Putney SD. The stabilization and encapsulation of human growth hormone into biodegradable microspheres. Pharm. Res. 1997;14:730–735. doi: 10.1023/a:1012142204132. [DOI] [PubMed] [Google Scholar]
- 41.Lam XM, Duenas ET, Cleland JL. Encapsulation and stabilization of nerve growth factor into poly(lactic-co-glycolic) acid microspheres. J. Pharm. Sci. 2001;90(9):1356–1365. doi: 10.1002/jps.1088. [DOI] [PubMed] [Google Scholar]
- 42.Lee RC, Despa F, Guo L, Betala P, Kuo A, Thiyagrajan P. Surfactant copolymers prevent aggregation of heat denatured lysozyme. Annals of Biomed. Engg. 2006;34(7):1190–1200. doi: 10.1007/s10439-006-9139-z. [DOI] [PMC free article] [PubMed] [Google Scholar]
- 43.Harris JM. Introduction to biotechnical and biomedical applications of poly(ethylene glycol) In: Harris JM, editor. Poly(ethylene glycol) Chemistry: Biochemical and Biomedical Applications. Vol. 1. Plenum Press; New York: 1992. pp. 1–14. [Google Scholar]
- 44.Shao PG, Bailey LC. Porcine insulin biodegradable polyester microspheres: stability and in vitro release characteristics. Pharm. Dev. Technol. 2000;5(1):1–9. doi: 10.1081/pdt-100100513. [DOI] [PubMed] [Google Scholar]
- 45.Shao PG, Bailey LC. Stabilization of pH-induced degradation of porcine insulin. Pharm. Dev. Technol. 1999;4(4):633–642. doi: 10.1081/pdt-100101402. [DOI] [PubMed] [Google Scholar]
- 46.Yeh MK. The stability of insulin in biodegradable microparticles based on blends of lactide polymers and polyethylene glycol. J. Microencaps. 2000;17(6):743–756. doi: 10.1080/02652040050161738. [DOI] [PubMed] [Google Scholar]