Abstract
In this study, we measured the specific hydraulic conductivity (K) of Matrigel™ at 1% and 2% concentrations as a function of perfusion pressure (0 to 100 mmHg) and compared the results to predictions from two models: a fiber matrix model that predicted K of the gel based upon its composition, and a biphasic model that predicted changes in K caused by pressure induced compaction of the gels. The extent of gel compaction as a function of perfusion pressure was also assessed, allowing us to estimate the stiffness of the gels. As expected, 2% Matrigel™ had a lower K and a higher stiffness than did 1% Matrigel™. Measured values of K of both 1% and 2% Matrigel™ samples showed good agreement with the predictions of the fiber matrix model. Pressure-induced changes in K were better described by the biphasic model than a model in which uniform compression of the gel was assumed. We conclude that K of multi-component gels, such as Matrigel™, can be well characterized by fiber matrix models, and that pressure-induced changes in K of such gels can be well characterized by biphasic models.
Keywords: fiber matrix model, biphasic, basement membrane
1. Introduction
Matrigel™ Basement Membrane Matrix is a solubilized basement membrane preparation extracted from the Engelbreth-Holm-Swarm (EHS) mouse sarcoma, a tumor rich in extracellular matrix proteins. This product is used ubiquitously, not only in its most common role as a substrate for cell culture work, but also in a variety of other biomedical applications including tissue engineering and tissue reconstruction.[2, 27]
Our interest in Matrigel™ is as a model system for studying the transport properties of basement membranes. Basement membranes provide structural support for epithelial and endothelial cells layers.[9, 21] In many tissues, they also provide an important permeability barrier to both fluid and solute transport.[6, 8]
Basement membranes are composed of a variety of small proteins and proteoglycans that all likely contribute to determining the hydraulic conductivity of these membranes. The major components of Matrigel™ are laminin, collagen IV and heparan sulfate proteoglycan.[17] The hydraulic conductivity of macromolecular gels composed of a variety of different macromolecules is not a well-characterized function of composition.
In this study, we measured the hydraulic conductivity of Matrigel™ as a function of perfusion pressure. These data allowed us to determine the dependence of the hydraulic conductivity on pressure-induced compaction of the gel. We compared our results with the predictions of two theories: fiber matrix theory and biphasic theory.
Fiber matrix theory can be used to characterize the hydraulic conductivity of a gel as a function of compositionBiphasic theory indicates that the gel will be more highly compressed in the region immediately adjacent to the filter supporting the gel. As such, we also use biphasic theory to predict the dependence of the hydraulic conductivity on the perfusion pressure in order to account for this heterogeneity. The results show good agreement between the experimental data and both theoretical approaches.
2. Experimental methods
2.1. Materials
Lots of 1% (9.7, 10.2 and 10.5 mg/ml) and 2% (20.1, 20.2, and 20.6 mg/ml) Matrigel™ were obtained from BD Biosciences (San Jose, CA). These were thawed to 4°C in a refrigerator and transferred by pipette into individual 150 μl aliquots, each in a 0.5 mL plastic micro-centrifuge tube, and then refrozen at -20 °C. This process was done in order to minimize the need to thaw and refreeze the Matrigel™ samples.
For certain experiments, 2% Matrigel™ was diluted to 1% concentration using nano-pure water, filtered through a Nanopure Infinity ultrapure water system (Barnstead, Dubuque, IA). The resulting solutions were mixed by hand with a small metal bar and with a pipette for approximately 30 minutes until they appeared uniform. In experiments using diluted Matrigel™, the solutions were equilibrated with Dulbecco’s phosphate buffered saline (PBS) (Sigma, St. Louis, MO) before the start of an experiment.
2.2. Apparatus
The experimental apparatus is shown in Fig. 1. The system consists of a computer system, syringe pump and syringe, a pressure transducer, and a custom flow chamber. A Power Mac G3/300 (Apple, Cupertino, CA) runs a customized LabVIEW program (National Instruments, Austin, TX) [25] that acquires digitized (PCI-1200 analog-to-digital converter; National Instruments, Austin, TX)) real-time pressure data from a pressure transducer (142PC05D Micro Switch, ±0.5 mm Hg, Honeywell, Freeport, Illinois)and sets the flow rate on the syringe pump (Harvard Apparatus, Holliston, MA). The syringes used are gas-tight glass syringes (Hamilton, Reno, NV). A 100 μl syringe was used for low pressure experiments (less than 20 mmHg), while a 1 ml syringe was used for experiments at higher pressures.
Figure 1.
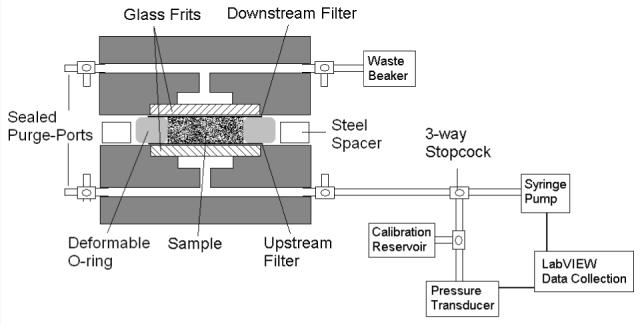
Schematic of experimental system and flow chamber.
The acrylic flow chamber was custom made. Porous glass frit discs, 12 mm in diameter and 2-3 mm thick (Adams & Chittenden Scientific Glass, Berkeley, CA), were glued with epoxy into each half of the acrylic device to support the gel. A 50 nm pore-size, 13 mm diameter polycarbonate filter (Millipore, Billerica, MA) was centered on the glass frit. These filters were used to trap the gel within the flow chamber. A rubber o-ring, 1.75 mm thick with an inner diameter of 9 mm, provided the lateral walls of the sample space. Surrounding the o-ring, a flat steel spacer, 1.25 mm thick with outer diameter 47 mm and inner diameter 32 mm, acted as a solid spacer that determined the initial thickness of the gel.
Experiments were conducted with LabVIEW software controlling the flow rate (Q) to maintain a constant perfusion pressure (Pset). If the measured pressure [P(t)] at a time t was outside of the tolerance range (± 0.2 mm Hg from Pset), the flow rate from the pump was adjusted using the following relationship,
| (1) |
where K = 0.05 μL/min2/mmHg [29]. If the pressure was within the desired pressure range, the flow rate was held steady at the average flow rate over the preceding 2 minutes.
2.3. Procedure
At the beginning of an experiment, the system was filled with the perfusion fluid, Dulbecco’s phosphate buffered saline (PBS) (Sigma, St. Louis, MO), and all air bubbles were cleared from the system. The pressure transducer was calibrated before each experiment using a column of buffer.
Two polycarbonate filters were placed in a beaker with 10 ml of perfusion fluid and sonicated (Cole-Parmer Instrument Co., Chicago, IL) for approximately 5 minutes in order to wet the filters. A filter was placed over the glass frit in one half of the flow chamber, the o-ring was positioned on top of one filter, and the solid spacer was placed around the outside perimeter of the o-ring.
An 89 μl sample of Matrigel was pipetted into the sample spaced created by the o-ring. The volume of sample used in the experiment was chosen such that when the two halves of the flow chamber were clamped together, being separated only by the spacer, the sample would be compressed approximately 10%. This was done in order to ensure a tight seal and prevent leaks.
The sample was allowed to solidify for 45 minutes at room temperature. The second filter was centered on the solidified gel, the two halves of the flow chamber were aligned, and then they were clamped together until the flow chamber was flush with the spacer and further compression was limited by its interference. The device was allowed to sit until the pressure, built up during the clamping process, remained at a stabilized value for approximately 15 minutes, which typically took 4 hours. The pressure transducer was zeroed at this value. The perfusion was then started.
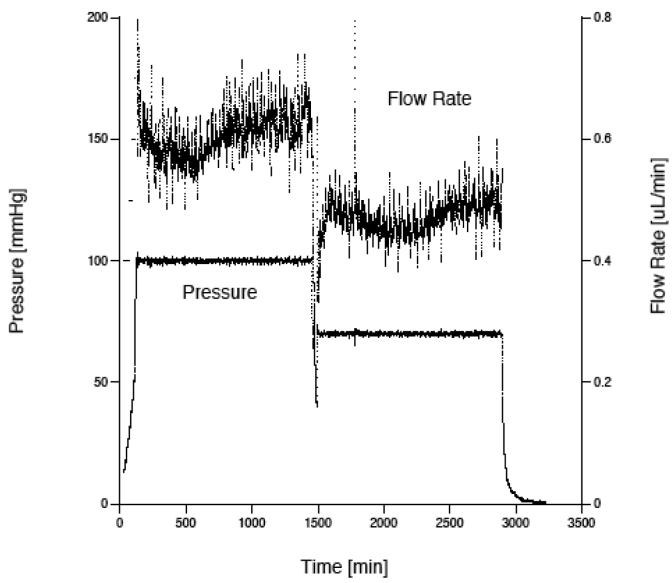
The pressure in the system increased until reaching and stabilizing at the desired pressure level (Pset). This process typically took about 5 hours. The experiment was continued for an additional 5-10 hours at this stabilized value. If another data point (at a different perfusion pressure) was to be measured, a new value of Pset was chosen and the LabVIEW program began adjusting the flow rate according to Eq. (1) to reach this new pressure level. A typical graph of the pressure and flow rate as a function of time is shown in Fig. 2. While there is considerable variability in the flow due to variations in the machining of the lead screw that advances the syringe pump, this variability is of little consequence because the flow rate and pressure are averaged over last 1-2 hours of an experiment to determine the flow resistance and hydraulic conductivity.
Figure 2.
Graph showing typical results from a Matrigel perfusion. The gel was perfused first at 100 mm Hg and then at 70 mm Hg. The upper curve is flow rate, while the lower curve is pressure.
The flow resistance (Rgel) of a gel samples was found by determining the total flow resistance of the system (pressure drop divided by flow rate: ΔP/Q) and then subtracting the resistance of the system without the gel. This latter resistance was found to be 23.6 ± 5.7 mmHg/μL/min, (mean ± S.D, n = 5), and this value was subtracted from each experimental resistance value. Resistance values of the gel samples were typically greater than 150 mmHg/μL/min, making the resistance of the system without the gel less than 15% of the total measured resistance.
Hydraulic conductivity (Lp) was determined as:
| (2) |
where A (0.64 cm2) is the cross-sectional area of the gel facing flow . The average specific hydraulic conductivity ( K̄ ) is a property of a gel at a given level of compression and is determined as:[20]
| (3) |
where μ is the fluid viscosity and h is the length of the flow path through the gel.
The parameter h is not the length of the sample space because the gel deforms under the pressure gradient, thus changing the flow-wise length. As h could not be determined during every experimental trial (to do so requires disassembly of the system to measure the thickness of the gel), we calculated the thickness of the gel based on the biphasic theory described below and verified these predictions with experimental measurements of gel thickness.
A current-sensing micrometer [10] was used to make these measurements (see Fig. 3). The system consisted of a multimeter (Sears Craftsman, Hoffman Estates, IL) with one electrode attached to the moveable arm on a micrometer (Bel-Art Scienceware, Pequannock, NJ) and the second electrode in contact with the metal conductive base. A gel sample resting on its downstream filter was taken out of the flow chamber immediately after an experiment and placed on the metal base. A voltage drop of 2 V was set across the multimeter and the electrode attached to the micrometer was lowered until a value for current registered on the device, indicating the tip of the electrode had made contact with the sample. The distance measured by the micrometer was then taken as the gel thickness, correcting for the filter thickness of 10 μm.
Figure 3.
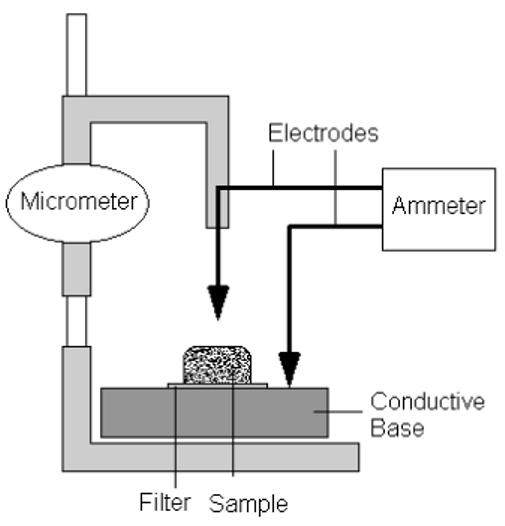
Schematic of current-sensing micrometer used to determine thickness of gel samples.
Measurements were taken on 9.7 mg/ml gels at the end of five experiments conducted at 0, 10, 50, 100, and 175 mmHg. In addition, measurements were taken on 20.2 mg/ml gels at the end of three experiments conducted at 0, 100, and 175 mmHg. The thickness of each gel was measured at six positions spread out over the gel surface and the results were averaged together. These thickness measurements were all made within 5 minutes of the conclusion of a perfusion study. We assumed that there would be a negligible change in gel thickness during this time based on the swelling time of a gel, which we estimated as μL2/(E K) [23] where E is the elastic modulus of the gel. E and K were determined in the course of our studies, and the predicted swelling time of the gels was on the order of 3 hours, much longer than our measurement time.
2.4. Leakage testing
Leakage testing was done on the system to ensure that flow channeling around the gel was not occurring. To test for this possibility, 200 nm red latex microspheres (Polysciences Inc, Warrington, PA) at 0.025% by volume in phosphate buffered saline were perfused through the system containing Matrigel™ at a concentration of 10.2 mg/ml. As the microspheres were larger than the pore size of the filters used in our perfusion system, the upstream filter was removed, allowing the microspheres to perfuse into the sample chamber. The microspheres were expected to accumulate at the surface of the gel and enter any location with an opening size larger than 200 nm, thus marking any potential leak paths.
The system was perfused with the microspheres at constant flow rate of 1 μl/min for 240 min, enough time to ensure the entire volume of gel had been replaced by the perfusion fluid. As soon as the flow was stopped, the o-ring with the gel and downstream filter were removed from the flow chamber and were submerged in liquid nitrogen. The samples were transferred from the liquid nitrogen to a microtome at -20 °C and digital photographs (Olympus, Melville, NY) of the gel were taken. The results showed the microparticles trapped uniformly on the top of the gel with no evidence of leakage. [22]
3. Theoretical models
3.1. Fiber matrix model
Fiber matrix theory has been successfully used to predict the specific hydraulic conductivity of a variety of porous media,[13] including macromolecular networks [12, 20]. In this approach, a typical particle in the porous medium is modeled within a unit cell. At the border of the unit cell, a boundary condition is applied (typically zero shear) that accounts for the viscous effects of the other fibers. The hydraulic conductivity is determined by solving the Stokes Eq.s within this space and then generalizing to the entire porous medium.[11]
This approach is useful, but limited to a single fiber radius. As Matrigel™ is composed principally of three macromolecules of different size (collagen IV, laminin, and heparan sulfate), we require a generalization of the fiber matrix model to allow for a medium composed of fibers of different radii. A key parameter in the unit cell model is the size of the unit cell. For a single fiber type, the unit cell is chosen such that the solid fraction within the unit cell is the same as that in the medium as a whole. For multiple fiber types, a different unit cell needs to be considered for each fiber type, and then an aggregate hydraulic conductivity can be determined.
While it would be natural to choose the volume fraction (πai2/πbi2), where (ai) is the fiber type radius and (bi) is the unit cell radius, for each cell type to match the volume fraction of that component (ϕi), such a method ignores hydrodynamic interactions between different fiber types, and does not reproduce the correct limiting behavior for a mixture of very small and very large fibers (see below). An alternate approach that kept bi as a constant for all cells fails at large solid fraction due to overlapping domains.
Instead, we chose the unit cell radius for each fiber type radius such that the distance to the edge of the unit cell from the fiber (bi - ai= λ) was a constant for all fiber sizes (see Fig. 4). λ is determined by the constraint that the average solid fraction, summed over all unit cells, must be equal to the solid fraction of the medium as a whole.
Figure 4.
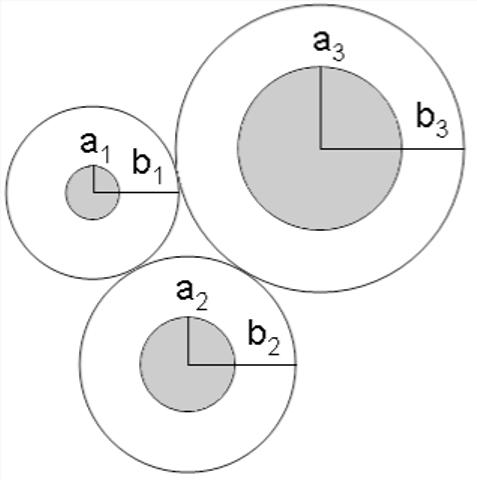
Schematic showing method used to calculate the cell size in the fiber matrix model where bi-ai=λ.
We introduce the number density, ni, of fiber radius ai as the fraction of the total number of fibers in a random cross-section:
| (4) |
Then, the above mentioned constraint becomes:
| (5) |
Substituting bi=λ+ai into Eq. (5), λ is found by solving the resulting quadratic Eq.:
| (6) |
The specific hydraulic conductivity of this network was calculated as follows. First, for each fiber type, the specific hydraulic conductivity Ki(bi, ai) of a network composed solely of type i fibers was found using Happel’s model for a random fibrous porous medium.(5) Then, the specific hydraulic conductivity of the network was calculated as
| (7) |
where N is the number of fiber types (three for Matrigel™).[7]
As a verification of this approach, we examined the behavior of the specific hydraulic conductivity of a mixture of fibers of two sizes, one fine (af) and the other coarse (ac), as the value of ac/af became large (keeping the total solid fraction of both fiber sizes constant). The model properly predicted that the specific hydraulic conductivity of this system, for large values of ac/af, was the same as that calculated by applying Darcy’s law in the spaces around the large fibers (K = Kf(1-ϕ)/(1+ϕ3)), with the specific hydraulic conductivity in these spaces (Kf) determined only by the size and concentration of the small fibers.[26] This was not true for other methods of characterizing the unit cells sizes including using a single average value of bi, or defining each bi as bi = ai/√ϕi.[22]
The fiber matrix model predictions for the specific hydraulic conductivity of Matrigel™ were then determined for both the 1% and 2% gels. The manufacturer’s information on Matrigel™ gives the compositions by weight as: collagen type IV - 60%, laminin - 33%, and heparan sulfate - 5.4%. Using radii for the three fibers of 0.7 nm, 0.6 nm and 0.5 nm, respectively,[3, 4, 19] Eq. (6) yields λ=5.64 nm for 1% Matrigel™ and λ= 3.8 nm for 2% Matrigel™. Values of Ki(bi,ai) were then calculated and used in Eq. (7) to determine the specific hydraulic conductivity of the gel under zero pressure load.
As the gels compress under pressure, the solid fractions of the fibers will increase. To account for the effect of this compression on hydraulic conductivity, we allowed the solid fraction of the gel to increase uniformly with the extent of compression such that
| (8) |
where ϕ0 is the solid fraction of the undeformed gel and h0 its undeformed height. h is found using methods described below.
3.2. Biphasic model
The fiber matrix theory allows us to characterize the specific hydraulic conductivity of Matrigel™ based on its composition. By allowing that the solid fraction of the gel increases as the gel deforms under pressure loading, the fiber matrix model can also be used to estimate how much this compression will decrease the specific hydraulic conductivity of the gel. However, the fiber matrix model cannot predict how much the gel will deform under the pressure loading, nor can it predict the heterogeneous distribution of gel that will result from this pressure loading. Accurate predictions of the effects of pressure on hydraulic conductivity need to include this heterogeneity. Pressure induced flow through and deformation of a gel is best characterized using a biphasic theory.[24]
We followed the approach of Johnson and Tarbell [14], who developed a one-dimensional biphasic model that is confined in the directions perpendicular to a flow (Q) of viscosity μ.1 They characterized the gel in terms of three properties: undeformed specific hydraulic conductivity, K0; confined compression modulus, HA, which is a function both of its elastic modulus (E) and its Poisson ratio (ν),
| (9) |
and a parameter M. The elastic modulus is not that of the gel, but only of the solid skeleton of the matrix. The Poisson’s ratio is also that of this skeleton, and thus will not be equal to 1/2 even for an incompressible solid fraction (otherwise HA would be infinite).[1]
The parameter M characterizes the dependence of the specific hydraulic conductivity on tissue compaction,[18]
| (10) |
where Ψ is the dilation for the medium. If u(x) is the deformation of the gel in the flow wise direction at a location x, then Ψ=du/dx. For small deformations, fiber matrix theory can be used to predict that M=1.17.[14] We use that value here.
With these definitions, Johnson and Tarbell found that if the initial thickness of the gel was h0, then its final thickness h can be found from the following implicit equation:
| (11) |
and the pressure drop across the medium can then be found as:
| (12) |
Eqs. (11) and (12) can be combined to isolate the compaction ratio (h/h0) in terms of M and β, where β=MΔP/HA:
| (13) |
Note that as ΔP becomes large, Eq. (13) predicts that the compression will reach a limit such that:
| (14) |
With a value of M=1.17, we can predict that at high perfusion pressures, the gels should compress to roughly 1/2 of their undeformed thickness.
Combining Eqs.(11) and (12) with Eq. (3), the biphasic theory can be used to predict the average specific hydraulic conductivity of a gel as a function of its unloaded specific hydraulic conductivity and the perfusion pressure,
| (15) |
4. Results
4.1. Gel tThickness
The results from the thickness measurement experiments are shown in Fig. 5.
Figure 5.
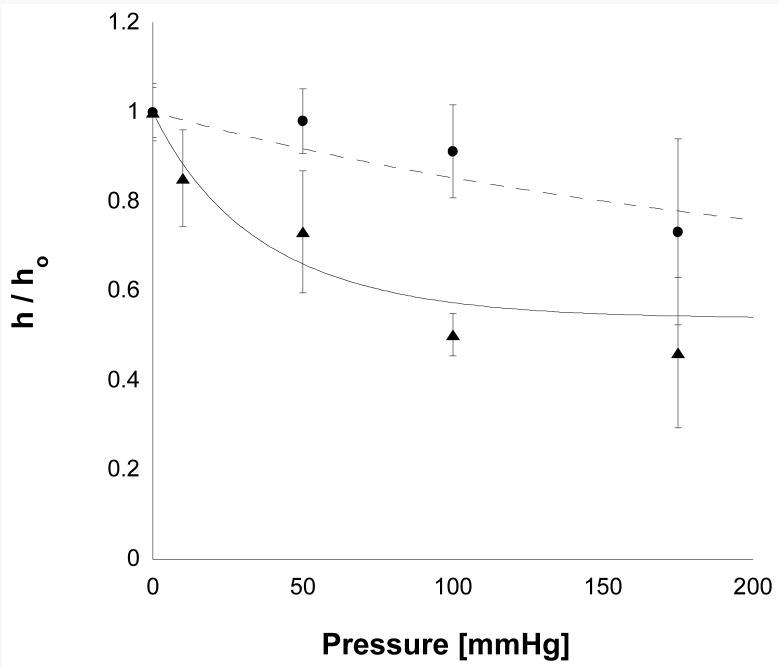
The compaction ratio (h/h0) as a function of perfusion pressure for 1% Matrigel (triangles, 9.7 mg/ml) and for 2% Matrigel (circles, 20.2 mg/ml). Error bars are standard deviations (n varied between 4 and 8). The solid line and the dashed lines are the best fits of Eq. (13) to these data.
1% Matrigel™ showed significant compaction even at lower perfusion pressures, reaching a compaction of roughly 1/2 at 100 mmHg. At pressures higher than this, little additional compaction was seen.
2% Matrigel™ was much more resistant to compaction than the 1% preparations. Whereas the lower concentration gels had dropped to approximately 1/2 of their original thickness at 100 mmHg, the higher concentration gels had only compacted 8% at 100 mm Hg and 26% at 175 mmHg.
These data were fit to Eq. (13) using a least square fit. The best fit values were HA= 36 mmHg for 1% gels and HA= 269 mmHg for 2% gels. As predicted by Eq. (10), the thickness of the 1% gel did approach a limit of roughly 50% compression at high pressures. This limit was not seen in the 2% gel, presumably because the experiments were not conducted at sufficiently high perfusion pressures.
Using these values of HA for the gels and with M=1.17, Eq. (13) was used to estimate the thickness (h) of each gel as a function of perfusion pressure. Along with the measured flow rate at each perfusion pressure, this value of h was used in Eq. (3) to then determine the measured specific hydraulic conductivity of the Matrigel™ preparations as a function of perfusion pressure. Eq. (13) was also used to calculate the average increase in solid fraction in the gel as a function of perfusion pressure (holding hϕi constant for each component of the matrix gel), so that the fiber matrix model could be used to predict the pressure dependence of the specific hydraulic conductivity.
4.2. Specific Hydraulic Conductivity
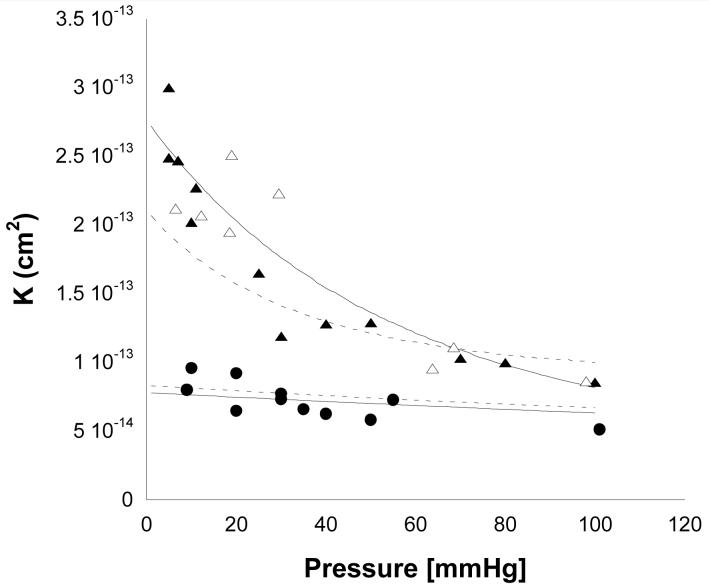
The results for three different preparations of Matrigel™ are shown in Fig. 6. Increased perfusion pressure led to a decreased value of Lp(data not shown) and a decreased K for the low concentration preparations of Matrigel™ (1% Matrigel™ and 2% Matrigel™ diluted to 1%). However, little pressure dependency of K (or Lp) was seen for the 2% Matrigel™. As expected, higher concentrations of Matrigel™ had lower values of K than did the lower concentrations, and 1% Matrigel™ behaved very similarly to 2% Matrigel™ diluted to 1%. The results did not depend on whether a particular gel was perfused first at low and then at high pressure, or whether the opposite order was used (data not shown [22]).
Figure 6.
Average specific hydraulic conductivity (K̄) as a function of perfusion pressure for 1% Matrigel™ (open triangles), 2% Matrigel™ diluted to 1% (solid triangles) and 2% Matrigel™ (solid circles). Also shown are predictions from fiber matrix theory (dashed lines) and biphasic theory (solid lines). The upper two lines are the predictions for the lower concentration of Matrigel™, while the lower two lines are for the higher concentration.
Comparison of the data to predictions of the fiber matrix theory gave generally good results as shown in Fig. 6. However, not surprisingly, the fiber matrix model did not completely capture the dependence of K on the perfusion pressure, since it was combined with a deformation model in which uniform compression of the gel was assumed. However, even in this situation, the fiber matrix model gave reasonable agreement with the experimental data and showed the correct trends.
The biphasic theory was fit to the experimental data using a single adjustable parameter, the value of K at zero perfusion pressure (K0). This was determined using a least squares fit to the data. The resulting fit of the biphasic model to the data showed good agreement with the data over the entire range of perfusion pressures for both the low and higher concentration of gels.
5. Discussion
Our goal in this work was to characterize the specific hydraulic conductivity of Matrigel™ Basement Membrane Matrix as a function of perfusion pressure and to determine how well its behavior could be characterized by two models: one based on fiber matrix theory and the other on biphasic theory. The latter theory required a characterization of the stiffness of these gels. We found that the 2% Matrigel™ preparations were nearly an order of magnitude stiffer than the 1% preparations. Using these values of stiffness, we predicted the extent to which each of the gels would compress as a function of perfusion pressure. The gel thickness values so determined were then used in our determinations of specific hydraulic conductivity.
While the hydraulic conductivities of the stiff 2% Matrigel™ preparations were only weakly sensitive to perfusion pressures, the lower concentration gels were much more sensitive (Fig. 6). Presumably, the much lower confined compression modulus of the lower concentration gels was responsible for this pressure sensitivity.
In general, both theoretical models gave good agreement with the experimental data. We extended the fiber matrix model to allow for multiple fiber sizes and hydrodynamic interactions between the different fiber sizes. The resulting predictions for both 1% and 2% Matrigel™ preparations were in good agreement with the general level of K measured (Fig. 6), especially considering that there were no adjustable parameters in this theory.
As the fiber matrix model only describes the pressure distribution, and not the stress distribution in the gel, we were not able to use this model to predict how the gel would deform with increasing perfusion pressure. However, by assuming a homogeneous compression in the gel, and using the predicted gel thickness values as a function of perfusion pressure, we did use the fiber matrix model to predict the changes in K with increasing perfusion pressure. This model was not able to completely capture the pressure dependency of the K of the 1% Matrigel™ preparations.(Figure 6)
This limitation of assuming uniform compression was anticipated, as the pressure and stress loading on the Matrigel™ are expected to lead to a non-uniform distribution of the gel with a higher degree of compression at the location where the gel is supported (the downstream filter). The pressure dependency of K is better captured by the biphasic model (Fig. 6). This model determines the stress in the solid matrix and thereby can determine the local strain distribution. The only adjustable parameter in this model is the value of K at zero perfusion pressure (K0). The other parameters necessary for the model were either determined independently from other experimental measurements (HA) or theoretically (M). The agreement of the theory in this case is quite good.
The prediction that gel compression should reach a limit at high pressure was borne out by our experimental measurements on the 1% Matrigel™ preparations. This was seen both in our measurements of gel thickness and in our measurements of Lp. Klaentschi et al. [16] also found that, above 60 mm Hg, there was little effect of increasing pressure on Lp of Matrigel™. This theoretical prediction is a direct consequence of the assumed exponential dependence of K on tissue volumetric strain (Eq. 10). Robinson and Walton [28] found that glomerular basement membrane continues to be somewhat compressible at very high perfusion pressures (up to 1500 mm Hg). Their results suggest that, not surprisingly, Eq. (10) breaks down at high levels of strain.
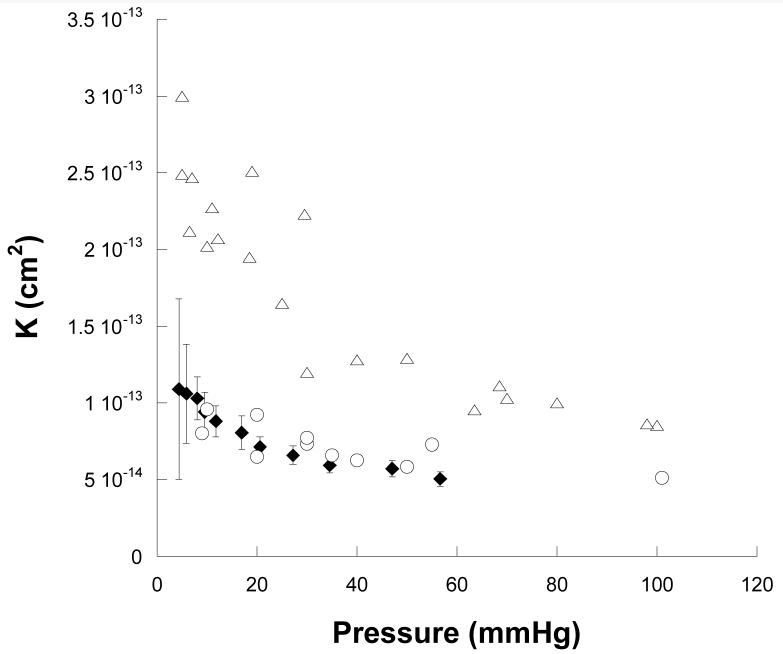
Other studies have also measured Lp of Matrigel™ as a function of perfusion pressure. Klaentschi et al. [16] reported measurements for Matrigel™ at a concentration of 14.1 mg/ml. Using their data and the single mean thickness measurement of the gel layer of 66 μm that they reported, we estimated K from their studies. Although their values are a little lower than one might have expected based upon our results (Fig. 7) given the methodological differences (in their studies, gel thickness was not measured as a function of perfusion pressure, flow resistance of the system without gel was not corrected for, and hydrostatic pressure of the upstream buffer was not included in driving pressure), their results are in surprisingly good agreement with ours.
Figure 7.
Average specific hydraulic conductivity (K̄)as a function of perfusion pressure for Matrigel at a concentration of 14.1 mg/ml (Klaentschi et al. [16], filled diamonds with standard deviations added) as compared with our results for low concentrations of Matrigel™ (9.7-10.5 mg/ml: open triangles), and high concentrations of Matrigel™ (20.1-20.6 mg/ml, open circles).
An earlier study by Katz et al. [15] also reported values for Lp of Matrigel™. Determination of K from their data is made difficult by their reported level of gel compression. They reported conducting experiments using 100 μl of Matrigel™ spread over a polycarbonate filter of area 0.64 cm2 that would result in an initial gel thickness of 1500 μm. Based on electron micrographic examination, they found that the gel compressed down to a final thickness of 3.6 μm. For an initial Matrigel™ concentration reported as 8-14 mg/ml, this would have resulted in a final Matrigel™ concentration of roughly 5 g/ml, an impossible result. As such, we are unable to compute specific hydraulic conductivity from their data.
Our conclusions agree generally with those of Klaentschi: Matrigel is compressible at lower perfusion pressures. Daniels et al. [5] reached a similar conclusion for glomerular basement membrane. We found that both the concentration of Matrigel™ and the perfusion pressure influences its specific hydraulic conductivity, more so at lower perfusion pressures and lower Matrigel™ concentrations. Our modeling studies demonstrated that fiber matrix theory does a surprisingly good job of predicting the uncompressed hydraulic conductivity of Matrigel™. A biphasic model, while not able to predict the hydraulic conductivity of Matrigel™ from first principles, nonetheless requires determination of only a few parameters and can then be used to make excellent predictions of the hydraulic behavior of Matrigel™ as it compresses.
Acknowledgements
This study is supported by grants from NIH EY014662 and The American Health Assistance Foundation.
Footnotes
We note that the 10% loading of the gel during setup is not included in this modeling. This loading would only affect the gel deformation at low perfusion pressures (less than 4 mm Hg for the 1% gels, and less than 30 mm Hg for the 2% gels).
References
- [1].Biot MA. General theory of three-dimensional consolidation. J. Appl. Phys. 1941;12:155–164. [Google Scholar]
- [2].Cassell OC, Morrison WA, Messina A, Penington AJ, Thompson EW, Stevens GW, Perera JM, Kleinman HK, Hurley JV, Romeo R, KR K. The Influence of Extracellular Matrix on the Generation of Vascularized, Engineered, Transplantable Tissue. Ann. N. Y. Acad. Sci. 2001;944:429–442. doi: 10.1111/j.1749-6632.2001.tb03853.x. [DOI] [PubMed] [Google Scholar]
- [3].Chen CH, Clegg DO, Hansma HG. Structures and dynamic motion of laminin-1 as observed by atomic force microscopy. Biochemistry (Mosc) 1998;37:8262–8267. doi: 10.1021/bi973097j. [DOI] [PubMed] [Google Scholar]
- [4].Chen CH, Hansma HG. Basement membrane macromolecules: insights from atomic force microscopy. J. Struct. Biol. 2000;131:44–55. doi: 10.1006/jsbi.2000.4252. [DOI] [PubMed] [Google Scholar]
- [5].Daniels BS, Hauser EB, Deen WN, Hostetter TH. Glomerular basement membrane: in vitro studies of water and protein permeability. Am. J. Physiol. 1992;262:F919–F926. doi: 10.1152/ajprenal.1992.262.6.F919. [DOI] [PubMed] [Google Scholar]
- [6].Drumond M, Deen W. Stokes flow through a row of cylinders between parallel walls: model for the glomerular slit diaphragm. J. Biomech. Eng. 1994;116:184–189. doi: 10.1115/1.2895718. [DOI] [PubMed] [Google Scholar]
- [7].Ethier CR. S.M. Thesis in Mechanical Engineering. Massachusetts Institute of Technology; Cambridge: 1983. Hydrodynamics of Flow Through Gels with Applications to the Eye. [Google Scholar]
- [8].Farquhar M. The glomerular basement membrane: a selective macromolecular filter. In: Hay ED, editor. Cell Biology of Extracellular Matrix. Plenum; New York: 1981. pp. 335–378. [Google Scholar]
- [9].Fisher R. The elastic constants of the human lens. J. Physiol. (Lond. 1971;212:147–180. doi: 10.1113/jphysiol.1971.sp009315. [DOI] [PMC free article] [PubMed] [Google Scholar]
- [10].Grodzinsky AJ. Electromechanical and physicochemical properties of connective tissue. Crit. Rev. Biomed. Engg. 1983;9:133–199. [PubMed] [Google Scholar]
- [11].Happel J, Brenner H. Low Reynolds Number Hydrodynamics. Martinus Nijhoff Publishers; the Hague, the Netherlands: 1983. p. 153. [Google Scholar]
- [12].Jackson GM, James DF. The hydrodynamic resistance of hyaluronic acid and its contribution to tissue permeability. Biorheology. 1982;19:317–330. doi: 10.3233/bir-1982-191-234. [DOI] [PubMed] [Google Scholar]
- [13].Jackson GW, James DF. The permeability of fibrous porous media. The Can. J. Chem. Eng. 1986;64:364. [Google Scholar]
- [14].Johnson M, Tarbell J. A biphasic, anisotropic model of the aortic wall. ASME J. Biomech. Eng. 2001;123:52–57. doi: 10.1115/1.1339817. [DOI] [PubMed] [Google Scholar]
- [15].Katz MA, Barrette TB, Krasovich M. Hydraulic conductivity of basement membrane with computed values for fiber radius and void volume. Am. J. Physiol. Heart Circ. Physiol. 1992;263:H1417–H1421. doi: 10.1152/ajpheart.1992.263.5.H1417. [DOI] [PubMed] [Google Scholar]
- [16].Klaentschi K, Brown JA, Niblett PG, Shore AC, Tooke JE. Pressure-permeability relationships in basement membrane: effects of static and dynamic pressures. Am. J. Physiol. Heart Circ. Physiol. 1998;274:H1327–H1334. doi: 10.1152/ajpheart.1998.274.4.H1327. [DOI] [PubMed] [Google Scholar]
- [17].Kleinman HK, McGarvey ML, Liotta LA, Gehron-Robey P, Tryggvason K, Martin GR. Isolation and characterization of native type IV collagen from the EHS sarcoma. Biochemistry. 1982;24:6188–6193. doi: 10.1021/bi00267a025. [DOI] [PubMed] [Google Scholar]
- [18].Lai W, Mow V. Drag induced compression of articular cartilage during a permeation experiment. Biorheology. 1980;17:111–123. doi: 10.3233/bir-1980-171-213. [DOI] [PubMed] [Google Scholar]
- [19].Leblond CP, Inoue S. Structure, composition, and assembly of basement membrane. Am. J. Anat. 1989;185:367–390. doi: 10.1002/aja.1001850403. [DOI] [PubMed] [Google Scholar]
- [20].Levick JR. Flow through interstitium and other fibrous matrices. Q. J. Exp. Physiol. 1987;72:409–437. doi: 10.1113/expphysiol.1987.sp003085. [DOI] [PubMed] [Google Scholar]
- [21].Martinez-Hernandez A, Amenta PS. The basement membrane in pathology. Lab. Invest. 1983;48:656–677. [PubMed] [Google Scholar]
- [22].McCarty WJ. MS Thesis in Biomedical Engineering. Northwestern University; Evanston, Illinois: 2006. A Matrigel™ Model of the Hydraulic Conductivity of Bruch’s Membrane in Age-Related Maculopathy. [Google Scholar]
- [23].Mow VC, Hayes WC. Basic orthopaedic biomechanics & mechano-biology. Lippincott Williams & Wilkins; Philadelphia: 1997. [Google Scholar]
- [24].Mow VC, Holmes MH, Lai WM. Fluid transport and mechanical properties of articular cartilage: A review. J. Biomech. 1984;17:377. doi: 10.1016/0021-9290(84)90031-9. [DOI] [PubMed] [Google Scholar]
- [25].Overby D. PhD Thesis in Mechanical Engineering. Massachusetts Institute of Technology; Cambridge: 2002. Hydrodynamics of Aqueous Humor Outflow. [Google Scholar]
- [26].Overby D, Ruberti J, Gong H, Freddo T, Johnson M. Specific hydraulic conductivity of corneal stroma as seen by quick-freeze/deep-etch. J. Biomech. Eng. 2001;123:154–161. doi: 10.1115/1.1351888. [DOI] [PubMed] [Google Scholar]
- [27].Patrick CW., Jr. Breast tissue engineering. Annu. Rev. Biomed. Eng. 2004;6:109–130. doi: 10.1146/annurev.bioeng.6.040803.140032. [DOI] [PubMed] [Google Scholar]
- [28].Robinson GB, Walton HA. Glomerular basement membrane as a compressible ultrafilter. Microvasc. Res. 1989;38:36–48. doi: 10.1016/0026-2862(89)90015-0. [DOI] [PubMed] [Google Scholar]
- [29].Whale MD, Grodzinsky AJ, Johnson M. The effects of age and pressure on the specific hydraulic conductivity of aortic wall. Biorheology. 1996;33:17–44. doi: 10.1016/0006-355x(96)00003-0. [DOI] [PubMed] [Google Scholar]


