

Abstract
Effects of protein conformation on electron capture dissociation (ECD) were investigated using high-field asymmetric waveform ion mobility spectrometry (FAIMS) and Fourier-transform ion cyclotron resonance mass spectrometry. Under the conditions of these experiments, the electron capture efficiency of ubiquitin 6+ formed from three different solution compositions differs significantly, ranging from 51 ± 7% for ions formed from an acidified water/methanol solution to 88 ± 2% for ions formed from a buffered aqueous solution. This result clearly indicates that these protein ions retain a memory of their solution-phase structure and that conformational differences can be probed in an ECD experiment. Multiple conformers for the 7+ and 8+ charge states of ubiquitin were separated using FAIMS. ECD spectra of conformer selected ions of the same charge states differ both in electron capture efficiency and in the fragment ion intensities. Conformers of a given charge state that have smaller collisional cross sections can have either a larger or smaller electron capture efficiency. A greater electron capture efficiency was observed for ubiquitin 6+ that has the same collisional cross section as one ubiquitin 7+ conformer, despite the lower charge state. These results indicate that the shape of the molecule can have a greater effect on electron capture efficiency than either collisional cross section or charge state alone. The cleavage locations of different conformers of a given charge state were the same indicating that the presence of different conformers in the gas phase is not due to difference in where charges are located, but rather reflect conformational differences most likely originating from solution. Small neutral losses observed from the singly- and doubly-reduced ubiquitin 6+ do not show a temperature dependence to their formation, consistent with these ions being formed by nonergodic processes.
Capture of electrons by multiply protonated peptides or proteins can result in extensive backbone fragmentation from which information about sequence [1-20] and posttranslational modifications [7-9] can be obtained. Methods based on this electron capture process appear promising for bottom up and top down approaches in proteomics due to the high information content obtained in the fragmentation spectra [10-12]. Sequence coverage of over 90% has been reported for small proteins [13]. Several methods for implementing electron capture that use different electron sources have been reported: electron capture dissociation (ECD) with free electrons from a heated filament or cathode [1-3], electron-transfer dissociation utilizing anion reagents [14-17], electron removal by electron impact followed by capture of a free electron in electronic excitation dissociation [18], and collisionally induced electron-transfer from neutral atoms or molecules [19, 20].
A consequence of the extensive fragmentation produced by ECD is that the precursor ion population can be fractionated into potentially hundreds or even thousands of fragment ions. Thus, the intensity of any particular fragment ion is typically small compared with the original precursor ion intensity [1]. High electron capture and fragmentation efficiency are critical for making ECD a useful analytical method in cases where sample is limited.
Electron capture efficiency depends on several experimental parameters as well as the charge state of the ion. Electron capture efficiencies ranging from less than 10% [21] to about 90% [22, 23] have been reported. Using a point charge model, Zubarev et al. reported that the electron capture cross section varies by the square of the charge of the ion [1, 22, 24] resulting in a significant increase in electron capture efficiency for higher charge state ions. Experimental data for three charge states from three different peptide and protein ions were consistent with a z2 dependence [22] as were results for the 2+ through 5+ charge states of a small peptide [23]. McLafferty and coworkers suggested that fragmentation efficiency also depends on the gas-phase conformation of the ion with more compact conformations having lower fragmentation efficiencies due to noncovalent interactions that hold the fragments together [13].
Protein conformations in the gas phase have been investigated using H/D exchange [25-27], drift tube ion mobility spectrometry (IMS) [28-30], proton transfer reactivity [31-33], ion-surface imprinting [34], dissociation experiments [13, 35], and high-field asymmetric waveform ion mobility spectrometry (FAIMS) [36, 37]. FAIMS can be used to rapidly separate different gas-phase conformers before their introduction into a mass spectrometer. This separation method can be readily interfaced to most mass spectrometers, including Fourier-transform ion cyclotron resonance (FT/ICR) mass spectrometers [38, 39], the type of instrument used for most ECD experiments [3].
The separation of ions in FAIMS is based on the difference between ion mobility at high and low electric fields [37]. Ions are introduced into the FAIMS device between two electrodes. An asymmetric waveform consisting of a high voltage for a short time and a lower voltage of opposite polarity for a longer time is applied to the electrodes. This results in the displacement of the ion towards one and then the other electrode. If the mobility of the ion does not significantly depend on the magnitude of the electric field, the ion will have essentially zero net displacement between the electrodes. For most ions, there is a difference between the high and low field mobility and the ion will have a net displacement towards one of the electrodes. An additional DC voltage, or compensation voltage (CV), is applied to an electrode to compensate for this displacement. Ions are transmitted through the FAIMS device by selecting the appropriate CV.
FAIMS separations are sensitive to several different physical properties of the ions, including collisional cross section [40]. However, as currently implemented, absolute cross section measurements cannot be obtained with FAIMS, but can be measured using complimentary techniques in conjunction with FAIMS. Purves et al. measured the collisional cross sections of ubiquitin ions transmitted through the FAIMS device at several different compensation voltages by using retarding potential measurements and correlated highly accurate collisional cross section data for these ions using drift tube IMS to CV values in FAIMS [40]. Thus, FAIMS can be used to separate ubiquitin conformers, even within the same charge state, of known collisional cross section before electron capture dissociation.
Here, we characterize the effect of gas-phase conformation on electron capture dissociation of bovine ubiquitin, by using different electrospray solutions to change the ubiquitin conformer distribution and charge states and by selecting ubiquitin conformers of known collisional cross sections with FAIMS. We demonstrate, for the first time, conformational effects on electron capture dissociation for ions of the same charge state.
Experimental
Ion Formation
All ions are generated via nanoelectrospray ionization using pulled borosilicate capillaries that have an i.d. of ∼2 μm at the tip. A potential of about 2300 V is applied to a platinum wire that is inserted into the nanoelectrospray capillary and is in direct contact with the solution. The tip is positioned ∼7 mm from the FAIMS curtain plate electrode. Three different solutions of bovine erythrocyte ubiquitin (Aldrich, Milwaukee, WI) are prepared at a concentration of 10−5 M to generate charge states between 4+ and 12+. A solution of deionized water buffered with 200 mM ammonium bicarbonate is used to generate the 4+ and 5+ charge states. A 49.9/49.9/0.2 by volume solution of deionized water/methanol/acetic acid is used to produce the 6+ and 7+ charge states. A water/methanol solution with 1.0% acetic acid is used to produce the 8+ through 12+ charge states.
FAIMS
An Ionalytics Selectra (Thermo Electron Corporation, Waltham, MA) is used for these experiments and the interface of this device to the Berkeley-Bruker 9.4 tesla FT/ICR mass spectrometer has been described previously [39]. The asymmetric waveform that is applied to the FAIMS electrode consists of a sine function waveform with a second-harmonic phase shifted 90 degrees [41] and is operated such that the peak amplitude of this potential, or dispersion voltage, is −3400 V. The outer cylindrical electrode and capillary entrance are at −30 V relative to ground for all experiments. The curtain plate on the face of the electrode is held at 1000 V. Nitrogen is used as the carrier gas with a flow rate of 2.0 L/min.
Compensation voltage (CV) scans are obtained via a linear sweep of voltage from −1.0 to −12.0 V. Mass spectra are acquired at CV intervals of −0.1 V.
Fourier Transform Ion Cyclotron Resonance Mass Spectrometry
The Berkeley-Bruker 9.4 T (Bruker Daltonics, Billerica, MA) FT/ICR mass spectrometer used in these experiments has been described previously [42]. Ions are externally accumulated in a hexapole ion trap for 0.15 s before injection into the extended pseudo-open cylindrical (EPOC) cell [38]. Ions are accumulated in the EPOC cell from three injections and individual charge states are isolated using correlated shot techniques before ECD. Transients consisting of 1 M data points are obtained and then 48 transients are summed for each mass spectrum to improve S/N.
ECD
Electrons are generated using a barium tungsten dispenser cathode (HeatWave Labs, Watsonville, CA), which is mounted axially within the EPOC ion cell support rod to ensure maximal overlap of the ion cloud with the electron beam [23]. Additionally, a modification to the cell has been made to allow the dispenser cathode to be displaced off axis for axial laser photo-dissociation experiments. The cathode is resistively heated with a DC current of about 3.9 A. A potential of 9.0 V is applied to a copper grid located ∼1 cm in front of the cathode. A potential of 0.0 V is applied to the cathode to prevent electrons from reaching the center of the cell and interacting with the ions. ECD is enabled by changing the cathode housing potential from 0.0 to −2.0 V for 30 ms, during which time electrons are injected into the cell center. A 50 ms pulse of nitrogen gas is used after the ECD event, followed by a 5 s delay to reduce the pressure inside the cell before excitation and detection.
Data Analysis
All data analysis is done using R statistical analysis software (R Foundation for Statistical Computing, Vienna, Austria) version 2.0.1. For each mass spectrum, the intensity for all fragment ions, reduced molecular ions, and residual precursor ion are visually verified against a corresponding calculated isotope distribution to ensure correct ion identification. All isotope distribution calculations were done using Xmass software (Bruker Daltonics, Billerica, MA). Electron capture efficiency (EffEC) is calculated using eq. 1
| (1) |
where Iprecursor, Ifragment, and Ireduced are the residual precursor, the fragment ion, and the reduced molecular ion intensities, respectively. Fragmentation efficiency (Efffragment) is calculated for each mass spectrum using eq. 2.
| (2) |
Note that the denominator of both eqs 1 and 2 correspond to the total ion abundance in an ECD spectrum. Error limits for electron capture and fragmentation efficiencies are reported as ±one standard deviation of three replicate measurements.
Results and Discussion
Effects of Solution Composition on Electron Capture Efficiency
Electrospray ionization of 10 μM ubiquitin in solutions of 49.5/49.5/1 by volume (Figure 1a), 49.9/49.9/0.2 water/methanol/acetic acid (Figure 1b), and 200 mM ammonium bicarbonate aqueous solution (Figure 1c) result in spectra with three different charge state distributions. The charge state distributions from the water/methanol/acetic acid solutions are bimodal and are centered around 7+ and 10+ for the most acidic solution (Figure 1a) and 7+ and 9+ for the less acidic solution (Figure 1b). The 5+ is the predominant charge state from the buffered aqueous solution (Figure 1c). The change in observed charge state distributions of proteins as a function of solution pH or composition is well known [43, 44] and has been attributed to different populations of ubiquitin conformers present in the different solutions [45-47], although many other factors affect charge state distributions as well [48, 49].
Figure 1.

ESI mass spectra of bovine ubiquitin from 10−5 M solutions consisting of (a) 49.5/49.5/1, by volume water/methanol/acetic acid, (b) 49.9/49.9/0.2 water/methanol/acetic acid, and (c) 200 mM ammonium bicarbonate in water. ECD mass spectra of isolated ubiquitin 6+ for solutions (a–c) are shown in (d–f), respectively. The peaks in (a–c) are (ubiquitin + nH)n+ where n is the charge as indicated in the figure. In (d–f), the residual precursor ion peak and reduced molecular ion peaks capturing one and two electrons are labeled. Fragment ions below m/z 1300 are not shown.
Ubiquitin 6+ from the three different solutions were isolated and then subjected to ECD (Figure 1d–f). Upon capturing an electron, the precursor ion either fragments or it remains intact as a reduced molecular ion, (M + 6H)5+·. This reduced species can subsequently capture another electron and either fragment or remain intact as (M + 6H)4+. The electron capture efficiency of (M + 6H)6+ was determined from the sum of fragment and reduced molecular ion intensities divided by the total ion intensity (eq 1). For ubiquitin 6+, the electron capture efficiency is 51 ± 7 and 71 ± 6% for ions formed from solutions with 1 and 0.2% acetic acid, respectively, and is 88 ± 2% for ions formed from the ammonium bicarbonate solution. The fragmentation efficiencies are 31 ± 5, 56 ± 8, and 63 ± 4% for the 6+ ions formed from these same solutions, respectively. It is important to note that these data were obtained using identical instrumental parameters, with the exception of the solution-phase composition.
Ubiquitin 6+ formed from the buffered solution has both the highest electron capture and fragmentation efficiency. These results clearly show that the gas-phase ions formed from the different solutions have different structures even though they have the same net number of charges. This result is consistent with those of Clemmer and coworkers who reported that gas-phase ubiquitin conformers from more native-like solutions are more compact than conformers from more denaturing solutions, even for ions of the same charge state [45]. More importantly, these results clearly demonstrate that the efficiency with which ions capture electrons depends not only on the ion charge state, but on the ion conformation as well. Previous studies have reported different electron capture efficiencies between different charge states [22, 23] and with different metal ion complexes [23]. However, this is the first demonstration that electron capture efficiency also depends on the gas-phase conformation even for ions of the same charge state. To the extent that the ions formed from our buffered solution are more compact than those produced from water/methanol/acetic acid solutions, our results indicate that these more compact ions have higher electron capture and fragmentation efficiencies.
These results also suggest that the conformation of ions formed from different solutions can be different despite similar distributions of charge in the ESI mass spectra. This suggests that methods for characterizing the solution-phase conformation from ESI charge state distributions [46, 47] may not provide reliable information.
Conformer Isolation Using FAIMS
To further investigate how electron capture and dissociation depends on ion conformation, different gas-phase conformers of ubiquitin were selectively introduced into the mass spectrometer using FAIMS. CV scans for ubiquitin 4+ and 5+ from a 200 mM ammonium bicarbonate aqueous solution result in a single dominant peak for each charge state, indicating one major conformer or group of unresolved conformers for these charge states (Figure 2a). Ubiquitin 4+ also has a minor peak in the CV scan indicating that a second, much less abundant, conformer is present and is resolved using FAIMS (Figure 2a). The CV scans of ubiquitin 6+ and 7+ from a solution of 49.9/49.9/0.2 by volume water/methanol/acetic acid have one major and one minor peak for each ion indicating two resolved conformers (Figure 2b). CV scans for ubiquitin 8+ through 12+ from a solution of 49.9/49.9/0.2 by volume water/methanol/acetic acid result in a single peak for 9+ through 12+, but three peaks for ubiquitin 8+ indicating the presence of one major conformer or group of unresolved conformers for 9+ through 12+ and the presence of at least three different conformers for ubiquitin 8+. These results are comparable to those of Purves et al. [40], but Purves et al. resolved two peaks for ubiquitin 9+ and 12+ compared with one peak in our CV scans. This suggests that conformers for these charge states are either not resolved or are not present under our experimental conditions.
Figure 2.

FAIMS CV scans of different ubiquitin charge states produced by ESI from solutions consisting of 10−5 M bovine ubiquitin and (a) 200 mM ammonium bicarbonate in water, (b) 49.9/49.9/0.2 by volume water/methanol/acetic acid, or (c) 49.5/49.5/1 water/methanol/acetic acid. Arrows denote CV values at which ECD mass spectra were acquired.
ECD was performed on ions transmitted through the FAIMS device at two different compensation voltages for each charge state (indicated by arrows in Figure 2). CV values were selected for sufficient ECD fragment intensity and to correspond to the values used by Purves et al. who measured the collisional cross sections of ubiquitin ions at various CV values [40]. The collisional cross section values, CV values for ECD spectra, and the resulting electron and fragmentation efficiencies for each charge state are given in Table 1. For ubiquitin 4+ through 12+, electron capture efficiency ranges from 46 to 94% and fragmentation efficiency ranges from 0 to 91%, respectively. The results obtained for ECD of ubiquitin 6+ through 8+ are addressed in greater detail in the following sections.
Table 1.
Electron capture and fragmentation efficiency for each ubiquitin charge state at two different CV values. Electron capture efficiencies are for the first electron capture event. Electron capture and fragmentation efficiencies for different conformers of the same charge state are directly comparable; the values for different charge states are not due to slightly different experimental parameters, especially isolation waveforms.
| Charge | CV (V) | Cross sectiona | Capture efficiency | Fragmentation efficiency |
|---|---|---|---|---|
| 4 | −5.3 | b | 0.46 ± 0.03 | 0 ± 0 |
| 4 | −3.5 | b | 0.46 ± 0.03 | 0 ± 0 |
| 5 | −6.2 | 940d | 0.29 ± 0.04 | 0.10 ± 0.013 |
| 5 | −5.4 | 960 | 0.46 ± 0.12 | 0.16 ± 0.05 |
| 6 | −7.3 | 990c | 0.66 ± 0.12 | 0.46 ± 0.09 |
| 6 | −6.6 | 990c | 0.67 ± 0.12 | 0.42 ± 0.12 |
| 7 | −7.7 | 1000 | 0.35 ± 0.16 | 0.31 ± 0.16 |
| 7 | −6.1 | 1235 | 0.65 ± 0.15 | 0.62 ± 0.14 |
| 8 | −6.3 | 1330 | 0.901 ± 0.004 | 0.782 ± 0.008 |
| 8 | −4.7 | 1585 | 0.832 ± 0.007 | 0.797 ± 0.010 |
| 9 | −5.4 | 1540d | 0.52 ± 0.19 | 0.43 ± 0.16 |
| 9 | −4.4 | 1625c | 0.88 ± 0.04 | 0.84 ± 0.02 |
| 10 | −6.0 | 1580 | 0.86 ± 0.04 | 0.72 ± 0.05 |
| 10 | −5.0 | 1710 | 0.91 ± 0.06 | 0.84 ± 0.06 |
| 11 | −5.7 | 1755c | 0.90 ± 0.08 | 0.82 ± 0.07 |
| 11 | −4.8 | 1770 | 0.94 ± 0.06 | 0.91 ± 0.06 |
| 12 | −4.9 | 1890 | 0.66 ± 0.24 | 0.57 ± 0.27 |
| 12 | −4.3 | 1905 | 0.88 ± 0.02 | 0.79 ± 0.05 |
Cross Section measurements as reported by Purves et al. [40].
Purves et al. did not report cross section measurements for ubiquitin 4+.
CV values used for ECD spectra are outside reported collisional cross sections [40]. Cross sections have been estimated as the nearest measured collisional cross section.
CV value used for ECD spectra is not within 0.25 V of the CV value used by Purves et al. when reporting collisional cross sections [40]. The cross section value in the table has been estimated by linear interpolation between reported values.
FAIMS ECD MS of Ubiquitin 6+
ECD of ubiquitin 6+, formed from the buffered aqueous solution and isolated at CV values of −7.3 and −6.6 V, resulted in a total of 74 fragment ions producing a sequence coverage of 54%. The same fragment ions were observed at both CV values. The observed a, y, c, and z fragment ions originate from cleavages near both ends of the protein. No such fragment ions from cleavages near the center of the ubiquitin sequence were observed. The limited fragmentation for low charge state ions is consistent with results reported by McLafferty and coworkers for bovine ubiquitin [13] and other proteins [7, 22]. This result has been attributed to electron capture and dissociation occurring throughout the protein backbone, but these fragments are not observed because of noncovalent contacts holding the two pieces of the ion together [13].
To compare the fragment ion intensities at these two CV values, the intensity of each fragment ion was normalized to the total ion intensity in the ECD spectra from each compensation voltage. This normalization is necessary to correct for variations in ion transmission through the FAIMS device at different compensation voltages. The average fragment intensity and standard deviation were determined for each fragment ion from three replicate measurements. The difference between the normalized fragment intensities at −6.6 and −7.3 V for each fragment ion is plotted in Figure 3, with greater fragment ion intensity at −6.6 V plotted as positive. For clarity, only the c and z ions are plotted in Figure 3. Comparable results are obtained for the a and y ions. From the data, we conclude that the ECD spectra of the 6+ ions measured at these two CV values do not differ significantly. These data also demonstrate that the electron capture and fragmentation efficiencies as well as the ECD spectra do not depend significantly on the number of ions in the cell over the range obtained in these experiments.
Figure 3.
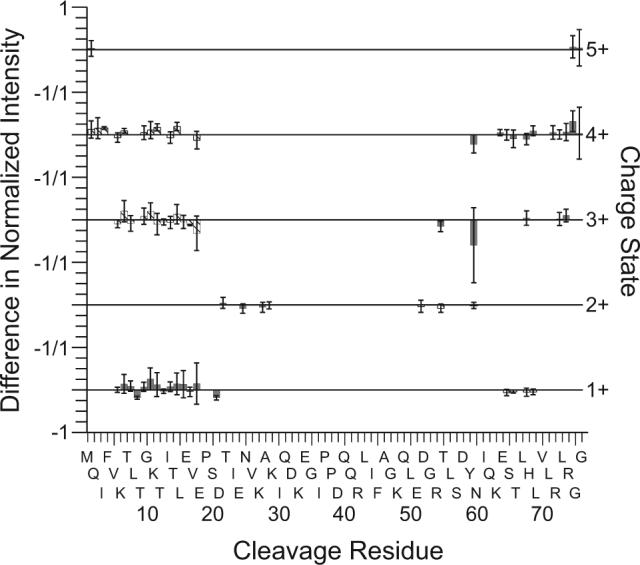
Differences in ECD fragment ion intensities, separated by charge state, for ubiquitin 6+ transmitted through the FAIMS device at CV values of −6.6 and −7.3 V. Fragment ion intensities are normalized to the total fragment ion intensity and are averaged from results of three replicate measurements for each compensation voltage. The difference in intensity of each fragment is calculated by subtracting the average fragment ion intensity with a CV value of −6.6 from the average fragment ion intensity with a CV value of −7.3. The bar height indicates the magnitude of the difference in the normalized fragment intensity for c (shaded bars) and z (cross hatched bars) ions. Greater ion intensities from a CV value of −6.6 V are plotted as positive values. Error bars represent ± one standard deviation from the mean value for three replicate measurements. Fragment ion charge state is indicated on the right y-axis. The −1/1 labels in the left y-axis indicates −1 difference in normalized fragment intensity for the upper charge state and a difference of 1 for the lower charge state.
McLafferty and coworkers suggested the charge sites on an ion can be determined from the observed distribution and charge state of the fragment ions [13, 50]. Zubarev et al. observed a correlation in ECD fragmentation patterns of peptides and the predicted distribution of positive charge [2, 51]. Fragmentation is insufficient for these 6+ ions to determine charge state location in the center region of the ubiquitin ions. However, from the observed fragment ions from backbone cleavages in the range of residues 1 to 29 and 51 to 76, we conclude that the charge location distributions at either end of the protein ion are the same for the ions from these two compensation voltages.
For ubiquitin 6+, the electron capture efficiencies (66 ± 12 and 67 ± 12%) and fragmentation efficiencies (46 ± 9 and 42 ± 12%) are within error for the ECD spectra at −7.3 and −6.6 V (Table 1). The similar capture and fragmentation efficiencies combined with the lack of differences in fragmentation abundances suggests that a single ubiquitin 6+ conformer or a group of conformers unresolved by FAIMS and ECD is transmitted through the FAIMS device at these two CV values. There is a minor peak at a CV of −4.6 V indicating the presence of a minor conformer. However, ECD mass spectra were not obtained for this conformer due to insufficient signal. Using the same ESI solution but without the FAIMS device, the electron capture and fragmentation efficiencies are 71 ± 6 and 56 ± 8%, respectively. The ions transmitted through the FAIMS device at a CV of −4.6 V might account for the minor differences in electron capture and fragmentation efficiencies observed with and without FAIMS.
Small Neutral Losses
ECD of ubiquitin 6+ ions transmitted through the FAIMS device at a CV value of −6.6 V results in 33 ± 12% residual precursor ion (Figure 4a), 11 ± 5% reduced molecular ion capturing one electron (Figure 4b), and 14 ± 7% reduced molecular ions capturing two electrons (Figure 4c) as percents of total ion intensity. Similar results are obtained for ECD mass spectra of 6+ ions at a CV of −7.3 V (spectra not shown) and reduced molecular ions capturing one and two electrons are 8 ± 2 and 11 ± 5% of the total ion intensity, respectively. McLafferty and coworkers reported H· loss as a possible dissociation channel for reduced molecular ions [52], with the percentage of H· loss from reduced ubiquitin 7+, 8+, and 9+ at 25 °C equal to 4, 7, and 29%, respectively [13, 53]. When 6+ ions transmitted through the FAIMS device at a CV of −6.6 V are subjected to ECD, no significant loss of H· is observed for the reduced molecular ions resulting from capturing one and two electrons as indicated by the fit of calculated isotope distributions without H· loss to the observed isotope distributions (Figure 4b and c).
Figure 4.
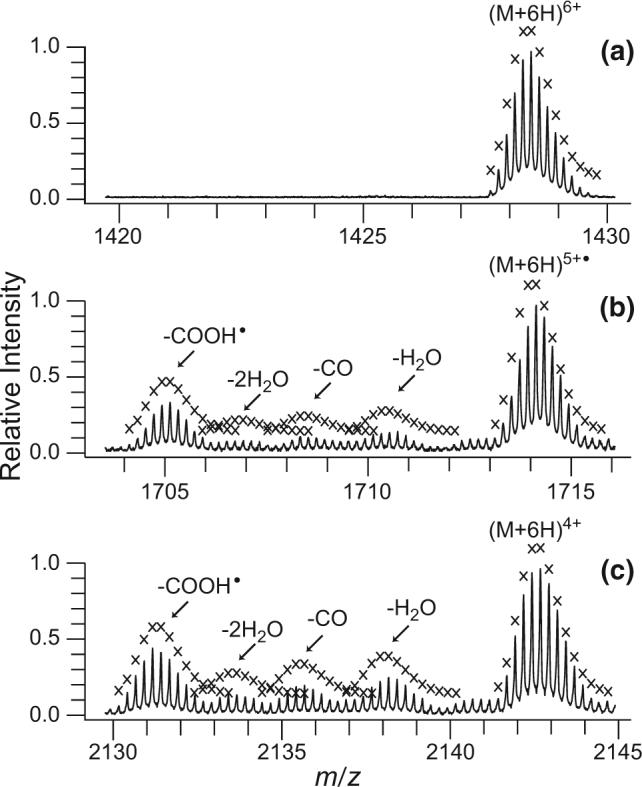
Partial ECD mass spectrum of ubiquitin 6+ produced by ESI of 10−5 M bovine ubiquitin in 49.9/49.9/0.2, by volume water/methanol/acetic acid, and transmitted through the FAIMS device with a CV value of −6.6 V showing (a) residual precursor ion, (b) reduced molecular ion that captured one electron, and (c) reduced molecular ion that captured two electrons. Theoretical isotope distributions for the precursor, reduced precursors with no hydrogen atom loss, and for the fragment ions corresponding to small neutral losses are indicated by “x.” Calculated isotope distributions corresponding to ions that have lost either NH3 or OH· were not included in this figure for clarity.
Small neutral losses, such as H2O, NH3 (or OH·), CO, and COOH·, are observed for the reduced molecular ions (Figure 4b and c). These neutral losses are not observed for the residual precursor 6+ ions which did not capture any electrons (Figure 4a) or in control mass spectra when the hollow cathode was heated, but electrons were not injected into the ion cell (data not shown). Electron capture is exothermic by the recombination energy, a value that has been estimated to be between 4 to 7 eV [24] for multiply protonated proteins. Initially, the internal energy of the ions in this experiment is thermal at room temperature [54, 55]. Upon electron capture, if all the recombination energy were converted into internal vibrational energy, the effective temperature of the ions would be ∼85 and 140 °C upon the capture of one and two electrons, respectively [56]. Subsequent IR emission would result in cooling of these ions in a few seconds [57, 58]. By comparison, water loss from (M + 6H)6+, the lowest energy dissociation channel, does not occur on this time scale at sustained temperatures below 145 °C.
It is possible that the loss of a water molecule from the reduced species requires significantly less energy than loss from the precursor. The Arrhenius activation energy for loss of water from ubiquitin (M + 6H)6+ is 0.93 eV. We do not have a corresponding value for either of the reduced species, but the appearance potential for water loss from the odd electron ions of some alcohols range from 0.5 to 2 eV [59, 60], suggesting that loss of a water molecule from an odd electron ion is not an inherently low-energy process. In addition, no additional loss of small neutral molecules is observed for either of the reduced ubiquitin ions even when these experiments are preformed with the ion cell temperature raised to 70 °C. These results suggest that the losses of small neutral molecules from the reduced ubiquitin ions are not the result of thermally activated processes. Thus, these fragment ions appear to be formed by nonergodic processes, despite the fact that these losses may even occur via rearrangement reactions (though direct attachment of a hydrogen radical and subsequent cleavage can produce these neutral losses as well).
It is also possible that the ions are activated by blackbody radiation originating from the heated cathode and that this activation is sufficient for the neutral loss fragmentation pathways. However, heated metal filaments, similar to the hollow electron emitter used as the electron source for ECD, have previously been used to dissociate ions trapped in FT/ICR cells [61-63]. Compared with the heated metal filaments, which raised the internal energy of protonated leucine enkephalin by 50 °C [63], the heated cathode electron emitter deposits significantly less power (30% less) with a smaller surface area (40% less) and is significantly farther from the ion cloud (180% farther). Because the energy deposited into ions by radiation decreases rapidly with increasing distance between the energy source and the ions [63], the internal energy rise due to absorption of IR photons produced by the heated cathode is expected to be minimal.
These results are consistent with observations of McLafferty and coworkers who have investigated the temperature dependence of c and z fragmentation [64]. These and other experiments have led them to propose that the ECD process for the formation of c and z ions is nonergodic [1, 53, 64]. In contrast, Turecek and coworkers have proposed that little energy is required to produce these fragments, and that the c and z ion formation can occur from a statistical process [65, 66]. Although an ergodic pathway for small neutral loss cannot be eliminated as a possibility, our results are more consistent with a nonergodic process.
Conformational Effects on Electron Capture Efficiency
The CV scan of ubiquitin 7+ has two peaks, one centered at −4.2 and the other at −7.6 V (Figure 2b), but only the major peak (at −7.6 V) in the FAIMS CV scan had sufficient signal to obtain useful ECD spectra. ECD spectra for ions transmitted through the FAIMS device at compensation voltages of −7.7 and −6.1 V have fragment ions from cleavage sites distributed throughout the backbone corresponding to 78% sequence coverage (Figure 5).
Figure 5.

Difference in normalized ubiquitin 7+ fragment intensities from CV values of −6.1 and −7.7 V (see Figure caption 3 for additional details). Normalized fragment ion intensities with greater intensity from a CV value of −6.1 V are plotted as positive difference values. The bar height indicates the magnitude of the difference in the normalized fragment intensity for c (shaded bars) and z (cross hatched bars) ions. Error bars represent ± one standard deviation from the mean value for three replicate measurements.
The ubiquitin 7+ transmitted through the FAIMS device at −7.7 and −6.1 V have electron capture efficiencies of 35 ± 16 and 65 ± 15%, respectively (Table 1). Purves et al. measured collisional cross sections of 1000 and 1235 Å2 for ubiquitin 7+ at CV values of −7.7 and −6.3 V, respectively [40]. Thus, the more compact 7+ (smaller collisional cross section) conformer also has the lower electron capture efficiency. ECD mass spectra of ubiquitin 6+ were acquired under identical experimental conditions as those for the 7+. By comparison with ubiquitin 7+, the electron capture efficiencies of ubiquitin 6+ are 66 ± 12 and 67 ± 12% at the two CV values which correspond to a collisional cross section of ∼990 Å2 [40]. Thus, ubiquitin 6+ has a very similar collisional cross section compared to the more compact 7+ conformer, but these 7+ ions have almost half the electron capture efficiency despite the higher charge. These results demonstrate that the electron capture efficiency does not depend solely on collisional cross section or charge state. Other physical properties of the ion, for example shape, must clearly play a role. In contrast to the results from the 7+, the electron capture efficiency of the more compact conformer is higher for ubiquitin 8+ (Table 1). Thus, there does not appear to be a direct correlation between collisional cross section and electron capture efficiencies.
Ubiquitin conformers of a given charge state can often be resolved by gas-phase H/D exchange, indicating that the shape or three dimensional structure is different despite in some cases having the same collisional cross section [38]. The observed electron capture efficiencies for different conformers of a given charge state is in sharp contrast to previous assertions by others that the electron capture cross section (or efficiency) depends only on ion charge, not on ion shape [22, 24].
It is important to note that for the comparisons between ECD of different conformers of the same charge state, all experimental conditions are identical with the exception of the CV voltage in the FAIMS apparatus. Because FAIMS separations are before the ESI mass spectrometer interface, the entrance to which is at atmospheric pressure, it is almost certain that the CV voltage plays no role in the ultimate position of the ions that are trapped in the FT/ICR cell. Thus, the overlap of the different conformers of the same charge state with the electron beam from the heated cathode is almost certainly identical. Differences in electron capture and fragmentation efficiencies, as well as any differences in ECD fragment ion abundances, must be due to differences in ion conformation, and not an artifact of the experimental conditions used. In comparing results from different charge states, different isolation waveforms are used to isolate the ions that have different m/z and, hence, frequency. It is possible that these waveforms partially excite either the cyclotron or magnetron motion of the different charge state ions to a different extent. If this is the case, the overlap between the ion cloud and the electron beam may not be identical, making comparisons between different charge states more complicated. However, no significant shifts in ion frequency were observed indicating that any excitation that may have occurred is small. In addition, changes to the correlated shots used to isolate an ion of interest did not change the observed results indicating that the electron cloud (∼1 cm diameter) is larger than the diameter of the ion cloud in the cell. It is also important to note that the results reported in Table 1 for the different charge states were obtained over a several month period and slightly different experimental parameters (most notably the isolation waveforms) were used so that the results for different charge states should not be directly compared. Data for the 6+ and 7+ charge states were obtained under identical experimental conditions (with the exception of the isolation waveforms) and should be directly comparable with the above caveats.
Conformational Differences in Normalized Fragment Ion Intensity
The individual fragment ion intensities for more compact (CV −7.7 V) and more extended (CV −6.1 V) ubiquitin 7+ conformers were compared by subtracting normalized fragment ion intensities, with positive values in Figure 5 representing greater fragment ion intensity from the more extended conformer. For clarity, only c and z ions are included in Figure 5. Similar results are obtained from a and y ions. The c fragment ions with one and two charges have greater normalized intensity from the more extended 7+ conformer (Figure 5). The normalized intensity for the c fragment ions with four charges and the z fragment ions with five charges are greater for the more compact conformer. The intensity of complimentary c and z ions corresponding to a single cleavage do not necessarily correlate. This could be due to subsequent dissociation of some of these ions as a result of different stabilities or due to subsequent electron capture, the cross section for which would depend on the type of fragment and its conformation. These results indicate that the relative fragment ion intensities of ubiquitin 7+ ions depend on conformational differences.
Three peaks centered at CV values of −9.0, −6.0, and −4.6 V are present in the CV scan of ubiquitin 8+ (Figure 2c). Purves et al. reported collisional cross sections of 1045, 1330, and 1585 Å2 for ubiquitin 8+ ions at compensation voltages of −8.4, −6.0, and −4.5 V, respectively [40]. Useful ECD mass spectra were not obtained for the most compact ubiquitin 8+ conformers (CV −9.0 V) because of insufficient ion signal. ECD mass spectra were acquired for the most extended (−4.7 V, Figure 6a) and partially folded (−6.3 V, Figure 6b) 8+ conformers (Figure 6); the spectra are clearly different.
Figure 6.
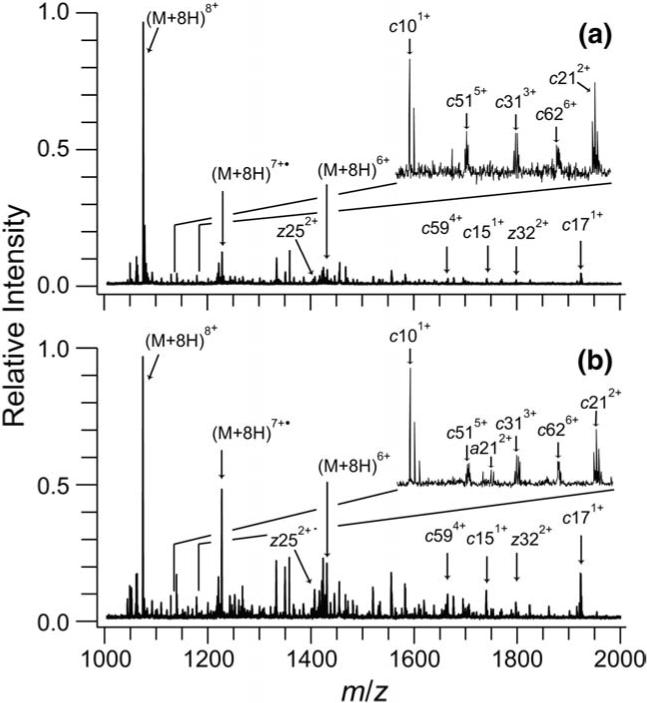
ECD mass spectra of ubiquitin 8+ produced by ESI of 10−5 M bovine ubiquitin with 49.5/49.5/1, by volume water/methanol/acetic acid, and transmitted through the FAIMS device at CV values of (a) −4.7 and (b) −6.3 V. Residual precursor ion, reduced molecular ions, and prominent c and z fragment ions peaks are indicated. The inset shows the region from 1135−1175 m/z with fragment ions present in this region labeled. Many additional fragment ions are also present in the spectra but, for clarity, are not labeled.
The c and z fragment ions identified in the ECD mass spectra of ubiquitin 8+ are plotted with the charge state of the fragment ion versus the cleavage location in Figure 7. Only c and z ions are included; similar results are obtained from a and y ions. Fragment ions are plotted with a positive or negative offset in the charge axis for ions from the more elongated and compact conformers precursor ions, respectively. Both the extended and compact 8+ conformers have significant fragmentation (86% sequence coverage), and the cleavage locations are the nearly the same for both conformers (minor differences are observed for low abundance fragment ions). However, the relative intensities of the fragment ions for the two conformers differ. The difference in the normalized relative intensity for each fragment ion between the more elongated and compact conformers are plotted in Figure 8 with greater relative fragment intensity for the more elongated conformer plotted as positive. As an example, the normalized fragment intensities of c585+ and c595+ for the most extended conformer are 1.8 and 1.3 times greater, respectively, than those of the more compact conformer. The most extended conformer has higher abundances of larger c ions, corresponding to cleavage near the C-terminus, than the compact conformer, whereas the compact conformer has a greater abundance of small c ions, corresponding to cleavage near the N-terminus. The regions where higher fragment abundances are observed may reflect greater extents of unfolded structure in these respective conformers.
Figure 7.

Comparison of c (solid circles) and z (open circles) fragment ions from ECD mass spectra of ubiquitin 8+ transmitted through the FAIMS device at −4.7 (positive offset in the charge axis) and −6.3 V (negative offset in the charge axis). Fragment ions are plotted as the position of backbone cleavage versus fragment charge state. Ubiquitin 8+ ions are produced by ESI of 10−5 M bovine ubiquitin with 49.5/49.5/1, by volume water/methanol/acetic acid.
Figure 8.

Difference of normalized ubiquitin 8+ fragment intensities from CV values of −4.7 and −6.3 V (see Figure caption 3 for details). Normalized fragment ion intensities with greater intensity from a CV value of −4.7 V are plotted as positive difference values. The bar height indicates the magnitude of the difference in the normalized fragment intensity for c (shaded bars) and z (cross hatched bars) ions. Error bars represent ± one standard deviation from the mean value for three replicate measurements.
The greatest variation in normalized fragment ion intensities for different conformers occurs for ubiquitin 7+ and 8+ (Table 1). The 7+ and 8+ have the largest range of CV values for ion transmission through the FAIMS device, and also have the largest range of collisional cross sections (19 and 16%, respectively). By comparison, the other charge states have narrow peaks in the CV scan, and have smaller variation in collisional cross section. This indicates that the magnitude in variation in normalized fragment intensities may be roughly correlated to differences in collisional cross section or ion shape.
For either ubiquitin 7+ or 8+ for which two or more conformers are clearly indicated, ECD mass spectra from differing CV values have nearly identical distributions of ECD backbone cleavages and charge states of fragments (see 8+ data in Figure 7). These results suggest that the distributions of charge sites in the precursor ions of different ubiquitin conformers of the same charge state are similar, i.e., different conformers of a given charge state are not the result of differences in the distributions of where charges are located, but rather reflect other structural differences most likely originating from solution. Thus, charge location in the ubiquitin sequence does not play a significant role in the differences of electron capture efficiencies between ions from differing CV values, nor are the different conformations directly attributable to differences in charge location. There appears to be a factor that influences the electron capture efficiency to a greater extent than charge state, charge location, or collisional cross section.
Conclusions
Both the electron capture efficiency and the relative intensities of the ECD fragments of ubiquitin can be significantly affected by differences in gas-phase ion conformation. Ions of a given charge state formed from solutions of different composition can have significantly different electron capture efficiencies indicating that these ions retain a memory of their solution-phase structure and that differences in the resulting gas-phase conformations can be probed with ECD experiments. By combining FAIMS with FT/ICR MS, it is possible to separate different conformers or families of conformers of proteins making it possible to examine effects of gas-phase conformation on ECD spectra. For the charge states where only a single peak was observed by FAIMS, indicating a single dominant conformer or family of unresolved conformers, the ECD spectra measured at different CV values were indistinguishable except in the case of the 9+ charge state. Previous work by Purves et al. [40] indicated two closely spaced peaks in their FAIMS spectra of the 9+, indicating the presence of two conformers for this charge state. It is possible that, these two conformers or conformer families are not fully resolved under our FAIMS conditions, but are distinguishable by ECD. For the two charge states for which multiple conformers were clearly indicated by FAIMS, there were significant differences in both the electron capture efficiency and the relative fragment intensities.
In these experiments, the shape of the ion appears to be a key factor in the electron capture efficiency. Conformers of a given charge state with lower cross section can have either higher or lower electron capture efficiency indicating that EC efficiency depends on shape, but not directly on the collisional cross section. In addition, the ubiquitin 6+ conformer, which has essentially the same collisional cross section as one of the 7+ conformers, has a higher electron capture efficiency indicating that the shape of the ion can play a greater role than either charge state or collisional cross section alone. It is possible that, the differences in electron capture efficiencies for different conformers of the same charge state are due to shape-dependant coupling of energy transfer between an electron and ion in a high n Rydberg state.
These results clearly demonstrate that ECD can be used to probe differences in gas-phase conformation. No differences in the cleavage sites were observed for different conformers of a given charge state indicating that the presence of different gas-phase conformers within the same charge state are not due to differences in where charges are located in the ions, but rather are due to differences in gas-phase conformation, perhaps originating from differences in solution. Ultimately, it is hoped that conformational differences in ECD spectra can be used to obtain more detailed information about gas-phase conformation and that this information can be related to conformational differences originating from solution.
Acknowledgments
The authors thank Dr. Roger Guevremont and Dr. Randy W. Purves for helpful discussions and for generously sharing their expertise with FAIMS, and Matt Bush for calculations on internal energy distribution. The authors are grateful to Thermo Electron Corporation for the loan of an Ionalytics Selectra FAIMS apparatus, and to NIH for generous funding (R01-GM064712-05).
References
- 1.Zubarev RA, Kelleher NL, McLafferty FW. Electron Capture Dissociation of Multiply Charged Protein Cations. A Nonergodic Process. J. Am. Chem. Soc. 1998;120:3265–3266. [Google Scholar]
- 2.Zubarev RA. Reactions of Polypeptide Ions with Electrons in the Gas Phase. Mass Spectrom. Rev. 2003;22:57–77. doi: 10.1002/mas.10042. [DOI] [PubMed] [Google Scholar]
- 3.Cooper HJ, Hakansson K, Marshall AG. The Role of Electron Capture Dissociation in Biomolecular Analysis. Mass Spectrom. Rev. 2005;24:201–222. doi: 10.1002/mas.20014. [DOI] [PubMed] [Google Scholar]
- 4.Hakansson K, Cooper HJ, Emmett MR, Costello CE, Marshall AG, Nilsson CL. Electron Capture Dissociation and Infrared Multiphoton Dissociation MS/MS of an N-Glycosylated Tryptic Peptide to Yield Complementary Sequence Information. Anal. Chem. 2001;73:4530–4536. doi: 10.1021/ac0103470. [DOI] [PubMed] [Google Scholar]
- 5.Mirgorodskaya E, Roepstorff P, Zubarev RA. Localization of O-Glycosylation Sites in Peptides by Electron Capture Dissociation in a Fourier Transform Mass Spectrometer. Anal. Chem. 1999;71:4431–4436. doi: 10.1021/ac990578v. [DOI] [PubMed] [Google Scholar]
- 6.Ge Y, Lawhorn BG, El-Naggar M, Strauss E, Park JH, Begley TP, McLafferty FW. Top Down Characterization of Larger Proteins (45 kDa) by Electron Capture Dissociation Mass Spectrometry. J. Am. Chem. Soc. 2002;124:672–678. doi: 10.1021/ja011335z. [DOI] [PubMed] [Google Scholar]
- 7.Sze SK, Ge Y, Oh H, McLafferty FW. Top-Down Mass Spectrometry of a 29-kDa Protein for Characterization of Any Posttranslational Modification to Within One Residue. Proc. Natl. Acad. Sci. U.S.A. 2002;99:1774–1779. doi: 10.1073/pnas.251691898. [DOI] [PMC free article] [PubMed] [Google Scholar]
- 8.Kelleher RL, Zubarev RA, Bush K, Furie B, Furie BC, McLafferty FW, Walsh CT. Localization of Labile Posttranslational Modifications by Electron Capture Dissociation: The Case of γ-Carboxyglutamic Acid. Anal. Chem. 1999;71:4250–4253. doi: 10.1021/ac990684x. [DOI] [PubMed] [Google Scholar]
- 9.Stensballe A, Jensen ON, Olsen JV, Haselmann KF, Zubarev RA. Electron Capture Dissociation of Singly and Multiply Phosphorylated Peptides. Rapid Commun. Mass Spectrom. 2000;14:1793–1800. doi: 10.1002/1097-0231(20001015)14:19<1793::AID-RCM95>3.0.CO;2-Q. [DOI] [PubMed] [Google Scholar]
- 10.Ge Y, El-Naggar M, Sze SK, Bin Oh H, Begley TP, McLafferty FW, Boshoff H, Barry CE. Top Down Characterization of Secreted Proteins from Mycobacterium tuberculosis by Electron Capture Dissociation Mass Spectrometry. J. Am. Soc. Mass Spectrom. 2003;14:253–261. doi: 10.1016/s1044-0305(02)00913-3. [DOI] [PubMed] [Google Scholar]
- 11.Meng FY, Cargile BJ, Miller LM, Forbes AJ, Johnson JR, Kelleher NL. Informatics and Multiplexing of Intact Protein Identification in Bacteria and the Archaea. Nat. Biotechnol. 2001;19:952–957. doi: 10.1038/nbt1001-952. [DOI] [PubMed] [Google Scholar]
- 12.Leymarie N, Berg EA, McComb ME, O'Connor PB, Grogan J, Oppenheim FG, Costello CE. Tandem Mass Spectrometry for Structural Characterization of Proline-Rich Proteins: Application to Salivary PRP-3. Anal. Chem. 2002;74:4124–4132. doi: 10.1021/ac0255835. [DOI] [PubMed] [Google Scholar]
- 13.Breuker K, Oh HB, Horn DM, Cerda BA, McLafferty FW. Detailed Unfolding and Folding of Gaseous Ubiquitin Ions Characterized by Electron Capture Dissociation. J. Am. Chem. Soc. 2002;124:6407–6420. doi: 10.1021/ja012267j. [DOI] [PubMed] [Google Scholar]
- 14.Syka JEP, Coon JJ, Schroeder MJ, Shabanowitz J, Hunt DF. Peptide and Protein Sequence Analysis by Electron Transfer Dissociation Mass Spectrometry. Proc. Natl. Acad. Sci. U.S.A. 2004;101:9528–9533. doi: 10.1073/pnas.0402700101. [DOI] [PMC free article] [PubMed] [Google Scholar]
- 15.Pitteri SJ, Chrisman PA, Hogan JM, McLuckey SA. Electron Transfer Ion/Ion Reactions in a Three-Dimensional Quadrupole Ion Trap: Reactions of Doubly and Triply Protonated Peptides with SO−·2. Anal. Chem. 2005;77:1831–1839. doi: 10.1021/ac0483872. [DOI] [PMC free article] [PubMed] [Google Scholar]
- 16.Coon JJ, Shabanowitz J, Hunt DF, Syka JEP. Electron Transfer Dissociation of Peptide Anions. J. Am. Soc. Mass Spectrom. 2005;16:880–882. doi: 10.1016/j.jasms.2005.01.015. [DOI] [PubMed] [Google Scholar]
- 17.Chrisman PA, Pitteri SJ, Hogan JM, McLuckey SA. SO−·2. Electron Transfer Ion/Ion Reactions with Disulfide Linked Polypeptide Ions. J. Am. Soc. Mass Spectrom. 2005;16:1020–1030. doi: 10.1016/j.jasms.2005.02.010. [DOI] [PMC free article] [PubMed] [Google Scholar]
- 18.Nielsen ML, Budnik BA, Haselmann KF, Zubarev RA. Tandem MALDI/El Ionization for Tandem Fourier Transform Ion Cyclotron Resonance Mass Spectrometry of Polypeptides. Int. J. Mass Spectrom. 2003;226:181–187. [Google Scholar]
- 19.Hvelplund P, Liu B, Nielsen SB, Tomita S, Cederquist H, Jensen J, Schmidt HT, Zettergren H. Electron Capture and Loss by Protonated Peptides and Proteins in Collisions with C60 and Na. Eur. Phys. J. D. 2003;22:75–79. [Google Scholar]
- 20.Hvelplund P, Liu B, Nielsen SB, Tomita S. Electron Capture Induced Dissociation of Peptide Dications. Int. J. Mass Spectrom. 2003;225:83–87. [Google Scholar]
- 21.Mormann M, Peter-Katalinic J. Improvement of Electron Capture Efficiency by Resonant Excitation. Rapid Commun. Mass Spectrom. 2003;17:2208–2214. doi: 10.1002/rcm.1163. [DOI] [PubMed] [Google Scholar]
- 22.Zubarev RA, Horn DM, Fridriksson EK, Kelleher NL, Kruger NA, Lewis MA, Carpenter BK, McLafferty FW. Electron Capture Dissociation for Structural Characterization of Multiply Charged Protein Cations. Anal. Chem. 2000;72:563–573. doi: 10.1021/ac990811p. [DOI] [PubMed] [Google Scholar]
- 23.Iavarone AT, Paech K, Williams ER. Effects of Charge State and Cationizing Agent on the Electron Capture Dissociation of a Peptide. Anal. Chem. 2004;76:2231–2238. doi: 10.1021/ac035431p. [DOI] [PMC free article] [PubMed] [Google Scholar]
- 24.Zubarev RA, Haselmann KF, Budnik B, Kjeldsen F, Jensen F. Towards an Understanding of the Mechanism of Electron-Capture Dissociation: A Historical Perspective and Modern Ideas. Eur. J. Mass Spectrom. 2002;8:337–349. [Google Scholar]
- 25.Suckau D, Shi Y, Beu SC, Senko MW, Quinn JP, Wampler FM, McLafferty FW. Coexisting Stable Conformations of Gaseous Protein Ions. Proc. Natl. Acad. Sci. U.S.A. 1993;90:790–793. doi: 10.1073/pnas.90.3.790. [DOI] [PMC free article] [PubMed] [Google Scholar]
- 26.Freitas MA, Hendrickson CL, Emmett MR, Marshall AG. Gas-Phase Bovine Ubiquitin Cation Conformations Resolved by Gas-Phase Hydrogen/Deuterium Exchange Rate and Extent. Int. J. Mass Spectrom. 1999;185/186/187:565–575. [Google Scholar]
- 27.Winger BE, Light-Wahl KJ, Rockwood AL, Smith RD. Probing Qualitative Conformation Differences of Multiply Protonated Gas-Phase Proteins via H/D Isotopic Exchange with D2O. J. Am. Chem. Soc. 1992;114:5897–5898. [Google Scholar]
- 28.Jarrold MF. Peptides and Proteins in the Vapor Phase. Annu. Rev. Phys. Chem. 2000;51:179–207. doi: 10.1146/annurev.physchem.51.1.179. [DOI] [PubMed] [Google Scholar]
- 29.Clemmer DE, Hudgins RR, Jarrold MF. Naked Protein Conformations—Cytochrome c in the Gas Phase. J. Am. Chem. Soc. 1995;117:10141–10142. [Google Scholar]
- 30.Myung S, Badman ER, Lee YJ, Clemmer DE. Structural Transitions of Electrosprayed Ubiquitin Ions Stored in an Ion Trap over ∼10 ms to 30 s. J. Phys. Chem. A. 2002;106:9976–9982. [Google Scholar]
- 31.Loo RRO, Loo JA, Udseth HR, Fulton JL, Smith RD. Protein Structural Effects in Gas-Phase Ion Molecule Reactions with Diethylamine. Rapid Commun. Mass Spectrom. 1992;6:159–165. doi: 10.1002/rcm.1290060302. [DOI] [PubMed] [Google Scholar]
- 32.Gross DS, Schnier PD, Rodriguez-Cruz SE, Fagerquist CK, Williams ER. Conformations and Folding of Lysozyme Ions in Vacuo. Proc. Natl. Acad. Sci. U.S.A. 1996;93:3143–3148. doi: 10.1073/pnas.93.7.3143. [DOI] [PMC free article] [PubMed] [Google Scholar]
- 33.Valentine SJ, Counterman AE, Clemmer DE. Conformer-Dependent Proton-Transfer Reactions of Ubiquitin Ions. J. Am. Soc. Mass Spectrom. 1997;8:954–961. [Google Scholar]
- 34.Reimann CT, Sullivan PA, Axelsson J, Quist AP, Altmann S, Roepstorff P, Velazquez I, Tapia O. Conformation of Highly-Charged Gas-Phase Lysozyme Revealed by Energetic Surface Imprinting. J. Am. Chem. Soc. 1998;120:7608–7616. [Google Scholar]
- 35.Badman ER, Hoaglund-Hyzer CS, Clemmer DE. Dissociation of Different Conformations of Ubiquitin Ions. J. Am. Soc. Mass Spectrom. 2002;13:719–723. doi: 10.1016/S1044-0305(02)00374-4. [DOI] [PubMed] [Google Scholar]
- 36.Purves RW, Barnett DA, Guevremont R. Separation of Protein Conformers using Electrospray-High Field Asymmetric Waveform Ion Mobility Spectrometry-Mass Spectrometry. Int. J. Mass Spectrom. 1999;197:163–177. [Google Scholar]
- 37.Guevremont R. High-Field Asymmetric Waveform Ion Mobility Spectrometry: A New Tool for Mass Spectrometry. J. Chromatogr. A. 2004;1058:3–19. [PubMed] [Google Scholar]
- 38.Robinson EW, Williams ER. Multidimensional Separations of Ubiquitin Conformers in the Gas Phase: Relating Ion Cross Sections to H/D Exchange Measurements. J. Am. Soc. Mass Spectrom. 2005;16:1427–1437. doi: 10.1016/j.jasms.2005.04.007. [DOI] [PMC free article] [PubMed] [Google Scholar]
- 39.Robinson EW, Garcia DE, Leib RD, Williams ER. Enhanced Mixture Analysis of Poly(Ethylene Glycol) Using High-Field Asymmetric Waveform Ion Mobility Spectrometry Combined with Fourier-Transform Ion Cyclotron Resonance Mass Spectrometry. Anal. Chem. 2006;78:2190–2198. doi: 10.1021/ac051709x. [DOI] [PMC free article] [PubMed] [Google Scholar]
- 40.Purves RW, Barnett DA, Ells B, Guevremont R. Investigation of Bovine Ubiquitin Conformers Separated by High-Field Asymmetric Waveform Ion Mobility Spectrometry: Cross Section Measurements Using Energy-Loss Experiments with a Triple Quadrupole Mass Spectrometer. J. Am. Soc. Mass Spectrom. 2000;11:738–745. doi: 10.1016/S1044-0305(00)00136-7. [DOI] [PubMed] [Google Scholar]
- 41.Viehland LA, Guevremont R, Purves RW, Barnett DA. Comparison of High-Field Ion Mobility Obtained from Drift Tubes and a FAIMS Apparatus. Int. J. Mass Spectrom. 2000;197:123–130. [Google Scholar]
- 42.Jurchen JC, Williams ER. Origin of Asymmetric Charge Partitioning in the Dissociation of Gas-Phase Protein Homodimers. J. Am. Chem. Soc. 2003;125:2817–2826. doi: 10.1021/ja0211508. [DOI] [PMC free article] [PubMed] [Google Scholar]
- 43.Chowdhury SK, Katta V, Chait. BT. Probing Conformational Changes in Proteins by Mass Spectrometry. J. Am. Chem. Soc. 1990;112:9013–9015. [Google Scholar]
- 44.Loo JA, Loo RRO, Udseth HR, Edmonds CG, Smith RD. Solvent-Induced Conformational-Changes of Polypeptides Probed by Electrospray-Ionization Mass-Spectrometry. Rapid Commun. Mass Spectrom. 1991;5:101–105. doi: 10.1002/rcm.1290050303. [DOI] [PubMed] [Google Scholar]
- 45.Li J, Taraszka JA, Counterman AE, Clemmer DE. Influence of Solvent Composition and Capillary Temperature on the Conformations of Electrosprayed Ions: Unfolding of Compact Ubiquitin Conformers from Pseudonative and Denatured Solutions. Int. J. Mass Spectrom. 1999;185/186/187:37–47. [Google Scholar]
- 46.Eyles SJ, Kaltashov IA. Methods to Study Protein Dynamics and Folding by Mass Spectrometry. Methods. 2004;34:88–99. doi: 10.1016/j.ymeth.2004.03.015. [DOI] [PubMed] [Google Scholar]
- 47.Mohimen A, Dobo A, Hoerner JK, Kaltashov IA. A Chemometric Approach to Detection and Characterization of Multiple Protein Conformers in Solution Using Electrospray Ionization Mass Spectrometry. Anal. Chem. 2003;75:4139–4147. doi: 10.1021/ac034095+. [DOI] [PubMed] [Google Scholar]
- 48.Iavarone AT, Jurchen JC, Williams ER. Effects of Solvent on the Maximum Charge State and Charge State Distribution of Protein Ions Produced by Electrospray Ionization. J. Am. Soc. Mass Spectrom. 2000;11:976–985. doi: 10.1016/S1044-0305(00)00169-0. [DOI] [PMC free article] [PubMed] [Google Scholar]
- 49.Iavarone AT, Williams ER. Mechanism of Charging and Supercharging Molecules in Electrospray Ionization. J. Am. Chem. Soc. 2003;125:2319–2327. doi: 10.1021/ja021202t. [DOI] [PMC free article] [PubMed] [Google Scholar]
- 50.Cerda BA, Breuker K, Horn DM, McLafferty FW. Charge/Radical Site Initiation Versus Coulombic Repulsion for Cleavage of Multiply Charged Ions. Charge Solvation in Poly(Alkene Glycol) Ions. J. Am. Soc. Mass Spectrom. 2001;12:565–570. doi: 10.1016/S1044-0305(01)00209-4. [DOI] [PubMed] [Google Scholar]
- 51.Budnik BA, Nielsen ML, Olsen JV, Haselmann KF, Horth P, Haehnel W, Zubarev RA. Can Relative Cleavage Frequencies in Peptides Provide Additional Sequence Information? Int. J. Mass Spectrom. 2002;219:283–294. [Google Scholar]
- 52.Zubarev RA, Kruger NA, Fridriksson EK, Lewis MA, Horn DM, Carpenter BK, McLafferty FW. Electron Capture Dissociation of Gaseous Multiply-Charged Proteins is Favored at Disulfide Bonds and Other Sites of High Hydrogen Atom Affinity. J. Am. Chem. Soc. 1999;121:2857–2862. [Google Scholar]
- 53.Breuker K, Oh HB, Cerda BA, Horn DM, McLafferty FW. Hydrogen Atom Loss in Electron-Capture Dissociation: A Fourier Transform-Ion Cyclotron Resonance Study with Single Isotopomeric Ubiquitin Ions. Eur. J. Mass Spectrom. 2002;8:177–180. [Google Scholar]
- 54.Jockusch RA, Schnier PD, Price WD, Strittmatter EF, Demirev PA, Williams ER. Effects of Charge State on Fragmentation Pathways, Dynamics, and Activation Energies of Ubiquitin Ions Measured by Blackbody Infrared Radiative Dissociation. Anal. Chem. 1997;69:1119–1126. doi: 10.1021/ac960804q. [DOI] [PMC free article] [PubMed] [Google Scholar]
- 55.Price WD, Schnier PD, Jockusch RA, Strittmatter EF, Williams ER. Unimolecular Reaction Kinetics in the High-Pressure Limit Without Collisions. J. Am. Chem. Soc. 1996;43:10640–10644. doi: 10.1021/ja961812r. [DOI] [PMC free article] [PubMed] [Google Scholar]
- 56.Vijay-Kumar S, Bugg CE, Cook WJ. Structure of Ubiquitin Refined at 1.8 A Resolution. J. Mol. Bio. 1987;194:531–544. doi: 10.1016/0022-2836(87)90679-6. The internal energy of ubiquitin in these studies was estimated by assuming a Boltzmann contribution of internal energy from each vibrational mode in the protein. Separate calculations using the AMBER94 and OPLS2001 force fields were used to obtain vibrational frequencies for an energy minimized form of ubiquitin using the X-ray crystal structure. as the starting geometry. These two different sets of vibrational frequencies resulted in remarkably similar values for internal energy at room temperature (17.2 and 17.5 eV, respectively), indicating that this calculation is not very dependent on the force field employed. Internal energies 6 and 12 eV higher (to account for the recombination energy of 1 and 2 electrons, respectively) than those determined at room temperature were compared with various thermal internal energies to estimate the effective temperature of the product ion after electron capture. [DOI] [PubMed] [Google Scholar]
- 57.Price WD, Williams ER. Activation of Peptide Ions by Blackbody Radiation: Factors that Lead to Dissociation Kinetics in the Rapid Energy Exchange Limit. J. Phys. Chem. A. 1997;101:8844–8852. doi: 10.1021/jp9722418. [DOI] [PMC free article] [PubMed] [Google Scholar]
- 58.Dunbar RC. Infrared Radiative Cooling of Gas-Phase Ions. Mass Spectrom. Rev. 1992;11:309–339. [Google Scholar]
- 59.Bowen RD, Maccoll A. Low Energy, Low Temperature Mass Spectra 2—Low Energy, Low Temperature Mass Spectra of Some Small Saturated Alcohols and Ethers. Org. Mass Spectrom. 1984;19:379–384. [Google Scholar]
- 60.Holmes JL, Yuan D, Rye RTB. Metastable Ion Studies. VII—Loss of Water from the Molecular Ion of Cyclopentanol. Org. Mass Spectrom. 1977;12:254–257. [Google Scholar]
- 61.Sena M, Riveros JM. Thermal Dissociation of Acetophenone Molecular Ions Activated by Infrared Radiation. J. Phys. Chem. A. 1997;101:4384–4391. [Google Scholar]
- 62.Sena M, Riveros JM. Dissociation of p-Cymene Molecular Ions Induced by Thermal Radiation. Int. J. Mass Spectrom. 2003;227:135–145. [Google Scholar]
- 63.Wong RL, Robinson EW, Williams ER. Activation of Protonated Peptides and Molecular Ions of Small Molecules Using Heated Filaments in Fourier-Transform Ion Cyclotron Resonance Mass Spectrometry. Int. J. Mass Spectrom. 2004;234:1–9. [Google Scholar]
- 64.Breuker K, Oh HB, Lin C, Carpenter BK, McLafferty FW. Nonergodic and Conformational Control of the Electron Capture Dissociation of Protein Cations. Proc. Natl. Acad. Sci. U.S.A. 2004;101:14011–14016. doi: 10.1073/pnas.0406095101. [DOI] [PMC free article] [PubMed] [Google Scholar]
- 65.Turecek F. N-C-α Bond Dissociation Energies and Kinetics in Amide and Peptide Radicals. Is the Dissociation a Nonergodic Process? J. Am. Chem. Soc. 2003;125:5954–5963. doi: 10.1021/ja021323t. [DOI] [PubMed] [Google Scholar]
- 66.Turecek F, Syrstad EA. Mechanism and Energetics of Intramolecular Hydrogen Transfer in Amide and Peptide Radicals and Cation Radicals. J. Am. Chem. Soc. 2003;125:3353–3369. doi: 10.1021/ja021162t. [DOI] [PubMed] [Google Scholar]