

Abstract
Yeast replicative aging is a process resembling replicative aging in mammalian cells. During aging, wild-type haploid yeast cells enlarge, become sterile, and undergo nucleolar enlargement and fragmentation; we sought gene expression changes during the time of these phenotypic changes. Gene expression studied via microarrays and quantitative real-time reverse-transcription polymerase chain reaction (qPCR) has shown reproducible, statistically significant changes in messenger RNA (mRNA) of genes at 12 and 18-20 generations. Our findings support previously described changes towards aerobic metabolism, decreased ribosome gene expression, and a partial environmental stress response. Our findings include a pseudostationary phase, downregulation of methylation-related metabolism, increased nucleotide excision repair-related mRNA, and a strong upregulation of many of the regulatory subunits of protein phosphatase I (Glc7). These findings are correlated with aging changes in higher organisms as well as with the known involvement of protein phosphorylation states during yeast aging.
REPLICATIVE aging in the budding yeast, Saccharomyces cerevisiae, is an asymmetric process that affects mother cells, but not daughter cells until late in the aging process (1,2). In each division, the mother cell becomes a generation older, enlarges, and acquires a chitin-containing bud scar, whereas the daughter cell emerges at age 0 generation (g). An average mother cell of typical wild-type yeast strains lives ∼25g.
Dysregulation of genes has been proposed to underlie part of the aging process (3,4). In mouse liver cells, DNA methylation diminishes through much of the life span with consequent expression of repressed genes (5-8). Large scale comparative microarray studies of messenger RNAs (mRNAs) in aging animals and in mutants considered to affect the aging process have found many mRNA differences, especially in expression of stress-related genes (9-13).
Age-related mRNA changes have also been described in yeast (14-16). Often, few ages and/or few replicate microarrays were examined. In addition, precautions to make the young controls equivalent in stress to the aged cells were difficult to perform and were handled differently in each case. A few findings run throughout the experiments, but many findings are not consistent.
The earliest yeast microarray study published (14) used three pairs of microarrays each for young and 8g yeast cells and showed that 8g cells had shifted from ethanol fermentation to gluconeogenesis and lipid metabolism. They grew the isolated aging mother cells for 30 minutes after magnetic sorting to alleviate sorting stress, but that growth may have introduced newborn daughters. The gene expression changes seen on the arrays were not extensive. For example, the only genes from aerobic alcohol metabolism and energy storage (including gluconeogenesis) found upregulated in wild type were PCK1 (for phosphoenolpyruvate carboxykinase) and ADH2 (for alcohol dehydrogenase). These inductions agreed with their microchemical analyses. Metabolic changes were more evident in a sip2 mutant strain with a shortened life span and less evident in a snf4 mutant strain with a longer life span. Their conclusions have held up quite well through the other studies. Age-related metabolic changes are particularly interesting because yeast respond to glucose limitation with an extended life span (17,18), an analog of the caloric restriction that extends mammalian life spans.
In another microarray-based study, much older cells were isolated using centrifugal elutriation, a method that makes it difficult to obtain a similarly stressed control population (15). Two replicate arrays were performed for young and for old cells; RNAs were prepared from a pool of samples of aged cells in an effort to average out biological variation. The mRNA differences were checked via quantitative real-time reverse-transcription polymerase chain reaction (qPCR). In wild-type replicative aging, many genes of the ∼900-gene regulon called the environmental stress response (ESR) pathway (19) changed expression in the aged cells, and the DNA double-strand break repair genes were induced.
However, another group found that few of the ESR genes responded in aging (16). These authors used duplicate microarray slides from magnetically sorted cells at 8-12g and 18-24g (designated 10g and 20g). They found a decrease at 10g and 20g in expression of glycolysis genes, proteasome subunit genes, and protein-folding chaperones. There was more mRNA for glycogen-related genes, permeases, some regulatory genes, and a few others with no known role. The magnetic sorting process used by these authors was found to induce some genes for the stress response and cell wall and repress the fatty acid metabolism and histone genes in young cells.
In our study, we used six to seven microarrays each at 1g, 8g, 12g, and 18-20g, including biological and technical replication as well as dye inversion. We tested important conclusions using qPCR. In each case, we used a log phase culture grown in parallel with the microarray control. During magnetic sorting, this log phase culture was exposed to all of the same temperature conditions in parallel with the aging culture being sorted. In our view, this study has both sufficient replication and appropriate young control cells to allow accurate conclusions about age-related gene changes. In common with others, we have found a metabolic shift and a decrease in ribosome and nucleolus gene expression. In addition, we have found evidence for a downregulation of methylation-related pathways, an upregulation of nucleotide excision repair genes, a pseudostationary phase, and an upregulation of many targeting subunits of protein phosphatase I.
Methods
Aging Cell Preparation
All experiments were conducted with W303Ra, the W303 wild-type in which the RAD5 gene has been corrected by Rodney Rothstein from its mutation in W303-1A. Aging cells were prepared via magnetic sorting using Miltenyi Biotec microbeads and columns (Auburn, CA) (20). The average age of at least 20 mother cells was determined after staining the bud scars with Fluorescent Brightener 28 (Sigma, St. Louis, MO). We performed bud scar counting using multiplane focusing, using a Zeiss epifluorescence microscope (Carl Zeiss, Inc, Thornwood, NY). Our samples were collected from log phase 1g, 8g, 12g, and 18-20g cells; cells were never permitted to go into stationary phase of growth (<0.8 A600).
Microarrays and RNA
Microarrays were printed for Genome Consortium for Active Teaching (GCAT; Davidson College, Davidson, NC) at Washington University, St. Louis, with 70-mers corresponding to nonoverlapping regions of all open reading frames (ORFs) of budding yeast (21). Total RNA was prepared from cells at different ages via Qiagen RNeasy (Qiagen, Inc, Valencia, CA), in parallel with young cells sorted from the same preparation and subjected to exactly the same conditions of temperature, etc., to ensure that the control and the aging cells would have the same extent of stimulation of the ESR genes (19). The controls normalize the environmental response, and only the aging effects are seen. Control experiments showed that this procedure identified fewer genes as ‘age-related changes in expression’ than comparing all ages with a single young preparation that may have experienced small differences in protocol.
For each labeled probe preparation, we started with 50 μg of total RNA and amplified amplified RNA (aRNA) using the Ambion Amino Allyl MessageAmp II Kit and the Ambion Fragmentation Kit (ABI, Foster City, CA). For each age, there were three different RNA samples prepared and compared against matched young controls. Six to seven arrays were analyzed at each age. Three microarrays of each age set were analyzed with the dyes reversed. Arrays were scanned using an Axon Gene Pix 4000B scanner and GenePix Pro 5.1 software (Molecular Devices, Sunnyvale,CA). The quality control report was used for all arrays; Supplementary Table 1 shows the quality control cutoff values used for all arrays in this study.
Statistical Analysis
Before running statistical models, we normalized the data using Bioconductor Software (22-24). The preprocessing included removing all empty, control, and flagged genes. Also, if the fluorescence signal was <100 in one channel it was increased to 100; if it was <100 in both channels, the spot was removed from the analysis. The background fluorescence was subtracted from the foreground, and a LOWESS smoother was used to normalize the genes for each array. If >50% of the array spots were missing for a particular gene, the gene was removed from the analysis.
For each gene, we fit a linear model using the limma function (22,23) in Bioconductor. After fitting the model, we were able to look at particular comparisons and contrasts (e.g., 1g vs 18-20g). Genes that were significantly changed across the comparison according to the adjusted p < .05 by the Holm step-down method (25) were designated as significant (Supplementary Tables 2 and 3).
To identify potential functional regulons, we used three software programs. First, we imported the data into GeneSpring 7.0 (Agilent, Santa Clara, CA) to cluster. Our second software program was GenMAPP2 (26) plus MAPPFinder (27), which identified Gene Ontology (GO)-term-based functional groups that were changed in expression. For GenMAPP2, we selected only genes that changed at least threefold; therefore, not all significantly changed genes are included in the GenMAPP2 analysis. However, the analysis can identify the most consistently up- and downregulated pathways with high confidence. The third software we used was GOCluster (28), which uses the Gene Ontology designations for every gene to detect statistically significant cellular constituents, molecular functions, and processes that differ between samples. This software adjusts the p values for multiple sample errors using the Bonferroni correction.
To test the microarray averages for particular genes that fit our patterns of pathway regulation in aging, we used qPCR. The primer sets were designed to amplify a region of about 100 bp near the 3′ end of the mRNA. An ABI Prism 7000 (Foster City, CA) sequence detection system was used. Reactions were run in 96-well plates using the ABI standard curve method. Three replicates were performed for each concentration for the standard curve of each gene, and four replicates for each test sample at each age for each gene. The ABI (Foster City, CA)SYBR green reagent mixture was used. TUB1 served as our internal standard gene for the qPCR (15). After data were collected, the samples were subjected to thermal denaturation to verify that single species had been synthesized. Figure 3 and Supplementary Figure 1 show the strong correlation between the qPCR results and the average microarray results.
Figure 3.

Correlation between average expression ratios from quantitative real-time reverse-transcription polymerase chain reaction (qPCR) and microarrays. Genes were selected from categories important in yeast aging. Average ratios of old to young messenger RNA (mRNA) for each gene, plus or minus standard deviations, are shown. Microarray data are from Bioconductor (22-24) using LOWESS smoothing; qPCR data are from standard curve method (ABI) with standard deviations calculated according to the ABI Guide, “Performing Relative Quantitation of Gene Expression Using Real-Time Quantitative PCR,” available from the ABI Web site. The RNA preparations used for qPCR were from 18-20g cells for GLC7, MF(alpha)2 given as MF-A2, MET6, MIS1, PNC1, RPA12, SSB2, SUN4, and TRM82. The RNA preparations assayed for ACO1, ASF1, SIR2, and TYE7 were from 12g cells. The preparations assayed for CLA4 and MNN1 were from 8g cells.
Results
General Aspects of Data
Age-related changes in gene expression accumulate during mother cell aging; in our preliminary statistical analysis, we predicted and found that the variation in ratios of mRNA from older cells compared to 1g mRNA became larger as the cells aged (29). To make our data available for general access and analysis, we have put all genes with mRNA changes significant at the p ≤ .05 level with the Holm correction into Supplementary Table 3 (18-20g analysis) and Supplementary Table 2 (12g analysis); both tables are based on t tests that compare the experimental condition to the control at 1g on a gene-by-gene basis. The microarray Minimum Information About a Microarray Experiment (MIAME) information and the raw data will be posted through the account of LLMH at Gene Expression Omnibus (30) and at the GCAT website (http://www.bio.davidson.edu/projects/GCAT/GCAT.html).
The timing of initiation of age-related changes in gene expression is later than previously appreciated. Our data indicate that for genes with p ≤ .05 (again, t tests of experimental condition vs control at 1g using the Holm correction), there are no genes with statistically significant expression changes in the 8g arrays. There is a substantial overlap between the genes significantly changed at 12g and 18-20g, as shown in Figure 1. Figure 2 shows the major categories of gene annotation that were notable among significantly changed genes in aging yeast. These functions were determined using Saccharomyces Genome Database annotations for the genes identified as significant at 18-20g in Bioconductor.
Figure 1.
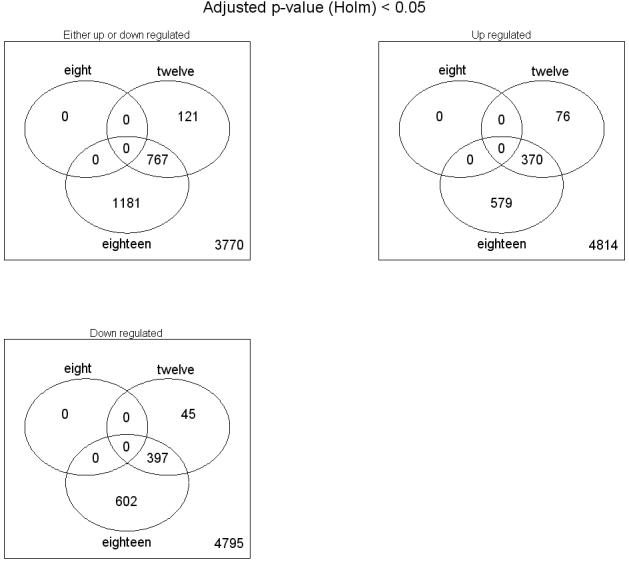
Overlap in statistically significant changes (p ≤ .05) among age classes in microarray data. Using Bioconductor (22-24), the p values have been adjusted for multiple testing by the method of Holm (25).
Figure 2.

Functional categories among statistically significant gene expression changes at 18-20g. Genes were identified by Bioconductor (22-24) as significant. mRNA, messenger RNA; ER, endoplasmic reticulum; HS, heat shock.
To explore the gene functions, we began with GenMAPPII/MAPPFinder. This GO analysis software identified ribosome-related genes as the top category of age-related changes at 18-20g (Table 1) and also at 12g (data not shown). Metabolism, amino acid and nucleotide metabolism, mating-related functions, and several categories related to methylation were also significantly changed at 18-20g. Table 1 shows a z score and two probabilities produced by MAPPFinder. A z score of 1.96 would be consistent with a p value of .05. Positive z scores indicate that the experiment found more genes changed in expression than randomly expected in the category, whereas negative values indicate fewer genes than expected. The permuted probability is a calculated nonparametric statistic based on 2000 permutations of the data, with gene associations randomized for each sample. The probability is adjusted for multiple testing using the Westfall-Young adjustment, which calculates the family-wise error rate for each sample. Table 1 summarizes GO categories with p < .05 for one or both types of p value. Except for DNA repair, the categories had a positive z score, meaning that the gene types were overrepresented among genes that changed in expression.
We also used GOCluster (28) to examine the classes of genes that had changed significantly during aging. We used the K-means clustering with four clusters. We considered a category important if it appeared significant ≥50 times of 200 tries. In general, the findings of this method agree with the results of GenMappII, highlighting changes in the cellular constituents affecting ribosome and nucleolus. There were important changes in transcription (especially of ribosomal RNA [rRNA]) and translation. Changes were strong in carbohydrate/energy metabolism and amino acid metabolism. In addition, GOCluster’s findings highlight changes in protein catabolism (especially ubiquitin-related).
We had a clear correlation between qPCR and microarray results. Figure 3 shows the correlation between average qPCR results and average microarray results for specific genes of interest. The Wilcoxon rank sum test (p = .23) and paired t test (p = .9, two tailed) both test the hypothesis of differences across the two types of measurements (qPCR vs microarray). The large p values tell us that we cannot reject the null hypothesis of no difference. Correlation tests showed p < .001 of collecting our data set if in fact there was no correlation, so they corroborate that qPCR and microarray values provide similar information about mRNA expression. All mRNAs were found to change in the same direction with similar magnitudes in both assays, supporting the functional group changes we have identified.
In Figure 3 and Supplementary Table 3, results for PNC1 and SIR2 indicated that the former is increased in expression in the aging cells whereas the latter is not. In aging, a pseudodiploid state is established by expression of the silent mating-type locus; we have found that IME1 is significantly induced at 12g and 18-20g as expected in a cell that acts diploid, whereas there is no induction of STE12, HO, or RME1, haploid-specific genes. Not all genes we have examined follow this prediction, however. For example, SPO13, which is thought to control aspects of the first meiotic division, is not significantly induced in 18-20g cells. In addition, HMLalpha1 and HMLalpha2 did not behave identically. The latter was significantly increased in expression, but not the former. The strong expression of IME1 supports an effective transcription from the HML, in any case.
Ribosome- and Nucleolus-Related Functions
Our first conclusion is that the most significant age-related changes affect ribosome biogenesis. Ribosomal protein genes and rRNA processing/nucleolar function genes are often coregulated but constitute separate regulons (31,32). Figure 4A shows the overlap between the ribosomal protein regulon with the genes we have found significantly changed that have ribosomal protein GO annotations; Figure 4B shows similar overlap for the rRNA and ribosome biosynthesis regulon.
Figure 4.
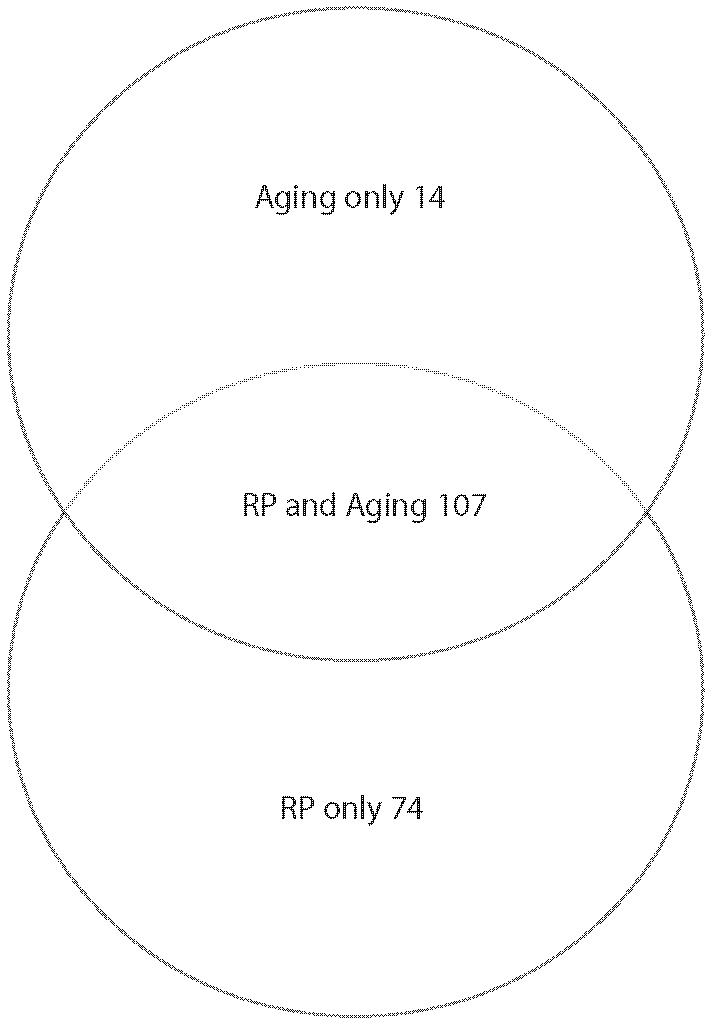
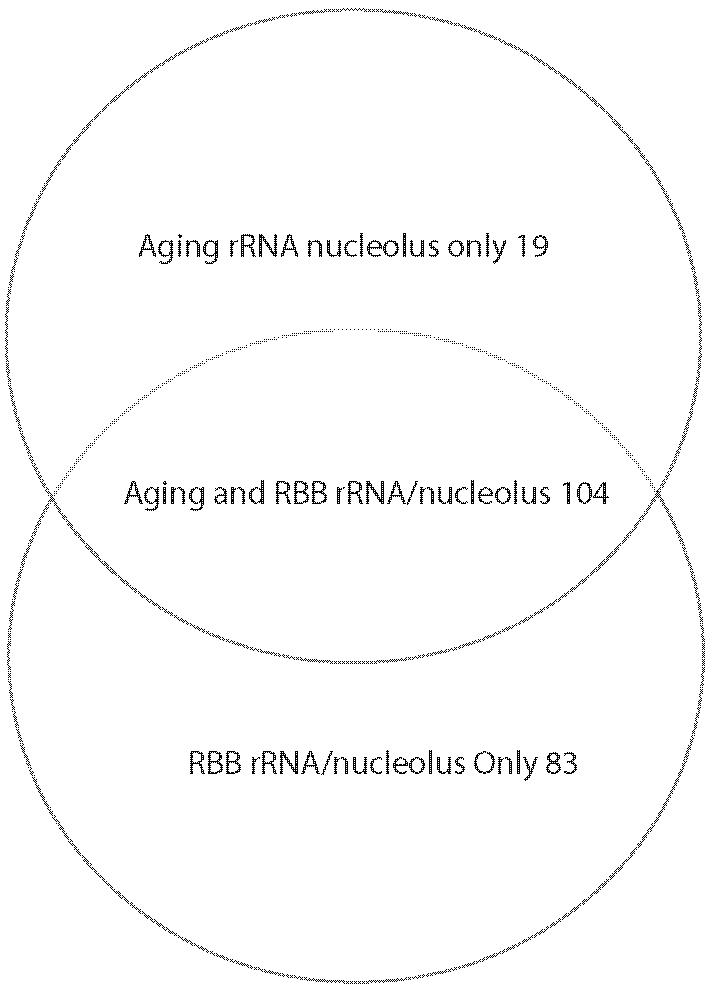
Ribosome-related gene expression changes in yeast replicative aging. A, Overlap between the ribosomal protein (RP) regulon and the RP genes that change significantly in expression at 18-20g compared to 1g via Bioconductor (22-24) analysis using LOWESS smoothing. B, Overlap between the ribosome maturation (RBB) regulon and aging ribosomal RNA (rRNA)-nucleolar genes. The aging group included the Ribosomal rRNA Processing and Nucleolar Ribosome assembly and export genes that change significantly in expression at 18-20g compared to 1g in Bioconductor (22-24) analysis using LOWESS smoothing.
Pseudostationary Phase in Aging Cells
We propose the term pseudostationary phase to characterize many of the metabolic and other changes that we see as the mother cells undergo replicative aging. There are several groups of gene expression changes that support that suggestion. First, in the process of entering stationary phase, the ESR genes (19) respond. We see a major overlap between the genes that undergo significant age-related changes and the ESR group, as shown in the Venn diagram in Figure 5A. The ESR genes include some that are induced whereas others, such as the ribosomal genes, are downregulated. We examined the issue of whether the aging genes are regulated in the same direction as the ESR by means of a correlation plot shown in Figure 5B, and found a strong tendency for expression to change in the same direction in aging and in stress.
Figure 5.
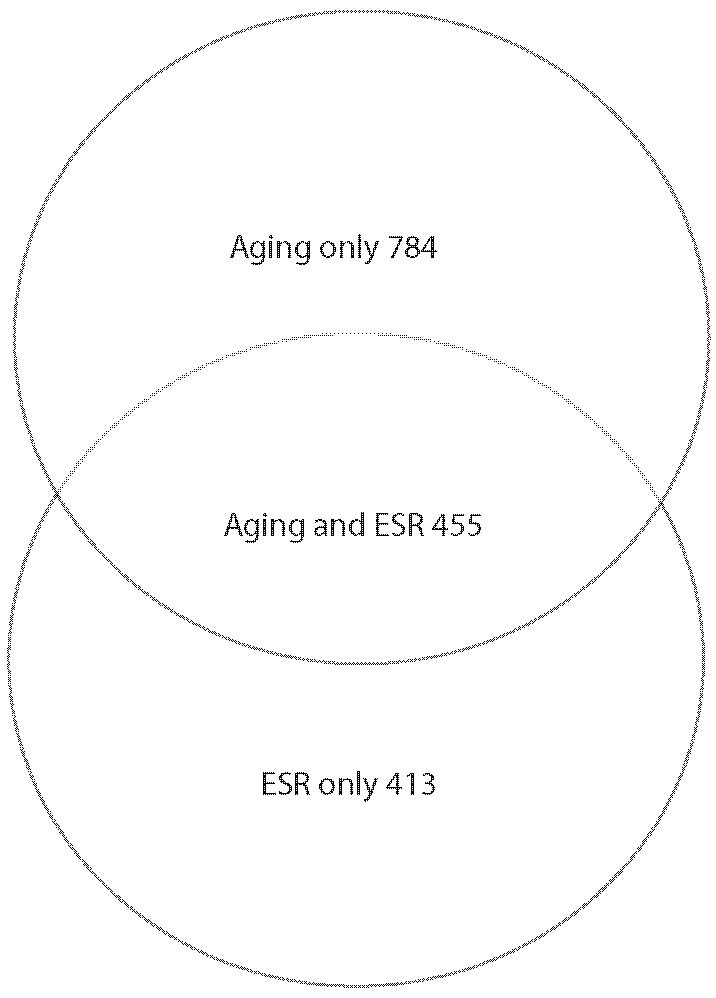

Pseudostationary phase genes that affect environmental stress responses (ESRs) in replicatively aging yeast. Data from Bioconductor (22-24) analysis using LOWESS smoothing. A, Overlap between significantly changed messenger RNAs (mRNAs) in aging and in ESR (19). B, Age and stress affect ESR genes similarly. A sample of 25 arbitrarily chosen genes that take part in the ESR was tested for correspondence between expression in cells treated 45 minutes with 0.2% methyl methane sulfonate (MMS) [data from (19)] and 18-20g cells. The log (base 2) of the expression ratio was plotted. The preponderance of the data fall in the negative/negative and positive/positive quadrants indicating similar changes in gene expression induction/repression from aging and from stress.
Also with regard to pseudostationary phase, genes known to be upregulated in stationary phase, such as the SNZ genes and the glycogen-related genes, are affected during aging (Table 2). One of the important genes in this group, GSY2 encoding glycogen synthase, is regulated by Snf1 protein kinase and Glc7-Gac1 protein phosphatase I. The mRNAs for GSY2 and its homolog GSY1 were significantly upregulated by 18-20g (Supplementary Table 3). As shown for GSY1 in Figure 6A, the graph of which is virtually identical to a graph for GSY2, the increase had not yet begun at 8g and is barely significant at 12g, but strong at 18-20g.
Figure 6.


Pseudostationary phase gene expression patterns in yeast replicative aging. A, Expression of glycogen synthase GSY1 as a function of age. Data from Bioconductor (22-24) analysis using LOWESS smoothing. The expression of the second gene for this enzyme, GSY2, with age is virtually identical with this graph (Supplementary Tables 2 and 3). B, Hexose transporter messenger RNAs (mRNAs) during yeast aging. Data from Bioconductor (22-24) analysis using LOWESS smoothing. The genes significantly induced during aging and averaged for this figure were HXT2, HXT3, HXT5, HXT6, HXT7, HXT9, HXT15, and HXT17.
Another interesting feature of the pseudostationary phase involves the hexose transport proteins. Despite the fact that glucose is still present and sufficient for logarithmic growth of the young cells in the same culture, we found mRNAs for a group of hexose transporters to be almost threefold higher at both 12g and 18-20g (Figure 6B).
The transcription factors Msn2, Msn4, and Yap1 regulate many of these genes (19). MSN2 is constitutive but MSN4 is inducible. We found significant increases in expression at 18-20g for both MSN4 and for another transcription factor that regulates some of the stress response genes (19), YAP1 (Supplementary Table 3).
Downregulation of Methylation-Related mRNAs
Methylation-related genes have not been previously recognized as an important regulon in yeast aging. This lack of identification might be partly because methylation is not a GO category, an annotation problem mentioned in the MAPPFinder analysis (Table 1). The methylation-related genes that were significantly decreased in expression are shown in Table 3. Most of these mRNAs, including SAM1-SAM4, were decreased in the older cells, with very low p values. Genes encoding proteins that affect both folate-derivative metabolism and S-adenosyl methionine metabolism are reduced in expression. Importantly, genes for rRNA and transfer RNA (tRNA) methylation showed decreased expression. Because there is no DNA methylation in yeast, genes for that process were not present in the study.
DNA Damage Repair Genes in Aging
Scattered DNA repair gene expression changes at 18-20g occurred, resulting in under-representation of the DNA repair category in the MAPPFinder analysis (Table 1). Only nucleotide excision repair showed several genes induced at 18-20g (Figure 7).
Figure 7.

Nucleotide excision repair messenger RNAs (mRNAs) were significantly induced in old mother cells. The six NER genes significantly induced (p < .05 with Holm correction at 18-20g compared to 1g) and averaged for this figure were RAD2, RAD4, RAD7, RAD10, RAD14, and RAD28.
Protein Phosphatase I Targeting Subunit mRNAs Upregulated
Protein kinase cascades are important in yeast aging, as has been described by several groups. We have made a related discovery, namely an upregulation of the mRNAs for the regulatory subunits of Glc7, protein phosphatase I. Table 4 shows the effects of replicative aging on the mRNAs encoding these subunits and, except for two that are related specifically to budding, they exhibit significant upregulation. The gene for the catalytic subunit (GLC7) was found to be constitutive, in agreement with previous work showing that the gene is constitutive during growth and is only induced in stationary phase (33).
The effect of this transcriptional increase could be to allow more of the transcription factors Msn2 and Msn4 to enter the nucleus and turn up expression of genes with STRE promoters. A number of those genes are indeed upregulated in our data, a selection of which are shown in Figure 8. Thus, microarray analysis supports the notion developed by genetic analysis, that the protein phosphorylation cascades affecting Msn2 and Msn4 are important in yeast aging.
Figure 8.

Pathways of regulation of stress response genes by protein kinases and protein phosphatase I in yeast, showing effects of replicative aging. Numbers following gene names show the expression ratio of 18-20g cells compared to 1g cells calculated in Bioconductor with LOWESS smoothing (22-24). cAMP, cyclic adenosine monophosphate.
Discussion
One of the findings of the current study was the notable decrease in mRNAs of a group of genes related to methylation. In higher eukaryotes, such as rodents and humans, there is evidence that methylation of DNA decreases during aging (5-7). In addition, modification of tRNA changes in aging (34). It was not clear in these studies whether methylation decrease was protective or deleterious. However, recently it has been found that limiting the methionine in the diet of mice extends life span, enhances stress resistance, and retards a number of age-related chemical changes (11). In Caenorhabditis elegans, a recent RNA interference-based screen for aging-related genes identified a gene encoding S-AdoMet Synthase (sams1) as one of 23 such genes (35). They noted that downregulation of methylation of macromolecules is an important aspect of life-span extension by caloric restriction in C. elegans. It is particularly interesting to find SAM genes repressed in yeast replicative aging because S-adenosyl methionine has been found to regulate the yeast G1 Start signal (36). We have thus identified a new homology between yeast and animal aging processes.
We also found age-related effects that implicate regulation of Msn2/Msn4 transcription factors by phosphorylation. Replicative aging in yeast is regulated by the Msn2 and Msn4 transcription factors (37). Msn2 and 4 cannot go to the nucleus to activate genes if phosphorylated. A variety of protein kinases appear capable of phosphorylating them, such as protein kinase A, Sch9, Snf1/Snf4/Sip1 protein kinase, and possibly the TOR pathway kinases. Of these, the Sch9 and TOR kinases appear important in matching the replicative aging process to nutritional cues (38,39).
Our finding related to these protein kinase pathways concerns protein phosphatase I (PP1), which activates Msn2 and 4 by removing phosphate. The PP1 catalytic subunit encoded by GLC7 is constitutive during logarithmic growth but increases in stationary phase (33), and we maintained our aging cells in logarithmic phase. As noted above, we found the catalytic subunit mRNA not to vary with mother cell age, consistent with our growth regimen and our designation of the aged metabolic state as pseudostationary phase. The genes for numerous regulatory PP1 subunits are inducible. Our contribution is the finding that five of the regulatory subunits of this phosphatase are upregulated more than threefold, and another is upregulated twofold in aging yeast cells. Known targets of the two transcription factors are also upregulated, as would be expected if Msn2 and Msn4 reach the nucleus. Lin and colleagues (14) had found an upregulation of one of the regulatory subunits of PP1 at 8g. We have found almost all of the regulatory subunits upregulated (Table 4, Figure 8).
Another finding that relates to this convergence of protein kinase/phosphatase pathways involves Sip2, a myristoylated β subunit of the protein kinase Snf1. In young cells, this protein acts as a negative regulator of nuclear Snf1 by sequestering its activating γ subunit, Snf4, at the plasma membrane. During aging, Sip2 shifts from the plasma membrane to the cytoplasm, along with a redistribution of Snf4 from the plasma membrane to the nucleus. Deletion of sip2 releases the activator Snf4 and increases the activity of the Snf1 protein kinase within nuclei (40). That activity in turn can phosphorylate Msn2 and 4, sending them out of the nucleus. We found that the mRNA for Sip2 is increased over twofold in both 12g and 18g samples. This induction is predicted to have an effect similar to the upregulation of PP1 activity, because in both cases more of the two transcription factors could enter the nucleus. Our finding fits well with the fact that the sip2 deletion has a shorter life span and a faster metabolic shift (40).
This protein kinase nexus may also have a connection to the genomic instability at the ribosomal DNA (rDNA) locus noted during aging (41,42). The sip2 deletion has higher H3 histone kinase activity, more rDNA recombination, and loss of silencing at sites affected by histone H3 ser10 phosphorylation by Snf1, such as the INO1 promoter and targets of the Adr1 transcription factor (40). Supporting a similar change in chromatin silencing during replicative aging, we have noted significant upregulation of several genes under the control of Adr1p, such as ADH2, ALD4, GUT2, POX1, and PEX1 (Supplementary Tables 2 and 3). In the earlier study, deletion of the gene for Fob1, a protein that binds the replication fork block site in each rDNA repeat and prevents replication forks and transcription forks from colliding, stopped the rDNA effects of the sip2 deletion (40). Thus, the aging effects of protein kinase cascades can extend far beyond simple metabolic regulation.
Our third significant finding relates to pseudostationary phase. One hallmark of stationary phase in budding yeast is the accumulation of glycogen, particularly through the approximately 10-fold induction of the glycogen synthase 2 gene, GSY2, during the normal logarithmic to stationary phase transition (43). This gene and many other genes related to glycogen metabolism are induced in old mother cells. Induction of glycogen-related genes had been noted before (14,16). Early in aging, 8g cells accumulate glycogen and have increased expression of a few glycogen-related genes (14). Extensive study of stationary culture gene expression has been carried out (44), showing glycogen gene induction and stationary phase gene induction. We are intrigued by the earlier finding that experiencing stationary phase results in an advancement of the replicative aging clock (45).
We compared our age-related changes in gene expression with stationary phase expression changes found by Martinez and colleagues (44) and note that the two also share decreased ribosome and nucleolar gene expression. Recently, it has been found that ribosomal protein gene deletions in diploids, or deletions of one of a pair of paralogs, lengthen life span (38,46), heightening the potential importance of the ribosomal/nucleolar downregulation we found. In addition, SNZ stationary phase-related genes are induced at least 2.4-fold in 18-20g cells (Table 2). We have dubbed this effect ‘pseudostationary phase,’ because the cell growth regimen keeps the cells from ever achieving a cell density that would result in stationary phase in young cultures. In addition to the criteria of low cell density and measurable glucose in the medium, we can verify that the cells are not in real stationary phase by the lack of induction of GLC7 (see Protein Phosphatase section below).
A typical feature of cells entering stationary phase is the diauxic shift, monitored elegantly by DeRisi and colleagues (47) in one of the earliest microarray studies. A change away from glycolysis and toward aerobic metabolism of ethanol and gluconeogenesis occurs early in diauxie, along with many of the gene expression changes found in the ESR. Aerobic metabolism of ethanol provides an abundance of adenosine triphosphate (ATP) so that biosyntheses of glucose and glycogen become more feasible than under fermentation. The changes in metabolism reported by us and others for aging mother cells of yeast show them to be undergoing diauxie under conditions that do not induce diauxie in young cells, i.e., early cultures with glucose remaining in the medium.
Because the cells act as if they are running out of glucose when they are not, we were interested to find that mRNAs for most of the hexose transporters were increased with aging. Koc and colleagues (16) had also noted an increase in transport proteins during aging, and Lin and colleagues (14) noted two HXT genes were upregulated at 8g. This inaccurate detection of glucose limitation by mother cells might be related to a surface-to-volume ratio decrease as the mother cells enlarge. When the cells detect (or seem to detect) a limitation in glucose, it is likely that the cells respond by inducing the stress/diauxie pathways and preparing for stationary phase prematurely. A recent study using α factor arrest to regulate cell size has shown that size is related inversely to replication potential (48). We note that the recent suggestion that yeast may undergo altruistic aging (49,50) fits well with the existence of the pseudostationary phase gene expression pattern because stationary phase is often followed by death in yeast. Cells that enter the pseudostationary phase, we propose, can more easily sacrifice themselves for the well-being of nearby young cells. In addition, the recently discovered gene sets that are important in aging and also in apoptosis (49,50) suggest the altruistic response is readied in aging cells.
Different growth regimens could potentially result in different gene expression patterns, so it is important to note that these results apply to dilute cultures grown in liquid medium. For example, they need not be identical to the gene expression patterns to be found in cells undergoing life-span studies by dissection on agar plates, essentially at infinite dilution (not near any other cells and growing at an air/liquid interface). The authors urge the gerontological community to take this caveat into consideration when applying our results to other aging studies.
Like Lesur and Campbell (15), we found that the ribosomal protein (RP) regulon is downregulated. We also note that the ribosome maturation regulon (Ribi or RBB), is heavily downregulated in aging mother cells. With the current data, we cannot tell whether this decrease results from the slower growth experienced by older cells, but growth rate and ribosome gene expression are clearly linked (31). The mRNAs for two important proximal regulators of ribosomal gene expression, Rap1 and Ifh1 (51,52), are significantly downregulated at 18-20g. The Ifh1 mRNA was downregulated by 0.54-fold compared to the young expression (p = .013 with Holm adjustment), and the Rap1 mRNA decreased 0.47-fold (p = .019 with Holm adjustment) as shown in Supplementary Table 3. However, it is likely that these are not the sole determinants of the ribosome gene expression decline because the set of ribosome genes that decrease in expression in aging are not identical to those regulated by Ifh1 in association with Rap1 (52,53). For example, we found that genes RPL18B and HYP2, genes that were unresponsive to Ifh1, were both downregulated to similar extents as the responsive genes such as RPL12A, RPS11B, and RPL40A.
There are connections between stress and ribosome gene expression. For example, the nonessential stress-responsive genes YAR1 and LTV1 function in 40s ribosomal subunit production (53). The expression of these two genes is significantly decreased at 18-20g (Supplementary Table 3).
The Ribi and RP regulons are under the control of Sch9 (32), a protein kinase that has been implicated in yeast aging (37-39,50, 54-55). This protein kinase also interacts with the Msn2/4 pathway described above. Thus, the examination of mRNA patterns in aging yeast cells has unexpectedly led us to consider the prime importance of this covalent modification cascade involving Sch9 and Snf1 on one hand and PP1 on the other.
Supplementary Material
Supplementary Figure 1. Correlation between quantitative real-time reverse-transcription polymerase chain reaction (qPCR) and microarray data. The log base 2 of the average microarray ratio with old divided by young from Bioconductor (22-24) analysis was plotted against the log base 2 of the average qPCR ratio. The R2 value is high, showing that the two methods are highly correlated.
Acknowledgments
This research was supported by National Science Foundation (NSF)-RUI MCB 113937 to LH, National Institutes of Health (NIH)-AREA R15AG21907-01A1 (to LH and JH), and NSF-MRI DBI 318944 (to Pomona College) for equipment. Stipends and supplies were provided by a Beckman Scholars grant from the Beckman Foundation (to MYS and GY), the Merck/American Association for the Advancement of Science (AAAS) Fellowship program for support (to AK), and the Pomona College Research Committee (to RJ and JH).
We thank Rodney Rothstein for W303Ra and Genome Consortium for Active Teaching and Institute for Systems Biology for the microarray slides. We thank Charles Kang, Krassen Dimitrov, Leroy Hood, Steven Proper, Allison Golden, Barbara Dunn, Malcolm Campbell, and Laurie Heyer for insightful discussions about microarrays and Caleb E. Finch for a helpful review of the manuscript.
Preliminary presentations of material in this article have been made at the following conferences: Molecular Genetics of Aging conference, Cold Spring Harbor, NY, October, 2006; American Society for Microbiology, May, 2006, Orlando, FL; Yeast Genetics and Molecular Biology Meeting, Genetics Society of America, July 27-August 1, 2004, Seattle, WA; and Miami Biotechnology Symposium, January, 2004.
Rishi Jindal is currently with the University of Pittsburgh School of Medicine, Pennsylvania. Jennifer Hardee is currently with Yale University, New Haven, Connecticut. Allen Kuo is currently with the New York Medical College, Valhalla. Michelle Yuen Shimogawa is currently with the University of Washington, Seattle.
Laty Cahoon is currently with the Northwestern University Biology Department, Evanston, Illinois.
Michelle Wu is currently with Amgen, Thousand Oaks, California.
References
- 1.Jazwinski SM. An experimental system for the molecular analysis of the aging process: the budding yeast Saccharomyces cerevisiae. J Gerontol. 1990;45:B68–B74. doi: 10.1093/geronj/45.3.b68. [DOI] [PubMed] [Google Scholar]
- 2.Kennedy BK, Austriaco NR, Jr, Guarente L. Daughter cells of Saccharomyces cerevisiae from old mothers display a reduced life span. J Cell Biol. 1994;127(6 pt 2):1985–1993. doi: 10.1083/jcb.127.6.1985. [DOI] [PMC free article] [PubMed] [Google Scholar]
- 3.Dean RG, Socher SH, Cutler RG. Dysdifferentiative nature of aging: age-dependent expression of mouse mammary tumor virus and casein genes in brain and liver tissues of the C57BL/6J mouse strain. Arch Gerontol Geriatr. 1985;4:43–51. doi: 10.1016/0167-4943(85)90017-2. [DOI] [PubMed] [Google Scholar]
- 4.Powers RW, 3rd, Kaeberlein M, Caldwell SD, et al. Extension of chronological life span in yeast by decreased TOR pathway signaling. Genes Dev. 2006;20:174–184. doi: 10.1101/gad.1381406. [DOI] [PMC free article] [PubMed] [Google Scholar]
- 5.Singhal RP, Mays-Hoopes LL, Eichhorn GL. DNA methylation in aging of mice. Mech Ageing Dev. 1987;41:199–210. doi: 10.1016/0047-6374(87)90040-6. [DOI] [PubMed] [Google Scholar]
- 6.Wilson VL, Smith RA, Ma S, Cutler RG. Genomic 5-methyldeoxycytidine decreases with age. J Biol Chem. 1987;262:9948–9951. [PubMed] [Google Scholar]
- 7.Mays-Hoopes LL, Brown A, Huang RC. Methylation and rearrangement of mouse intracisternal A particle genes in development, aging, and myeloma. Mol Cell Biol. 1983;3:1371–1380. doi: 10.1128/mcb.3.8.1371. [DOI] [PMC free article] [PubMed] [Google Scholar]
- 8.Barbot W, Dupressoir A, Lazar V, Heidmann T. Epigenetic regulation of an IAP retrotransposon in the aging mouse: progressive demethylation and de-silencing of the element by its repetitive induction. Nucleic Acids Res. 2002;30:2365–2373. doi: 10.1093/nar/30.11.2365. [DOI] [PMC free article] [PubMed] [Google Scholar]
- 9.Johnson TE, Henderson S, Murakami S, et al. Longevity genes in the nematode Caenorhabditis elegans also mediate resistance to stress and prevent disease. J Inherit Metab Dis. 2002;25:197–206. doi: 10.1023/a:1015677828407. [DOI] [PubMed] [Google Scholar]
- 10.Dozmorov I, Galecki A, Chang Y, et al. Gene expression profile of long-lived snell dwarf mice. J Gerontol Biol Sci. 2002;57A:B99–B108. doi: 10.1093/gerona/57.3.b99. [DOI] [PubMed] [Google Scholar]
- 11.Miller RA, Buehner G, Chang Y, et al. Methionine-deficient diet extends mouse lifespan, slows immune and lens aging, alters glucose, T4, IGF-I and insulin levels, and increases hepatocyte MIF levels and stress resistance. Aging Cell. 2005;4:119–125. doi: 10.1111/j.1474-9726.2005.00152.x. [DOI] [PMC free article] [PubMed] [Google Scholar]
- 12.Miller RA, Chang Y, Galecki AT, et al. Gene expression patterns in calorically restricted mice: partial overlap with long-lived mutant mice. Mol Endocrinol. 2002;16:2657–2666. doi: 10.1210/me.2002-0142. [DOI] [PubMed] [Google Scholar]
- 13.Weindruch R, Kayo T, Lee CK, Prolla TA. Microarray profiling of gene expression in aging and its alteration by caloric restriction in mice. J Nutr. 2001;131:918s–923s. doi: 10.1093/jn/131.3.918S. [DOI] [PubMed] [Google Scholar]
- 14.Lin SS, Manchester JK, Gordon JI. Enhanced gluconeogenesis and increased energy storage as hallmarks of aging in Saccharomyces cerevisiae. J Biol Chem. 2001;276:36000–36007. doi: 10.1074/jbc.M103509200. [DOI] [PubMed] [Google Scholar]
- 15.Lesur I, Campbell JL. The transcriptome of prematurely aging yeast cells is similar to that of telomerase-deficient cells. Mol Biol Cell. 2004;15:1297–1312. doi: 10.1091/mbc.E03-10-0742. [DOI] [PMC free article] [PubMed] [Google Scholar]
- 16.Koc A, Gasch AP, Rutherford JC, et al. Methionine sulfoxide reductase regulation of yeast lifespan reveals reactive oxygen species-dependent and -independent components of aging. Proc Natl Acad Sci U S A. 2004;101:7999–8004. doi: 10.1073/pnas.0307929101. [DOI] [PMC free article] [PubMed] [Google Scholar]
- 17.Lin SJ, DeFossez P-A, Guarente L. Requirement of NAD and SIR2 for life-span extension by calorie restriction in Saccharomyces cerevisiae. Science. 2000;289:2126–2128. doi: 10.1126/science.289.5487.2126. [DOI] [PubMed] [Google Scholar]
- 18.Jiang J, Jaruga E, Repnevskaya M, Jazwinski SM. An intervention resembling caloric restriction prolongs life span and retards aging in yeast. FASEB J. 2000;14:2135–2137. doi: 10.1096/fj.00-0242fje. [DOI] [PubMed] [Google Scholar]
- 19.Gasch A, Spellman PT, Kao CM, et al. Genomic expression programs in the response of yeast cells to environmental changes. Mol Biol Cell. 2000;11:4241–4257. doi: 10.1091/mbc.11.12.4241. [DOI] [PMC free article] [PubMed] [Google Scholar]
- 20.Chen C, Dewale S, Braeckman B, et al. A high-throughput screening system for genes extending life-span. Exp Gerontol. 2003;38:1051–1063. doi: 10.1016/s0531-5565(03)00186-4. [DOI] [PubMed] [Google Scholar]
- 21.Campbell AM, Eckdahl TT, Fowlks E, et al. Genome Consortium for Active Teaching (GCAT) Science. 2000;311:110–111. doi: 10.1126/science.1121955. [DOI] [PubMed] [Google Scholar]
- 22.Smyth GK. Limma: linear models for microarray data. In: Gentleman R, Carey V, Dudoit S, Irizarry R, Huber W, editors. Bioinformatics and Computational Biology Solutions using R and Bioconductor. Springer; New York: 2005. pp. 397–420. [Google Scholar]
- 23.Smyth GK. Linear models and empirical Bayes methods for assessing differential expression in microarray experiments. Stat Appl Genet Mol Biol. 2004;3 doi: 10.2202/1544-6115.1027. Article 3. [DOI] [PubMed] [Google Scholar]
- 24.Gentleman R, Carey V, Bates D, et al. Bioconductor: open software development for computational biology and bioinformatics. Genome Biol. 2004;5:R80. doi: 10.1186/gb-2004-5-10-r80. [DOI] [PMC free article] [PubMed] [Google Scholar]
- 25.Holm S. A simple sequentially rejective multiple test procedure. Scand J Stats. 1979;6:65–70. [Google Scholar]
- 26.Dahlquist KD, Salomonis N, Vranizan K, et al. GenMAPP, a new tool for viewing and analyzing microarray data on biological pathways. Nat Genet. 2002;31:19–20. doi: 10.1038/ng0502-19. [DOI] [PubMed] [Google Scholar]
- 27.Doniger SW, Salomonis N, Dahlquist KD, et al. MAPPFinder: using Gene Ontology and GenMAPP to create a global gene-expression profile from microarray data. Genome Biol. 2003;4:R7. doi: 10.1186/gb-2003-4-1-r7. [DOI] [PMC free article] [PubMed] [Google Scholar]
- 28.Wrobel G, Chilmet F, Primig M. GOCluster integrates statistical analysis and functional interpretation of microarray expression data. Bioinformatics. 2005;21:3575–3577. doi: 10.1093/bioinformatics/bti574. [DOI] [PubMed] [Google Scholar]
- 29.Wise A, Hardin J, Hoopes L. Yeast through the ages: a statistical analysis of genetic changes in yeast aging. Chance (Publication of the American Statistical Association) 2006;19:39–44. [Google Scholar]
- 30.Edgar R, Domrachev M, Lash AE. Gene expression omnibus: NCBI gene expression and hybridization array data repository. Nucleic Acids Res. 2002;30:207–210. doi: 10.1093/nar/30.1.207. [DOI] [PMC free article] [PubMed] [Google Scholar]
- 31.Wade C, Umbarger MA, McAlear MA. The budding yeast rRNA and ribosome biosynthesis (RBB) regulon contains over 200 genes. Yeast. 2006;23:293–306. doi: 10.1002/yea.1353. [DOI] [PubMed] [Google Scholar]
- 32.Jorgensen P, Rupes I, Sharom JR, et al. A dynamic transcriptional network communicates growth potential to ribosome synthesis and critical cell size. Genes Dev. 2004;18:2491–2505. doi: 10.1101/gad.1228804. [DOI] [PMC free article] [PubMed] [Google Scholar]
- 33.Feng Z, Wilson S, Peng Z, et al. The yeast GLC7 gene required for glycogen accumulation encodes a type I protein phosphatase. J Biol Chem. 1991;166:23796–23801. [PubMed] [Google Scholar]
- 34.Mays LL, Lawrence AE, Ho RW, Ackley S. Age-related changes in function of transfer ribonucleic acid of rat livers. Fed Proc. 1979;838:1984–1988. [PubMed] [Google Scholar]
- 35.Hansen M, Hsu A-L, Dillin A, Kenyon C. New genes tied to endocrine, metabolic, and dietary regulation of life span in a Caenorhabditis elegans genomic RNAi screen. PLoS Genet. 2005;1:119–128. doi: 10.1371/journal.pgen.0010017. [DOI] [PMC free article] [PubMed] [Google Scholar]
- 36.Mizunuma M, Miyamura K, Hirata D, et al. Involvement of S-adenosyl methionine in G1 cell-cycle regulation in Saccharomyces cerevisiae. Proc Natl Acad Sci U S A. 2006;101:6086–6091. doi: 10.1073/pnas.0308314101. [DOI] [PMC free article] [PubMed] [Google Scholar]
- 37.Fabrizio P, Pletcher SD, Minois N, et al. Chronological aging-independent replicative life span regulation by Msn2/Msn4 and Sod2 in Saccharomyces cerevisiae. FEBS Lett. 2004;557:136–142. doi: 10.1016/s0014-5793(03)01462-5. [DOI] [PubMed] [Google Scholar]
- 38.Kaeberlein M, Powers RW, 3rd, Steffen KK, et al. Regulation of yeast replicative life span by TOR and Sch9 in response to nutrients. Science. 2005;210:1193–1196. doi: 10.1126/science.1115535. [DOI] [PubMed] [Google Scholar]
- 39.Powers RW, Kaberlein M, Caldwell S, et al. Extension of chronological life span in yeast by decreased TOR pathway signaling. Genes Dev. 2006;20:174–184. doi: 10.1101/gad.1381406. [DOI] [PMC free article] [PubMed] [Google Scholar]
- 40.Lin SS, Manchester JK, Gordon JI. Sip 2, an N-myristoylated beta subunit of Snf1 kinase, regulates aging in Saccharomyces cerevisiae by affecting cellular histone kinase activity, recombination at rDNA loci, and silencing. J Biol Chem. 2003;278:13390–13397. doi: 10.1074/jbc.M212818200. [DOI] [PubMed] [Google Scholar]
- 41.Sinclair D, Mills K, Guarente L. Accelerated aging and nucleolar fragmentation in yeast sgs1 mutants. Science. 1997;277:1313–1316. doi: 10.1126/science.277.5330.1313. [DOI] [PubMed] [Google Scholar]
- 42.Sinclair D, Guarente L. Extrachromosomal rDNA circles—A cause of aging in yeast. Cell. 1997;91:1033–1042. doi: 10.1016/s0092-8674(00)80493-6. [DOI] [PubMed] [Google Scholar]
- 43.Hardy T, Huang D, Roach PJ. Interactions between cAMP-dependent and SNF1 protein kinases in the control of glycogen accumulation in Saccharomyces cerevisiae. J Biol Chem. 1994;269:27907–27913. [PubMed] [Google Scholar]
- 44.Martinez J, Roy S, Archuletta A, et al. Genomic analysis of stationary-phase and exit in Saccharomyces cerevisiae: gene expression and identification of novel essential genes. Mol Biol Cell. 2004;15:5295–5305. doi: 10.1091/mbc.E03-11-0856. [DOI] [PMC free article] [PubMed] [Google Scholar]
- 45.Ashrafi K, Sinclair D, Gordon JI, Guarente L. Passage through stationary phase advances replicative aging in Saccharomyces cerevisiae. Proc Natl Acad Sci U S A. 1999;96:9100–9105. doi: 10.1073/pnas.96.16.9100. [DOI] [PMC free article] [PubMed] [Google Scholar]
- 46.Chiocchetti A, Zhou J, Zhu H, et al. Ribosomal proteins Rpl10 and Rps6 are potent regulators of yeast replicative life span. Exp Gerontol. 2007;42:275–286. doi: 10.1016/j.exger.2006.11.002. [DOI] [PubMed] [Google Scholar]
- 47.DeRisi J, Iyer VR, Brown PO. Exploring the metabolic and genetic control of gene expression on a genomic scale. Science. 1997;278:680–686. doi: 10.1126/science.278.5338.680. [DOI] [PubMed] [Google Scholar]
- 48.Zadrag R, Kwolek-Mirek M, Bartosz G, Bilinski T. Relationship between the replicative age and cell volume in Saccharomyces cerevisiae. Acta Biochim Pol. 2006;53:747–751. [PubMed] [Google Scholar]
- 49.Longo VD, Mitteldorf J, Shulachev VP. Programmed and altruistic aging. Nat Rev Genet. 2005;6:866–872. doi: 10.1038/nrg1706. [DOI] [PubMed] [Google Scholar]
- 50.Longo VD. The Ras and Sch9 pathways regulate stress resistance and longevity. Exp Gerontol. 2003;38:807–811. doi: 10.1016/s0531-5565(03)00113-x. [DOI] [PubMed] [Google Scholar]
- 51.Wade J, Hall D, Struhl K. The transcription factor Ifh1 is a key regulator of yeast ribosomal protein genes. Nature. 2004;432:1054–1058. doi: 10.1038/nature03175. [DOI] [PubMed] [Google Scholar]
- 52.Schawalder S, Kabani M, Howald I, et al. Growth-regulated recruitment of the essential yeast ribosomal protein gene activator Ifh1. Nature. 2004;432:1058–1061. doi: 10.1038/nature03200. [DOI] [PubMed] [Google Scholar]
- 53.Loar J, Sieser R, Sundberg A, et al. Genetic and biochemical interactions among Yar1, Ltv1, and Rps3 define novel links between environmental stress and ribosome biogenesis in Saccharomyces cerevisiae. Genetics. 2004;168:1977–1889. doi: 10.1534/genetics.104.032656. [DOI] [PMC free article] [PubMed] [Google Scholar]
- 54.Kaeberlein M, Kirkland KT, Fields S, Kennedy BK. Genes determining yeast replicative life span in a long-lived genetic background. Mech Ageing Dev. 2005;126:491–504. doi: 10.1016/j.mad.2004.10.007. [DOI] [PubMed] [Google Scholar]
- 55.Laun P, Ramachandran L, Jarolim S, et al. A comparison of the aging and apoptotic transcriptome of Saccharomyces cerevisiae. FEMS Yeast Res. 2005;5:1261–1272. doi: 10.1016/j.femsyr.2005.07.006. [DOI] [PubMed] [Google Scholar]
Associated Data
This section collects any data citations, data availability statements, or supplementary materials included in this article.
Supplementary Materials
Supplementary Figure 1. Correlation between quantitative real-time reverse-transcription polymerase chain reaction (qPCR) and microarray data. The log base 2 of the average microarray ratio with old divided by young from Bioconductor (22-24) analysis was plotted against the log base 2 of the average qPCR ratio. The R2 value is high, showing that the two methods are highly correlated.