Abstract
Our purpose was to determine whether spatiotemporal measures of center of mass motion relative to the base of support boundary could predict stepping strategies after upper-body postural perturbations in humans. We expected that inclusion of center of mass acceleration in such time-to-contact (TtC) calculations would give better predictions and more advanced warning of perturbation severity. TtC measures were compared with traditional postural variables, which don’t consider support boundaries, and with an inverted pendulum model of dynamic stability developed by Hof et al. (2005). A pendulum was used to deliver sequentially increasing perturbations to 10 young adults, who were strapped to a wooden backboard that constrained motion to sagittal plane rotation about the ankle joint. Subjects were instructed to resist the perturbations, stepping only if necessary to prevent a fall. Peak center of mass and center of pressure velocity and acceleration demonstrated linear increases with postural challenge. In contrast, boundary relevant minimum TtC values decreased nonlinearly with postural challenge, enabling prediction of stepping responses using quadratic equations. When TtC calculations incorporated center of mass acceleration, the quadratic fits were better and gave more accurate predictions of the TtC values that would trigger stepping responses. In addition, TtC minima occurred earlier with acceleration inclusion, giving more advanced warning of perturbation severity. Our results were in agreement with TtC predictions based on Hof’s model, and suggest that TtC may function as a control parameter, influencing the postural control system’s decision to transition from a stationary base of support to a stepping strategy.
Keywords: Posture, Perturbation, Stability, Control Parameter, Spatiotemporal
1. Introduction
The sensory systems provide a wealth of information related to the linear and angular kinematics of the body (Von Holst and Mittelstaedt 1950). A perturbation applied to the upper body will accelerate the body’s center of mass (CoM) towards the perimeter of the base of support. Here, the most important information may not be the current CoM position, but where it will be in the future. If CoM motion cannot be arrested before crossing the support boundary, a step must be taken to maintain stability. The decision to step must be made promptly because it takes time for muscles to generate force and initiate movement.
The central nervous system may use time-to-contact1 (TtC) information to assess future postural stability (Carello et al. 1985; Riccio 1993). TtC is a boundary-relevant measure that combines information about the instantaneous kinematics of the CoM to predict a future time at which the CoM will contact the base of support boundary, akin to the “extrapolated CoM” described by Hof et al. (2005). TtC has been used to assess postural stability in quiet stance conditions involving relatively small CoM velocities and accelerations. Some calculate TtC as the distance to the base of support boundary divided by the velocity of the center of pressure (CoP) (Van Wegen et al. 2002; Hertel et al. 2006; Hertel and Olmsted-Kramer 2007) or CoM (Forth et al. 2007), while others also include CoP acceleration (Slobounov et al. 1997; Slobounov et al. 1998; Patton et al. 2000; Slobounov et al. 2006; Haibach et al. 2007). Comparison of these methods by Haddad et al. (2006) suggested that the addition of acceleration information might better represent static postural control. Of note is that the majority of these studies have used the TtC of the CoP rather than the CoM. In dynamic situations, in which there is a significant chance that the CoM will actually contact and go beyond the support boundary, TtC of the CoM may be a more informative measure because in practice the CoP can never reach the boundary. Moreover, unlike the CoM, the CoP is not a point associated with a specific mass and can therefore be moved instantaneously.
CoM TtC information could be important under dynamic postural conditions in helping to decide whether a step is needed to recover from a perturbation. Most studies evaluating stepping strategies use randomized platform (McIlroy and Maki 1996; Pai et al. 2000; Schulz et al. 2005) or waist-pull (Luchies et al. 1994; Pai et al. 1998; Mille et al. 2003) perturbations. Schulz et al. (2006) investigated the CoM TtC under such dynamic conditions, using the velocity-only TtC computation. Incorporation of acceleration information may allow earlier and more accurate assessment of perturbation severity, compared with velocity information alone. Further, sequentially increasing perturbation magnitudes might reveal different response patterns than randomized presentation, and test whether TtC operates as a control parameter as balance is gradually pushed towards and beyond the limit of dynamic stability. In that case, TtC should be closely associated with the scaling of postural responses and predictive of changes in postural states, such as the transition from a stationary base of support to a stepping strategy. Conceptually, this is similar to the abrupt transition from anti-phase to in-phase finger coordination that occurs when finger flexion/extension frequency (the control parameter) is gradually increased (Haken et al. 1985).
We hypothesized that boundary-relevant CoM TtC information would accurately predict the transition from a stationary base of support to a stepping strategy when sequentially increasing upper-body perturbations were applied to healthy young subjects. Further, we hypothesized that incorporation of CoM acceleration information in TtC computations would give more accurate predictions of the TtC values that would trigger stepping responses, and provide subjects with earlier warning of perturbation severity. TtC measures were compared with traditional measures of instability, including maximal CoM and CoP velocity and acceleration, and to variables arising from Hof et al.’s (2005) inverted pendulum model of dynamic stability.
2. Methods
2.1 Subjects
Ten healthy subjects (5 Male, 5 Female; 27±2.7 yrs; 71.0±14.3 kg; 1.72±0.10 m) without balance impairments participated in the experiment after completing an informed consent form approved by our Institutional Review Board.
2.2 Instrumentation
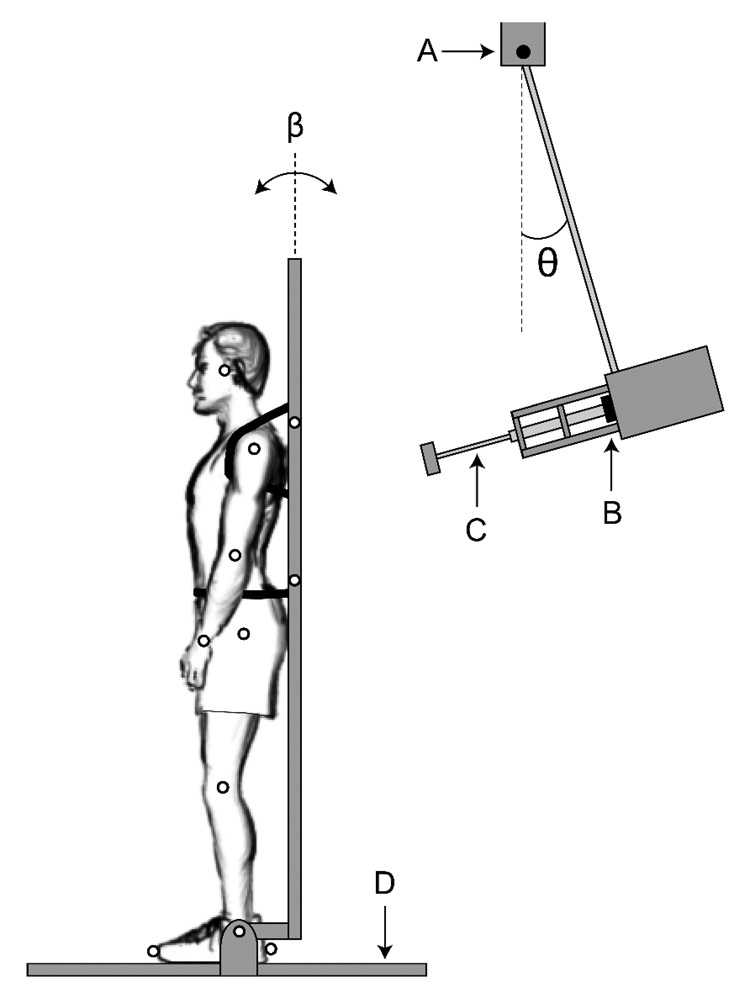
Forward sway was induced by bumping the subjects with a 15 kg pendulum (Figure 1). Pendulum angle was measured with a potentiometer (θ; Figure 1). A rope and pulley were used to position the pendulum at an initial angle displayed on an LCD. A lightweight wooden backboard with shoulder and waist straps constrained subject movement to the sagittal plane about the ankle joint, approximating an inverted pendulum (Peterka and Loughlin 2004). After release, the pendulum swung forward, striking the backboard at 78% of subjects’ standing height. Subjects listened to white noise through earphones to mask the sound of pendulum release. Perturbation force was measured with a uni-axial load cell (41/571-07, Honeywell International) in series with a shock absorber. Three-dimensional kinematics of passive reflective markers (Figure 1) were captured at 200 Hz (ProReflex MCU240, Qualysis). Ground reaction forces were measured with a force platform (BP6001200-2000, AMTI). Potentiometer and force data were sampled at 1000 Hz.
Figure 1.
Illustration of experimental setup showing backboard restraint and perturbation device (pendulum). Passive reflective marker locations are indicated by small open circles. Straps around the shoulders and waist were used to secure subjects to the backboard (shown) A: potentiometer; B: load cell; C: shock absorber; D: force platform; β: backboard angle; θ: pendulum angle. Angles are referenced to the vertical.
2.3 Protocol
Subjects’ upper bodies were strapped to the backboard, and their ankle joint axes were aligned with two support bearings. The feet were placed hip-width apart, parallel with the sagittal plane; arms were relaxed with hands clasped in front. Subjects were asked to fix their gaze on a mark on a wall at eye level 5 m away and to stand as still as possible. Subjects performed two 30 s quiet stance trials prior to the perturbation protocol. For each perturbation, the pendulum was held at a specified angle, a light signaled subjects to commence quiet stance, and after a random period of 2–6 s the pendulum was released to swing forward and strike the backboard. The pendulum was quickly withdrawn to prevent a second “rebound” perturbation. Subjects were told to resist the perturbation, resume quiet stance as quickly as possible, and only step if necessary to prevent a fall. The initial pendulum release angle was 10°, and was increased incrementally in subsequent trials by 5° (heavy subjects) or 2.5° (light subjects) until subjects stepped. Two sets of perturbations were performed; to minimize learning effects only the second set was analyzed.
2.4 Data Reduction
Quiet stance and perturbation data were filtered at 2 Hz and 10 Hz, respectively, using a low-pass fourth-order zero-lag Butterworth filter. Optimal filter cut-off frequencies were determined through power spectral analysis. Force and potentiometer data were downsampled to equal the kinematic data sampling rate (200 Hz), and the CoP was calculated from the ground reaction forces. Segment masses and CoM locations were estimated to determine the total body CoM position in the sagittal-plane (de Leva 1996). The anterior-posterior positions of the markers on the left toe and heel (Figure 1) were used to define the support boundaries; positional corrections were made to account for the radii of the markers. The initiation of the perturbation (marked by the abrupt rise in pendulum force) indicated time zero. To account for the differing inertias associated with varied subject masses, a postural “challenge” was computed by dividing the peak pendulum angular velocity at impact by the mass of each subject. For each subject the perturbation was applied at 78% of standing height, thereby controlling for effects of differing vertical CoM positions relative to the pendulum force application.
Based on Slobounov et al.’s (1997) formulation for calculating the TtC to a two-dimensional support boundary, which includes CoM acceleration information (TtCACC), the instantaneous CoM TtCACC for anterior-posterior motion towards the toe or heel boundary was calculated as
| (1) |
where p, v, and a are the anterior-posterior positions, velocities, and accelerations of the CoM, respectively, and pmax is the anterior-posterior location of the toe (or heel) markers. The smallest positive real solution (i.e. the TtC to the first boundary crossed; toe or heel) was taken as the instantaneous TtC. The CoM TtCVEL, which does not include acceleration (Riccio 1993), was calculated as
| (2) |
Using an inverted pendulum model, Hof et al. (2005) computed the extrapolated position of the center of mass in the direction of the CoM velocity (XCoM)
| (3) |
| (4) |
where ω0 is the angular eigenfrequency of a non-inverted pendulum, g is gravitational acceleration, and l is the pendulum length, computed as the distance from the lateral malleolus to the CoM. The spatial margin of stability (MoSXCoM) was then computed
| (5) |
From this, the TtC of the XCoM (TtCXCoM) was calculated
| (6) |
Note that TtCXCoM estimates the time it will take the extrapolated CoM (XCoM) to reach the support boundary if it continues with constant velocity, while TtCVEL estimates the time it will take the actual CoM to contact the boundary with constant velocity. Therefore, TtCXCoM will always be lower than TtCVEL.
For non-stepping trials the global minima of the MoSXCoM and each TtC time series were selected for further analysis. For stepping trials, TtC global minima would usually be zero due to boundary contact; therefore, the first local minimum after perturbation initiation was selected. The minimum MoSXCoM value was set to zero if it crossed the support boundary (i.e. became negative). TtC latency (time after perturbation at which TtC minima occur) and CoM position at minimum TtC were computed and averaged across postural challenge levels for each subject. Ranges (maximum-minimum) across challenge levels for TtC latency, CoM position, and CoM velocity at minimum TtC were also computed for each subject individually and then averaged across subjects.
2.5 Statistical Analysis
Backboard angle prior to perturbation was compared to quiet stance angle using a paired t-test, to determine if subjects adjusted their postural orientation in anticipation of the perturbations. Subject-specific linear and nonlinear equations were used to characterize the relationships between postural challenge and traditional (peak forward CoM and CoP velocity and acceleration) and boundary-relevant (TtCACC, TtCVEL, MoSXCoM, and TtCXCoM) measures of stability. Coefficients of determination (R2) were calculated to assess the strength of each relationship; paired t-tests were used to compare the R2 values between the TtCACC, TtCVEL, and TtCXCoM calculations. Linear correlations were performed between the experimental and predicted stepping minimum values for TtCACC, TtCVEL, and TtCXCoM. Paired t-tests were used to compare the absolute differences between the experimental and predicted stepping minimum TtC values, average TtC latencies, CoM position values and ranges, and CoM velocity ranges using each of the three TtC calculation methods. The criterion for significance was p < .05.
3. Results
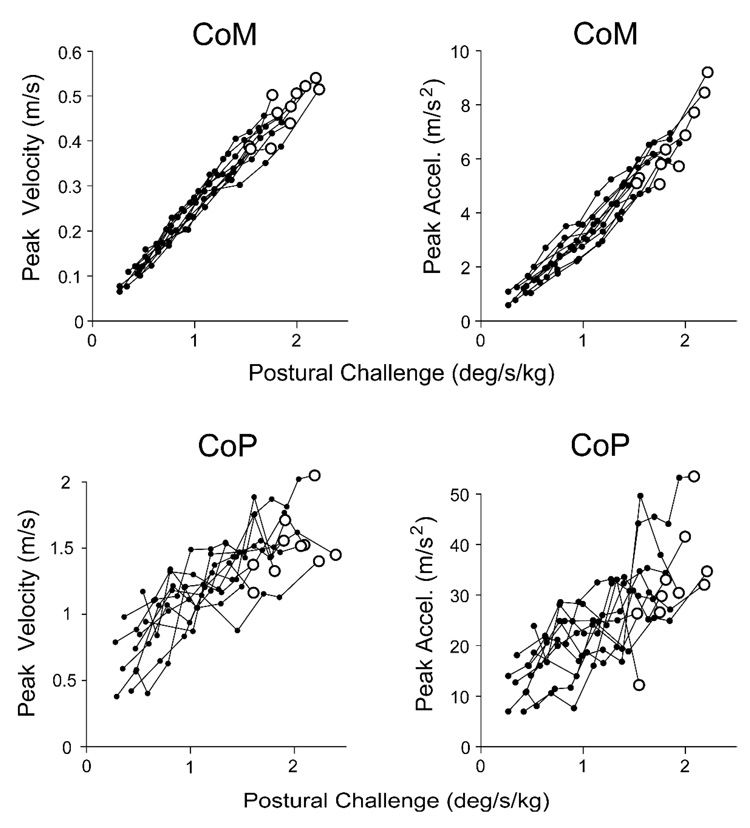
The mean backboard angle (β, Figure 1) was the same (p = .135) in quiet stance (0.45±0.87°; Mean ± Standard Deviation) as it was before the onset of perturbations (0.06±0.93°), indicating that subjects did not alter their postural orientation prior to pendulum impact. The relationships between postural challenge and peak forward CoM velocity and acceleration were well characterized by linear equations (R2 = 0.98±0.02 and R2 = 0.98±0.02, respectively; Figure 2). Linear relationships also represented peak forward CoP velocity and acceleration (Figure 2), but did not fit as well (R2 = 0.75±0.15, R2 = 0.68±0.21, respectively).
Figure 2.
Relationship between postural challenge and peak forward center of mass (CoM) velocity and acceleration (top), and peak forward center of pressure (CoP) velocity and acceleration (bottom). Each line represents data from one subject. Enlarged open circles represent stepping trials.
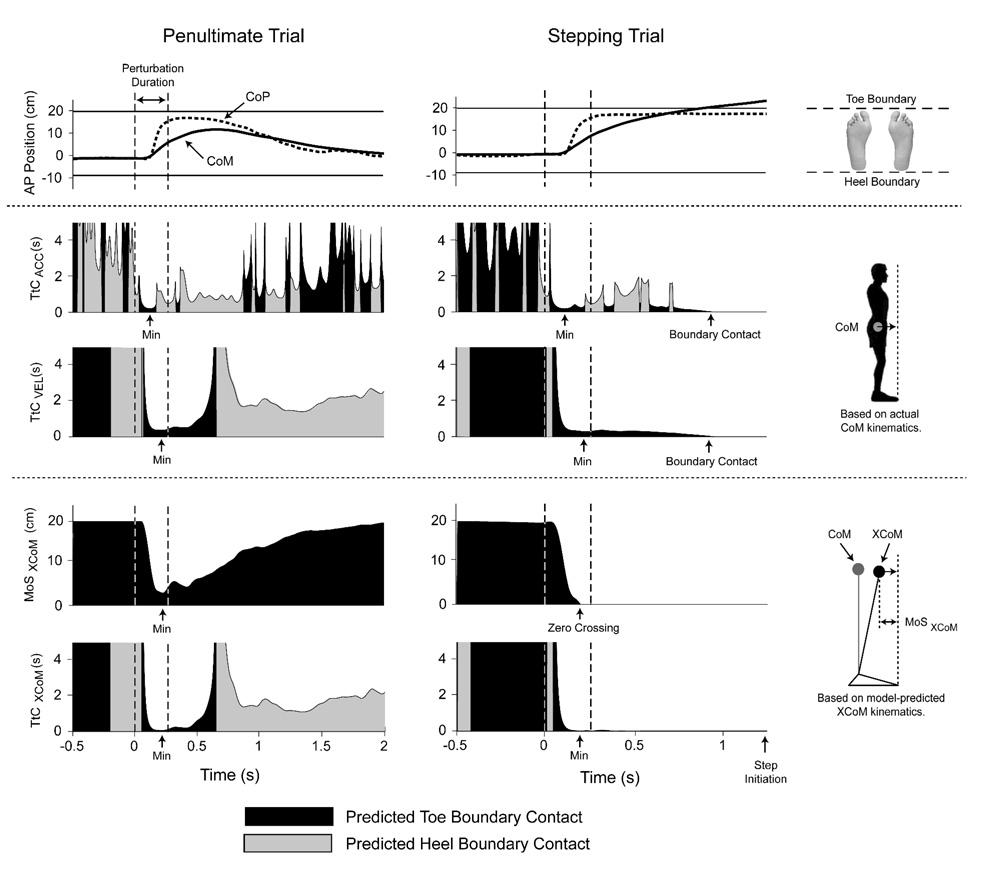
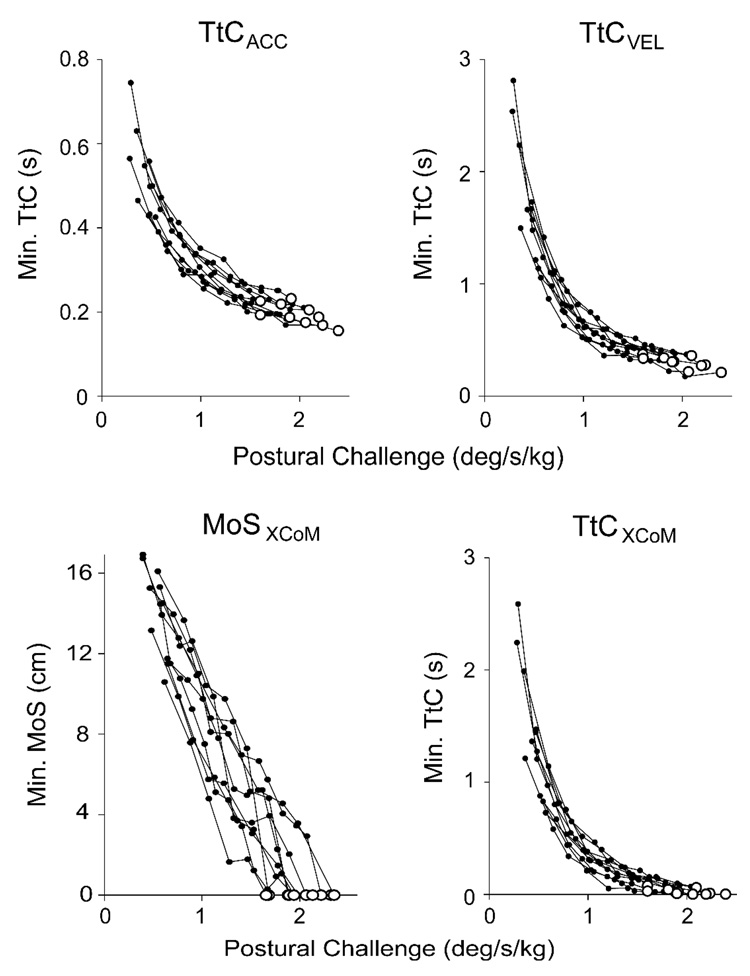
Typical CoM and CoP responses during the penultimate and stepping trials, and the selection of TtCACC, TtCVEL, MoSXCoM, and TtCXCoM minima are illustrated in Figure 3. For all subjects, the MoSXCoM demonstrated a strong inverse linear relationship with postural challenge level (R2 = 0.94±0.03; Figure 4). The MoSXCoM reached zero before the CoM contacted the support boundary for all subjects on the stepping trial, and reached zero during the penultimate trial for only one subject.
Figure 3.
Example of perturbation response for penultimate and stepping trials. Top graphs show center of mass (CoM) and center of pressure (CoP) kinematics, and toe and heel positions. Middle graphs show CoM time-to-contact (TtC) computed by including (TtCACC) and not including (TtCVEL) acceleration information. Bottom graphs show the margin of stability (MoSXCoM) and TtC (TtCXCoM) of the extrapolated center of mass (XCoM) based on an inverted pendulum model (Hof et al. 2005).
Figure 4.
Top: Minimum time-to-contact (TtC) based on the kinematics of the center of mass (CoM), computed with and without acceleration information (TtCACC and TtCVEL, respectively), as a function of postural challenge level for all subjects. Bottom: Minimum margin of stability (MoSXCoM) and TtC (TtCXCoM) of the extrapolated center of mass, which are based on an inverted pendulum model. Enlarged open circles indicate stepping trials. Note that TtCACC vertical scaling is different from TtCVEL and TtCXCoM.
In contrast to the linear MoSXCoM relation, the minimum TtCACC, TtCVEL, and TtCXCoM decreased nonlinearly with increasing postural challenge (Figure 4). Individual subject data were well fit by quadratic functions (TtCACC: R2 = 0.96±0.03, TtCVEL: R2 = 0.94±0.04, and TtCXCoM: R2 = 0.94±0.04). Although the quadratic relations were strong for all three calculation methods, statistically the R2 value for the TtCACC fit was higher than for either TtCVEL (p = .023) or TtCXCoM (p = .015).
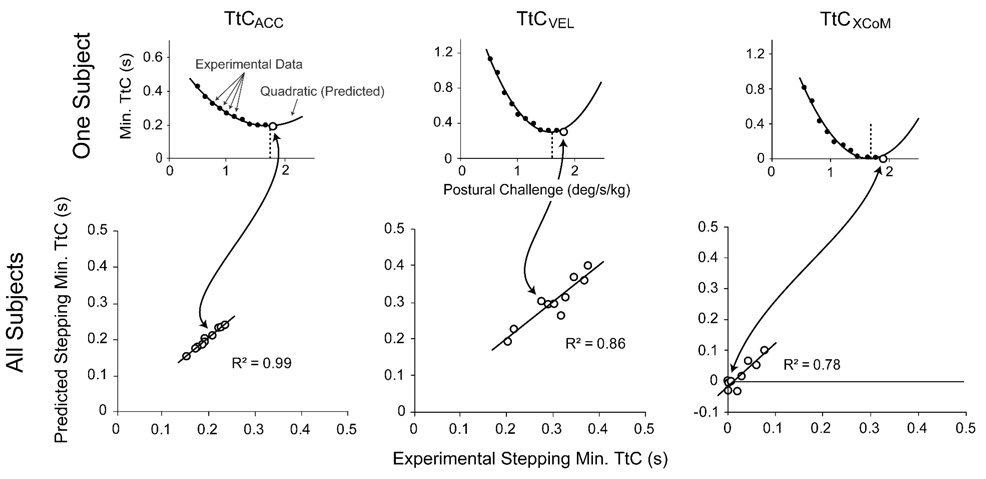
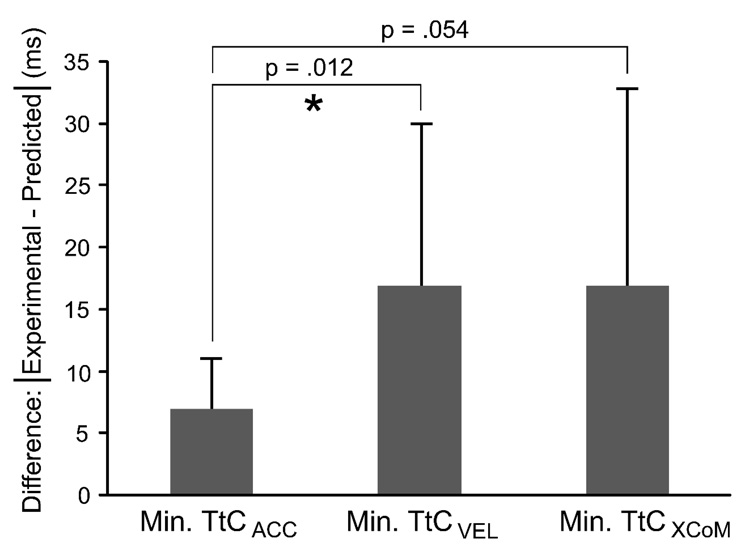
The vertex of each fitted quadratic function represents a prediction for the minimum TtC value that would elicit a stepping response (actual experimental stepping values: TtCACC = 195±27 ms; TtCVEL = 301±56 ms; TtCXCoM = 25±27 ms). Linear correlations between experimental and predicted stepping TtC values were strongest for TtCACC and weakest for TtCXCoM (Figure 5). The absolute difference between experimental and predicted stepping TtCACC values was lower than for TtCVEL values (Figure 6).
Figure 5.
Top Row: Experimental minimum time-to-contact (TtC) data and fitted quadratics for one subject when acceleration information is included (TtCACC, left), and not included (TtCVEL, middle). The TtC of a model extrapolated center of mass (XCoM) is also shown (TtCXCOM, right). Closed and open circles indicate non-stepping and stepping trials, respectively. Bottom Row: Linear correlations between the experimental and predicted (vertices of quadratic functions) minimum TtC values for stepping responses of all subjects using the different TtC calculation methods.
Figure 6.
Bar chart showing the means and standard deviations of the absolute differences between the experimental and predicted stepping TtC values for the different TtC calculation methods. Paired t-tests were performed to test for differences between calculation methods; prediction error for TtCACC was lower than for TtCVEL and TtCXCoM, but only the TtCACC vs. TtCVEL comparison met our significance criterion (*p < .05).
The post-perturbation latencies were shorter and the CoM was farther from the toes at minimum TtC for TtCACC than for TtCVEL and TtCXCoM (Table 1). There were no clear relationships between increasing postural challenge and computed TtC latencies or their associated CoM positions. Across challenge levels, the range of TtC latencies, CoM positions, and CoM velocities at minimum TtC was smaller using the TtCACC calculation, compared to TtCVEL and TtCXCoM (Table 1).
Table 1.
Temporal and spatial variables at minimum center of mass (CoM) time-to-contact (TtC) using three different calculation methods (Mean ± Between Subjects Standard Deviation).
| Variable | TtCACC | TtCVEL | TtCXCoM |
|---|---|---|---|
| Latency (ms)a | 79 ± 5*** | 180 ± 23 | 180 ± 24 |
| CoM Position (%)a,b | 16.1 ± 8.2*** | 30.8 ± 8.6 | 29.3 ± 7.7 |
| Latency Range (mm)c | 16 ± 6** | 67 ± 40 | 73 ± 49 |
| CoM Position Range (mm)c | 21 ± 7** | 74 ± 43 | 66 ± 29 |
| CoM Velocity Range (mm/s)c | 251 ± 45* | 324 ± 68 | 321 ± 75 |
Latency and CoM position data were first averaged across perturbations levels for each subject.
Expressed as a percentage of the distance from the ankle to the toe (0% = ankle; 100% = toe).
Range is first computed for each subject (maximum-minimum value occurring across perturbation levels).
TtCACC differs from TtCVEL and TtCXCoM at p < .05
p < .01
p < .001 in paired t-tests.
4. Discussion
Traditional postural control variables, including peak velocity and acceleration of the CoP and CoM, demonstrated linear increases with postural challenge. In contrast, minimum TtC measures were nonlinearly related to postural challenge, enabling prediction of stepping responses using quadratic equations, supporting our initial hypothesis. Such relationships were found when TtC was calculated with or without CoM acceleration information (TtCACC and TtCVEL, respectively), and were in agreement with a model-based TtC of the extrapolated CoM (TtCXCoM). The quadratic fits were more accurate and TtC minima occurred earlier with the inclusion of acceleration information, thus giving earlier warning of perturbation severity and supporting our second hypothesis.
It is unsurprising that the TtCACC relationship with postural challenge was well fit by a quadratic function, because of its computational formula. However, the TtCVEL and TtCXCoM relationships were also well fit by quadratics, even though they were calculated from linear formulae with no squared terms. The nonlinear nature of these two relations may be due to the statistical characteristics of CoM position and velocity at minimum TtC. Across challenge levels, the absolute range of CoM positions was much smaller than the range of CoM velocities at minimum TtC (averaging 21 mm vs. 251 mm/s for TtCACC, an order of magnitude difference, Table 1). In this case, dividing a narrowly changing position by a widely changing velocity produced ratios (i.e. TtC values) in a nonlinear pattern.
The average minimum TtCVEL computed for stepping trials was 301 ms, which is shorter than those predicted by Schultz et al. (2006) for young females subjected to anterior-posterior waist-pulls (~575 ms). Our computed TtCACC values were even shorter, averaging 195 ms. These discrepancies are due to our protocol and selection of minimum TtC. Our subjects were gradually pushed towards the limit of their stability, and the minimum TtC following a transient impact was selected. In contrast, Schulz et al. used a series of randomized, continuously applied perturbations, and selected TtC values to optimize the percentage of correct stepping/non-stepping predictions.
The average post-perturbation latency of minimum TtC occurrence for TtCVEL was 180 ms, meaning that information concerning the plausibility of arresting forward CoM motion without stepping was available to subjects very soon after (or during) the perturbation. Considering the substantial delay until the actual stepping response (> 1 s), one could argue the importance of such an early warning. This long “decision time” may be the result of the instructions to resist stepping, causing subjects to wait until the last possible moment to step. However, in more ecological situations, an early warning and early decision may be crucial. For example, complex terrain could impose a more lengthy preparation for the stepping response, and early warning would increase the probability of successful recovery.
The minimum TtCACC occurred at shorter latencies than minimum TtCVEL (79 vs. 180 ms), giving even earlier warning of perturbation severity. The minimum TtCACC always occurred during the initial CoM acceleration, before the subjects could respond with CoP adjustments. Consequently, the minimum TtCACC was largely independent of subject responses, based solely on the dynamics of the perturbation. Schultz et al. (2006) reported a lengthening of the minimum TtC with age and impairment. However, they used the TtCVEL calculation, for which minima occur later and thus may be influenced by the ability of the subjects to respond to the perturbation. One might expect that changes associated with aging or impairment would not have an effect on minimum TtCACC, because TtCACC is not affected by the capacity to respond to transient perturbations. Exceptions to this conjecture would include anticipatory postural adjustments, such as alterations in the amount of plantarflexor muscle activity prior to the perturbation, which could increase or decrease active musculotendinous stiffness at the time of perturbation onset.
The backboard constrained subjects to motion approximating an inverted pendulum and thus the use of an “ankle strategy”. This allows us to compare the TtCXCoM of the extrapolated CoM model (Hof et al. 2005) with the TtC from the experimental subject CoM trajectories (TtCACC and TtCVEL). Relationships between TtCXCoM and postural challenge were very similar in shape to those of TtCACC and TtCVEL (see Figure 4). Subjects should need to step if MoSXCoM reaches zero, which was true in almost all cases. There was only one instance in which MoSXCoM reached zero without a step, possibly due to small errors in CoM position estimation on the penultimate trial, when the CoM closely approaches the base of support boundary. Average TtC latencies and CoM positions at minimum TtC were not different between TtCVEL and TtCXCoM, supporting the inverted pendulum model. Differences between TtCACC and TtCXCoM calculations were expected due to the inclusion of acceleration information in TtCACC calculations.
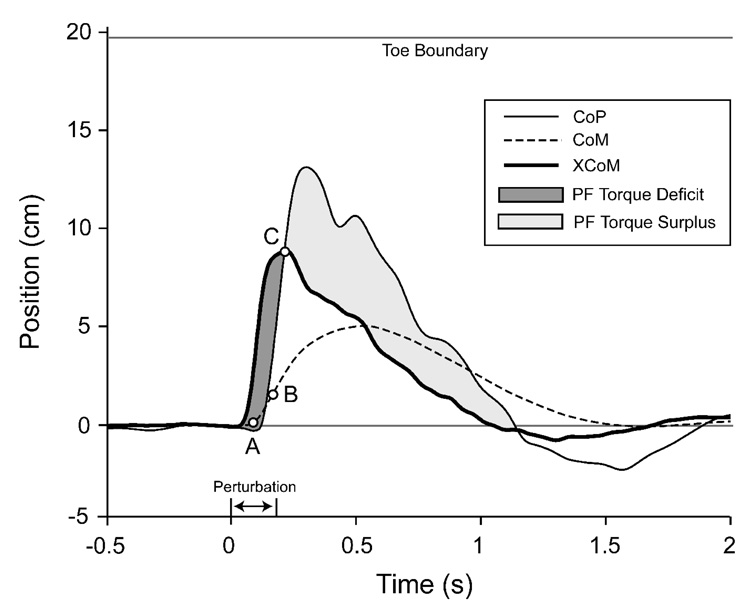
To aid in our comparison with the Hof et al. (2005) model, the CoP, CoM, and XCoM motions were plotted for a single, non-stepping trial (Figure 7). The model gives three possible states of dynamic posture, depending on relative XCoM and CoP positions. Initially, the perturbation induces potential instability, with the XCoM moving in front of the CoP. Without corrective action the CoM will eventually cross the support boundary. A “torque deficit” is apparent, as additional plantarflexor torque is needed to shift the CoP in front of the XCoM. When the CoP does move in front of the XCoM, a stable state is reached. As long as the CoP remains in front of the XCoM, the real CoM will be accelerated backward assuring stability (until the XCoM passes the ankle joint). In the stable state there is usually a “torque surplus”, with more plantarflexor torque than needed to arrest CoM motion before it reaches the base of support boundary (a “safety factor”). In stepping trials a third state occurs when the XCoM crosses the support boundary, with a loss of stability unless the base of support is changed.
Figure 7.
Time series data illustrating the responses of the center of mass (CoM; dashed line), center of pressure (CoP; thin black line), and extrapolated center of mass (XCoM; thick black line) during a non-stepping trial for one subject. The times at which the minimum time-to-contact (TtC) of the CoM occur (open circles) using different computation methods are shown: TtCACC (A), TtCVEL (B), and TtCXCoM (C). Regions of plantarflexor (PF) torque “deficit” and “surplus” are indicated by darker and light shading, respectively. Positions are given relative to the ankle joint center.
Finally, Tokuno et al. (2006) reported that perturbation responses were dependent on the direction and amplitude of “natural” body sway during quiet stance, with rearward platform translations evoking larger responses if the CoP was shifted forward at perturbation onset. Although the state of the postural system upon destabilization is certainly important, the position of the CoP (or CoM) at the onset of a perturbation alone is insufficient to predict the subsequent response. Our TtC results demonstrate the importance of CoM position, velocity, and acceleration with respect to the support boundary in assessing the magnitude of a postural threat. As shown in Figure 7, consideration of CoP position in conjunction with the extrapolated CoM (XCoM) can provide a continuous assessment of the “degree” of dynamic postural stability.
In summary, we found a quadratic relationship between the magnitude of upper body postural perturbations and the minimum CoM TtC; the vertex of the quadratic function predicted when subjects would transition from a stationary base of support to a stepping strategy. Predictions were more accurate and gave earlier warning of perturbation severity when CoM acceleration information was included, rather than with CoM velocity information alone. Our results agreed with TtC predictions based on an inverted pendulum model of postural control proposed by Hof et al. (2005), and suggest that the postural system could use TtC as a control parameter in evaluating perturbation severity and deciding whether to initiate a stepping response.
Acknowledgements
The authors would like to thank Catherine Gariépy for assistance with data collection and reduction, and William McDermott, Jeff Gagnon, and Saunders Whittlesey for helpful discussions. This research was supported by a Ruth L. Kirschstein National Research Service Award (CJH; National Institutes of Health [NIBIB]; 1F31EB005073), and National Institutes of Health [NIA] grant R03AG026281 (GEC).
Footnotes
Publisher's Disclaimer: This is a PDF file of an unedited manuscript that has been accepted for publication. As a service to our customers we are providing this early version of the manuscript. The manuscript will undergo copyediting, typesetting, and review of the resulting proof before it is published in its final citable form. Please note that during the production process errors may be discovered which could affect the content, and all legal disclaimers that apply to the journal pertain.
Time-to-contact has also been referred to as time-to-boundary (e.g. Van Wegen et al. 2002; Hertel et al. 2006) and (virtual) time-to-collision (e.g. Lee 1976; Slobounov et al. 1997).
References
- Carello C, Turvey MT, Kugler PN. The informational support for the upright stance. Behavioral and Brain Sciences. 1985;8:151–152. [Google Scholar]
- de Leva P. Adjustments to Zatsiorsky-Seluyanov's segment inertia parameters. Journal of Biomechanics. 1996;29:1223–1230. doi: 10.1016/0021-9290(95)00178-6. [DOI] [PubMed] [Google Scholar]
- Forth KE, Metter EJ, Paloski WH. Age associated differences in postural equilibrium control: a comparison between EQscore and minimum time to contact (TTCmin) Gait & Posture. 2007;25:56–62. doi: 10.1016/j.gaitpost.2005.12.008. [DOI] [PubMed] [Google Scholar]
- Haddad JM, Gagnon JL, Hasson CJ, Van Emmerik REA, Hamill J. Evaluation of time-to-contact measures for assessing postural stability. Journal of Applied Biomechanics. 2006;22:155–161. doi: 10.1123/jab.22.2.155. [DOI] [PubMed] [Google Scholar]
- Haibach PS, Slobounov SM, Slobounova ES, Newell KM. Virtual time-to-contact of postural stability boundaries as a function of support surface compliance. Experimental Brain Research. 2007;177:471–482. doi: 10.1007/s00221-006-0703-4. [DOI] [PubMed] [Google Scholar]
- Haken A, Kelso JAS, Bunz H. A theoretical model of phase transitions in human hand movements. Biological Cybernetics. 1985;51:347–356. doi: 10.1007/BF00336922. [DOI] [PubMed] [Google Scholar]
- Hertel J, Olmsted-Kramer LC. Deficits in time-to-boundary measures of postural control with chronic ankle instability. Gait & Posture. 2007;25:33–39. doi: 10.1016/j.gaitpost.2005.12.009. [DOI] [PubMed] [Google Scholar]
- Hertel J, Olmsted-Kramer LC, Challis JH. Time-to-boundary measures of postural control during single leg quiet standing. Journal of Applied Biomechanics. 2006;22:67–73. doi: 10.1123/jab.22.1.67. [DOI] [PubMed] [Google Scholar]
- Hof AL, Gazendam MGJ, Sinke WE. The condition for dynamic stability. Journal of Biomechanics. 2005;38:1–8. doi: 10.1016/j.jbiomech.2004.03.025. [DOI] [PubMed] [Google Scholar]
- Lee DN. A theory of visual control of braking based on information about time-to-collision. Perception. 1976;5:437–459. doi: 10.1068/p050437. [DOI] [PubMed] [Google Scholar]
- Luchies CW, Alexander NB, Schultz AB, Ashton-Miller J. Stepping responses of young and old adults to postural disturbances: kinematics. Journal of the American Geriatrics Society. 1994;42:506–512. doi: 10.1111/j.1532-5415.1994.tb04972.x. [DOI] [PubMed] [Google Scholar]
- McIlroy WE, Maki BE. Age-related changes in compensatory stepping in response to unpredictable perturbations. Journals of Gerontology Series A: Biological Sciences and Medical Sciences. 1996;51:M289–M296. doi: 10.1093/gerona/51a.6.m289. [DOI] [PubMed] [Google Scholar]
- Mille ML, Rogers MW, Martinez K, Hedman LD, Johnson ME, Lord SR, Fitzpatrick RC. Thresholds for inducing protective stepping responses to external perturbations of human standing. Journal of Neurophysiology. 2003;90:666–674. doi: 10.1152/jn.00974.2002. [DOI] [PubMed] [Google Scholar]
- Pai Y-C, Maki BE, Iqbal K, McIlroy WE, Perry SD. Thresholds for step initiation induced by support-surface translation: a dynamic center-of-mass model provides much better prediction than a static model. Journal of Biomechanics. 2000;33:387–392. doi: 10.1016/s0021-9290(99)00199-2. [DOI] [PubMed] [Google Scholar]
- Pai Y-C, Rogers MW, Patton J, Cain TD, Hanke TA. Static versus dynamic predictions of protective stepping following waist-pull perturbations in young and older adults. Journal of Biomechanics. 1998;31:1111–1118. doi: 10.1016/s0021-9290(98)00124-9. [DOI] [PubMed] [Google Scholar]
- Patton JL, Lee WA, Pai Y-C. Relative stability improves with experience in a dynamic standing task. Experimental Brain Research. 2000;135:117–126. doi: 10.1007/s002210000500. [DOI] [PubMed] [Google Scholar]
- Peterka RJ, Loughlin PJ. Dynamic regulation of sensorimotor integration in human postural control. Journal of Neurophysiology. 2004;91:410–423. doi: 10.1152/jn.00516.2003. [DOI] [PubMed] [Google Scholar]
- Riccio GE. Newell KM, Corcos DM. Variability and Motor Control. Champaign, IL: Human Kinetics; 1993. Information in movement variability about the qualitative dynamics of posture and orientation; pp. 317–358. [Google Scholar]
- Schulz BW, Ashton-Miller JA, Alexander NB. Compensatory stepping in response to waist pulls in balance-impaired and unimpaired women. Gait & Posture. 2005;22:198–209. doi: 10.1016/j.gaitpost.2004.09.004. [DOI] [PubMed] [Google Scholar]
- Schulz BW, Ashton-Miller JA, Alexander NB. Can initial and additional compensatory steps be predicted in young, older, and balance-impaired older females in response to anterior and posterior waist pulls while standing? Journal of Biomechanics. 2006;39:1444–1453. doi: 10.1016/j.jbiomech.2005.04.004. [DOI] [PubMed] [Google Scholar]
- Slobounov SM, Haibach PS, Newell KM. Aging-related temporal constraints to stability and instability in postural control. European Review of Aging and Physical Activity. 2006;3:55–62. [Google Scholar]
- Slobounov SM, Moss SA, Slobounova ES, Newell KM. Aging and time to instability in posture. Journals of Gerontology Series A: Biological Sciences and Medical Sciences. 1998;53:B71–B78. doi: 10.1093/gerona/53a.1.b71. [DOI] [PubMed] [Google Scholar]
- Slobounov SM, Slobounova ES, Newell KM. Virtual time-to-collision and human postural control. Journal of Motor Behavior. 1997;29:263–281. doi: 10.1080/00222899709600841. [DOI] [PubMed] [Google Scholar]
- Tokuno CD, Carpenter MG, Thorstensson A, Cresswell AG. The influence of natural body sway on neuromuscular responses to an unpredictable surface translation. Experimental Brain Research. 2006;174:19–28. doi: 10.1007/s00221-006-0414-x. [DOI] [PubMed] [Google Scholar]
- Van Wegen EEH, Van Emmerik REA, Riccio GE. Postural orientation: age-related changes in variability and time-to-boundary. Human Movement Science. 2002;21:61–84. doi: 10.1016/s0167-9457(02)00077-5. [DOI] [PubMed] [Google Scholar]
- Von Holst E, Mittelstaedt H. Das Reafferenzprinzip (Wechselwirkungen zwischen Zentralnervensystem und Peripherie) Die Naturwissenschaften. 1950;37:464–476. [Google Scholar]


