Abstract
The Orientation Distribution Function (ODF) is used to describe the directionality of multimodal diffusion in regions with complex fiber architecture present in brain and other biological tissues. In this paper, an approximation for the ODF of water diffusion from diffusional kurtosis imaging (DKI) is presented. DKI requires only a relatively limited number of diffusion measurements and, for the brain, b values no higher than 2500 s/mm2. The DKI-based ODF approximation is decomposed into two components representing the Gaussian and non-Gaussian (NG) diffusion contributions, respectively. Simulations of multiple fiber configurations show that both the total and the NG-ODF are able to resolve the orientations of the component fibers, with the NG-ODF being the most sensitive to profiling the fibers’ directions. Orientation maps obtained for in-vivo brain imaging data demonstrate multiple fiber components in brain regions with complex anatomy. The results appear to be in agreement with known white matter architecture.
Keywords: diffusion, kurtosis, fiber crossing, orientation distribution function
INTRODUCTION
Diffusion anisotropy of water in biological tissues is conventionally quantified with the diffusion tensor (DT) and related indices such as the fractional anisotropy (1, 2). DT describes the diffusion displacement probability using a Gaussian distribution function. One of the main applications of the DT is tracing the white matter pathways in the brain using local estimates of the fiber orientations. However, in regions with complex fiber configurations the diffusion tensor fails to describe the full directional information of the diffusion process (3). Most notably, the diffusion tensor is not able to resolve fiber crossing, which occurs in many brain regions. A more complete depiction of the water diffusion displacement is given by the probability density function (PDF). PDF can be approximated using q-space imaging techniques (4), but these techniques require diffusion measurements for a large range of diffusion weightings and diffusion directions. To overcome these limitations, Tuch and co-workers have introduced an orientation distribution function (ODF) for the diffusion displacement probability distribution (5, 6). A clear advantage of the ODF is that it can resolve fiber crossings in a model independent manner.
Several approaches have been proposed to date to estimate the ODF. One such approach is the q-ball imaging (QBI), which is based on a Funk transform of high angular resolution diffusion imaging (HARDI) data (5-10). The QBI approach was extended to explore the advantages of spherical harmonic basis functions (9, 10) and multiple wavevector fusion (11). For brain imaging, each of these techniques has several limitations including the need for high b values (i.e., 3000 s/mm2 or above) and a large number of encoding directions or the assumption of specific diffusion properties for the investigated fiber populations.
The diffusional kurtosis is a quantitative measure of the degree to which the diffusion displacement probability distribution deviates from a Gaussian form, and an MRI technique, diffusional kurtosis imaging (DKI), for efficiently measuring this quantity has recently been described (12,13). In this paper we describe an alternative method of calculating the ODF based on the diffusional kurtosis (DK) approximation of the diffusion signal. We establish the mathematical relationship between the ODF and the DK and demonstrate the ability of the DK-ODF to resolve fiber crossings by using simulations. In addition, we illustrate the application of the DK-ODF to brain by providing examples of DK-ODFs calculated from human imaging data.
THEORY
Diffusional Kurtosis approximation of the Orientation Distribution Function (DK-ODF)
Diffusional kurtosis imaging extends the Gaussian approximation of the diffusion distribution function by considering non-Gaussian contributions through an additional kurtosis term (12). For a direction specified by the unit vector , the diffusion signal can be written as:
| [1] |
where Dij are the elements of the second order diffusion tensor D and Wijkl the elements of the forth order kurtosis tensor W. represents the mean diffusivity . The apparent diffusion and kurtosis coefficients along the direction are related to the respective tensors by the following equations:
| [2a] |
| [2b] |
Both Dij and Wijkl are symmetric with respect to an interchange of indices; consequently, D has 6 independent degrees of freedom, while W has 15 independent degrees of freedom. Eq. [1] can be rewritten in terms of and as:
| [3] |
If P(s, t) represents the water diffusion displacement probability distribution for a displacement s and a diffusion time t, the ODF is defined as its radial projection (5, 6):
| [4] |
where Z is a normalization constant. The central result of this paper is the DK-ODF approximation (see the Appendix for the derivation):
| [5] |
with δ indicating the Dirac delta function. Because of the delta functions, the integral in Eq. [5] is effectively one-dimensional and corresponds to a Funk transform, which reduces the calculation of the ODF value along a direction to an integration of the signal values on the perpendicularly oriented great circle. When coincides with a coordinate axis , Eq. [5] takes the form:
| [6] |
where θ is the polar angle and ϕ is the azimuthal angle with respect to . Thus, an approximation for the ODF in a particular direction can be obtained by integrating a function depending on the diffusion and kurtosis coefficients over the perpendicularly oriented great circle. As we shall show, this DK-ODF is capable of resolving fiber crossings. Since a standard DKI data set (12) yields estimates for both the diffusion tensor and the kurtosis tensor, one can use Eq. [6] to also calculate an approximate ODF. D(θ,ϕ) and K(θ,ϕ) under the integrand can be approximated at any location on the great circle from the diffusion and kurtosis tensors using Eq 2a and 2b.
Note that in the DK approximation (Eq. [6]) the ODF is represented as a sum of two terms:
| [7] |
where the first term corresponds to the Gaussian diffusion contributions and the second to the non-Gaussian ones. We will further refer to the two terms as the Gaussian and non-Gaussian (NG) DK estimated ODFs. The total ODF can then be written as:
| [8] |
ODF for the Gaussian Diffusion Approximation
For Gaussian diffusion, the displacement probability distribution has the form:
| [9] |
For this special case, one may readily verify that K = 0 and that:
| [10] |
A principal disadvantage of the DT-ODF is that it does not allow fiber crossings to be resolved. More generally, one can regard ψDT as a “diffusion tensor approximation” for the ODF. Equation [10] can be used to fix the normalizations of the ODF approximations by setting:
| [11] |
so that the ODF is dimensionless and equal to unity for isotropic Gaussian diffusion.
METHODS
Simulations
To test the DK-ODF, we utilized a multi-compartment model with the displacement probability distributions of the form:
| [12] |
where N is the number of compartments, D(m) the diffusion tensor for the mth compartment, and fm its corresponding water fraction with the water fractions fm adding to unity .
It can be shown that the exact ODF for this model is given by:
| [13] |
The diffusion and kurtosis tensors can be obtained as combinations of the diffusion tensors describing the individual compartments:
| [14] |
| [15] |
The ODF-DK can be estimated using Eq. [7], where and values can be obtained from the diffusion and kurtosis tensor, respectively.
We considered mixed fiber models having two to four compartments. For all the models, the eigenvalues of D(m) were chosen to be 0.3, 0.3, and 1.8 μm2/ms, so that the diffusion within each compartment was highly anisotropic (fractional anisotropy = 0.81). Mixtures with different weights were investigated. For each model, we calculated and displayed the exact and DK and QB estimated ODFs, as well as the exact and DK estimated non-Gaussian ODFs (NG-ODF). A b value of 4000s/mm2 was assumed for calculating the QB-ODF, since this is a typical value employed in prior studies (5-7). For comparison purposes, the Gaussian (DT) ODF was also calculated for each model.
MRI experiment
Imaging experiments were conducted on a 3 T Trio MR system (Siemens Medical Solutions, Erlangen, Germany) using a body coil for transmission and an eight-element phase array coil for reception. DKI data were obtained for six healthy volunteers using a protocol approved by the Institutional Review Board at the New York University School of Medicine. Informed written consent was obtained from all participants prior to the imaging sessions. Diffusion weighted images were acquired for 30 uniformly distributed gradient directions and for five b values (500, 1000, 1500, 2000 and 2500 s/mm2) using a twice refocused-spin-echo EPI sequence, which has been shown to significantly reduce the eddy-current-related distortions in the diffusion weighted images (14). In addition, data without any diffusion weighting (b=0 s/mm) were obtained. Other imaging parameters included: TR=2000 ms, TE=109ms, FOV=256×256mm2, matrix=128×128, a parallel imaging (GRAPPA (15)) factor of 2, number of images averaged (NEX)=2, 6/8 partial Fourier in phase-encoding direction, 15 axial slices, with a slice thickness of 2 (acquisition 1) or 4 mm (acquisition 2) and gap of 2 mm. The total duration for acquiring a DKI data set was 12 minutes.
Image data processing
The diffusion weighted images were first corrected for motion and spatially smoothed using a two-dimensional Gaussian filter with FWHM of 2.5 mm in SPM (University College London, UK). The diffusion and kurtosis tensors were subsequently calculated similar to (13) using in-house developed software written in IDL. Only those data points that exceeded the value representing the 90th percentile of the noise range were included in the calculation, where noise values were sampled using a 10×10×13 volume situated outside the brain. The tensor calculation included: 1) estimation of the apparent diffusivity and kurtosis values along each of the thirty encoding directions using Levenberg-Marquardt nonlinear fitting algorithm for Eq. [3], 2) diffusion tensor estimation from the set of apparent diffusivities, 3) kurtosis tensor estimation (Eq. [2b]) using the apparent kurtosis values estimated at step (1) and the set of corrected apparent diffusion values obtained using the diffusion tensor estimated at step (2).
The diffusion tensor eigenvectors and eigenvalues, and the fractional anisotropy were calculated and used to obtain directional color maps and to depict the fiber direction estimates using a Gaussian approximation. The color maps were used for anatomical reference.
The non-Gaussian (NG), Gaussian, and total ODFs were calculated at each voxel using Eq. [7] on a grid of 60 × 60 data points (corresponding to equally spaced θ and ϕ values). For each grid point, the ODF value was estimated by integrating along the equator circle perpendicular to the grid point direction; the and values in the integrand were obtained from the diffusion and kurtosis tensors, respectively. In order to better distinguish visually the directional variations in the ODF profile, we also calculated a 0 to 1 rescaled min-max version of the non-Gaussian ODF (i.e., the minimum ODF value is scaled to 0 and the maximum ODF value is scaled to 1, as previously described in (6)). The fiber directions at each voxel were determined from the ODF peaks. The ODF surfaces were superimposed onto mean kurtosis maps (12) and were color-coded using the typical mapping of the x, y, and z spatial directions to the red, green, and blue color triad.
RESULTS
Simulations
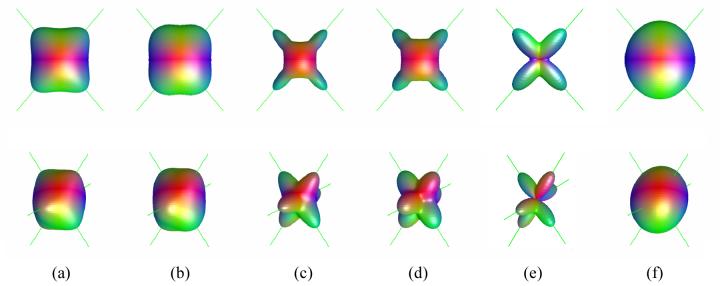
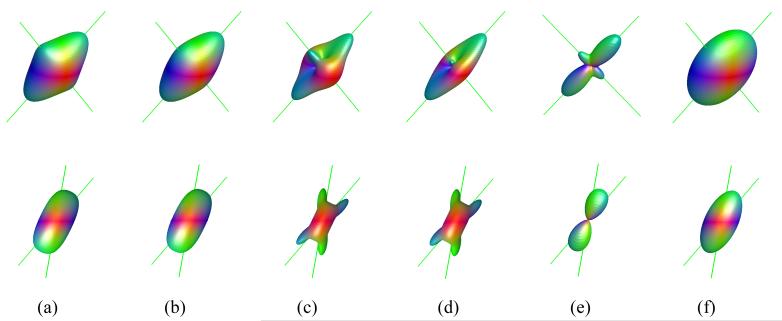
Figure 1 shows the three-dimensional ODF surfaces for models including two and three equally contributing fibers (i.e., fm = 1/ N) intersecting at high angle (>80°). An excellent correspondence is apparent between the direction of the fibers (indicated by green lines) and the ODF peaks for both the DK and QB approximations, with no offset between the true and the estimated directions. The NG-ODF appears to give a good peak delineation. Individual fibers are also resolved in cases where one compartment has a greater contribution than the other one (Figure 2a). A good approximation of the component fiber orientations is observed for small angle of intersection (Figure 2b, angle of intersection = 30°) for the NG-ODF, though the ODF peaks were offset with respect to the chosen fiber direction by approximately 8°. The two fiber components are no longer apparent with the QB-ODF approximation (Figure 2e). Our simulations show that using the NG-ODF, distinct peaks are apparent for two fiber crossing at angles as small as 2° - however the offset to the true orientation in this case reached 18°. The offset decreases as the angle of separation increases (e.g., ∼6° for a separation of 40° - results not shown). As the number of fiber directions increases, the DK-ODF approximation appears to resolve orthogonal or close to orthogonal fiber configurations (Figure 1b), but fibers crossing at small angles are not always resolved (results not shown). Note that offsets of the ODF peaks with respect to the component fiber directions are also apparent at small intersection angles for the exact ODF.
Figure 1.
Three dimensional surfaces of the exact and estimated ODFs for diffusion models with two (top) and three (bottom) equally contributing intersecting fibers. (a) exact ODF, (b) DK estimation of the ODF, (c) exact NG-ODF, (d) DK estimation of the NG-ODF, (e) q-ball estimation of the ODF (min-max scaled) for a b value of 4000 s/mm2, and (f) Gaussian estimation of the ODF. The directions of the component fibers are shown by green lines. The fiber orientations are (θ1, ϕ1) = (50°, 90°) and (θ2, ϕ2) = (130°, 90°) for N=2 and (θ1, ϕ1) = (60°, 90°), (θ2, ϕ2) = (120°, 40°), (θ3, ϕ3) = (120°, 130°) for N=3.
Figure 2.
Three dimensional surfaces of the exact and estimated ODF for diffusion models with two fibers with volume fractions of 30% and 70% (top) and two equally contributing fibers intersecting at an angle of 30° (bottom). (a) exact ODF, (b) DK estimation of the ODF, (c) exact NG-ODF, (d) DK estimation of the NG-ODF, (e) q-ball estimation of the ODF (min-max scaled) for a b value of 4000 s/mm2, and (f) Gaussian estimation of the ODF. The directions of the component fibers are shown by green lines. The fiber orientations in (a) are the same as in Figure 1a. The fiber orientations in (b) are: (θ1, ϕ1) = (50°, 90°) and (θ2, ϕ2) = (80°, 90°).
Brain Imaging Experiments
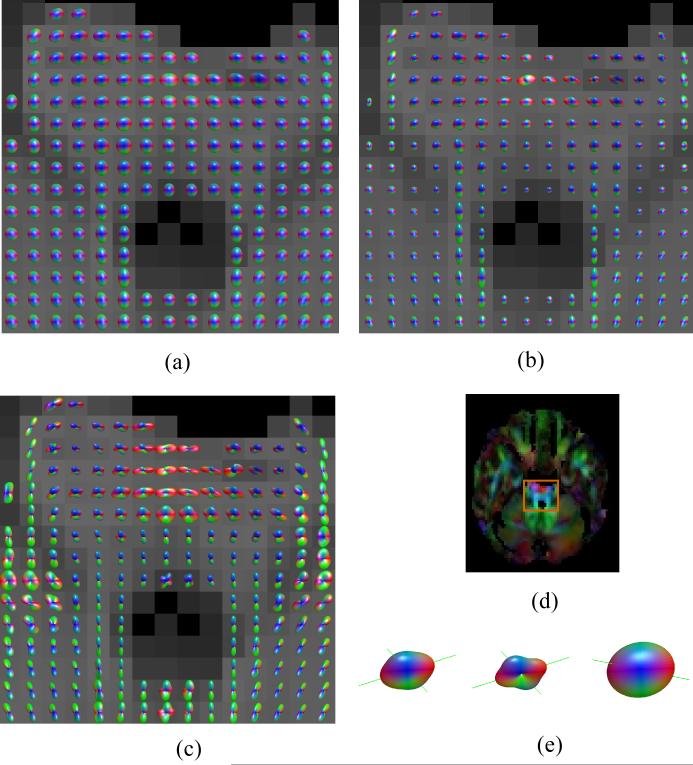
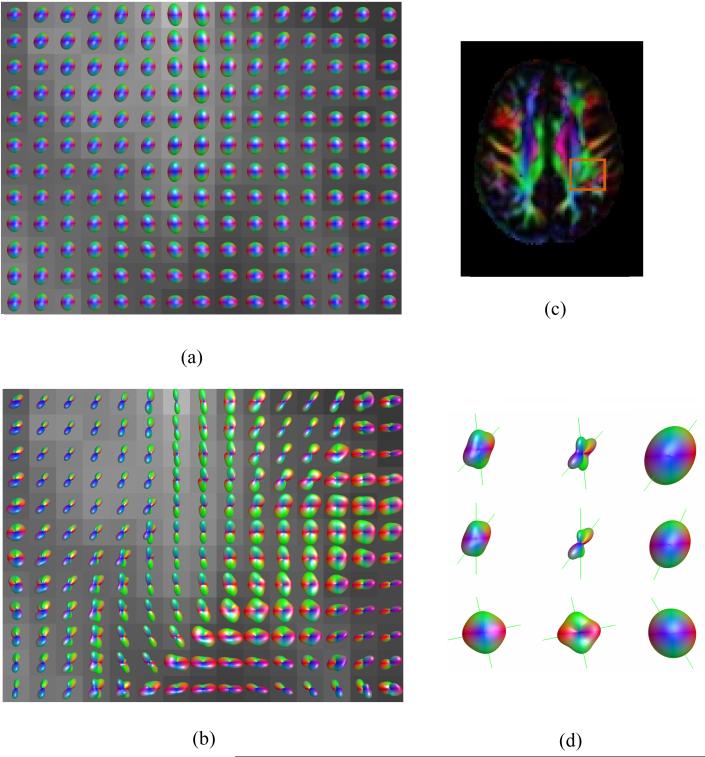
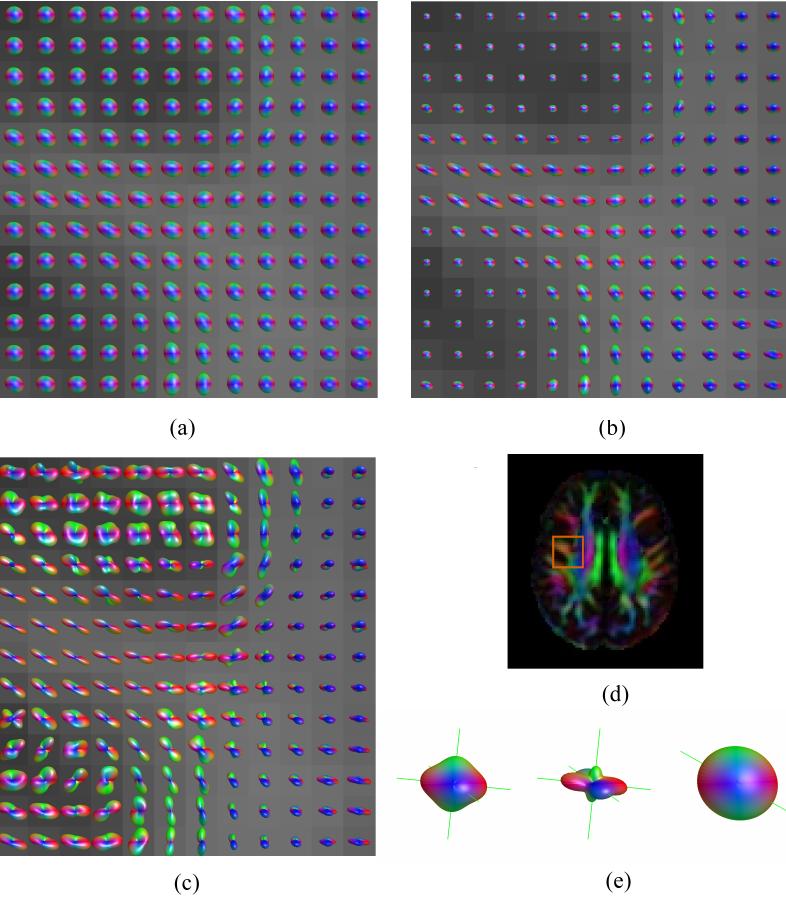
The DK approximation was used to derive ODF maps of the in vivo brain imaging data. Similar results were obtained for all subjects. Figs. 3-5 show the absolute and min-max normalized DK-derived NG-ODF maps and the corresponding DT-ODF maps for several brain regions where complex fiber architecture is present. Voxels with multiple fiber components can be distinguished on the DK-ODF maps. In general, the min-max normalization improves the visualization of the ODF peaks. The fiber orientations resolved using the DK approximation appear to be consistent with known anatomy. As expected, the complex fiber architecture is not apparent on the DT-ODF maps.
Figure 3.
ODF maps of the brainstem showing the intersection between the pyramidal tracts and the transverse pontine fibers for acquisition 2: (a) DT approximation, (b) DK-derived NG-ODF, and (c) Min-max scaled version of (b). The DT derived color map of the same axial slice and the location of the ODF maps are shown in (d). Fiber directions obtained using the DK (left - unscaled ODF and center - min-max scaled ODF) and DT (right) approximations for one voxel with apparent partial volume averaging of two fiber populations are shown in (e).
Figure 5.
ODF maps of the intersection between the posterior region of the superior longitudinal fasciculus with the projection fibers of the corona radiata and the posterior transverse association fibers for acquisition 2: (a) DT approximation, (b) DK-derived NG-ODF (min-max scaled). The DT-derived color map (c) shows the position of the magnified views with respect to other brain structures. Fiber directions obtained using the DK (left -unscaled ODF and center - min-max scaled ODF) and DT (right) approximations are shown for several voxels in (d).
Fig. 3 shows the ODF map of an axial slice situated at the cerebral pons level. This region contains several fiber populations including the superiorly - inferiorly oriented pyramidal and central tegmental tracts and the transverse pontine fibers that are running from left to right. Two fiber directions (transverse and superior-inferior) are apparent in regions with mixed fiber populations (Figs. 3b and c); these fiber directions appear to be in agreement with known anatomy. The DT approximation does not only fail to resolve the two fiber populations in voxels affected by partial volume averaging, but appears to fail to describe either orientation correctly (e.g., Fig 3e).
Fig. 4 shows the intersection of the superior longitudinal fasciculus (SLF), corona radiata, and corpus callosum in the centrum semiovale region. Regions with two and three fiber populations are apparent on the DK-ODF map. Note that whereas on the DK-ODF map the SLF appears to run continuously in the anterior-posterior direction, it appears interrupted on the color map which was obtained using the DT-ODF approximation.
Figure 4.
ODF maps of the intersection between the superior longitudinal fasciculus, corona radiata, and corpus callosum for acquisition 2: (a) DT approximation, (b) DK-derived NG-ODF, and (c) Min-max scaled version of (b). The color map (d) shows the position of the ODF maps with respect to other brain structures. ODFs and corresponding fiber directions for a voxel where three distinct fiber populations are apparent using the DK approximation are magnified in (e).
Voxels with two-fiber populations are also apparent in the DK-ODF maps illustrating regions where the posterior SLF interfaces with either corona radiata or transverse association fibers running from left to right (Fig. 5). The ODF changes in shape and orientation as it represents either mixtures of fibers running anteriorly-posteriorly and vertically oblique or mixtures of fibers oriented anteriorly-posteriorly and from right to left (Figs. 5b and 5d).
DISCUSSION
In this paper, we have introduced a new ODF reconstruction scheme based on the DK approximation of the diffusion signal.
The fiber crossing simulation results support the ability of the DK-ODF approximation to resolve multiple volume averaged fibers. The technique is able to estimate the directionality for mixtures of two and three intersecting fibers. Note that the offset between the true and the estimated fiber directions that is observed for fibers intersecting at small angle is characteristic to other HARDI techniques as well (16) and is inherent to the ODF model. Zhan and Yang (16) suggest that this offset is due to adherence between the closely situated peaks on the ODF.
The simulations included here use analytical representations of the diffusion probability distribution function and the ODFs and do not model the influence of the imaging acquisition scheme and signal-to-noise ratio. Future studies will assess the effect of these factors on the accuracy of the DK-ODF reconstruction.
The DK-ODF maps of the brain anatomy appear to be in agreement with the current knowledge of white matter fiber architecture. Configurations with both two and three crossing fibers as well as unidirectional voxels are all apparent on the ODF maps. It is important to note the disparity that occurs in certain voxels (e.g., Figs. 3e, 4e, and 5d) between the DT directionality estimation and any of the DK-ODF estimated directions. The DT misestimation is likely to affect the results of DT-based fiber tractography techniques. Future studies will evaluate the impact of the DK-ODF fiber estimation on white matter connectivity patterns obtained using fiber tractography techniques.
One of the advantages of DKI is that it only uses low b values (b < 2500 s/mm2). This results in diffusion-weighted images with relatively higher signal to noise ratio compared to the signal-to-noise ratio of images used by other ODF techniques. Moreover, the DK approximation includes only the lower moments of the water diffusion distribution (up to the forth order), thus retaining only the low frequency components of the ODF spherical harmonic spectrum. Additional smoothing might be also introduced by the linearization of the signal in the kurtosis coefficient, K, that is used to derive the ODF approximation (Eq. [A4] in the Appendix) and by using the diffusion and kurtosis tensors to estimate the diffusion and kurtosis coefficients used in the Funk-Radon transform (Eq. [7]). Consequently, the reconstructed ODFs are inherently smooth and do not require further regularization (e.g., spherical convolution), which is usually employed by other ODF techniques (6). The inherent smoothing embedded in the DK-ODF approximation might pose some limitations to the technique. For example, the DK-ODF approach may not be able to reconstruct fiber configurations that have ODFs with high frequency components. However, the high frequency components are not expected to be significant for a small number of crossing fibers. They should become considerable as the number of crossing fibers increases and it is expected that the model will not be able to describe these configurations.
The derivation of the diffusion and kurtosis tensor employed by DK-ODF requires only a limited number of measurements. For the imaging studies presented here using a protocol that was not optimized, the imaging time was around 12 minutes for a set of 15 axial slices and two averages.
An alternative approach for obtaining directional information in regions with complex fiber architecture is to use q-space imaging (QSI) techniques to extract the full diffusion displacement probability distribution (4,5). However, the QSI techniques require a large number of samples and high b values, thus resulting in long imaging times and images with low signal to noise ratio (6).
Finally, we note that the DK-ODF model, in contrast with the QBI-ODF approximations, has no explicit b value dependence. Further analyses are necessary to determine the influence of noise and measurement parameters on this property.
CONCLUSION
This study introduces a novel method for approximating the ODF based on diffusional kurtosis imaging and demonstrates its applicability to resolve crossing fibers using both simulations and imaging experiments in the human brain. Further work is necessary to evaluate the impact of this technique on white matter connectivity patterns obtained using fiber tractography techniques.
ACKNOWLEDGMENTS
This work was supported in part by grants from the Werner Dannheisser Testamentary Trust, the Litwin Fund for Alzheimer Research, and by NIH grants NIA R01AG027852, NINDS R01NS039135, and NIMH R03MH076180. The authors thank Caixia Hu for technical assistance.
APPENDIX
Derivation of Eq. [8]
In Ref. 11, it is shown that the signal intensity for a diffusion-weighted NMR sequence is approximately given by
| [A1] |
provided the b value is not too large. If we assume that S is a monotonically decreasing function of b (i.e., should fulfill the condition ), then one obtains
| [A2] |
as a necessary condition for the validity of Eq. [A1]. In the brain, D ≈ 1 μm2/ms and K ≈ 1, which implies that b should be less than about 3000 s/mm2 when applying Eq. [A1] to estimate K (further discussion on the range of b values for DKI is given in references (12) and (18)). The monotonicity assumption is based on empirical observations of the diffusion signal behavior in biological tissues.
For the purpose of relating the diffusional kurtosis to the ODF, it is convenient to further approximate the signal intensity by expanding the right hand side of Eq. [A1] to first order in K to give
| [A3] |
From Eqs. [4] and [A3] and the standard relationship (3, 17)
| [A4] |
we then obtain
| [A5] |
Here we have used the relation b = (2πq)2t and introduced the parameter a to regularize the integrals.
Without loss of generality, we can take to coincide with a coordinate axis and rewrite the result of Eq. [A4] in terms of spherical coordinates as
| [A6] |
where we have used the fact that ψ is real, and an elementary rescaling.
Performing the integrals over q and s gives
| [A7] |
Now we exploit the identities
| [A8] |
which lead to
| [A9] |
The delta function allows us to do the integral over θ, yielding
| [A10] |
which is equivalent to the DK-ODF approximation of Eq. [5].
We note that since our starting point of Eq. [A1] is exact for Gaussian diffusion (for which K = 0) the DK-ODF is equal to the exact ODF in this case.
REFERENCES
- 1.Basser PJ, Jones DK. Diffusion-tensor MRI: theory, experimental design and data analysis - a technical review. NMR Biomed. 2002;15:456–467. doi: 10.1002/nbm.783. [DOI] [PubMed] [Google Scholar]
- 2.Le Bihan D, Mangin JF, Poupon C, Clark CA, Pappata S, Molko N, Chabriat H. Diffusion tensor imaging: concepts and applications. J Magn Reson Imaging. 2001;13:534–546. doi: 10.1002/jmri.1076. [DOI] [PubMed] [Google Scholar]
- 3.Alexander DC. Multiple-fiber reconstruction algorithms for diffusion MRI. Ann NY Acad Sci. 2005;1064:113–133. doi: 10.1196/annals.1340.018. [DOI] [PubMed] [Google Scholar]
- 4.Wedeen VJ, Hagmann P, Tseng WY, Reese TG, Weisskoff RM. Mapping complex tissue architecture with diffusion spectrum magnetic resonance imaging. Magn Reson Med. 2005;54:1377–1386. doi: 10.1002/mrm.20642. [DOI] [PubMed] [Google Scholar]
- 5.Tuch DS, Reese TG, Wiegell MR, Wedeen VJ. Diffusion MRI of complex neural architecture. Neuron. 2003;40:885–995. doi: 10.1016/s0896-6273(03)00758-x. [DOI] [PubMed] [Google Scholar]
- 6.Tuch DS. Q-ball imaging. Magn Reson Med. 2004;52:1358–1372. doi: 10.1002/mrm.20279. [DOI] [PubMed] [Google Scholar]
- 7.Tuch DS, Wisco JJ, Khachaturian MH, Ekstrom LB, Kotter R, Vanduffel W. Q-ball imaging of macaque white matter architecture. Philos Trans R Soc Lond B Biol Sci. 2005;360:869–879. doi: 10.1098/rstb.2005.1651. [DOI] [PMC free article] [PubMed] [Google Scholar]
- 8.Perrin M, Poupon C, Rieul B, Leroux P, Constantinesco A, Mangin JF, Lebihan D. Validation of q-ball imaging with a diffusion fibre-crossing phantom on a clinical scanner. Philos Trans R Soc Lond B Biol Sci. 2005;360:881–891. doi: 10.1098/rstb.2005.1650. [DOI] [PMC free article] [PubMed] [Google Scholar]
- 9.Hess CP, Mukherjee P, Han ET, Xu D, Vigneron DB. Q-ball reconstruction of multimodal fiber orientations using the spherical harmonic basis. Magn Reson Med. 2006;56:104–117. doi: 10.1002/mrm.20931. [DOI] [PubMed] [Google Scholar]
- 10.Anderson AW. Measurement of fiber orientation distributions using high angular resolution diffusion imaging. Magn Reson Med. 2005;54:1194–1206. doi: 10.1002/mrm.20667. [DOI] [PubMed] [Google Scholar]
- 11.Khachaturian MH, Wisco JJ, Tuch DS. Boosting the sampling efficiency of q-Ball imaging using multiple wavevector fusion. Magn Reson Med. 2007;572:289–296. doi: 10.1002/mrm.21090. [DOI] [PubMed] [Google Scholar]
- 12.Jensen JH, Helpern JA, Ramani A, Lu H, Kaczynski K. Diffusional kurtosis imaging: the quantification of non-Gaussian water diffusion by means of magnetic resonance imaging. Magn Reson Med. 2005;53:1432–1440. doi: 10.1002/mrm.20508. [DOI] [PubMed] [Google Scholar]
- 13.Lu H, Jensen JH, Ramani A, Helpern JA. Three-dimensional characterization of non-Gaussian water diffusion in humans using diffusion kurtosis imaging. NMR Biomed. 2006;19:236–247. doi: 10.1002/nbm.1020. [DOI] [PubMed] [Google Scholar]
- 14.Reese TG, Heid O, Weisskoff RM, Wedeen VJ. Reduction of eddy-current-induced distortion in diffusion MRI using a twice-refocused spin echo. Magn. Reson. Med. 2003;49:177–182. doi: 10.1002/mrm.10308. [DOI] [PubMed] [Google Scholar]
- 15.Griswold MA, Jakob PM, Heidemann RM, Nittka M, Jellus V, Wang J, Kiefer B, Haase A. Generalized autocalibrating partially parallel acquisitions (GRAPPA) Magn Reson Med. 2002;47:1202–1210. doi: 10.1002/mrm.10171. [DOI] [PubMed] [Google Scholar]
- 16.Zhan W, Yang Y. How accurately can the diffusion profiles indicate multiple fiber orientations? A study on general fiber crossings in diffusion MRI. J Magn Reson. 2006;183:193–202. doi: 10.1016/j.jmr.2006.08.005. [DOI] [PubMed] [Google Scholar]
- 17.Kärger J. NMR self-diffusion studies in heterogeneous systems. Adv Colloid Interface Sci. 1985;23:129–148. [Google Scholar]
- 18.Kiselev VG, Il’yasov KA. Is the “biexponential diffusion” biexponential? Magn Reson Med. 2007;57:464–469. doi: 10.1002/mrm.21164. [DOI] [PubMed] [Google Scholar]


