

Abstract
γ-Glutamyl hydrolase, a cysteine peptidase, catalyzes the hydrolysis of poly-γ-glutamate derivatives of folate co-factors and many antifolate drugs. We have used internally quenched fluorogenic derivatives of glutamyl-γ-glutamate and (4,4-difluoro)glutamyl-γ-glutamate to examine the effect of fluorine substitution adjacent to the scissile isopeptide bond. Using a newly developed continuous fluorescence assay, the hydrolysis of both substrates could be described by Michaelis-Menten kinetics. Fluorine substitution resulted in a significant decrease in observed rates of hydrolysis under steady-state conditions due primarily to a ~ 15-fold increase in Km. Using stopped-flow techniques, hydrolysis of the non-fluorinated isopeptide was characterized by a burst phase followed by a steady-state rate, indicating that formation of the acyl enzyme is not rate-limiting for hydrolysis of this isopeptide. This conclusion was confirmed by analysis of the progress curves over a wide range of substrate concentration, which demonstrated that the acylation rate (k2) is ~ 10-fold higher than the deacylation rate (k3). The increased value of Km associated with the difluoro derivative limited the ability to obtain comparable pre-steady-state kinetics data at saturating concentration of substrate due to inner filter effects. However, even under non-saturating conditions, a modest burst was observed for the difluoro derivative. These data indicate that either deacylation or rearrangement of the enzyme-product complex is rate-limiting in this isopeptide hydrolysis reaction.
γ-Glutamyl hydrolase (GH, EC 3.4.19.9), a lysosomal cysteine protease, plays an important role in maintaining folate homeostasis (1). The folates are key cofactors in one-carbon metabolism leading to such essential biosynthetic products as glycine, methionine, thymidylate, and purine nucleotides (2, 3). The folylmonoglutamates are elongated to folylpolyglutamates by the enzyme folylpoly-γ-glutamate synthetase (FPGS, EC 6.3.2.17) in an ATP-dependent ligation process, effectively trapping the cofactor in the cell (4, 5). GH catalyzes the hydrolysis of the Glu-γ-Glu bonds to form folylmonoglutamates that can then be exported from the cell. Thus, these two enzymes are primarily responsible for the regulation of folate levels in the cell (Figure 1).
Figure 1.
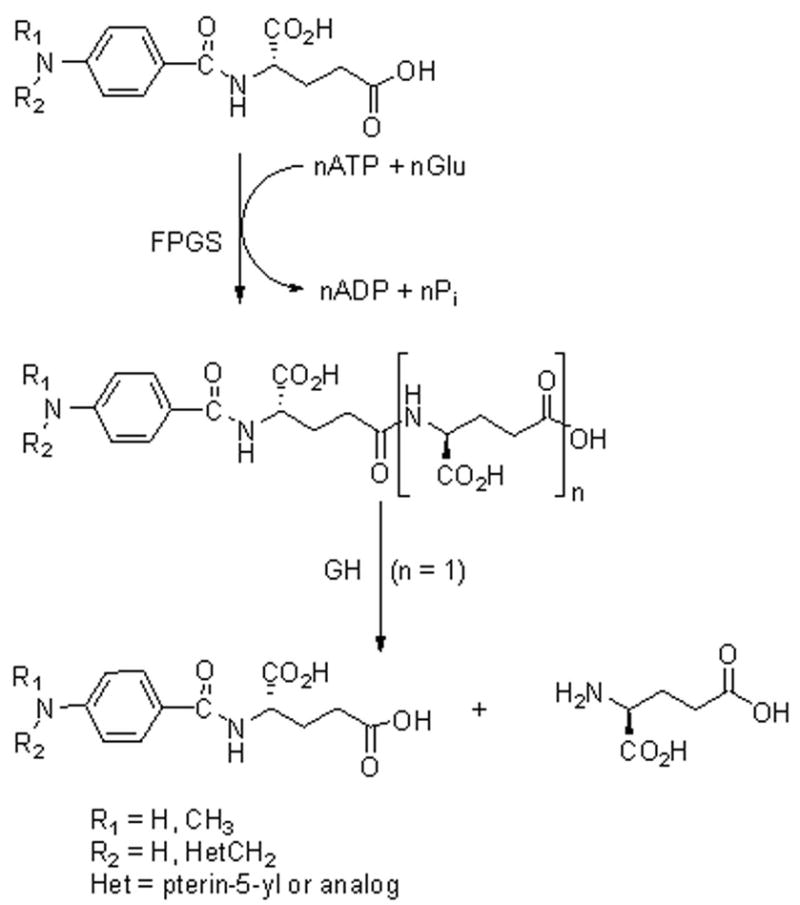
Folylpolyglutamate synthesis and hydrolysis. The folylmonoglutamate is elongated in an ATP-dependent reaction catalyzed by FPGS. GH catalyzes the hydrolysis of the γ-glutamyl bonds.
Consistent with this notion, high GH activity has also been shown to decrease the efficacy of several polyglutamylated antifolate chemotherapeutic drugs such as methotrexate (AMPte-Glu) (1). The polyglutamylated drug is hydrolyzed by GH, generating “free” drug that is retained poorly and leads to reduced cytotoxicity. A number of single nucleotide polymorphisms (SNPs) have been identified in the human GH gene both in the promoter region and the mature enzyme (6). One of these SNPs has been found in acute lymphoblastic leukemia patients with low GH activity. This SNP has been shown to reduce GH activity on long-chain methotrexate polyglutamates leading to the accumulation of intracellular methotrexate polyglutamates in leukemia cells (7). These reports place GH as an integral component in the regulation of the intracellular level of both folates and multiple antifolate drugs.
We have developed fluoroglutamate-containing γ-glutamyl peptides as mechanistic probes for GH (8). In earlier studies with GH from hog kidney, it was observed that a methotrexate derivative, 2-amino-10-methylpteroyl (2′RS,4′RS)-4-fluoroglutamyl-γ-glutamate (AMPte-(4-F)Glu-γ-Glu) was hydrolyzed significantly more slowly than AMPte-Glu-γ-Glu (9). These findings were corroborated with recombinant rat and human enzymes where it was found that substrates containing either (2S,4S)-4-fluoroglutamate (10) or (2RS)-4,4-fluoroglutamate (11) were hydrolyzed at least 25-fold more slowly than their non-fluorinated analogs (12). Fluorine substitution for hydrogen is sterically conservative but imparts large electronic effects that can change rates of reaction (13). It was of interest to determine the mechanistic basis for the attenuated rate of GH-catalyzed hydrolysis of the fluoroglutamate-containing substrates. In the studies reported here, recombinantly expressed rat GH was used, as it not only has demonstrated greater activity on shorter peptides than human GH, but also exhibits an apparent endopeptidase mode of cleavage that results in products that are not further substrates for the enzyme (14, 15), thereby simplifying the kinetics analysis.
Despite the interest in GH, protocols available for measuring its activity have been limited to endpoint assays of cleavage products using high-performance liquid chromatography (16–20) or capillary electrophoresis (21, 22). We have reported the first continuous assay for GH based on an internally quenched fluorogenic glutamyl-γ-glutamyl peptide with an N-terminal N-methyl-p-aminobenzoyl (N-Me-pAB) moiety as the fluorophore (23). Its fluorescence is quenched in the intact substrate by fluorescence resonance energy transfer (FRET) (24) to a C-terminal 3-nitrotyrosine (Tyr(NO2)). Cleavage of the Glu-γ-Glu bond results in release of the Tyr(NO2) moiety, so that fluorescence of the N-terminal hydrolysis product is observed. However, this substrate could only be used at concentrations up to about 10 μM because the strong absorbance of the N-Me-pAB moiety results in a decrease in the observed fluorescence at higher substrate concentrations, a phenomenon commonly referred to as the inner filter effect (IFE) (24). A second-generation fluorogenic substrate (1, Figure 2), in which the N-Me-pAB fluorophore is replaced with an o-aminobenzoyl (Abz) group, extends the useful concentration range before significant inner filter effects are observed and provides better sensitivity with a larger fluorescent signal. In order to study directly the influence of fluorine on GH-catalyzed hydrolysis of γ-glutamyl peptides, 4,4-difluoroglutamate has also been incorporated into this framework (2, Figure 2) (25). These compounds have been used in a continuous fluorescence assay to provide a detailed kinetic comparison between the GH-catalyzed hydrolysis of glutamyl and fluoroglutamyl peptide substrates. The studies described herein define the steady-state kinetic parameters for GH-catalyzed hydrolysis of 1 and 2. Transient kinetic parameters were determined using stopped-flow fluorescence spectroscopy. These experiments provide the first definitive evidence for formation of an intermediate in the reaction catalyzed by GH. Based on the steady-state and transient kinetics data, possible mechanisms for fluorine-mediated modulation of γ-glutamyl peptide hydrolysis are discussed.
Figure 2.

GH-catalyzed hydrolysis of internally quenched fluorescent substrates 1 and 2.
EXPERIMENTAL PROCEDURES
Materials, general synthetic methods, and details on the solution phase synthesis of 1 (Scheme 1) are described in the Supporting Information. The syntheses of N-Abz-Glu·TFA (3a) and Glu-γ-Tyr(NO2)·Et3N (4), the two expected products resulting from GH-catalyzed hydrolysis of 1 (Figure 2), are also described in the Supporting Information. For access to larger amounts of 1 required for transient kinetics experiments, isopeptide 1 was also synthesized by manual solid phase peptide synthesis on Wang resin (1.00 g, 1.2 mmol, suspended in 10 mL dry DMF) using an Fmoc protection scheme and HBTU activation (Scheme 2, See Supporting Information for details). Abz-4,4-F2Glu-γ-Glu-γ-Tyr(NO2) (2) was synthesized by Dr. David Konas (25).
Scheme 1.

Scheme 2.

Analytical HPLC was controlled and monitored using either two Altex pumps, a Hewlett-Packard diode array UV/Vis detector and an HP workstation, or a Waters system with a 6000a pump and a 510 pump with a Waters 996 photodiode array detector running under Millenium32 software (version 3.2). A Vydac 218TP54 C18 analytical column was eluted at 1 mL/min under one of the following conditions. Solvents: A, acetonitrile with 0.1% AcOH and 0.02% TFA (v/v); B, H2O with 0.1% AcOH and 0.02% TFA (v/v). Gradient 1: a separation beginning with 15% solvent A and 85% solvent B, which increased to 20% A over 25 min, then ramped to 95% solvent A in 15 min. Gradient 2: a separation beginning with 3% solvent A and 97% solvent B which was linearly increased to 50% A over 43 min, then ramped to 95% solvent A in 2 min.
LC-MS analysis was performed on a system including a Finnigan LCQ mass spectrometer interfaced with either a Hitachi HPLC and Hitachi detector (UV or fluorescence), or ThermoFinnigan Surveyor HPLC components with a fluorescence detector incorporated into the system using a splitter between the fluorescence detector and mass spectrometer. The HPLC separation was conducted on a Vydac C18 column with a gradient elution of solvent A and solvent B with either (Gradient 3) a linear increase from 3% to 50% solvent A over 22 min at 1 mL/min or (Gradient 4) a linear increase from 3% solvent A to 50% solvent B over 43 min at 0.8 mL/min. UV detection was set at 230 and 278 nm, and fluorescence detection was set at λex = 320 nm, λem = 420 nm for Abz-containing compounds.
Initial Biochemical Characterization of FRET Peptides
Abz-Glu-γ-Glu-γ-Tyr(NO2) Enzymatic Hydrolysis: LC-MS Analysis
Abz-Glu-γ-Glu-γ-Tyr(NO2) (1, 50 μM) was incubated with GH (0.72 nM) for 85 min. The resulting mixture was analyzed by LC-MS (Hitachi HPLC components, Gradient 3); tR = 8.0 min, (M+H)+ m/z 266.9 (3a); tR = 9.0 min, (M+H)+ m/z 356.1 (4).
Extinction Coefficient of Abz-Glu-γ-Glu-γ-Tyr(NO2) (1)
Insufficient quantities of 1 and 2 were available by solution phase synthesis for accurate determination of an extinction coefficient for these substrates. Therefore, the extinction coefficients of the N-terminal chromophore, N-Abz-glutamic acid, 3a, and the C-terminal chromophore, N-Ac-3-nitrotyrosine, S3, were obtained to provide an accurate extinction coefficient for the intact peptides. N-acetyl-3-nitrotyrosine (S3, Supporting Information, 268.2 mg, 1.0 mmol), previously dried over P2O5 at 25 °C for 12 h, was dissolved in 2 L of Milli-Q water to provide a 500 μM stock solution. Similarly, Abz-Glu (3a, Supporting Information, 132.9 mg, 0.5 mmol), previously dried over P2O5 at 25 °C for 12 h, was weighed under N2. This was diluted to 1 L in H2O to provide a 500 μM stock solution. These stock solutions were diluted in either 0.1 M HCl or 0.1 M NaOH to provide 1 mL volumes with final concentrations of 2, 5, 10, 25, 50, 75, and 100 μM. All dilutions were made in triplicate. Spectra were recorded between 220–600 nm at a scan rate of 600 nm/min at each concentration in each solvent. Plots of the average absorbance at 278.5 nm (0.1 M HCl) or 285 nm (0.1 M NaOH) versus concentration were then fit to Beer’s Law and the extinction coefficients of each chromophore summed to give values of ε = 6690 M−1cm−1 (λ = 278.5 nm, 0.1 M HCl) and ε = 5080 M−1 cm−1 (λ = 285 nm, 0.1 M NaOH). 1 Following successful synthesis of 1 on a larger scale by solid phase synthesis, direct determination of the extinction coefficient was possible and led to a value of ε = 5110 M−1 cm−1 (λ = 285 nm, 0.1 M NaOH), in good agreement with that determined for 1 as described above. Considering the identical chromophores in the donor and acceptor moieties of 1 and 2, the extinction coefficient of 2 was assumed to be the same as that determined for 1. 2
Enzyme Assays
Protein concentration
For routine determination of protein concentration, the method of Bradford (26) was used with reagents purchased from either BioRad or Sigma. The manufacturer’s instructions for the microassay were followed and bovine serum albumin was used as the standard. Initially, for steady-state experiments, the GH concentration was determined by the Bradford assay adjusted for enzyme purity (ca 75%) based on quantitative SDS-PAGE gel analysis. A more reliable determination of active GH concentration using more highly purified GH was obtained by a further adjustment based on a fit to the pre-steady-state kinetics data (eq 1–3); vide infra. Concentrations of GH determined in this manner are indicated in all experimental protocols and were used in the calculation of rate constants (Table 1).
Table 1.
Burst and steady -state kinetics of GH and Abz-Glu-γ-Glu-γ-Tyr(NO2).
 | ||||||
|---|---|---|---|---|---|---|
| Exponential phase | Linear phase | |||||
| Entry | KS (μM) | Km (μM) | k2 (s−1) | k3 (s−1) | Km (μM) | kcat (s−1) |
| 1a | 67 | 2.6 | 70 | 83 | ------ | ------ |
| 2b | 67 | 2.6 | 130 | 23 | ------ | ------ |
| 3c | 67 | 3.9 | 75 | 78 | 2.6 | 1.1 |
| 4d | 67 | 3.9 | 139 | 14 | 2.6 | 4.0 |
Fit to the data for the exponential phase (eq. 1–3) using Kaleidagraph with the following parameters: [E] = 3 μM (Bradford assay), Km = 2.60 μM (Figure 5D, Michaelis -Menten equation), k2+k3 = 153 s−1 (Figure 5B, eq. 2).
Continuous Steady-State Kinetic Analysis
Concentrations of stock solutions of Abz-Glu-γ-Glu-γ-Tyr(NO2) were determined based on the UV absorbance at 285 nm (ε = 5080 M−1cm−1, vide supra) in 0.1 M NaOH. All solutions except those of the enzyme were passed through a 0.2 μm syringe filter or a spin filter. In a typical assay, 90 μL of assay buffer pH 6.0, containing 50 mM β-mercaptoethanol, 50 mM sodium acetate, and 1 or 2 (concentration varied) was equilibrated at 25 °C in an amber microcentrifuge tube. The stock solution of GH was centrifuged at 10,000 rpm (8,000 × g) for 2 min to sediment any dust particles, and the supernatant was then carefully removed and diluted 10-fold in storage buffer consisting of 50 mM sodium acetate pH 5.5, 50 mM BME, 1 mM octyl-β-glucopyranoside, 1 mM EDTA, 1 M NaCl, pH 5.5. Preincubation of GH (15 μL) at 25 °C for 2 h was necessary to obtain maximal GH activity that appeared to be stable for at least the next 6 h. (14) To initiate the reaction, an aliquot of activated GH (10 μL) was added to the assay buffer and substrate in a microcuvette positioned in a jacketed cell holder. Final concentrations were typically 50 mM sodium acetate, pH 6.0, 50 mM BME, 0.25–75 μM substrate (1 or 2), and 0.72 nM GH (1) or 6.4 nM GH (2) in a final volume of 100 μL.
Reaction progress was monitored by time-based fluorescence acquisition (Spex Fluoromax-2) with the following parameters: time interval 1 s, integration 1.0 s, slit width 5 nm (band pass), λex = 320 nm, λem = 420 nm. The cuvette was capped tightly and the fluorescence was monitored for 2–10 min. Samples were transferred from the microcuvette to amber microcentrifuge tubes and a 1 μL aliquot of concentrated GH (typically 2.9 μM final concentration) was added to hydrolyze completely the remaining substrate. The controls at each concentration of substrate were treated as above except that GH storage buffer was added in place of GH. Both sample and control tubes were incubated at 25 °C to allow complete hydrolysis of the samples and the final fluorescence was measured for 25 s with an interval of 5 s and integration time of 1 s to provide the fluorescence endpoints (F∞).
The corrected fluorescence was obtained by subtracting the fluorescence of the control from that of the corresponding sample. Samples with substrate concentrations >20 μM were corrected for IFE (vide infra). A calibration curve to convert fluorescence units to micromolar product was created by plotting IFE-corrected F∞ vs. substrate concentration. The inverse of the slope of this line (μM/fluorescence unit) multiplied by the initial rate in fluorescence units/s provides the initial rate in units of μM/s. Initial rates were then fit to the Michaelis-Menten equation. To determine kcat, Vmax was divided by the total enzyme concentration. Data fitting was completed in Kaleidagraph version 3.5 (Synergy software, Reading, PA).
Inner Filter Effect Corrections
Solutions containing varying concentrations (0.25–75 μM) of equimolar Abz-Glu and Glu-γ-Tyr(NO2) were used to determine a correction factor for each concentration of substrate used in the assay. The measured fluorescence divided by the correction factor provided the corrected fluorescence value. This IFE correction was applied to initial rates measured at the higher substrate concentrations of 1 or 2 (35, 50, and 75 μM), whereby the initial rate was divided by an appropriate correction factor (0.91, 0.90, or 0.62 respectively). Final fluorescence values obtained by hydrolysis of 1 or 2 (10, 20, 35, 50, and 75 μM) were similarly corrected (factors of 0.97, 0.92, 0.83, 0.77, and 0.55 respectively).
Transient Kinetics
Transient kinetics experiments were carried out on Hi-Tech SF-61 or Hi-Tech SF-61DX2 stopped-flow instruments with a xenon lamp as the light source. The excitation wavelength was 320 nm (unless otherwise noted), and a 389 nm cutoff filter was used to select the emission wavelengths. Experiments were initiated by mixing equal volumes of enzyme and substrate at 25 °C or 4 °C. The substrate solutions were prepared in 50 mM sodium acetate, pH 6.0, 50 mM BME. Substrate concentrations are reported as final concentration after mixing with GH. Unless otherwise noted, solutions of GH were prepared in GH storage buffer, pH 5.5 with [NaCl] = 0.2 M to obtain a final concentration 0.1 M [NaCl] after mixing with substrate. Data were collected to at least 10 s using the program KISS (Kinetic Instruments, Inc., Ann Arbor, MI) on the Hi-Tech single-mixing stopped-flow instrument or KinetAsyst on the SF-61DX2. The dead time of the instrument is 1.5–2 ms. Data were collected at least in triplicate unless otherwise noted and were corrected by subtracting the fluorescence of the intact substrate. Standard curves were generated by measuring the fluorescence of solutions of various concentrations of the fluorescent hydrolysis product, Abz-Glu, varying concentrations of a 1:1 mixture of the reaction products, Abz-Glu and Glu-Tyr(NO2) or N-Acetyl-Tyr(NO2), or by internal calibration based on end points of completely hydrolyzed samples.
For samples exhibiting a burst phase, the average progress curves out to 0.5 s were fit to the burst equation (eq 1) where P represents the product formed in terms of
| (1) |
fluorescence, A is the amplitude of the burst, k is the burst rate (kburst), t is the time in seconds after mixing, v is the slope of the steady-state linear part of the curve (vss), and C is the intercept extrapolated from the linear portion (27, 28). In experiments varying [S]0 at constant [GH], the progress curves were fit to obtain kburst. A plot of kburst versus substrate concentration was fit to eq 2 (27, 28). A plot of the burst amplitude (A in eq 1) versus substrate concentration was fit to eq 3 (27, 28). [E] is known from the stoichiometry of the burst, and Km is known from fitting the Michaelis-Menten equation, using vss (from eq 1) as the steady-state rate. Thus, a fit of the data to eq 2 provides a value of (k2 + k3) as well as Ks. Using the value of (k2 + k3) thus obtained, a fit of eq 3 provides a value of k2. Subtraction of k2 from (k2 + k3) provides the value for k3.
| (2) |
| (3) |
RESULTS
Synthesis of FRET Peptide Substrate for GH
A γ-glutamyl peptide with the o-aminobenzoyl fluorophore at the N-terminus and the 3-nitrotyrosine quenching moiety at the C-terminus was first synthesized as shown in Scheme 1 (See Supporting Information for details). Compound 5, a protected diglutamyl peptide (23)3, was deprotected at the N-terminus and coupled to Boc-protected o-aminobenzoic acid (6) using standard EDC-mediated peptide coupling. This was followed by deprotection of the C-terminus, coupling of the 3-nitrotyrosine quenching moiety (8), and two deprotection steps to provide the desired product, 1. To study directly the effect of fluorine on GH-catalyzed hydrolysis of γ-glutamyl peptides, 4,4-difluoroglutamate was also incorporated using the same synthetic strategy to provide the related fluoropeptide, 2 (25). The two putative products of GH-catalyzed hydrolysis of 1, Abz-Glu (3a) and Glu-Tyr(NO2) (4) (Figure 2), were also synthesized for use as HPLC standards, LC-MS standards, and for fluorescence standard curves (See Supporting Information for details).
For transient kinetic studies, an additional supply of 1 was obtained using solid phase peptide synthesis (SPPS) to provide ample quantities of 1 in a rapid, efficient synthesis (Scheme 2). As described in the Supporting Information, SPPS is the preferred method of preparing 1, due to the commercial availability of suitably protected natural amino acids. However, SPPS is currently not yet feasible for synthesis of 2 or other peptides containing non-natural amino acids due to the large excess of Fmoc-protected amino acid (e.g., (2S)-4,4-difluoroglutamic acid) required for coupling to the resin-based C-terminus of the growing peptide.
Enzyme Assay Development for GH
To facilitate detailed kinetic studies of GH-catalyzed hydrolysis of both non-fluorinated and fluorinated substrates, our recently reported FRET assay for GH has been further refined. The original assay was based on an internally quenched fluorogenic glutamyl-γ-glutamyl peptide with an N-terminal N-methyl-p-aminobenzoyl (N-Me-pAB) moiety as the fluorophore and 3-nitrotyrosine as the C-terminal quenching moiety (23). However, the N-Me-pAB moiety has a significant absorbance (λmax = 289 nm, ε = 15,050 M−1cm−1, 0.1 N NaOH (29)) near the excitation wavelength (λex = 290), leading to a large IFE that limits the use of this substrate to concentrations below 10 μM. In the second-generation fluorogenic substrate (1), the N-Me-p-AB fluorophore has been replaced with an o-aminobenzoyl (Abz) group λmax = 322 nm, ε = 1,585 M−1cm−1, ethanol (30)) so that absorbance is much less at the excitation wavelength (λex = 320 nm). The use of 1 extends the concentration range (0 – 35 μM) before significant inner filter effects are observed as well as provides better sensitivity with a higher fluorescent signal. The concentration range of 1 and 2 in assays could be further extended to 75 μM by correcting for the IFE as described in Experimental Procedures. A more rigorous method of calibrating the assay to convert the fluorescence units to micromolar product also improved the reproducibility of the assay. Instead of using a single calibration point as is frequently reported for FRET assays, a concentrated aliquot of GH (1 μL, 2.9 μM) was added to each assay (varying concentrations of 1 or 2) after the initial velocity measurement, and the fluorescence was measured after complete hydrolysis. A linear plot of fluorescence versus product concentration (See Supporting Information, Figure S1) provided a reliable calibration factor as the inverse slope of the line (μM/fluorescence units). These improvements resulted in a robust, sensitive, and convenient continuous assay for GH that could now be applied to the detailed kinetic analysis of 1 and 2.
Steady-State Kinetic Comparison of GH-Catalyzed Hydrolysis of Substrates 1 and 2
The steady-state kinetic parameters for GH reactions with 1 and 2 were determined at 25 °C using the fluorescence assay (See Supporting Information, Figure S2). Since the rate of hydrolysis of 2 is significantly slower than that of 1 (vide infra), a higher concentration of GH (~ 9-fold) was used to monitor the reaction of 2 (see Experimental Section). The kinetics data were fit to the Michaelis-Menton equation to provide values of Km and Vmax for 1 and 2, which are summarized in Table S1. Because it was necessary to use a higher concentration of GH in order to obtain reasonable rates of hydrolysis of 2,a comparison of kcat and kcat/Km for the two substrates is more appropriate than Vmax and Km. However, given the observation of an attenuated burst amplitude in the GH-catalyzed hydrolysis of 1 under pre-steady-state conditions ([S] ≈ [GH], vide infra), determination of kcat under steady-state conditions by this method should be done with caution in this case. With these caveats, the substrate specificity of GH, as indicated by the relative values of kcat/Km, showed a 25-fold preference for 1 over 2. These data are consistent with preliminary data obtained with several isopeptide derivatives of methotrexate, 2-amino-10-methylpteroyl (2RS,4RS)-4-fluoroglutamyl-γ-glutamate (AMPte-(4-F)Glu-γ-Glu), (9), and the corresponding derivatives containing either (2S,4S)-4-fluoroglutamate or (2RS)-4,4-fluoroglutamate (12). This difference appears to be mediated mainly by a much higher value of Km (75 μM) for the fluorinated analog, 2, over that of 1 (Km = 5.4 μM). The high value of Km for 2 made it difficult to saturate GH before inner filter effects became too severe, leading to slightly higher errors in the determination of the kinetic constants for 2 compared to 1.
The proposed kinetic scheme for GH, that of a typical protease, is shown in Figure 3. In this scheme, rapid equilibrium association of the enzyme and substrate forms the Michaelis complex (ES), followed by formation of the acyl enzyme (ES′) with concomitant release of the first product P1 (Glu-Tyr(NO2) (4)). Separation of the quenching moiety (Tyr(NO2)) from the fluorophore (Abz) in this step results in increased fluorescence because FRET is distance-dependent. The last step of the kinetic scheme is the hydrolysis of the acyl-enzyme intermediate to release the second product, P2 (Abz-Glu (3a) or Abz-F2Glu (3b)). Both the formation of the acyl enzyme and the hydrolysis of the acyl enzyme (to reform free enzyme) proceed through similar tetrahedral intermediates (31). The slower hydrolysis of the fluorinated analog, 2, could be due either to steric effects that result in poor binding to GH or to an electronic effect, perhaps involving the stabilization of one or both tetrahedral intermediates by adjacent fluorine substituents (32).
Figure 3.

Proposed kinetic scheme for GH. ES is the Michaelis complex and ES′ is the acyl enzyme.
Steady-State vs. Pre-Steady-State Kinetics Experiments
From the above steady-state kinetics data alone it is difficult to draw conclusions about the mechanistic differences in the hydrolysis of 1 compared to 2. The values of Km for 1 and 2 as determined under steady-state conditions differ by almost 15-fold. Km is defined by the individual rate constants shown in eq 4, and is not equivalent to the dissociation constant (KS = k-1/k1) unless acylation is rate-limiting; i.e., k2 ≪ k3, and
| (4) |
k−1 ≫ k2. Pre-steady-state kinetics experiments can often allow for deconvolution of Km to provide individual rate constants. These experiments should therefore allow for independent determination of kcat under conditions where [GH] is identical for experiments involving isopeptides, 1 and 2. In the mechanism shown in Figure 3, kcat is defined by eq 5. The value of kcat provides a lower limit for the first-order rate constant
| (5) |
governing all steps, including chemical and conformational changes, in converting substrate to product once the substrate is bound to the enzyme surface (28). It is assumed that k-2 approaches zero due to the low concentration of P1 as it diffuses away from the protein, leading to decreased FRET and increased fluorescence. Stopped-flow kinetic experiments were conducted to determine if k3 might be the rate-limiting step.
Pre-Steady-State Kinetics Experiments for GH and 1
Varying concentrations of GH were mixed with 50 μM 1 (~10 × Km) in the stopped-flow instrument and the increase in fluorescence was monitored continuously. The results at 25 °C suggested the presence of a burst; however, lowering the temperature to 4 °C allowed the observation of a significant burst (Figure 4A). The burst suggests formation of an intermediate on the reaction pathway, the breakdown or release of which is slow relative to the rate of production of the first observed product. The observed burst curve indicates that k3, representing hydrolysis of the acyl enzyme intermediate and release of Abz-Glu, is the rate-limiting step of the reaction.4 Fitting progress curves to the burst equation (eq 1) provided a rate constant for the initial phase of 72 s−1, independent of [GH] (Figure 4A, [1] = 50 μM, ca 10 Km). The amplitude of the burst and the steady-state rate, vss, at each concentration of enzyme (Figure 4A) were determined and shown to be proportional to the enzyme concentration (Figure 4B). Assuming a full burst, the burst amplitude provides an estimate of the viable active site concentration. However, this was determined to be only about 30% of the GH concentration indicated by Bradford assay (data not shown). Several possible factors that could result in attenuation of the burst amplitude are discussed below.
Figure 4.

(A) Burst observed for rapid mixing of Abz-Glu-γ-Glu-γ-Tyr(NO2) (1, 50 μM) in assay buffer, pH 6.0, and varying concentrations of GH, in enzyme storage buffer, pH 5.5, 4 °C. Final concentrations were 50 μM 1 and 0.29 – 1.2 μM GH as indicated. Each progress curve is the average of five experimental traces. Only 10% of the data points are shown for clarity and each line represents a fit to the burst equation (eq 1). (B) Dependence of the burst amplitude (○) and steady state velocity (■) on enzyme concentration.
At a fixed concentration of GH (0.86 μM), the kinetics of hydrolysis of 1 (2.5– 50 μM) were monitored by fluorescence and fit to eq 1 (Figure 5A) to obtain the burst rate constants (k) and amplitudes (A), as well as the steady-state velocities (vss). At concentrations of 1 less than Km (e.g., 2.5 μM), a burst was not observed at the concentration of GH used, so this progress curve was only used for fitting the steady-state velocity. This dependence of the burst rate constant on substrate concentration was fit to eq 2 (Figure 5B), which provides values for KS and (k2 + k3), and the dependence of the burst amplitude on substrate concentration was fit to eq 3 (Figure 5C) to provide k2 and, k3, the latter by subtraction of k2 from (k2 + k3). The slower, nearly linear phase of the progress curves (Figure 5A) represents the steady-state rate, vss, the substrate concentration dependence of which could be fit to the Michaelis-Menten equation (Figure 5D) to provide the steady-state kinetic parameters, Km and kcat.
Figure 5.

Transient kinetics with varying Abz-Glu-γ-Glu-γ-Tyr(NO2), 1, in assay buffer, pH 6.0, mixed with GH, (0.86 μM final concentration after mixing) in enzyme storage buffer, pH 5.5, 4 °C. (A) Burst kinetics observed by fluorescence at > 389 nm upon varying concentration of 1 (indicated on figure). Each progress curve is the average of at least three experimental traces and only 10% of the data are shown for clarity. Data for [1] > 2.5 μM were fit to eq. 1 (solid lines). Data for 1 > 2.5 μM were fit to eq 1. (B) Dependence of burst rate constant on substrate concentration with fit to eq 2. (C) Dependence of burst amplitude on substrate concentration with fit to eq 3. (D) Dependence of steady-state rate on substrate concentration with fit to the Michaelis-Menten equation.
These kinetics data are summarized in Table 1. Fitting the data using a concentration of active GH derived from the burst analysis (0.86 μM) is consistent with our observations, whereas using the GH concentration derived from the Bradford assay (3.0 μM) is not. Only when the lower GH concentration was used was k2 found to be greater than k3 in fitting eq 3 (Table 1, entry 1 vs. 2); the presence of a burst predicts that k2>k3. However, when the enzyme concentration was set at 3 μM, as indicated by the Bradford assay, the calculated k2 is less than k3, which is inconsistent with the observation of the burst that is clearly evident in both Figures 4A and 5A. Although several possible explanations for the attenuated burst amplitude are further elaborated in the Discussion, a definitive basis for the observed low values of the burst amplitude is not clear from these data. However, highly reproducible data have been obtained (Figures 4 and 5), and by varying substrate concentration at fixed [GH] and fitting equations describing how the burst amplitude and burst rate constant vary with substrate concentration (eq 1–3), it was possible to determine the individual rate constants, k2 and k3, as well as the dissociation constant, KS and, in so doing, learn much about the mechanism of the reaction catalyzed by GH.
Pre-Steady-State Kinetics Experiments for GH and 2
To determine if the presence of geminal fluorine atoms in 2 changes the rate-limiting step, transient kinetic studies were carried out by rapidly mixing 2 (final concentration 50 μM) with varying concentrations of GH (0.29 – 1.2 μM). No burst was observed under these conditions (Supporting Information, Figure S3). However, since the substrate concentration was less than Km (75 μM) and thus non-saturating, it may be difficult to observe a burst. The experiment was repeated with a higher concentration of 2, 150 μM.5 At 150 μM 2, a modest burst was observed (Figure 6, [GH] = 0.86 μM). The high value of Km (75 μM) and limited quantity of 2 available precluded the use of [2] >150 μM for the collection of data to fit eq 1–3, as was described for substrate 1. However, fitting the limited data of Figure 6 to the burst equation (eq 1) provided an amplitude of 0.78 μM, or 26% active GH, which is very similar to the value of 29% active GH determined from the kinetic analysis of GH-catalyzed hydrolysis of 1. At this concentration of substrate, [2] = 150 μM, ~ 2 Km, the burst rate constant, kburst, was determined to be 13 s−1.
Figure 6.

Kinetics of Abz-4,4-F2Glu-γ-Glu-γ-Tyr(NO2) (2) hydrolysis. Equal volumes of GH in storage buffer (pH 5.5) and 2 in assay buffer (pH 6) were rapidly mixed at 4 °C and the fluorescence monitored. Concentrations after mixing were 0.86 μM GH and 150 μM 2, average traces (n=5) shown.
DISCUSSION
The new continuous fluorescence assay described above provides detailed kinetics data for the hydrolytic reaction catalyzed by γ-glutamyl hydrolase (GH). Previous research to elucidate the kinetic properties of this enzyme has relied on end-point assays (14, 20), primarily via chromatographic separation of the products using high performance liquid chromatography (HPLC) or capillary electrophoresis (CE) (33) (vide supra). In order to obtain more detailed steady-state and transient kinetics data, a continuous spectral assay was desired. GH is specific for cleavage of a Glu-γ-Glu bond, releasing glutamic acid which is neither a fluorophore nor a chromophore. Acylation of the N-terminal Glu of the Glu-γ-Glu isopeptide with a fluorescent group together with addition of an internal quenching moiety at the C-terminus leads to internal quenching of fluorescence due to FRET (24). GH-catalyzed hydrolysis of these substrates releases the quenching moiety, leading to a fluorescent signal.
The first FRET peptide designed for use as a GH substrate contained an N-terminal p-(N-Me)aminobenzoyl (N-Me-p-AB) fluorophore with 3-nitrotyrosine (Tyr(NO2) as the quenching moiety at the C-terminus (23). Although an effective substrate, the hydrolysis of which could be monitored continuously by fluorescence, its utility is limited due to attenuated fluorescence of the reaction products. This is a result of the inner filter effect (IFE) (vide supra). Replacement of the N-Me-p-AB moiety with o-aminobenzoyl (Abz) at the N-terminus and retention of Tyr(NO2) at the C-terminus minimized the IFE and provided two excellent GH substrates, 1 and its 4,4-difluoroglutamate analog, 2, and these have been used to determine the reaction kinetics of GH-catalyzed isopeptide hydrolysis.
While the use of peptide substrates containing fluorophores that are quenched due to intramolecular FRET is common for the high-throughput screening of compound libraries (34, 35), complete evaluation of protease reaction kinetics using such substrates is not frequently found in the biochemical literature (36). This is very likely due to problems caused by quenching of fluorescence (IFE). Recent studies have demonstrated that use of FRET peptides to determine standard enzyme kinetics data (Km, kcat, kcat/Km) can lead to incorrect values and erroneous conclusions (37). In such cases, IFE-based errors can be minimized by the use of alternate methods such as fast-flow HPLC (37) or dilution of the fluorogenic peptide substrate with a non-fluorescent analog (38). In the current research, a proper analysis of the steady-state and kinetics was possible with isopeptide 1 without resorting to these methods (Supporting Information, Figure S2A). However, because the Km for the fluorinated substrate, 2, is so large, it was not possible to saturate the enzyme (Supporting Information, Figure S2B) due to the IFE at high concentrations of 2. The use of fast-flow HPLC was not pursued and the scarcity of (2S)4,4-difluoroglutamic acid (25) precluded its incorporation into a non-fluorogenic peptide substrate for use in combination with 2.
A fit of the data shown in Figure S2 (Supporting Information) to the Michaelis-Menten equation provided steady-state kinetic constants for γ-glutamyl peptides 1 and 2 (Table S1). The dramatic decrease in the relative values of kcat/Km observed rates for GH-catalyzed hydrolysis of 2 vs. 1 (kcat/Km )rel 2:1 = ca. 0.04) is in contrast to the known inductive effects of fluorine on reactions at adjacent carbon. In the case of regioselective nucleophilic attack at the γ-ester of 4,4-difluoroglutamic acid esters (25, 39), the electron-withdrawing properties of fluorine leads to a large increase in the rate of nucleophilic attack at the adjacent carbon. Interestingly, incorporation of fluorine adjacent to the scissile isopeptide bond results in a significant (~ 15-fold) increase in Km. In order to probe more deeply into the basis for the increase in Km, investigation of GH-catalyzed hydrolysis under non-steady-state conditions was carried out using stopped-flow techniques
As noted above (eq. 4), Km is comprised of a dissociation constant, Ks = k-1/k1, modified by the rates of formation (k2) and breakdown (k3) of an intermediate, in this case the acyl enzyme. Experiments to determine the values of Ks, k2, and k3 were carried out using the stopped-flow instrument. At a fixed concentration of 1 ([1] = ~ 10 Km), GH-catalyzed hydrolysis of the isopeptide displays burst kinetics (Figure 4A), and it can be shown that both the burst amplitude and the steady-state rate are directly proportional to the enzyme concentration (Figure 4B). At a fixed concentration of [GH], hydrolysis of 1 displays burst kinetics (Figure 5A) with the burst rate, kburst (Figure 5B), burst amplitude (Figure 5C) and vss (Figure 5D) all dependent on the concentration of 1 as predicted. Fitting the data of these figures to eq. 2 (Figure 5B), eq. 3 (Figure 5C), and the Michaelis-Menten equation (Figure 5D) yielded values of Ks, k2, k3, Km, and kcat (Table 1). The mechanism shown in Figure 3 indicates the reaction steps associated with Ks (k-1/k1), k2 and k3. Intramolecular quenching of fluorescence in 1 is no longer possible on separation of the quenching moiety, Glu-γ-Tyr(NO2) from the fluorescent donor, Abz-Glu, following GH-catalyzed hydrolysis. Since the kinetics of product formation as measured by fluorescence exhibits a rapid burst phase followed by a slower steady-state phase, it follows that the step in which Glu-γ-Tyr(NO2) is released, k2, must be faster than some subsequent step. As shown in Table 1, the data of Figures 5A–D were fitted in two ways, one of which used the concentration of GH determined by the Bradford assay (3 μM) and a second which used the concentration of GH indicated by the burst amplitude (0.86 μM). Only when [GH] approached 0.86 μM (entries 2 (exponential phase) and 4 (global fit)) were values of k2 and k3 obtained that are consistent with the observed burst kinetics; i.e., k2 > k3. The observation of a burst phase in the enzyme-catalyzed hydrolysis of a peptide bond is unusual. Although the first burst kinetics were reported for a protease (40), the substrate used in that classic paper was a nitrophenyl ester. In contrast, substrates 1 and 2 incorporate an isopeptide, Glu-γ-Glu, and, to the best of our knowledge, a pre-steady-state kinetics investigation of enzyme-catalyzed hydrolysis of an isopeptide bond with this structural motif has not been reported (vide infra).
It is interesting to note that a more significant burst was observed at 4 °C than at 25 °C (vide supra), the temperature at which the steady-state kinetics data (Table S1, Figure S2) were obtained. Since an increase in fluorescence is associated with release of P1 (Figure 3, k2), the observed burst at 4 °C suggests, at first glance, that k2 increases with a decrease in temperature; however, this would be incompatible with the Arrhenius equation, and is therefore unlikely. A more plausible explanation is that k2 only decreases slightly at the lower temperature while k3 decreases significantly, so that k2 ≫ k3, leading to the observed burst of fluorescence. The rate constant, k3, is likely more complex than indicated in Figure 34 and could include a product release step and/or protein rearrangement to properly position the active site Cys110 for attack on the adjacent scissile bond if the enzyme acts processively. Large-scale domain motion of GH to accommodate repositioning of the adjacent scissile bond and/or active site residues, included in k3, would be expected to be much more sensitive to temperature effects than the simple acylation step represented by k2.
The discrepancy between the apparent concentration of GH as determined by the Bradford assay and that derived from the kinetics data should be addressed. Both the human and rat GH isozymes, expressed and purified as described in the Supporting Information, have been shown to be homogeneous by analytical ultracentrifugation (41) and, in the case of human GH, has been crystallized to provide a structure of the substrate-free enzyme (42). The simplest explanation of the kinetics data is that only ca. 30% of the enzyme is active.6 However, there are other possibilities. The x-ray crystal structure of hGH indicated that the enzyme has a homodimer structure with a β-mercaptoethanol molecule covalently linked to Cys110 at only one of the two active sites in the dimer (43). In addition, it has been shown recently by analytical ultracentrifugation that GH is a non-dissociating homodimer in solution (20, 41). Tyr36 is part of the monomer-monomer interface and has shown to be required for catalysis (T. J. Ryan, unpublished results). Thus, it is possible that in hGH, and by extension rGH, only one of the active sites is involved in the burst phase of catalysis; i.e., half-of-the-sites reactivity. The second site burst will be masked by the slower subsequent steps of catalysis. If true, the concentration of GH involved in the burst is predicted to be 50% of the total protein, a figure closer agreement to the value of ca. 30% determined from the burst amplitude data, but nevertheless suggesting some instability of the protein during handling. It is, of course, also possible that oligomerization to form larger inactive GH aggregates could lead to decreased catalytic activity. However, we have no evidence for the formation of aggregates under the conditions used in the experiments reported herein.
The pre-steady-state kinetics of GH-catalyzed hydrolysis of the 4,4-difluoroglutamate-containing isopeptide, 2, was also investigated using stopped-flow techniques. Due to the IFE, the maximum concentration of 2 used in the acquisition of kinetics data was 150 μM, a concentration of substrate only ~ 2 Km. Therefore, a thorough pre-steady-state analysis was not possible. Only when [2] = 150 μM (~ 2 Km) was a modest burst observed (Figure 6). The limited data obtained from Figure 6 indicate a >5-fold decrease in kburst for 2 vs. 1, even at subsaturating concentration (~2 Km) of the fluorinated substrate. Although modest in magnitude, the effect of placing two fluorine atoms adjacent to the scissile bond in a Glu-γ-Glu isopeptide is to retard the burst phase, presumably associated with formation of the acyl enzyme.7
Product analysis by LC-MS demonstrated that the reaction proceeds with cleavage of the expected Glu-γ-Glu isopeptide bond, leading to Glu-γ-Tyr(NO2) and Abz-Glu or Abz-(4,4-F2)Glu from 1 and 2, respectively (Figure 2). The internally quenched derivatives of Glu-γ-Glu, 1 and 2, were chosen for study to preclude the possibility of multiple sites of cleavage, as is observed for longer chain poly-γ-glutamates(20, 44). Thus, the kinetics data reported in this paper are for GH-catalyzed hydrolysis of a single bond in a Glu-γ-Glu isopeptide.
Further analysis of the data presented in Table 1 involving a global fit to the transient kinetics data (Figure 5) allows for evaluation of the internal consistency of these data. Thus, a value of kcat can be calculated from k2 and k3 (eq. 4), leading to a value of 12.7 s−1, and a value of Km can be calculated from Ks, k2, and k3 (eq. 5), leading to a value of 6.1 μM. These calculated values of kcat and Km for GH-catalyzed hydrolysis of 1 are in reasonable agreement with the steady-state component of the transient kinetics data (Table 1, entry 4).
As noted above, the observation of a burst phase in the GH-catalyzed hydrolysis of 1, a peptide, albeit an isopeptide, Glu-γ-Glu, is unusual. In terms of substrate structure and site of hydrolysis, the synthetase and hydrolase involved in the reversible post-translational modification of tubulin (45, 46) are most closely related to GH. Although the ATP-dependent ligase, tubulin polyglutamylase, that catalyzes the addition of multiple glutamates has been partially purified and its catalytic properties described (47, 48), the putative hydrolase activity by which the glutamates are removed (49) has not been characterized. Other enzymes that catalyze nucleophilic attack at the γ-position of substituted glutamine include γ-glutamyl transpeptidase (EC 2.3.2.2) (50) and transglutaminase (EC 2.3.2.13) (51). In the former reaction, acylation occurs via attack of an active site Cys or Thr on the γ-carboxamido group of a γ-glutamyl peptide followed by reaction of the acyl enzyme with an amino acid to release the peptide and form a new γ-glutamyl dipeptide. In the latter case, acylation involves attack of an active site cysteine on the γ-carboxamido group of a protein-bound glutamine followed by reaction of the acyl enzyme with an alkyl amine (e.g., protein-bound lysine, polyamines) to release NH3 and form a protein-bound γ-substituted glutamine. The catalytic mechanisms of both have been studied in detail but with non-peptide, chromogenic leaving groups (52) or non-physiological amine acceptors (53, 54), respectively. Thus, the burst kinetics observed in several cases by these investigators involve substrates with better leaving groups (e.g., p-nitroaniline, aminocoumarins) than an amino acid or peptide such as Glu-γ-Tyr(NO2) released in the GH-catalyzed reaction studied in this work (Figure 5).
Ubiquitin C-terminal hydrolases (UCH) (55, 56) are cysteine peptidases, family C12, that act on an isopeptide in which a C-terminal glycine is linked to the ε-amino group of an internal lysine residue of ubiquitin (57), In extensive mechanistic studies on a ubiquitin C-terminal hydrolase, UCH-L1, Stein and co-workers suggest that the enzyme exhibits a “mechanistic plasticity” where slightly different mechanisms are involved in substrate hydrolysis vs. enzyme inactivation by a peptidyl aldehyde (56). This suggestion is supported by a crystal structure of apo-UCH-L1 (58). It is proposed that binding of the peptide substrate involves displacement of a bound water to allow for proper alignment of the active site His-Cys diad to form the S−/ImH+ ion pair involved in formation of the acyl enzyme. Similarly, in GH, positioning of Cys110 and His220 to form the requisite ion pair presumably required for GH-catalyzed hydrolysis may involve a significant protein rearrangement, resulting in placing some or all of the substrate in a hydrophobic cleft. Unfortunately, data available from the published crystal structure of hGH (42) do not address this possibility because the structure obtained is of the substrate-free enzyme. However, it is possible that GH-catalyzed hydrolysis of oligo-γ-glutamates involves general-acid catalysis by the α-CO2H of a Glu residue on the carbonyl of the adjacent scissile γ-glutamyl peptide bond. This substrate-assisted catalysis could thereby facilitate attack by Cys110 to form the acyl enzyme intermediate (Figure 7). Substrate-assisted catalysis involving the α-CO2H could explain the observed decrease in kburst for 2 vs. 1; i.e., electron withdrawal by the CF2 adjacent to the carbonyl group would render that group less susceptible to general-acid catalysis
Finally, it should be noted that GH catalyzes the hydrolysis of a polymeric isopeptide and as such may operate in a processive mode as has been demonstrated in glycohydrolases such as amylase (“degree of multiple attack.”) (59). Although the research reported herein involved a diglutamate substrate containing only a single cleavage site, GH can hydrolyze multiple peptide bonds in longer chain poly-γ-glutamates. (20) Rearrangement of the initially formed E-P complex to position the next scissile bond for attack by Cys110, as required for a processive mechanism, could be the rate limiting step. If a rearrangement of E-P slows product release, it could lead to the observed burst kinetics. As noted above, the temperature dependence of k2 vs. k3, suggested by the observation of a burst of fluorescence at 4 °C but not at 25 °C, is consistent with slow protein rearrangement associated with a processive hydrolytic reaction at sequential peptide bonds along the poly-γ-glutamate chain.
In summary, the hydrolysis of two internally quenched derivatives of the isopeptide, Glu-γ-Glu, by recombinant rat GH has been investigated via a new continuous fluorescence assay. Comparison of the steady-state kinetics data obtained for a substrate with two fluorines adjacent to the scissile bond, 2, vs. the non-fluorinated derivative, 1, revealed that the surprisingly attenuated rate observed for 2 is due primarily to a 15-fold increase in Km. Pre-steady-state kinetics data were obtained by stopped-flow fluorescence methods, and a discreet burst phase was observed for the GH-catalyzed hydrolysis of 1, leading to the conclusion that formation of the putative acyl enzyme occurs with a rate ~ 10-fold faster than the rate of deacylation and any subsequent step(s). Although the transient kinetics data obtained for 2 were more limited due to the combined effects of a high Km and the IFE, a modest burst was observed at sub-saturating concentrations of the substrate, thus indicating that the two adjacent fluorine atoms do not affect the relative rates of formation or breakdown of the acyl enzyme intermediate. This detailed kinetic analysis of GH-catalyzed hydrolysis of 1 has documented an interesting and perhaps unique example of burst kinetics in isopeptide hydrolysis. It has also suggested possible half-the-sites reactivity and a processive mechanism for GH-catalyzed hydrolysis of oligomeric γ-glutamyl substrates, both of which are subjects for future research.
Supplementary Material
Experimental details on the synthesis of the GH substrate, N-Abz-Glu-γ-Glu-γ-Tyr(NO2) (1) by both solution and solid phase methods, two putative products, N-Abz-Glu (3a) and Glu-γ–Tyr(NO2) (4), and a model compound, N-Ac-Tyr(NO2) (S3), for use in determination of the extinction coefficient of the intact peptide, 1 Figures showing the linear dependence of product fluorescence on the concentration of the quenched substrate, 1 (Figure S1), steady-state kinetics of the GH-catalyzed hydrolysis of 1 (Figure S2A) and 2 (Figure S2B), and transient kinetics of the GH-catalyzed hydrolysis of 2 at [2] < Km (Figure S3). This material is available free of charge via the Internet at http://pubs.acs.org.
Figure 7.

Acknowledgments
We thank Prof. Rowena Matthews and the Biophysics Research Division, University of Michigan, for providing access to the Spex Fluoromax-2 fluorimeter for the initial steady-state kinetics experiments. We thank Dr. David Konas for the synthesis of the 4,4-difluoroglutamate-containing substrate, 2, and Drs. Matthew Alexander and John Tomsho for helpful discussions regarding solution phase and solid phase synthesis, respectively. We also thank Profs. Carol Fierke and Bruce Palfey for helpful discussions on experimental techniques and initial kinetics analysis. We thank Dr. Jules Shafer for insightful comments on the kinetics analysis and a reviewer for constructive criticism of the manuscript.
Abbreviations and Textual Footnotes
- Abz
o-aminobenzoyl
- AMPteGlu
2-deoxy-2-amino-10-methyl-pteroyl
- (2′RS
4′RS), indicates racemic carbon at the 2′- and 4′-position
- AMPte-(4-FGlu)
2-deoxy-2-amino-10-methyl-pteroyl(4-fluoro)glutamic acid
- BME
β-mercaptoethanol
- DIPEA
diisopropylethylamine
- DMAP
dimethylaminopyridine
- DMF
dimethylformamide
- EDC
N-(3-dimethylaminopropyl)-N′-ethylcarbodiimide
- EDTA
ethylenediaminetetraacetic acid
- EtN3
triethylamine
- Fmoc
fluorenylmethyloxycarbonyl
- FRET
fluorescence resonance energy transfer
- GH
γ-glutamyl hydrolase
- HETCOR
heteronuclear correlation spectroscopy
- HBTU
N,N,N′,N′-Tetramethyl-O-(1H-benzotriazol-1-yl)uronium hexafluorophosphate
- HOBt
1-hydroxybenzotriazole
- IFE
inner filter effect
- N-Me-pAB
N-methyl-p-aminobenzoyl
- SPPS
solid phase peptide synthesis
- TCEP
Tris(2-carboxyethyl)phosphine hydrochloride
- TEAB
triethylammonium bicarbonate
- TFA
trifluoroacetic acid
- Tyr(NO2)
3-nitrotyrosine
Footnotes
This research was supported in part by grants from the National Cancer Institute (CA28097 to J.K.C. and CA82425 to T.J.R) and the National Institutes of Health (GM 11106 to D.P.B.). J.P.A. was a trainee of the Michigan Chemistry-Biology Interface Training Program, supported in part by a grant from the National Institutes of General Medical Sciences (GM008597).
Determination of the extinction coefficient for S3 (2–100 μM) in 0.2 M Tris-0.2 M NaCl, pH 10, gave a value of ε = 4380 M−1 cm−1, in agreement with that reported in the literature under identical conditions. (60)
In the synthesis of 2, (25) a different synthetic route was used to access a fully protected intermediate corresponding to 9 (Scheme 1). Therefore, the N-terminal chromophore, N-Abz-(4,4-difluoro)glutamic acid, corresponding to 3a was not available for use in determining the extinction coefficient of 2.
Although intermediate 5 was reported previously, (23) details on its synthesis were not provided. These details are included herein (see Supporting Information).
The rate constant, k3, may of course represent more than one step in the reaction pathway.
Although the inner filter effect can be a problem at higher substrate concentrations, the stopped-flow instrument was set up to minimize the most severe primary IFE by having the excitation beam pass through the short side of the cuvette (0.75 mm to the center of the cell), and the emission was measured on the long side (5 mm). It should be noted that the IFE will not change the shape of the progress curve, only the amplitude, because absorbance does not change during the course of the reaction.
More complex kinetics could possibly lead to attenuation of the burst amplitude, including the following: 1. k2 may have a value similar to k3, 2. the reverse rate, k-2, may be significant; i.e., a low commitment to catalysis, 3. the rate of substrate binding (k1[S]) may be similar to k2, 4. dissociation of the quenching moiety, P1, may be slow and continue to quench the fluorescent acylated enzyme, ES′, or 5. additional species may intervene between ES and ES′, so that some of the enzyme present is not in a form that would be fluorescent. For example, if P1 is released from a species, ES″ that follows ES and is in rapid equilibrium with ES, then the concentration of ES″ will be dependent on the equilibrium constant; e.g., if Keq = 1, only 50% of the enzyme could be in the ES″ form that gives rise to the burst. Investigation of these possibilities is beyond the scope of the present study.
In principle, the rate constant, k2, which represents the acylation step, could be determined directly via single turnover experiments, which require [E] ≫ [S]. Considering limiting GH solubility at very high concentrations (unpublished data) and the detection limit of ca. 0.2 μM (10% conversion if [S] = 2 μM, ~ Km) for accurate measurement of fluorescence, it proved difficult to design a single turnover experiment that would provide reliable data.
References
- 1.Galivan J, Ryan TJ, Chave K, Rhee M, Yao R, Yin D. Glutamyl hydrolase: pharmacological role and enzymatic characterization. Pharmacol Therap. 2000;85:207–215. doi: 10.1016/s0163-7258(99)00063-7. [DOI] [PubMed] [Google Scholar]
- 2.Schirch V, Strong WB. Interaction of Folylpolyglutamates with Enzymes in One-Carbon Metabolism. Arch Biochem Biophys. 1989;269:371–380. doi: 10.1016/0003-9861(89)90120-3. [DOI] [PubMed] [Google Scholar]
- 3.Cossins EA. The fascinating world of folate and one-carbon metabolism. Can J Bot. 2000;78:691–708. [Google Scholar]
- 4.McGuire JJ, Coward JK. Folates and Pterins. In: Blakley RL, Benkovic SJ, editors. Folates and Pterins. John Wiley and Sons; 1984. pp. 135–190. [Google Scholar]
- 5.Shane B. Vitamins and Hormones. 1989;45:263–335. doi: 10.1016/s0083-6729(08)60397-0. [DOI] [PubMed] [Google Scholar]
- 6.Chave KJ, Ryan TJ, Chmura SE, Galivan J. Identification of single nucleotide polymorphisms in the human gamma-glutamyl hydrolase gene and characterization of promoter. Gene. 2003;319:167–175. doi: 10.1016/s0378-1119(03)00807-2. [DOI] [PubMed] [Google Scholar]
- 7.Cheng Q, Wu B, Kager L, Panetta JC, Zheng J, Pui C-H, Relling M, Evans WE. A substrate specific functional polymorphism of human gamma-glutamyl hydrolase alters catalytic activity and methotrexate polyglutamate accumulation in acute lymphoblastic leukaemia cells. Pharmacogenetics. 2004;14:557–567. doi: 10.1097/01.fpc.0000114761.78957.7e. [DOI] [PubMed] [Google Scholar]
- 8.Tsukamoto T, Coward JK, McGuire JK. Fluoroamino Acid Containing Analogues of Folic Acid and Methotrexate. In: Ojima IMJR, Welch JT, editors. Biomedical Frontiers of Fluorine Chemistry. American Chemical Society; Washington: 1996. [Google Scholar]
- 9.Licato NJ, Coward JK, Nimec Z, Galivan J, Bolanowska WE, McGuire JJ. Synthesis of N-[N-(4-Deoxy-4-amino-l0-methylpteroyl)-4-fluoroglutamyl]-γ-glutamate, an Unusual Substrate for Folylpoly-γ-glutamate Synthetase and γ-Glutamyl Hydrolase. J Med Chem. 1990;33:1022–1027. doi: 10.1021/jm00165a021. [DOI] [PubMed] [Google Scholar]
- 10.Hudlicky M. Stereospecific syntheses of all four stereoisomers of 4-fluoroglutamic acid. J Fluorine Chem. 1993;60:193–210. [Google Scholar]
- 11.Tsukamoto T, Kitazume T, McGuire JJ, Coward JK. Synthesis and biological evaluation of DL-4,4-difluoroglutamic acid and DL-γ,γ-difluoromethotrexate. J Med Chem. 1996;39:66–72. doi: 10.1021/jm950514m. [DOI] [PubMed] [Google Scholar]
- 12.Pankuch JJ. Ph.D. Thesis. University of Michigan; Ann Arbor: 2004. New Fluorogenic Peptide Substrates for Studying the Mechanism of γ-Glutamyl Hydrolase. [Google Scholar]
- 13.Uneyama K. Organofluorine Chemistry. Blackwell Publishing; Oxford, UK: 2006. [Google Scholar]
- 14.Wang Y, Nimec Z, Ryan TJ, Dias JA, Galivan J. The Properties of the Secreted γ-Glutamyl Hydrolases From H35-Hepatoma Cells. Biochim Biophys Acta. 1993;1164:227–235. doi: 10.1016/0167-4838(93)90253-n. [DOI] [PubMed] [Google Scholar]
- 15.Yao RNZ, Ryan TJ, Galivan J. Identification, Cloning, and Sequencing of a cDNA Coding for Rat γ-Glutamyl Hydrolase. J Biol Chem. 1996;271:8525–8528. doi: 10.1074/jbc.271.15.8525. [DOI] [PubMed] [Google Scholar]
- 16.Cashmore AR, Dreyer RN, Horvath C, Knipe JO, Coward JK, Bertino JR. Separation of pteroyl-oligo-γ-L-glutamates by high-performance liquid chromatography. Methods Enzymol. 1980;66:459–468. doi: 10.1016/0076-6879(80)66489-1. [DOI] [PubMed] [Google Scholar]
- 17.Jolivet J, Schilsky RL. High-Pressure Liquid Chromatography Analysis of Methotrexate Polyglutamates in Cultured Human Breast Cancer Cells. Biochem Pharmacol. 1981;30:1387–1390. doi: 10.1016/0006-2952(81)90330-0. [DOI] [PubMed] [Google Scholar]
- 18.Day BPF, Gregory JF., III Determination of folylpoly-γ-glutamate carboxypeptidase (folacin conjugase) activity using reversed-phase high-performance liquid chromatography. J Chrom. 1985;318:387–392. doi: 10.1016/s0021-9673(01)90703-4. [DOI] [PubMed] [Google Scholar]
- 19.Selhub J. Determination of Tissue Folate Composition by Affinity Chromatography Followed by High-Pressure Ion Pair Liquid Chromatography. Anal Biochem. 1989;182:84–93. doi: 10.1016/0003-2697(89)90722-7. [DOI] [PubMed] [Google Scholar]
- 20.Orsomando G, Diaz de la Garza R, Green BJ, Peng M, Rea PA, Ryan TJ, Gregory JF, III, Hanson AD. Plant γ-Glutamyl Hydrolases and Folate Polyglutamates: Characterization, Compartmentation, and Co-Occurrence in Vacuoles. J Biol Chem. 2005;280:28877–28884. doi: 10.1074/jbc.M504306200. [DOI] [PubMed] [Google Scholar]
- 21.Waltham MC, Li WW, Gritsman H, Tong WP, Bertino JR. γ-glutamyl hydrolase from human sarcoma HT-1080 cells: Characterization and inhibition by glutamine antagonists. Mol Pharm. 1997;51:825–832. doi: 10.1124/mol.51.5.825. [DOI] [PubMed] [Google Scholar]
- 22.Rhee MS, Lindau-Shepard B, Chave KJ, Galivan J, Ryan TJ. Characterization of human cellular β-glutamyl hydrolase. Mol Pharm. 1998;53:1040–1046. [PubMed] [Google Scholar]
- 23.Pankuch JJ, Coward JK. N-Me-pAB-Glu-γ–Glu-γ-Tyr(3-NO2): An Internally Quenched Fluorogenic γ-Glutamyl Hydrolase Substrate. Bioorg Med Chem Lett. 2001;11:1561–1564. doi: 10.1016/s0960-894x(01)00103-2. [DOI] [PubMed] [Google Scholar]
- 24.Lakowicz JR. Principles of Fluorescence Spectroscopy. Kluwer Academic/Plenum Publishers: New York; 1999. [Google Scholar]
- 25.Konas DW, Pankuch JJ, Coward JK. The Synthesis of (2S)-4,4-Difluoroglutamyl γ-Peptides Based on Garner’s Aldehyde and Fluoro-Reformatsky Chemistry. Synthesis. 2002;17:2616–2626. [Google Scholar]
- 26.Bradford MM. A Rapid and Sensitive Method for the Quantitation of Microgram Quantities of Protein Utilizing the Principle of Protein-Dye Binding. Anal Biochem. 1976;72:248–254. doi: 10.1016/0003-2697(76)90527-3. [DOI] [PubMed] [Google Scholar]
- 27.Bender ML, Kezdy FJ, Wedler FC. α-Chymotrypsin: Enzyme Concentration and Kinetics. J Chem Ed. 1967;44:84–88. doi: 10.1021/ed044p84. [DOI] [PubMed] [Google Scholar]
- 28.Johnson K. Transient State Kinetic Analysis of Enzyme Reaction Pathways. In: Sigman DS, editor. Mechanisms of Catalysis. 3. Academic Press, Inc; San Diego: 1992. pp. 1–61. [Google Scholar]
- 29.Fu SCJ. A New Synthesis of P-Methylaminobenzoyl-L-Glutamic Acid. J Org Chem. 1965;30:1277. [PubMed] [Google Scholar]
- 30.Chakraborty DP, Roy S, Chakraborty AK, Rakshit R. Tryptophan Participation in Melanogenesis - Modification of Raper-Mason-Pawelek Scheme of Melanin Formation. J Indian Chem Soc. 1989;66:699–702. [Google Scholar]
- 31.Silverman RB. The Organic Chemistry of Enzyme-Catalyzed Reactions. Academic Press; San Diego: 2002. [Google Scholar]
- 32.Skarzynski TKDH, Lees WJ, Walsh CT, Duncan K. Stereochemical Course of Enzymatic Enolpyruvyl Transfer and Catalytic Conformation of the Active Site Revealed by the Crystal Structure of the Fluorinated Analogue of the Reaction Intermediate Bound to the Active Site of the C115A Mutant of MurA. Biochemistry. 1998;37:2572–2577. doi: 10.1021/bi9722608. [DOI] [PubMed] [Google Scholar]
- 33.Chave KJ, Galivan J, Ryan TJ. In: γ-Glutamyl hydrolase. 2. Woessner F, Rawlings N, Barrett A, editors. Academic Press; New York: 2003. pp. 1396–1399. [Google Scholar]
- 34.Meldal M. The one-bead two-compound assay for solid phase screening of combinatorial libraries. Biopolymers. 2002;66:93–100. doi: 10.1002/bip.10229. [DOI] [PubMed] [Google Scholar]
- 35.Goddard JP, Reymond JL. Recent advances in enzyme assays. Trends in Biotechnology. 2004;22:363–370. doi: 10.1016/j.tibtech.2004.04.005. [DOI] [PubMed] [Google Scholar]
- 36.Stein RL, Barbosa MDFS, Bruckner R. Kinetic and mechanistic studies of signal peptidase I from Escherichia coli. Biochemistry. 2000;39:7973–7983. doi: 10.1021/bi000352i. [DOI] [PubMed] [Google Scholar]
- 37.Kruger RGDP, McCafferty DG. Development of a high-performance liquid chromatography assay and revision of kinetic parameters for the Staphlococcus aureus sortase transpeptidase SrtA. Anal Biochem. 2004;326:42–48. doi: 10.1016/j.ab.2003.10.023. [DOI] [PubMed] [Google Scholar]
- 38.Thomas-Wohler J, Lee I. Kinetic characterization of the peptidase activity of Escherichia coli Lon reveals the mechanistic similarities of ATP-dependent hydrolysis of peptide and protein substrates. Biochemistry. 2002;41:9418–9425. doi: 10.1021/bi0255470. [DOI] [PubMed] [Google Scholar]
- 39.Tsukamoto T, Coward JK. Facile synthesis of DL-4,4-difluoroornithine, DL-4,4-difluoroglutamine, and γ-DL-4,4-difluoroglutamyl-containing peptides: regiospecific addition of nucleophiles to N-Cbz-di-tert-butyl-DL-4,4-difluoroglutamate. J Org Chem. 1996;61:2497–2500. [Google Scholar]
- 40.Hartley BS, Kilby BA. The reaction of p-nitrophenyl esters with chymotrypsin and insulin. Biochem J. 1954;56:288–297. doi: 10.1042/bj0560288. [DOI] [PMC free article] [PubMed] [Google Scholar]
- 41.Eisele LE, Chave KJ, Lehning AC, Ryan TJ. Characterization of human γ-glutamyl hydrolase in solution demonstrates that the enzyme is a non-dissociating homodimer. Biochem Biophys Acta. 2006;1764:1479–1486. doi: 10.1016/j.bbapap.2006.06.008. [DOI] [PubMed] [Google Scholar]
- 42.Li HM, Ryan TJ, Chave KJ, Van Roey P. Three-dimensional structure of human γ-glutamyl hydrolase - A class I glutamine amidotransferase adapted for a complex substrate. J Biol Chem. 2002;277:24522–24529. doi: 10.1074/jbc.M202020200. [DOI] [PubMed] [Google Scholar]
- 43.Chave KJ, Auger IE, Galivan J, Ryan TJ. Molecular Modeling and Site-directed Mutagenesis Define the Catalytic Motif in Human g-Glutamyl Hydrolase. J Biol Chem. 2000;275:40365–40370. doi: 10.1074/jbc.M007908200. [DOI] [PubMed] [Google Scholar]
- 44.Silink M, Reddel R, Bethel M, Rowe PB. γ-Glutamyl Hydrolase (Conjugase) J Biol Chem. 1975;250:5982–5994. [PubMed] [Google Scholar]
- 45.MacRae TH. Tubulin post-translational modifications - Enzymes and their mechanisms of action. European J Biochem. 1997;244:265–278. doi: 10.1111/j.1432-1033.1997.00265.x. [DOI] [PubMed] [Google Scholar]
- 46.Westermann S, Weber K. Post-translational modifications regulate microtubule function. Nature Rev Mol Cell Biol. 2003;4:938–947. doi: 10.1038/nrm1260. [DOI] [PubMed] [Google Scholar]
- 47.Regnard C, Audebert S, Desbruyeres E, Denoulet P, Edde B. Tubulin polyglutamylase: Partial purification and enzymatic properties. Biochemistry. 1998;37:8395–8404. doi: 10.1021/bi9804131. [DOI] [PubMed] [Google Scholar]
- 48.Westermann S, Weber K. Identification of CfNek, a novel member of the NIMA family of cell cycle regulators, as a polypeptide copurifying with tubulin polyglutamylation activity in Crithidia. J Cell Sci. 2002;115:5003–5012. doi: 10.1242/jcs.00170. [DOI] [PubMed] [Google Scholar]
- 49.Audebert S, Desbruyeres E, Gruszczynski C, Koulakoff A, Gros F, Denoulet P, Edde B. Reversible polyglutamylation of α- and β-tubulin and microtubule dynamics in mouse-brain neurons. Mol Biol Cell. 1993;4:615–626. doi: 10.1091/mbc.4.6.615. [DOI] [PMC free article] [PubMed] [Google Scholar]
- 50.Keillor JW, Castonguay R, Lherbet C. γ-glutamyl transpeptidase substrate specificity and catalytic mechanism. Methods Enzymol. 2005;401:449–467. doi: 10.1016/S0076-6879(05)01027-X. [DOI] [PubMed] [Google Scholar]
- 51.Folk JE, Chung SI. Transglutaminases. Methods Enzymol. 1985;113:358–375. doi: 10.1016/s0076-6879(85)13049-1. [DOI] [PubMed] [Google Scholar]
- 52.Keillor JW, Menard A, Castonguay R, Lherbet C, Rivard C. Pre-steady-state kinetic studies of rat kidney γ-glutamyl transpeptidase confirm its ping-pong mechanism. J Phys Org Chem. 2004;17:529–536. [Google Scholar]
- 53.Case A, Stein RL. Kinetic Analysis of the Action of Tissue Transglutaminase on Peptide and Protein Substrates. Biochemistry. 2003;42:9466–9481. doi: 10.1021/bi030084z. [DOI] [PubMed] [Google Scholar]
- 54.Chica RA, Gagnon P, Keillor JW, Pelletier JN. Tissue transglutaminase acylation: Proposed role of conserved active site Tyr and Trp residues revealed by molecular modeling of peptide substrate binding. Protein Sci. 2004;13:979–991. doi: 10.1110/ps.03433304. [DOI] [PMC free article] [PubMed] [Google Scholar]
- 55.Dang LC, Melandri FD, Stein RL. Kinetic and mechanistic studies on the hydrolysis of ubiquitin C-terminal 7-amido-4-methylcoumarin by deubiquitinating enzymes. Biochemistry. 1998;37:1868–1879. doi: 10.1021/bi9723360. [DOI] [PubMed] [Google Scholar]
- 56.Case A, Stein RL. Mechanistic studies of ubiquitin C-terminal hydrolase L1. Biochemistry. 2006;45:2443–2452. doi: 10.1021/bi052135t. [DOI] [PubMed] [Google Scholar]
- 57.Wilkinson KD. Ubiquitination and deubiquitination: Targeting of proteins for degradation by the proteasome. Cell Dev Biol. 2000;11:141–148. doi: 10.1006/scdb.2000.0164. [DOI] [PubMed] [Google Scholar]
- 58.Das C, Hoang QQ, Kreinbring CA, Luchansky SJ, Meray RK, Ray SS, Lansbury PT, Ringe D, Petsko GA. Structural basis for conformational plasticity of the Parkinson’s disease-associated ubiquitin hydrolase UCH-L1. Proc Natl Acad Sci, U S. 2006;103:4675–4680. doi: 10.1073/pnas.0510403103. [DOI] [PMC free article] [PubMed] [Google Scholar]
- 59.Kramhoft B, Bak-Jensen KS, Mori H, Juge N, Nohr J, Svensson B. Involvement of individual subsites and secondary substrate binding sites in multiple attack on amylose by barley α-amylase. Biochemistry. 2005;44:1824–1832. doi: 10.1021/bi048100v. [DOI] [PubMed] [Google Scholar]
- 60.Riordan JF, Sokolovsky M, Vallee BL. Environmentally Sensitive Tyrosyl Residues. Nitration with Tetranitromethane. Biochemistry. 1967;6:358–361. doi: 10.1021/bi00853a053. [DOI] [PubMed] [Google Scholar]
- 61.Kuzmic P. Program DYNAFIT for the Analysis of Enzyme Kinetic Data: Application to HIV Proteinase. Anal Biochem. 1996;237:260–273. doi: 10.1006/abio.1996.0238. [DOI] [PubMed] [Google Scholar]
Associated Data
This section collects any data citations, data availability statements, or supplementary materials included in this article.
Supplementary Materials
Experimental details on the synthesis of the GH substrate, N-Abz-Glu-γ-Glu-γ-Tyr(NO2) (1) by both solution and solid phase methods, two putative products, N-Abz-Glu (3a) and Glu-γ–Tyr(NO2) (4), and a model compound, N-Ac-Tyr(NO2) (S3), for use in determination of the extinction coefficient of the intact peptide, 1 Figures showing the linear dependence of product fluorescence on the concentration of the quenched substrate, 1 (Figure S1), steady-state kinetics of the GH-catalyzed hydrolysis of 1 (Figure S2A) and 2 (Figure S2B), and transient kinetics of the GH-catalyzed hydrolysis of 2 at [2] < Km (Figure S3). This material is available free of charge via the Internet at http://pubs.acs.org.