Abstract
Rationale
Methamphetamine (MA) has been implicated in cognitive deficits in humans after chronic use. Animal models of neurotoxic MA exposure reveal persistent damage to monoaminergic systems, but few associated cognitive effects.
Objectives
Since, questions have been raised about the typical neurotoxic dosing regimen used in animals and whether it adequately models human cumulative drug exposure, these experiments examined two different dosing regimens.
Methods
Rats were treated with one of two regimens, one the typical neurotoxic regimen (4 × 10 mg/kg every 2 h) and one based on pharmacokinetic modeling (Cho et al. 2001) designed to better represent accumulating plasma concentrations of MA as seen in human users (24 ×1.67 mg/kg once every 15 min); matched for total daily dose. In two separate experiments, dosing regimens were compared for their effects on markers of neurotoxicity or on behavior.
Results
On markers of neurotoxicity, MA showed decreased DA and 5-HT, and increased glial fibrillary acidic protein and increased corticosterone levels regardless of dosing regimen 3 days post-treatment. Behaviorally, MA-treated groups, regardless of dosing regimen, showed hypoactivity, increased initial hyperactivity to a subsequent MA challenge, impaired novel object recognition, impaired learning in a multiple-T water maze test of path integration, and no differences on spatial navigation or reference memory in the Morris water maze. After behavioral testing, reductions of DA and 5-HT remained.
Conclusions
MA treatment induces an effect on path integration learning not previously reported. Dosing regimen had no differential effects on behavior or neurotoxicity.
Keywords: Morris water maze, Cincinnati water maze, spatial learning, locomotor behavior, stereotypy, dopamine, serotonin, corticosterone, path integration, GFAP
Introduction
Twenty-five million people abused amphetamines, including methamphetamine, globally between 2003–2005 (United Nations on Drug Control and Crime Prevention, 2006) and the number continues to grow. Acutely, methamphetamine (MA) heightens attention and decreases fatigue, appetite, and anxiety along with stimulating the sympathetic nervous system and cortisol release (Meredith et al., 2005) (Fehm et al., 1984). Chronic MA use can result in cognitive deficits, even after periods of abstinence (Meredith et al., 2005;Barr et al., 2006;Baicy and London, 2007). Autopsy and imaging studies on chronic users reveal reductions in brain dopamine and of dopamine transporter density (Wilson et al., 1996;Meredith et al., 2005;Barr et al., 2006;Baicy and London, 2007) and reductions in brain serotonin (Wilson et al., 1996) and of serotonin transporter density (Sekine et al., 2006).
In animals, MA treatment also induces reductions in DA and 5-HT and their transporters (Fukumura et al., 1998;Chapman et al., 2001). As in humans, glucocorticoids (especially corticosterone in rats) are elevated after MA exposure (Szumlinski et al., 2001;Williams et al., 2006). Results from animal experiments also show MA-induced neurotoxicity and increased apoptosis (O’Callaghan and Miller, 2002) (Davidson et al., 2001;Cadet et al., 2005). Neurotoxic doses of MA result in decreased locomotion when examined a week later (Wallace et al., 1999), whereas such doses have little or no effects on spatial learning (Friedman et al., 1998;Schroder et al., 2003). On the other hand, consistent effects of MA have been reported on novel object recognition (Bisagno et al., 2002;Schroder et al., 2003;Belcher et al., 2005;He et al., 2006) and to a lesser extent on fixed-route motor learning (Chapman et al., 2001;Daberkow et al., 2005).
There are many other cognitive functions that have not been examined after MA treatment including path integration. Path integration is often described as a ‘sense of direction.’ It does not rely upon the use of distal cues and is therefore distinct from spatial navigation (Etienne and Jeffery, 2004). One aim of the present study was to determine whether path integration was affected by MA treatment and if so whether such an effect could be segregated from potential effects of the drug on spatial navigation. Another aim was to use a more rigorous assessment of spatial navigation as described previously (Vorhees and Williams, 2006).
A second focus of the current experiments was on the dosing regimen of MA. This arose from data published by Cho et al. (2001) suggesting the possibility that the way MA is typically given to rats may not accurately model the accumulation of drug in plasma that occurs in humans taking the drug because of species differences in the rate of metabolism. Humans take MA as frequently as every few hours and the plasma half-life in humans is 10–12 h so MA ultimately reaches a steady state (Cook et al., 1992;Cook et al., 1993;Mendelson et al., 2006). By contrast, the half-life of MA in rats is ~70 min (Melega et al., 1995;Riviere et al., 1999;Cho et al., 2001). Using pharmacokinetic modeling, Cho et al. (2001) showed that in order to mimic steady-state plasma MA concentrations in rats comparable to those in humans a 15 min dosing interval would be required.
Accordingly, the present experiments had two separate objectives: (1), compare the standard 2 h interval neurotoxic dose model to a 15 min interval model, holding total daily dose equal, for their effects on markers of neurotoxicity 3 days post-treatment (the time-point most reliably reported for neurotoxicity to be maximal); and (2) compare both dosing regimens for their effects on behavior.
Methods
Animals
Male (325 – 350 g) Sprague-Dawley CD IGS rats (Charles River Laboratories) were allowed to acclimate for 1 week prior to drug treatment (temperature, 19 ± 1°C, 50 ± 10% humidity, and 14 h light: 10 h dark (lights on at 600 h) cycle; food and water ad libitum). Rats were housed in pairs and later separated 3 days before drug administration (Able et al., 2006). All procedures were conducted in accordance with NIH guidelines andapproved by the Institutional Animal Care and Use Committee. The vivarium is accredited by AAALAC.
Methamphetamine Administration
(+)-Methamphetamine-HCl (freebase, NIDA, >95% pure) was administered subcutaneously in 4 doses of 10 mg/kg with a 120 min inter-dose interval (MA-120min) or in 24 doses of 1.67 mg/kg with a 15 min inter-dose interval (MA-15min) with control animals receiving saline (3 ml/kg) at the same intervals (SAL-120min or SAL-15min). MA-treated animals by both dosing regimens received a total dose of 40 mg/kg over the 6 h treatment interval. During dosing, animals were maintained in 28x16x12 cm cages in a separate room from the colony at an ambient temperature of 23.8 ± 1 °C. Animals were weighed prior to the initial dose. For experiment 1, weights were also obtained at 6, 24, 48, and 66 h after the last dose. For experiment 2, animals were weighed 72 h after MA administration and weekly thereafter.
Body Temperature Monitoring
Prior to MA administration, animals were anesthetized with isofluorane and implanted with temperature transponders (IPTT-300: Bio Medic Data Systems, Seaford, DE) (Williams et al., 2007). During drug treatment, body temperatures were monitored every 30 min beginning with the first injection and for 8 h successively. If an animal’s temperature reached 40–40.2 °C it was placed in a shallow bath of water and monitored every 5–10 min to prevent hyperthermia. After 8 h (2 h after the last dose) animals were returned to the colony room.
Tissue Collection
Animals were transported to an adjacent suite (< 30 s after removal from homecage) and decapitated (Holson, 1992) 72 h after the last dose (between 1130–1330 h) for experiment-1 and 5 days following behavioral testing for experiment-2. Trunk blood was collected in 2% EDTA (0.05 ml/tube). Brains were removed and neostriata (caudate/putamen) and hippocampi dissected and frozen as described (Williams et al., 2007). Adrenals, thymus, and spleen were removed from each animal, freed of fatty tissue, and weighed.
Experiment-1
Assessment of Corticosterone
Blood was centrifuged (1399 RCF) for 25 min at 4 °C, plasma collected, and stored at − 80 °C. Plasma was diluted 3:1 in assay buffer and assayed in duplicate using EIAs for corticosterone (IDS, Fountain Hills, AZ).
Monoamine Assessment
Tissue concentrations of dopamine (DA), 3,4-dihydroxyphenylacetic acid (DOPAC), serotonin (5-HT), and 5-hydroxyindolacetic acid (5-HIAA) in neostriata and 5-HT and 5-HIAA in hippocampi were quantified using high-pressure liquid chromatography with electrochemical detection as described previously (Able et al., 2006). Retention times for DOPAC, DA, 5-HIAA, and 5-HT were approximately 7.0, 9.6, 12.0, and 21.5 min respectively.
GFAP Assessment
Neostriata were assessed for GFAP as described previously (Wang et al., 2004). Protein was determined using the Pierce BCA protein assay (Rockford, IL) and 1:500 dilutions of GFAP (Fitzgerald, Concord, MA) or 1:5000 dilution of actin (Chemicon International, Temecula, CA) antibodies were used. Membranes were exposed to film, scanned and bands quantified using ImageJ software (NIH, Bethesda, MD). Band density was divided by the density of the control sample in each gel and GFAP values divided by actin values to control for protein concentrations.
Experiment-2
All testing was conducted blind with respect to treatment group assignment. With the exception of the swimming tasks all equipment was cleaned with 70% ethanol between animals.
Stereotypy Monitoring
Animals were scored for stereotypy during the period of peak drug effect (6–8 h post-treatment and at 10 h). Stereotypy was scored as follows: 0=sleeping, 1=resting, eyes open, but not moving, 2=active (grooming, exploratory behavior), 3=stereotypy. Stereotypy was defined as oral (chewing, licking, or biting), focused sniffing, and repetitive head and paw movements.
Locomotor Activity
Locomotor activity testing in a novel environment was conducted for 1 h per day for 3 days in 41 × 41 cm chambers (Accuscan Electronics, Columbus, OH) as described previously (Williams et al., 2007).
Novel Object and Novel Place Recognition (Days 7–11)
Novel object recognition (NOR) testing began 1 week after treatment as previously described (Clark et al., 2000) with minor modifications as described previously (Williams et al., 2007). Animals were habituated to test arenas for 10 min/day for 3 days. On the fourth day, object recognition testing was conducted and the day after, novel place recognition was assessed as described (Williams et al., 2007).
Straight Channel Swimming Acclimation (Day 13)
Animals were examined for swimming speed on 4 consecutive trials in a 244 cm long × 15 cm wide × 51 cm high water-filled (38 cm deep) straight channel (Williams et al., 2003).
Cincinnati Water Maze (Days 14–28)
The CWM was used to assess path integration learning and is a nine-unit multiple-T maze placed in water as described previously (Vorhees, 1987). Importantly, the test method was altered from the original procedure to increase path integration aspects of the task by testing animals under infrared lighting, rather than fluorescent lighting. Two trials per day were given for 15 days. Prior to the beginning of a trial, animals were habituated to darkness for 5 min. If an animal failed to locate the escape, it was removed from the water and replaced in its home cage for a 5 min intertrial interval (ITI). Latency to escape, number of errors (defined as head and shoulder entry into dead-end T), and number of returns to the start were recorded.
Morris water maze (Days 31–50)
The Morris water maze (MWM) was tested in 3 phases: acquisition (10 × 10 platform), reversal (10 × 10 cm platform in the opposite quadrant), and shifted (5 × 5 cm platform in a quadrant adjacent to reversal position). This procedure makes the task more sensitive to spatial deficits (Vorhees and Williams, 2006). A video tracking system was used to analyze performance (‘Smart’ software, SDI, San Diego, CA). For each phase, rats received four trials per day for 5 days with a 2-min limit and ITI of 15 s (on the platform). If a rat failed to locate the platform it was placed on the platform. On the day following each learning phase a 30 s probe trial was given in which the platform was removed.
Locomotor activity with methamphetamine challenge (Day 51 or 52)
Animals were re-tested after completion of all other tests for locomotor activity with a challenge dose of MA (1.0 mg/kg). Animals were placed in the activity chambers and given 30 min of re-habituation before being removed and injected s.c. with MA and tested for an additional 2 h. Five days following locomotor activity, monoamines were assessed in animals as described for Exp-1.
Statistics
MWM, CWM, straight channel, and temperature data were analyzed using factorial analysis of variance (ANOVA), general linear model (SAS Institute, Cary, NC, procedure GLM). Treatment (MA or SAL) and Regimen (120min or 15min) were between-subject factors and day (MWM and CWM), trial (straight channel), or time (temperature or locomotor activity) were within-subject factors. The Greenhouse-Geisser correction was used when required. For neurochemical data, 2-way ANOVAs were used, and χ2 was used to determine group differences for stereotypy scores. Significance was set at p ≤ 0.05. Data are presented as means ± SEM and all times are expressed as after the first dose.
Results
Experiment-1 and 2 General Observations
In Experiment-1 (Exp-1) and -2, there were 4 treatment groups: MA-120min, SAL-120min, MA-15min, and SAL-15min with group sizes of n = 9, 9, 12, and 9, for Exp-1 and n = 19, 20, 20, and 20 for Exp-2, respectively. In Exp-1 all but one of the MA-treated animals was cooled and in Exp-2 all but six animals had to be cooled.
Experiment-1 and 2 Body Temperatures
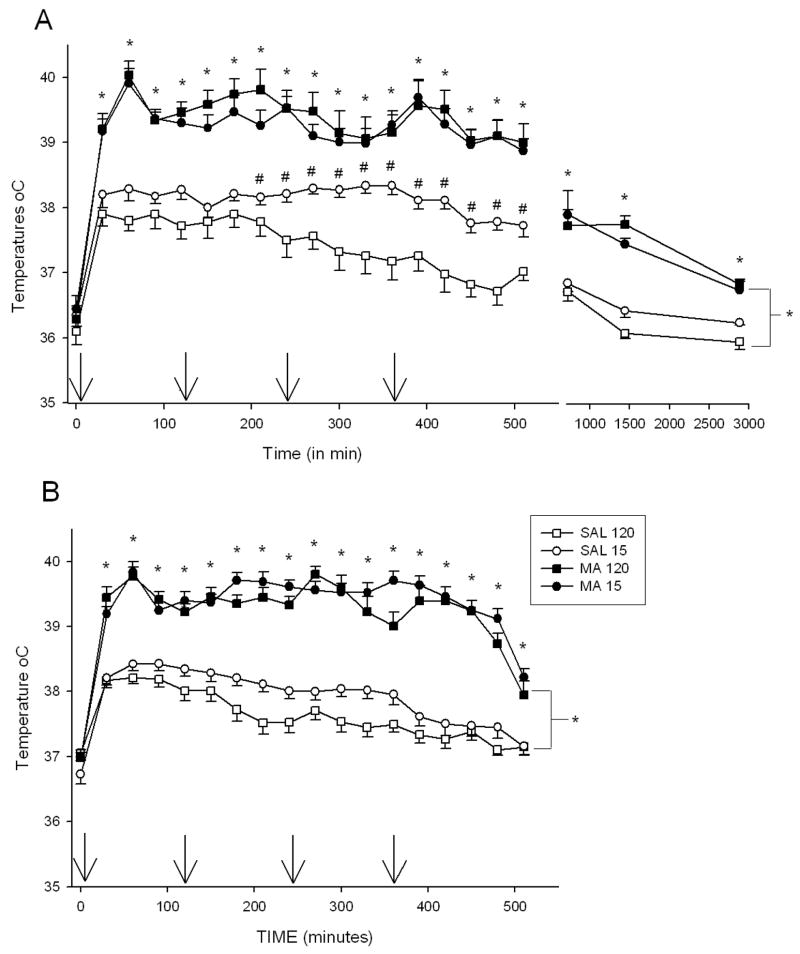
In Exp-1 and 2, there were no differences in the initial body temperatures among groups. There was a significant effect of Treatment, F(1,27) = 175.68, p < 0.0001, Time (p < 0.001), Regimen (p<0.0001), Treatment × Regimen, F(1, 27) = 15.61, p <0.05, and Treatment × Time, F(20,540) = 3.36, p <0.001, on body temperatures in Exp-1. Examination of Treatment × Time revealed that animals treated with MA, regardless of regimen, were hyperthermic relative to SAL-treated animals beginning at 30 min and continuing through all remaining time points (Fig. 1A). Treatment × Regimen was the result of the SAL-15min group having higher temperatures than the SAL-120min group from 240 – 510 min, but not significantly different at any of the other time points.
Figure 1.
The body temperatures of animals in Experiment 1 (A) and Experiment 2 (B). No differences in initial temperatures were observed; however, MA regardless of regimen produced significant increases in body temperature during the extent of temperature collection. Also, in Exp. 1 SAL-15min animals displayed increased body temperatures compared to SAL-120min animals from 210 – 510 min. In Exp. 2, animals treated every 15 min showed slightly elevated temperatures compared to those dosed every 120 min at 150, 210 – 270, 360 – 390, and 510 min. Arrows denote injection times. *p ≤ 0.05 MA vs SAL, regardless of regimen, #p ≤ 0.05 SAL-15min vs SAL-120min.
In Exp-2, a similar pattern of temperatures was observed (Fig. 1B). Significant effects were Treatment, F(1,66) = 281.03, p < 0.0001, Time,(p < 0.0001), Regimen (p < 0.05), Treatment × Time, F(17, 1122) = 14.13, p < 0.0001, and Regimen × Time (p < 0.001). Regardless of regimen, MA-exposed animals displayed hyperthermia compared to SAL-treated animals from 30 min to 510 min. Regimen × Time revealed that animals treated every 15 min had slightly higher temperatures than those dosed every 120 min at 150, 210 – 270, 360 – 390, and 510 min.
Body Weights
In Exp-1 and -2, there were no differences in initial body weights. In Exp 1, the significant effects were Treatment, F(1, 32) = 93.74, p < 0.0001, Time (p < 0.0001), Treatment × Time, F (4, 128) 17.61, p < 0.0001, and Regimen × Time, (p<0.0001), for the percent weight change. Analyses of Treatment × Time showed that MA-treated animals weighed less at 6, 24, 48, and 66 h compared to SAL-treated animals (p < 0.0001) (Table 1).
Table 1.
Experiment 1. Body Weights and Peripheral Measurements 3 days following MA treatment
| SAL-120 min | MA-120 min | SAL-15 min | MA-15 min | |
|---|---|---|---|---|
| Initial Weight | 436.3 ± 15.0 | 453.0 ± 8.3 | 463.0 ± 7.9 | 458.5 ± 5.9 |
| 6 h Weight (g) | 427.3 ± 14.9 | 426.1 ± 9.5* | 459.4 ± 8.1 | 438.2 ± 5.5* |
| 24 h Weight (g) | 426.6 ± 14.5 | 417.0 ± 9.9* | 450.8 ± 8.0 | 425.9 ± 6.0* |
| 48 h Weight (g) | 436.2 ± 12.7 | 430.3 ± 8.4* | 453.9 ± 9.0 | 428.9 ± 8.7* |
| 66 h Weight (g) | 441.1 ± 12.5 | 437.3 ± 7.2* | 460.9 ± 8.0 | 435.4 ± 7.2* |
| Thymus (% of 66 h weight) | 0.3826 ±.02 | 0.2463 ±.02* | 0.3617 ±.02 | 0.2231 ±.02* |
| Adrenal (% of 66 h weight) | 0.0570 ±.003 | 0.0623 ±.003 | 0.0632 ±.004 | 0.0656 ±.003 |
| Spleen (% of 66 h weight) | 0.7708 ±.02 | 0.6861 ±.06* | 0.7773 ±.04 | 0.6794 ±.05* |
| Corticosterone(ng/ml) | 30.17 ± 11.16 | 55.00 ± 10.52* | 48.95 ± 8.4 | 79.74 ± 21.31* |
p<0.05 compared to SAL
In Exp-2 for body weight, there were significant effects of Treatment, F(1, 74)= 4.62, p<0.05, Days (p < 0.0001), and Treatment × Day, F(7, 518) = 4.28, p <0.001. Analysis of the interaction showed that MA-treated animals had decreased weight gain, regardless of regimen, compared to SAL-treated animals from 3 through 17 days (Table 2).
Table 2.
Experiment 2. Body Weights
| SAL-120 min | MA-120 min | SAL-15 min | MA-15 min | |
|---|---|---|---|---|
| Initial weight (g) | 378.11 ± 2.38 | 379.7 ± 2.18 | 381.05 ± 2.00 | 377.65 ± 2.47 |
| 3 days (g) | 377.42 ± 3.30 | 363.21 ± 2.34* | 382.55 ± 3.11 | 355.70 ± 3.28* |
| 10 days (g) | 421.42 ± 4.10 | 404.63 ± 3.10* | 424.55 ± 4.67 | 401.5 ± 4.08* |
| 17 days (g) | 447.63 ± 5.86 | 438.95 ± 4.13* | 453.10 ± 5.92 | 435.85 ± 5.18* |
| 24 days (g) | 466.53 ± 6.98 | 462.21 ± 4.95 | 468.40 ± 6.28 | 457.80 ± 5.63 |
| 31 days (g) | 495.21 ± 7.90 | 489.00 ± 5.84 | 496.55 ± 7.29 | 488.10 ± 6.55 |
| 38 days (g) | 515.05 ± 9.29 | 508.63 ± 8.99 | 517.50 ± 8.18 | 515.00 ± 8.48 |
| 45 days (g) | 534.16 ± 10.99 | 530.00 ± 9.95 | 536.45 ± 9.36 | 534.45 ± 9.12 |
p < 0.05 compared to SAL
Experiment-1
Corticosterone
MA-treated animals, regardless of regimen, had increased levels of corticosterone 3 days after the dosing period compared to SAL-treated animals, Treatment, F(1, 32) = 4.07, p<0.05 (Table 1).
Adrenal, Thymus, and Spleen weights
Tissues were analyzed by raw weights and as a percentage of body weight. For the thymus, raw and percentage of body weights were decreased by MA compared to SAL administration, Treatment, F(1, 34) = 39.21 and 37.32, respectively, p < 0.0001. For the spleen, decreased percentage of body weight was observed in MA-treated animals compared to SAL-treated animals, Treatment, F(1, 34) = 4.18, p <0.05. No significant effects were observed for the adrenal weights (Table 1).
Monoamines
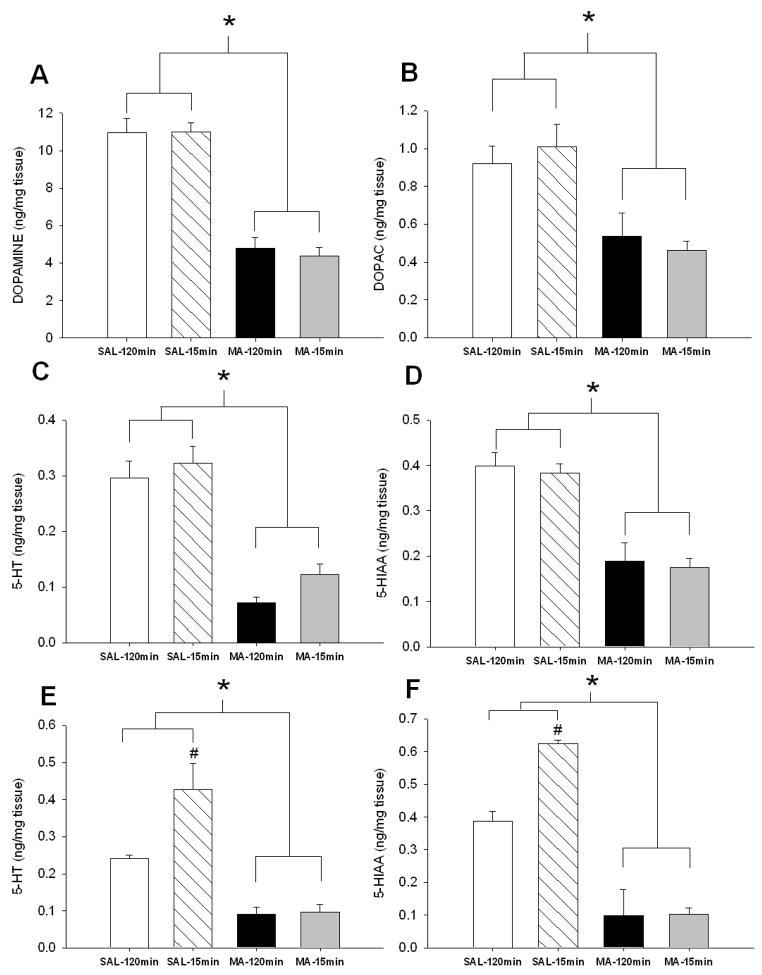
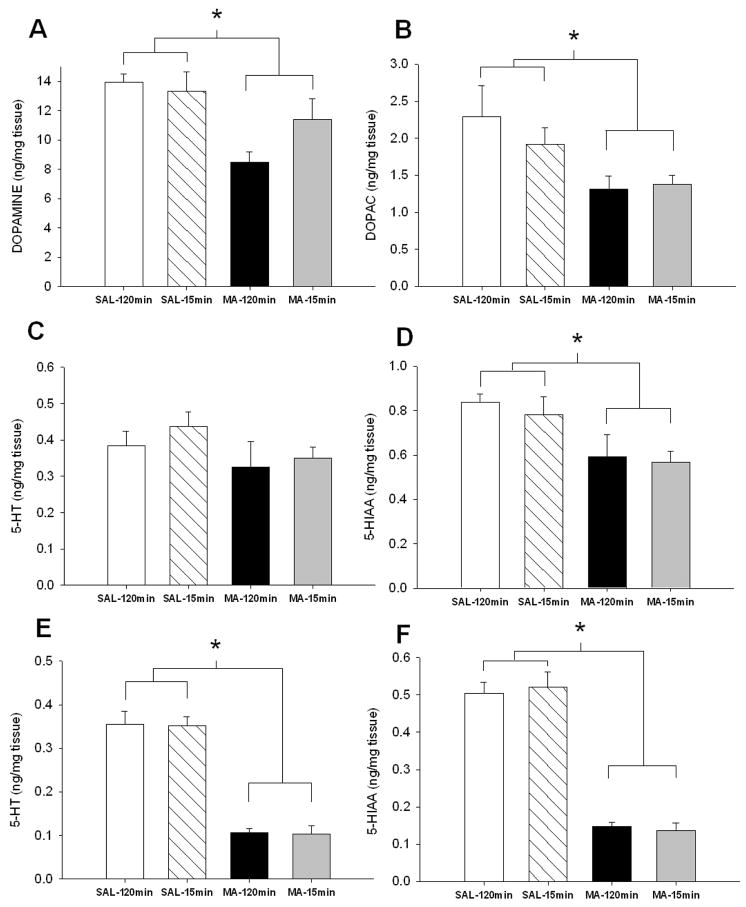
In the neostriatum, regardless of regimen, MA-treated animals had decreased DA, DOPAC, 5-HT, and 5-HIAA (Fig. 2A–D, respectively): Treatment, F(1,32):for DA = 119.08; DOPAC = 22.81; 5-HT = 74.34, and 5-HIAA = 50.57, p<0.0001. For 5-HT and 5-HIAA in the hippocampus, Treatment, F(1, 31) = 44.91 and 81.62, p < 0.0001, Regimen (p < 0.05), and Treatment × Regimen, F(1, 31) = 6.25 and 6.66, p < 0.05 were significant. MA treatment, regardless of regimen, resulted in decreased hippocampal 5-HT and 5-HIAA compared to SAL-treated animals (Fig 2E-F). Treatment × Regimen revealed increased hippocampal 5-HT and 5-HIAA in SAL-15min animals compared to SAL-120min animals.
Figure 2.
Monoamine levels in neostriatum (A – D) and hippocampus (E – F) 3 days following MA exposure. MA-treated animals regardless of regimen demonstrated decreased levels of (A) DA, (B) DOPAC, (C) 5-HT, and (D) 5-HIAA in the neostriatum and decreased (E) 5-HT and (F) 5-HIAA in the hippocampus. In addition, SAL-15min animals displayed increased hippocampal (E) 5-HT and (F) 5-HIAA compared to SAL-120min animals (SAL-120min n = 9 MA-120min n = 9, SAL-15min n = 9, MA-15min n = 9). open bar = SAL-120min, striped bar = SAL-15min, black bar = MA-120min, gray bar = MA-15min. * p ≤ 0.05 vs SAL, #p ≤ 0.05 vs SAL-120min.
Glial Fibrillary Acidic Protein
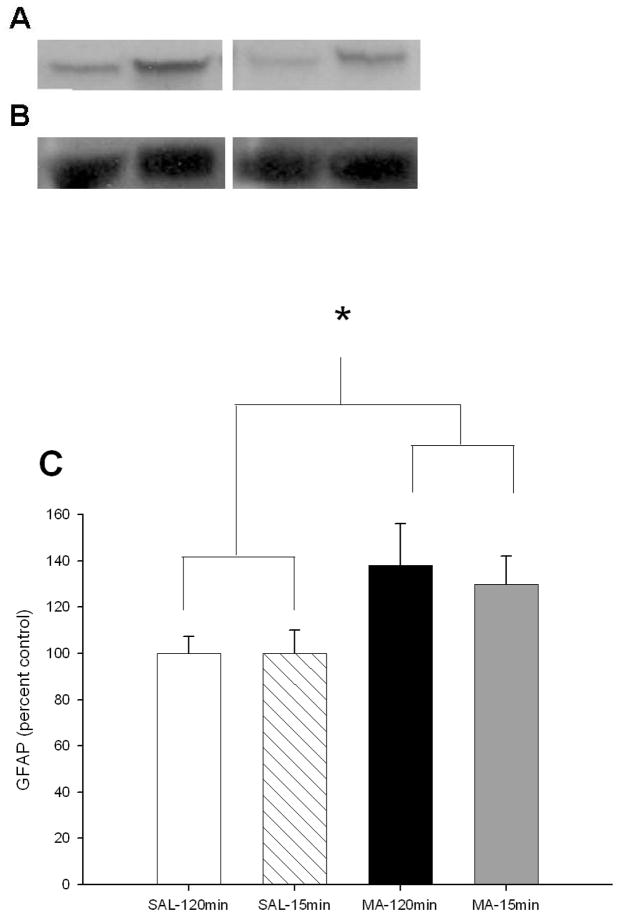
MA-exposed animals, regardless of regimen, had increased GFAP levels compared to SAL-treated animals, Treatment, F(1, 20) = 3.23, p < 0.05 (Fig 3A–C).
Figure 3.
GFAP levels 3 days following MA exposure by western blot analysis. (A) GFAP was increased in MA-treated animals regardless of regimen at 72 h following the first dose compared to SAL-treated animals. (From L to R: SAL-120min, MA-120min, SAL-15min, MA-15min) (B) No difference in actin levels was observed. (From L to R: SAL-120min, MA-120min, SAL-15min, MA-15min) (C) GFAP/actin shown by percent control. (SAL-120min n = 8, MA-120min n = 9, SAL-15min n = 4, MA-15min n = 3) open bar = SAL-120min, striped bar = SAL-15min, black bar = MA-120min, gray bar = MA-15min. *p ≤ 0.05 MA vs SAL, regardless of regimen.
Experiment-2
Stereotypy
Animals treated with MA, regardless of regimen, displayed stereotypic behavior, whereas SAL-treated animals did not (6 h, χ2 = 76.7, df (9), 6.5 h, χ2 = 75.4, df (9), 74.4, 7.5 h, χ2 = 81.6, df (9), 8.0 h, χ2 = 99.8, df (9), and at 12 h, χ2 = 69.1, df (9), ps<0.0001) (Fig. 4). MA-15min animals displayed less stereotypy compared to MA-120min animals at 7, 7.5, and 8 h,
Figure 4.
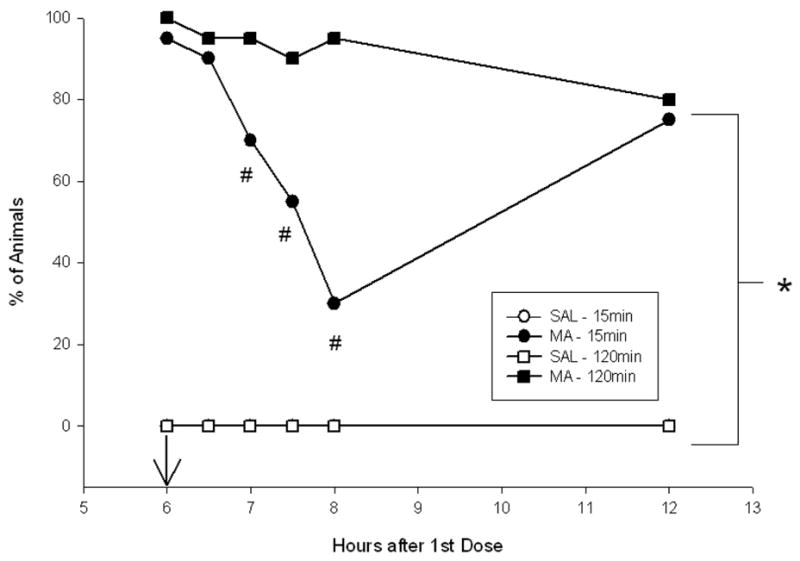
Stereotypy scores 6–12 hrs following the first dose of MA. MA-treated animals regardless of regimen displayed increased stereotypy compared to SAL-treated animals. MA-15min animals displayed less stereotypy movements from 7–8 hrs compared to MA-120min animals, however all MA-treated animals displayed similar levels of stereotypy at 12 h. (SAL-120min n = 19, MA-120min n = 20, SAL-15min n = 20, MA-15min n = 20). Arrow denotes 6 h injection. *p ≤ 0.05 MA vs SAL, regardless of regimen, #p ≤ 0.05 MA-15min vs MA-120min
Locomotor Activity
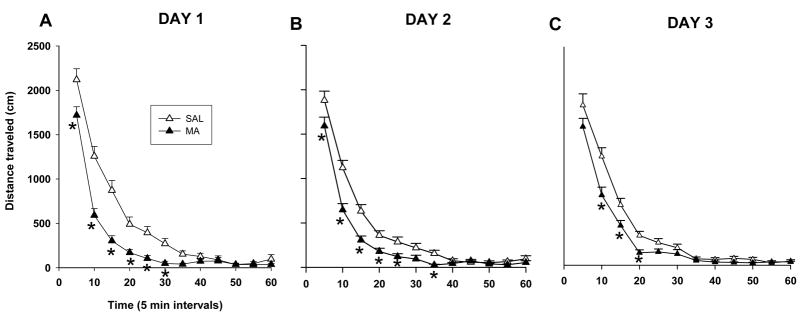
For total distance, Treatment was significant, F(1, 75) = 16.2, p <0.0001 on Day 1, F(1, 74) = 13.70, p<0.001 on Day 2, and F(1, 73) = 9.13, p<0.05 on Day 3, and Time (p < 0.0001, on all days), and Treatment × Time, F(11,825) = 6.0, p <0.001 on Day 1, F(11,814) =3.36, p<0.05 on Day 2, and on Day 3, F(11,803)=3.30, p<0.05. Animals treated with MA, regardless of regimen, were significantly less active than the SAL-treated animals (Fig. 5A–C) especially during the first 30 min on Day 1 (p < 0.01), during min 5–25 and 35 on Day 2 (p<0.05), and during min 10–20 on Day 3 (p<0.05).
Figure 5.
Locomotor assessment of animals 1–3 days following MA exposure. MA-treated animals, regardless of regimen, demonstrated hypoactivity from 5 – 35 min on day 1 (A). Hypoactivity was also observed on day 2 from 5 – 25 min and again at 35 min (B) and on day 3 from 10 – 20 min (C). Day 1: (SAL-120min n = 19, MA-120min n = 20, SAL-15min n = 20, MA-15min n = 20). Day 2: (SAL-120min n = 19, MA-120min n = 19, SAL-15min n = 20, MA-15min n = 20). Day 3: (SAL-120min n = 19, MA-120min n = 19, SAL-15min n = 20, MA-15min n = 19). *p ≤ 0.05 MA vs SAL, regardless of regimen.
For repetitive beam breaks on Day 1, Treatment, F(1, 75) = 15.51, p<0.001, Time, p<0.0001, and Treatment × Time, F(11, 825) = 6.66, p<0.0001 were significant. The MA-treated animals, regardless of regimen, displayed fewer repetitive beam breaks than SAL-treated animals during the first 6 intervals (not shown). On days 2 and 3, only Time was significant (p< 0.0001).
Novel Object and Place Recognition
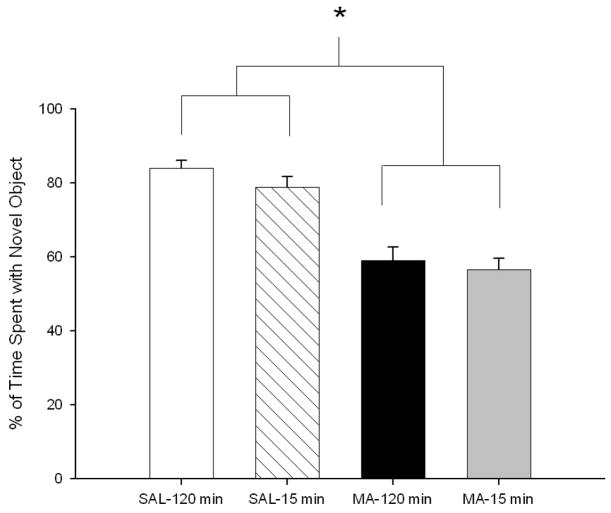
Animals treated with MA, regardless of regimen, spent less time investigating the novel object compared to SAL-treated animals, Treatment, F(1, 69) = 59.29, p<0.0001 (Fig. 6). However, during novel place testing, no treatment-related change in preference was seen for the new position (not shown).
Figure 6.
Novel object preference of animals 1 week following MA exposure. MA-treated animals, regardless of regimen, spent less time with the novel object compared to SAL-treated animals. (SAL-120min n = 18, MA-120min n = 19, SAL-15min n = 17, MA-15min n = 19). *p ≤ 0.05 MA vs SAL, regardless of regimen.
Straight Channel
There were no significant effects of Treatment, Regimen, or interactions observed, however animals did swim faster over Trials (p < 0.0001; not shown).
Cincinnati Water Maze
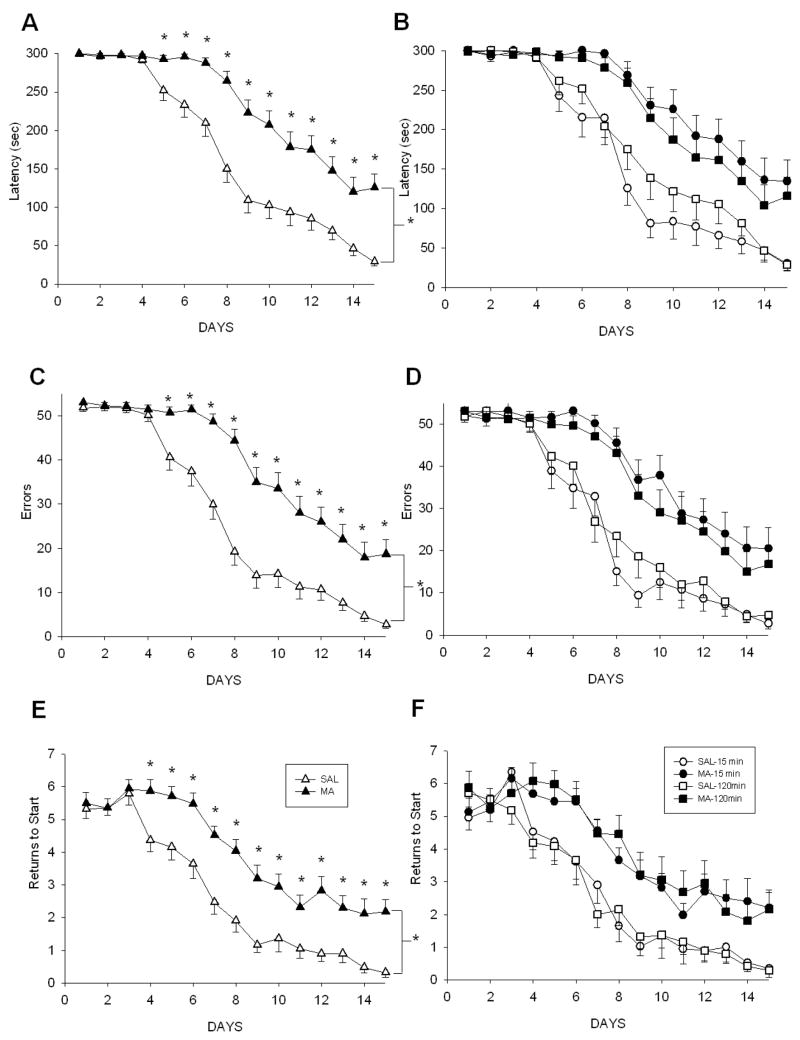
For latency, Treatment, F(1, 76) = 29.26, p<0.0001, Day, p<0.0001, and Treatment x Day, F(14, 1064) = 8.60, p<0.0001, were significant. MA-treated animals, regardless of regimen, had longer latencies than SAL-treated animals beginning on day 5 through day 15 (Fig. 7A & B). For errors, a few animals failed to find the escape on multiple trials and stopped searching after repeated failures. To correct for this, an error score of the highest number of errors made by any animal in under 5 min +1 was assigned to all animals failing to escape within 5 min. For corrected errors, Treatment, F(1, 74) = 32.43, p<0.0001, Day, p<0.0001, and Treatment × Day, F(14, 1036) = 8.13, p<0.0001, were significant. From day 5 to day 15, MA-treated animals, regardless of regimen, committed more errors than SAL-treated animals (p<0.001; Fig. 7C–D). For returns to start, there were significant effects of Treatment, F(1, 76) = 21.50, p<.0001, Day, p<0.0001, and Treatment × Day, F(14, 1064) = 3.57, p<0.0001. Animals treated with MA, regardless of regimen, returned to the start more often from day 4–day 15 compared to the SAL-treated animals (Fig. 7E–F).
Figure 7.
CWM performance beginning 2 weeks following MA treatment. The main effect of Treatment is shown in A, C, E and all 4 treatment groups are displayed in B, D, F. MA-treated animals, regardless of regimen, demonstrated increased latencies beginning on day 5 (A, B), increased number of errors beginning on day 5 (C, D), and increased returns to start beginning on day 4 (E, F). (SAL-120min n = 19, MA-120min n = 19, SAL-15min n = 20, MA-15min n = 20). *p ≤ 0.05 MA vs SAL, regardless of regimen.
Morris Water Maze
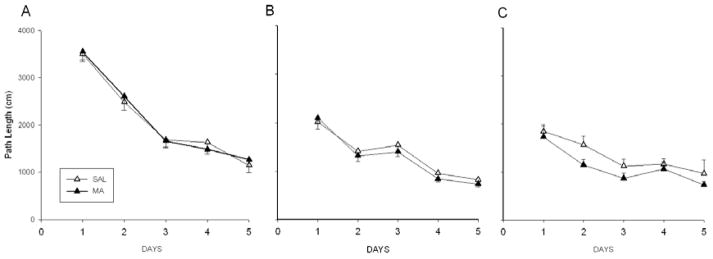
In the MWM, path length was used to illustrate performance (Lindner, 1997) and is highly correlated with latency (Vorhees and Williams, 2006). Regardless of Treatment, animals learned the task during acquisition, reversal, and the shifted (small platform) phases, Day, p<0.0001. However, there were no differences attributable to Treatment (Fig. 8A–C). Consistent with this finding, no differences were observed during the probe trials for average distance from the platform site or the number of platform site crossings (not shown). Likewise, no differences in swimming speed were detected among treatments (SAL-15min: 52.80 ± 1.29 s, MA-15min: 55.81 ± 1.25 s, SAL-120min: 55.64 ± 1.60 s, and MA-120min: 52.36 ± 1.36 s).
Figure 8.
MWM performance beginning 2 days after CWM for acquisition (A), reversal (B), and shifted with reduced platform (C). For simplicity, combined MA- and SAL-treated groups are presented. No differences between treatments were observed in the path length animals took to get to the platform. Also, regardless of treatment, the distance traveled to get to the platform was reduced over the days of testing. (SAL-120min n = 19, MA-120min n = 19, SAL-15min n = 20, MA-15min n = 20)
Locomotor with Challenge
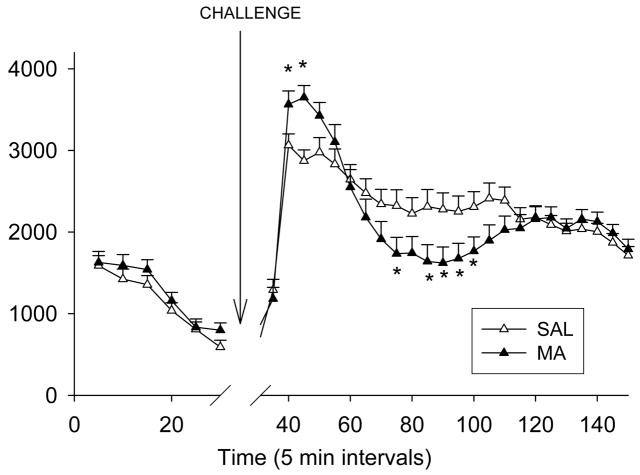
All animals showed re-habituation to the chambers during the 30 min prechallenge period (Time, p < 0.0001). Following the MA challenge, Time, p < 0.0001, and Treatment × Time, F(23, 1725) = 5.40, p < 0.0001 for total distance were significant. Analysis of the interaction showed MA-treated animals, regardless of regimen, were more active 10–15 min post-challenge and less active 45 and 55–70 min post-challenge relative to the SAL-treated animals (Fig. 9).
Figure 9.
Locomotor with MA challenge performance ~50 days after MA administration. Animals were placed for 30 min in the locomotor apparatus used previously during the initial assessment of horizontal activity and stereotypy. Following a 30 min habituation period, animals received MA (1 mg/kg), were replaced back in the apparatus and total distance recorded for another 120 min. The Treatment main effect is shown since no effect of regimen was observed. During the first 10 min following methamphetamine, there was an increase in total distance traveled of MA-treated animals, regardless of regimen. At 40, 50–65 min post-challenge, MA-treated animals, again regardless of regimen, showed hypoactivity compared to SAL animals. (SAL-120min n = 19, MA-120min n = 19, SAL-15min n = 20, MA-15min n = 20). *p ≤ 0.05 MA vs SAL, regardless of regimen
For repetitive beam breaks, Time, p<0.0001, and Treatment × Time, F(23, 1702) = 5.77, p<0.0001 were significant. The MA-treated animals, regardless of regimen, displayed more repetitive beam breaks from 5–10 min and fewer repetitive beam breaks at 45 and 55–70 min post-challenge compared to SAL-treated animals (not shown).
Monoamines
In the neostriatum, MA-treated animals, regardless of regimen, had decreased DA and DOPAC, Treatment, F(1,34) = 11.28 and 8.82, respectively, p<0.01 (Fig. 10A-B). There was no effect on 5-HT (Fig. 10C), however for 5-HIAA (Fig. 10D) MA-treated animals had reduced levels compared to SAL-treated animals, Treatment F(1,34) = 11.10, p<0.01. In the hippocampus (Fig. 10E–F), MA treatment, regardless of regimen, resulted in decreased 5-HT and 5-HIAA compared to SAL-treated animals, Treatment F(1,34) = 140.9 and 225.18, respectively, p<0.0001.
Figure 10.
Monoamine levels in neostriatum (A – D) and hippocampus (E – F) following behavior. MA-treated animals regardless of regimen demonstrated decreased levels of (A) DA, (B) DOPAC, (C) 5-HT, and (D) 5-HIAA in the neostriatum and decreased (E) 5-HT and (F) 5-HIAA in the hippocampus. (SAL-120min n = 10, MA-120min n = 9, SAL-15min n = 9, MA-15min n = 10). open bar = SAL-120min, striped bar = SAL-15min, black bar = MA-120min, gray bar = MA-15min **p ≤ 0.05 MA vs SAL, regardless of regimen.
Discussion
We tested whether differential effects would be produced by employing a short inter-dose treatment interval to better model accumulating plasma MA concentrations as predicted by pharmacokinetic models of human exposure than the typical neurotoxic regimen used in rodents that exceeds the plasma half-life of the drug. We compared the two dosing regimens on separate aspects of MA-induced effects: (1) on markers of neurotoxicity 72 h post-treatment, and (2) on behavior at longer post-treatment intervals. The principal new finding was that, regardless of dosing regimen, MA induced path integration learning deficits in the CWM while sparing spatial navigation in the MWM even though a more demanding procedure in the MWM was used than previously employed to assess spatial ability after MA exposure.
Path integration is conserved in organisms ranging from ants (Wittlinger et al., 2006), to rodents, to humans (Etienne and Jeffery, 2004). It is a form of egocentric learning that relies upon self-movement cues to locate places in an environment based on direction and rate of movement, i.e., trajectory or vector learning (Etienne and Jeffery, 2004). Unlike spatial or allocentric (landmark-based) learning, path integration is dependent on movement cues (primarily internal) rather than visual orientation to distal landmarks (Etienne and Jeffery, 2004). The neural circuits underlying path integration in rats partially overlap with those of spatial navigation inasmuch as some place cells in the hippocampus are activated during path integration, however, path integration depends heavily upon head-direction cells in the presubiculum and grid cells in the entorhinal cortex (Whishaw et al., 1997;Rondi-Reig et al., 2006;Witter and Moser, 2006;Fuhs and Touretzky, 2006;Sargolini et al., 2006;McNaughton et al., 2006). What makes the path integration effects unique following neurotoxic doses of MA is both the magnitude and extent of the deficits: MA-treated animals displayed no evidence of performing as well as controls even after 15 days of testing. By the last day of testing, MA-treated animals had greater than four-fold increases in latency and errors compared to SAL-treated animals. Interestingly, while CWM performance was impaired, no effects on MWM performance, a hippocampally-dependent task (Morris et al., 1982) were observed, despite the use of an extensive, multiphase testing method that has proven sensitive to other drug effects (Vorhees and Williams, 2006). Examination of Figure 8C suggests that the animals given MA may perform better in the MWM, although no statistical differences were noted between groups during this phase. Nonetheless, the lack of MWM effects supports the findings of others of no overall effects of MA on acquisition (Schroder et al., 2003) or reversal learning (Friedman et al., 1998) in the Morris maze, although Friedman et al. did find an effect on a single test day. Whether this represents a meaningful effect remains to be determined. Given that no effects of MA were seen in the MWM, the data demonstrate that it is possible to functionally separate effects on path integration from spatial mapping, despite neural network overlap (Whishaw et al., 1997). We have previously demonstrated a similar result following a single day administration of fenfluramine, that is, effects were observed in the CWM but not the MWM (Williams et al., 2002).
The significance of the path integration deficits in rats in relation to human MA users is not yet known because no human study has assessed this specific function, but it is noteworthy that MA affects cortical regions in humans (Meredith et al., 2005;Barr et al., 2006;Baicy and London, 2007) and path integration is a cortically-mediated function. Moreover, human virtual path integration tasks have recently been developed and used in fMRI experiments to map the locations of path integration in humans (Wolbers et al., 2007). Hence, future studies of this function in MA users may now be feasible.
We also replicated the previous finding of NOR deficits (Bisagno et al., 2002;Schroder et al., 2003;Belcher et al., 2005;He et al., 2006;Belcher et al., 2006). With the effects on NOR reported here, this effect is now the most widely replicated cognitive effect arising from exposure to a neurotoxic dosing regimen of MA and is further strengthened by the fact that both dosing regimens used here caused the same effect. The similarity across dosing regimens was also seen on path integration, i.e., both dosing regimens induced essentially identical effects.
Other learning and memory effects of MA have also been reported. For example, in a test of route or motor learning (in which animals learned a specific path through corridors without choices), Chapman et al. (2001) reported impairments in latency to complete the task. In a later study by the same group, latency was unaffected, although they reported that on the last day of testing there was a significant reduction in a measure of ‘directness’ in the MA-treated group (Chapman et al., 2001;Daberkow et al., 2005). While it is appreciated that the motor learning task above and the CWM involve learning a sequence to solve the task, and the neostriatum has been implicated in sequence learning (Potegal, 1972;Cook and Kesner, 1988), the ability of animals to learn in the CWM may be different. Most notably, the CWM was run under infrared lighting, eliminating distal and local surrounding cues, whereas the motor learning task was run under lighted conditions. We have previously shown that even under low light conditions, animals perform better in the CWM compared to when animals learn under infrared conditions; presumably they use a combination of strategies to solve the maze when light is present [c.f., (Williams et al., 2002;Able et al., 2006)]. The CWM does not offer the animals the ability to know when they have reached the end of an alleyway or are in the center of it as in the motor learning task, therefore, not only do the animals have to learn a sequence of turns, but they must also determine the exact location of each turn, otherwise a “correct turn” could lead to entry in a dead-end channel. At the present time, it is unknown whether the CWM involves striatal functions in its solution and future studies will be necessary to investigate this possibility.
The mechanism(s) of MA-induced deficits in path integration are not yet known. We demonstrated increased GFAP in the neostriatum and decreased monoamines at 72 h after MA administration in both the neostriatum and hippocampus as have others (Bowyer et al., 1994;Cappon et al., 1997;O’Callaghan and Miller, 2002;O’Dell and Marshall, 2002). Given that brain monoamines were reduced 3 days post-treatment and were still reduced (albeit to a somewhat lesser degree) at the end of behavioral testing 2 months later, these data taken together indicate that monoamines were reduced throughout the course of the behavioral experiment; raising the question of whether these reductions mediate the behavioral changes. While it seems likely that DA reductions were involved in the hypolocomotion initially observed in the animals after MA treatment, their role in path integration and NOR remains unknown.
The present experiment does not rule out the possibility that test order or time since treatment may have contributed to the lack of effect in the MWM, but this seems unlikely. No effects on spatial learning following MA with a shorter treatment-to-test interval were seen in another study that used a neurotoxic MA regimen nearly identical to the 2 h regimen in the present experiment (Schroder et al., 2003). Moreover, the deficit in CWM performance observed herein persisted throughout the 15 days of testing. Given that only 2 days elapsed between the end of CWM and the beginning of MWM testing, it is unlikely that 4-fold learning deficits lasting 29 days after treatment would disappear 48 h later. It is clear, however, that an experiment to specifically rule out the possibility of test order or treatment-to-test interval questions will be needed. Furthermore, the present experiment does not address the question of how long the path integration deficits remain.
In addition to the cognitive deficits in the CWM, we also demonstrated that MA-treated animals had reduced locomotor behavior, as shown previously (Wallace et al., 1999). This reduction in locomotion may be a result of the decreased DA observed after MA treatment as suggested above, but this change had no effect on swimming speed measured in either straight channel swimming or in the MWM. We also demonstrated a heightened stimulatory response followed by hypoactivity in MA-treated animals following MA challenge. This suggests increased sensitivity to the DA-releasing effects of MA, but precisely why the response was biphasic is unclear. It does not appear similar to receptor supersensitivity (Iwazaki et al., 2007). An examination of repetitive beam breaks during testing revealed no evidence that MA-induced hyperactivity was replaced by increased focused movements. While repetitive beam breaks are not synonymous with stereotypy, they do capture aspects of focused movements that are part of the spectrum of stereotypic behaviors.
In the present study we demonstrated altered adrenal function as evidenced by increased corticosterone and hypotrophic spleens and thymuses 3 days after MA treatment. Given that the time since treatment exceeded the half-life of MA by more than 60 times, this indicates that no detectable drug would be present to explain the extended corticosterone increase. If increased corticosterone is the result of an altered circadian response or a direct effect on adrenal sensitivity is unknown, but previous studies have demonstrated that MA treatment can alter circadian rhythms (Honma and Honma, 1986), although it seems unlikely that this alone could explain the magnitude and persistence of the CWM impairment.
In order to model human use of MA, several factors have to be considered. These include amount of drug taken, frequency of use, chronicity and ADME (absorption, disposition, metabolism, and elimination). Species differences in elimination rates have been suggested to have significant impact when repetitive dosing is considered as with chronic drug use; that is, when one considers total exposure based on internal dose and area under the curve (AUC) calculations (Cho et al., 2001). Such considerations led us to test the concept that the neurotoxic and behavioral sequelae of the typical neurotoxic dose regimen might be different if a dosing model were used that was designed to produce an internal dose that accumulates to steady-state rather than fluctuating dramatically from one dose to another. We did not take blood samples to measure plasma MA, but rather relied on the modeling data reported previously (Cho et al., 2001) comparing 4 doses given every 2 h to 24 doses given every 15 min matched for total dose, 40 mg/kg. We found no differences on any measure of neurotoxicity (monoamine or GFAP), or learning, or any other behavioral measure except for one difference in stereotypy 1–2 h after the last dose.
The present data demonstrate an unrecognized effect of MA on path integration learning and verified effects on brain GFAP, DA, and 5-HT, and on peripheral corticosterone release, but the results do not establish which of these may be important in the learning effects. We already summarized the evidence that DA is unlikely to be involved. However there is no evidence ruling out roles for 5-HT or corticosterone. The CWM may prove to be useful in future investigations of the above-mentioned or other possible mechanisms underlying the cognitive deficits reported in current and abstinent MA users (Meredith et al., 2005; Barr et al., 2006).
Acknowledgments
Portions of these data were presented at the 15th annual meeting of the International Behavioral Neuroscience Society meeting (May, 2006) in Whistler, BC and at the 7th International Brain Research Organization meeting (July, 2007) in Melbourne, Australia. Research supported by the Scottish Rite Schizophrenia Fellowship and grants from the National Institutes of Health: DA 006733 and DA014269.
Reference List
- Able JA, Gudelsky GA, Vorhees CV, Williams MT. 3,4-Methylenedioxymethamphetamine in adult rats produces deficits in path integration and spatial reference memory. Biol Psychiatry. 2006;59:1219–1226. doi: 10.1016/j.biopsych.2005.09.006. [DOI] [PMC free article] [PubMed] [Google Scholar]
- Baicy K, London ED. Corticolimbic dysregulation and chronic methamphetamine abuse. Addiction. 2007;102(Suppl 1):5–15. doi: 10.1111/j.1360-0443.2006.01777.x. [DOI] [PubMed] [Google Scholar]
- Barr AM, Panenka WJ, MacEwan GW, Thornton AE, Lang DJ, Honer WG, Lecomte T. The need for speed: an update on methamphetamine addiction. J Psychiatry Neurosci. 2006;31:301–313. [PMC free article] [PubMed] [Google Scholar]
- Belcher AM, O’Dell SJ, Marshall JF. Impaired object recognition memory following methamphetamine, but not p-chloroamphetamine- or d-amphetamine-induced neurotoxicity. Neuropsychopharmacology. 2005;30:2026–2034. doi: 10.1038/sj.npp.1300771. [DOI] [PubMed] [Google Scholar]
- Belcher AM, O’Dell SJ, Marshall JF. A sensitizing regimen of methamphetamine causes impairments in a novelty preference task of object recognition. Behav Brain Res. 2006;170:167–172. doi: 10.1016/j.bbr.2006.02.025. [DOI] [PubMed] [Google Scholar]
- Bisagno V, Ferguson D, Luine VN. Short toxic methamphetamine schedule impairs object recognition task in male rats. Brain Res. 2002;940:95–101. doi: 10.1016/s0006-8993(02)02599-4. [DOI] [PubMed] [Google Scholar]
- Bowyer JF, Davies DL, Schmued L, Broening HW, Newport GD, Slikker W, Jr, Holson RR. Further studies of the role of hyperthermia in methamphetamine neurotoxicity. J Pharmacol Exp Ther. 1994;268:1571–1580. [PubMed] [Google Scholar]
- Cadet JL, Jayanthi S, Deng X. Methamphetamine-induced neuronal apoptosis involves the activation of multiple death pathways. Review. Neurotox Res. 2005;8:199–206. doi: 10.1007/BF03033973. [DOI] [PubMed] [Google Scholar]
- Cappon GD, Morford LL, Vorhees CV. Ontogeny of methamphetamine-induced neurotoxicity and associated hyperthermic response. Brain Res Dev Brain Res. 1997;103:155–162. doi: 10.1016/s0165-3806(97)81791-9. [DOI] [PubMed] [Google Scholar]
- Chapman DE, Hanson GR, Kesner RP, Keefe KA. Long-term changes in basal ganglia function after a neurotoxic regimen of methamphetamine. J Pharmacol Exp Ther. 2001;296:520–527. [PubMed] [Google Scholar]
- Cho AK, Melega WP, Kuczenski R, Segal DS. Relevance of pharmacokinetic parameters in animal models of methamphetamine abuse. Synapse. 2001;39:161–166. doi: 10.1002/1098-2396(200102)39:2<161::AID-SYN7>3.0.CO;2-E. [DOI] [PubMed] [Google Scholar]
- Clark RE, Zola SM, Squire LR. Impaired recognition memory in rats after damage to the hippocampus. J Neurosci. 2000;20:8853–8860. doi: 10.1523/JNEUROSCI.20-23-08853.2000. [DOI] [PMC free article] [PubMed] [Google Scholar]
- Cook CE, Jeffcoat AR, Hill JM, Pugh DE, Patetta PK, Sadler BM, White WR, Perez-Reyes M. Pharmacokinetics of methamphetamine self-administered to human subjects by smoking S-(+)-methamphetamine hydrochloride. Drug Metab Dispos. 1993;21:717–723. [PubMed] [Google Scholar]
- Cook CE, Jeffcoat AR, Sadler BM, Hill JM, Voyksner RD, Pugh DE, White WR, Perez-Reyes M. Pharmacokinetics of oral methamphetamine and effects of repeated daily dosing in humans. Drug Metab Dispos. 1992;20:856–862. [PubMed] [Google Scholar]
- Cook D, Kesner RP. Caudate nucleus and memory for egocentric localization. Behav Neural Biol. 1988;49:332–343. doi: 10.1016/s0163-1047(88)90338-x. [DOI] [PubMed] [Google Scholar]
- Daberkow DP, Kesner RP, Keefe KA. Relation between methamphetamine-induced monoamine depletions in the striatum and sequential motor learning. Pharmacol Biochem Behav. 2005;81:198–204. doi: 10.1016/j.pbb.2005.03.010. [DOI] [PubMed] [Google Scholar]
- Davidson C, Gow AJ, Lee TH, Ellinwood EH. Methamphetamine neurotoxicity: necrotic and apoptotic mechanisms and relevance to human abuse and treatment. Brain Res Brain Res Rev. 2001;36:1–22. doi: 10.1016/s0165-0173(01)00054-6. [DOI] [PubMed] [Google Scholar]
- Etienne AS, Jeffery KJ. Path integration in mammals. Hippocampus. 2004;14:180–192. doi: 10.1002/hipo.10173. [DOI] [PubMed] [Google Scholar]
- Fehm HL, Holl R, Steiner K, Klein E, Voigt KH. Evidence for ACTH-unrelated mechanisms in the regulation of cortisol secretion in man. Klin Wochenschr. 1984;62:19–24. doi: 10.1007/BF01725188. [DOI] [PubMed] [Google Scholar]
- Friedman SD, Castaneda E, Hodge GK. Long-term monoamine depletion, differential recovery, and subtle behavioral impairment following methamphetamine-induced neurotoxicity. Pharmacol Biochem Behav. 1998;61:35–44. doi: 10.1016/s0091-3057(98)00066-5. [DOI] [PubMed] [Google Scholar]
- Fuhs MC, Touretzky DS. A spin glass model of path integration in rat medial entorhinal cortex. J Neurosci. 2006;26:4266–4276. doi: 10.1523/JNEUROSCI.4353-05.2006. [DOI] [PMC free article] [PubMed] [Google Scholar]
- Fukumura M, Cappon GD, Broening HW, Vorhees CV. Methamphetamine-induced dopamine and serotonin reductions in neostriatum are not gender specific in rats with comparable hyperthermic responses. Neurotoxicol Teratol. 1998;20:441–448. doi: 10.1016/s0892-0362(97)00094-9. [DOI] [PubMed] [Google Scholar]
- He J, Yang Y, Yu Y, Li X, Li XM. The effects of chronic administration of quetiapine on the methamphetamine-induced recognition memory impairment and dopaminergic terminal deficit in rats. Behav Brain Res. 2006;172:39–45. doi: 10.1016/j.bbr.2006.04.009. [DOI] [PubMed] [Google Scholar]
- Holson RR. Euthanasia by decapitation: evidence that this technique produces prompt, painless unconsciousness in laboratory rodents. Neurotoxicol Teratol. 1992;14:253–257. doi: 10.1016/0892-0362(92)90004-t. [DOI] [PubMed] [Google Scholar]
- Honma K, Honma S. Effects of methamphetamine on development of circadian rhythms in rats. Brain Dev. 1986;8:397–401. doi: 10.1016/s0387-7604(86)80060-2. [DOI] [PubMed] [Google Scholar]
- Iwazaki T, McGregor IS, Matsumoto I. Protein expression profile in the striatum of rats with methamphetamine-induced behavioral sensitization. Proteomics. 2007;7:1131–1139. doi: 10.1002/pmic.200600595. [DOI] [PubMed] [Google Scholar]
- Lindner MD. Reliability, distribution, and validity of age-related cognitive deficits in the Morris water maze. Neurobiol Learn Mem. 1997;68:203–220. doi: 10.1006/nlme.1997.3782. [DOI] [PubMed] [Google Scholar]
- McNaughton BL, Battaglia FP, Jensen O, Moser EI, Moser MB. Path integration and the neural basis of the ‘cognitive map’. Nat Rev Neurosci. 2006;7:663–678. doi: 10.1038/nrn1932. [DOI] [PubMed] [Google Scholar]
- Melega WP, Williams AE, Schmitz DA, DiStefano EW, Cho AK. Pharmacokinetic and pharmacodynamic analysis of the actions of D-amphetamine and D-methamphetamine on the dopamine terminal. J Pharmacol Exp Ther. 1995;274:90–96. [PubMed] [Google Scholar]
- Mendelson J, Uemura N, Harris D, Nath RP, Fernandez E, Jacob P, III, Everhart ET, Jones RT. Human pharmacology of the methamphetamine stereoisomers. Clin Pharmacol Ther. 2006;80:403–420. doi: 10.1016/j.clpt.2006.06.013. [DOI] [PubMed] [Google Scholar]
- Meredith CW, Jaffe C, Ang-Lee K, Saxon AJ. Implications of chronic methamphetamine use: a literature review. Harv Rev Psychiatry. 2005;13:141–154. doi: 10.1080/10673220591003605. [DOI] [PubMed] [Google Scholar]
- Morris RGM, Garrud P, Rawlins JNP, O’Keefe J. Place navigation impaired in rats with hippocampal lesions. Nature. 1982;297:681–683. doi: 10.1038/297681a0. [DOI] [PubMed] [Google Scholar]
- O’Callaghan JP, Miller DB. Neurotoxicity profiles of substituted amphetamines in mice and rats: Challenges to the current dogma. In: Massaro EJ, editor. Handbook of Neurotoxicity. Totowa, NJ: Humana Press; 2002. pp. 269–301. [Google Scholar]
- O’Dell SJ, Marshall JF. Effects of vibrissae removal on methamphetamine-induced damage to rat somatosensory cortical neurons. Synapse. 2002;43:122–130. doi: 10.1002/syn.10016. [DOI] [PubMed] [Google Scholar]
- Potegal M. The caudate nucleus egocentric localization system. Acta Neurobiol Exp (Wars) 1972;32:479–494. [PubMed] [Google Scholar]
- Riviere GJ, Byrnes KA, Gentry WB, Owens SM. Spontaneous locomotor activity and pharmacokinetics of intravenous methamphetamine and its metabolite amphetamine in the rat. J Pharmacol Exp Ther. 1999;291:1220–1226. [PubMed] [Google Scholar]
- Rondi-Reig L, Petit GH, Tobin C, Tonegawa S, Mariani J, Berthoz A. Impaired sequential egocentric and allocentric memories in forebrain-specific-NMDA receptor knock-out mice during a new task dissociating strategies of navigation. J Neurosci. 2006;26:4071–4081. doi: 10.1523/JNEUROSCI.3408-05.2006. [DOI] [PMC free article] [PubMed] [Google Scholar]
- Sargolini F, Fyhn M, Hafting T, McNaughton BL, Witter MP, Moser MB, Moser EI. Conjunctive representation of position, direction, and velocity in entorhinal cortex. Science. 2006;312:758–762. doi: 10.1126/science.1125572. [DOI] [PubMed] [Google Scholar]
- Schroder N, O’Dell SJ, Marshall JF. Neurotoxic methamphetamine regimen severely impairs recognition memory in rats. Synapse. 2003;49:89–96. doi: 10.1002/syn.10210. [DOI] [PubMed] [Google Scholar]
- Sekine Y, Ouchi Y, Takei N, Yoshikawa E, Nakamura K, Futatsubashi M, Okada H, Minabe Y, Suzuki K, Iwata Y, Tsuchiya KJ, Tsukada H, Iyo M, Mori N. Brain serotonin transporter density and aggression in abstinent methamphetamine abusers. Arch Gen Psychiatry. 2006;63:90–100. doi: 10.1001/archpsyc.63.1.90. [DOI] [PubMed] [Google Scholar]
- Szumlinski KK, Haskew RE, Balogun MY, Maisonneuve IM, Glick SD. Iboga compounds reverse the behavioural disinhibiting and corticosterone effects of acute methamphetamine: Implications for their antiaddictive properties. Pharmacol Biochem Behav. 2001;69:485–491. doi: 10.1016/s0091-3057(01)00564-0. [DOI] [PubMed] [Google Scholar]
- United Nations on Drug Control and Crime Prevention . World Drug Report 2006 [Google Scholar]
- Vorhees CV. Maze learning in rats: a comparison of performance in two water mazes in progeny prenatally exposed to different doses of phenytoin. Neurotoxicol Teratol. 1987;9:235–241. doi: 10.1016/0892-0362(87)90008-0. [DOI] [PubMed] [Google Scholar]
- Vorhees CV, Williams MT. Morris water maze: procedures for assessing spatial and related forms of learning and memory. Nat Protocols. 2006;1:848–858. doi: 10.1038/nprot.2006.116. [DOI] [PMC free article] [PubMed] [Google Scholar]
- Wallace TL, Gudelsky GA, Vorhees CV. Methamphetamine-induced neurotoxicity alters locomotor activity, stereotypic behavior, and stimulated dopamine release in the rat. J Neurosci. 1999;19:9141–9148. doi: 10.1523/JNEUROSCI.19-20-09141.1999. [DOI] [PMC free article] [PubMed] [Google Scholar]
- Wang X, Baumann MH, Xu H, Rothman RB. 3,4-methylenedioxymethamphetamine (MDMA) administration to rats decreases brain tissue serotonin but not serotonin transporter protein and glial fibrillary acidic protein. Synapse. 2004;53:240–248. doi: 10.1002/syn.20058. [DOI] [PubMed] [Google Scholar]
- Whishaw IQ, McKenna JE, Maaswinkel H. Hippocampal lesions and path integration. Curr Opin Neurobiol. 1997;7:228–234. doi: 10.1016/s0959-4388(97)80011-6. [DOI] [PubMed] [Google Scholar]
- Williams MT, Herring NR, Schaefer TL, Skelton MR, Campbell NG, Lipton JW, McCrea AE, Vorhees CV. Alterations in Body Temperature, Corticosterone, and Behavior Following the Administration of 5-Methoxy-Diisopropyltryptamine (‘Foxy’) to Adult Rats: a New Drug of Abuse. Neuropsychopharmacology. 2007 doi: 10.1038/sj.npp.1301232. [DOI] [PMC free article] [PubMed] [Google Scholar]
- Williams MT, Morford LL, McCrea AE, Wood SL, Vorhees CV. Administration of d,l-fenfluramine to rats produces learning deficits in the Cincinnati water maze but not the Morris water maze: Relationship to adrenal cortical output. Neurotoxicol Teratol. 2002;24:783–796. doi: 10.1016/s0892-0362(02)00318-5. [DOI] [PubMed] [Google Scholar]
- Williams MT, Morford LL, Wood SL, Wallace TL, Fukumura M, Broening HW, Vorhees CV. Developmental d-methamphetamine treatment selectively induces spatial navigation impairments in reference memory in the Morris water maze while sparing working memory. Synapse. 2003;48:138–148. doi: 10.1002/syn.10159. [DOI] [PubMed] [Google Scholar]
- Williams MT, Schaefer TL, Furay AR, Ehrman LA, Vorhees CV. Ontogeny of the adrenal response to (+)-methamphetamine in neonatal rats: the effect of prior drug exposure. Stress. 2006;9:153–163. doi: 10.1080/10253890600902842. [DOI] [PMC free article] [PubMed] [Google Scholar]
- Wilson JM, Kalasinsky KS, Levey AI, Bergeron C, Reiber G, Anthony RM, Schmunk GA, Shannak K, Haycock JW, Kish SJ. Striatal dopamine nerve terminal markers in human, chronic methamphetamine users. Nat Med. 1996;2:699–703. doi: 10.1038/nm0696-699. [DOI] [PubMed] [Google Scholar]
- Witter MP, Moser EI. Spatial representation and the architecture of the entorhinal cortex. Trends Neurosci. 2006;29:671–678. doi: 10.1016/j.tins.2006.10.003. [DOI] [PubMed] [Google Scholar]
- Wittlinger M, Wehner R, Wolf H. The ant odometer: stepping on stilts and stumps. Science. 2006;312:1965–1967. doi: 10.1126/science.1126912. [DOI] [PubMed] [Google Scholar]
- Wolbers T, Wiener JM, Mallot HA, Buchel C. Differential recruitment of the hippocampus, medial prefrontal cortex, and the human motion complex during path integration in humans. J Neurosci. 2007;27:9408–9416. doi: 10.1523/JNEUROSCI.2146-07.2007. [DOI] [PMC free article] [PubMed] [Google Scholar]


