INTRODUCTION
Microtubules are dynamic components of the cell cytoskeleton that participate in many important cellular processes, including mitosis, cell motility, morphogenesis, and organelle transport (reviewed in Desai and Mitchison, 1997). Microtubules are made up of α/β-tubulin heterodimers that assemble into ∼25 nm cylindrical polymers. Immunofluorescent localization of tubulin has shown that microtubules in interphase tissue cells are for the most part arranged in a radial array with the “minus” end oriented toward a central microtubule organizing center, the centrosome, and the “plus” end radiating toward the cell periphery. Biochemical studies in the 1970s and early 1980s on the assembly–disassembly dynamics of tubulin culminated in the demonstration that microtubules exhibit an unusual form of assembly behavior known as dynamic instability, defined as the coexistence of microtubules in growing and shrinking populations that interconvert infrequently and stochastically (reviewed in Waterman-Storer and Salmon, 1997a). However, corroboration of these studies with real-time microscopic data was difficult, because 25-nm microtubules are ∼10 times below the resolution limit of the light microscope.
This Video Essay provides a review of the ingenious methods that have been developed and applied over the past 10–15 years to the study of microtubule dynamic behavior in living cells. I have not included the many unique microscopic approaches that have been used for the study of microtubule behavior in vitro (for review, see Scholey 1993). Furthermore, this review intends by no means to be exhaustive but summarizes a few highlights in the field of which primary data was generously made available to me from the original authors for digitization and conversion into QuickTime movies. Finally, important advances such as the expression of green fluorescent protein–coupled proteins to follow microtubule dynamics in the ∼6-μm-diameter budding yeast Saccharomyces cerevisiae cell (Shaw et al., 1998) and the use of polarized light microscopy for monitoring microtubule dynamics during mitosis (Inoué and Oldenbourg, 1998) have been omitted from this review, because these topics have been dealt with in detail in recent Video Essays in this series.
VIDEO SEQUENCES
Video Sequence 1: Time-Lapse Fluorescence Microscopy of Individual Microtubule Dynamics in the Lamella of a PtK1 Cell Recorded with a Low–Light Level Intensified Silicon Intensifier Target (ISIT) Camera
The first approach of researchers in the early 1980s to visualizing microtubule dynamics in living cells was with epi-fluorescence microscopy. The wonderful specificity and sensitivity of this method, in which excitation light is excluded from the image and only the fluorescent molecules are seen against a black background, allows the visualization of discrete molecular probes in complex specimens, such a living cells. When used in conjunction with the method of “fluorescent analog cytochemistry,” fluorescence microscopy provided an exceptional tool for studying microtubule dynamic behavior. In this technique, pioneered by Taylor and Wang (1978, 1980) for studies of actin filament dynamics, fluorescent molecules are covalently coupled to purified proteins. The labeled proteins are then microinjected into living cells and incorporated into cellular structures, and their dynamics are visualized by fluorescence microscopy with sensitive low–light level video cameras.
Early microtubule fluorescent analog cytochemistry resulted in the characterization of tubulin diffusion coefficients and microtubule turnover rates in vivo (Salmon et al., 1984a,b; Saxton et al., 1984). Tubulin was coupled to the fluorophore 5-(4,6-dichlorotriazin-2-yl)aminofluorescein (DTAF) (Keith et al., 1981; Wadsworth and Sloboda, 1983) and used for fluorescence recovery after photobleaching experiments. This technique was used to monitor the redistribution of fluorescent microtubules into a region where the fluorescence was bleached by laser illumination (Salmon et al., 1984a,b; Saxton et al., 1984). These studies were aided by the use of illumination shutters to limit exposure of the specimen and low–light level SIT video cameras that contain built-in silicon target intensifiers that multiply by ∼1–5 × 10² the photoelectrons produced when light strikes the camera face (Inoué, 1986). Despite these advances, limits in resolution of the imaging system used and the relatively low quantum yield and rapid bleaching rates of DTAF superceded visualization of the dynamics of individual microtubules.
Improvements in imaging technologies used by Sammak and Borisy (1988a,b) allowed for the first time time-lapse views of dynamic instability of individual microtubule plus ends in thin regions at the periphery of living cells. These researchers used a higher-resolution imaging system, digital summing of video images to reduce noise (Inoué, 1986), and a much more photostable and quantum efficient fluorophore, 5/6-carboxy-X-rhodamine-N-succinimide (X-rhodamine). Their method has proved to be extremely successful and has been used extensively for many studies of microtubule dynamics to the present, with only minor modifications such as the choice of fluorophore and camera detector.
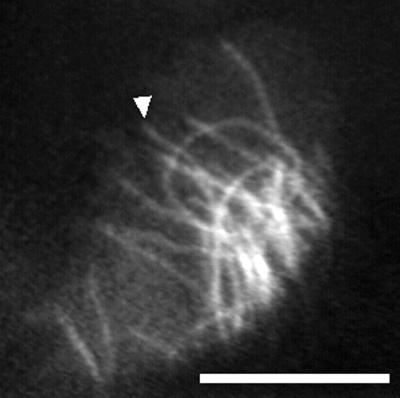
An example of recent use by Wadsworth’s group (Shelden et al., 1993; Yvon and Wadsworth, 1997) of fluorescent analog cytochemistry for following individual microtubule dynamics is shown in Figure 1 (contributed by P. Wadsworth and A.M. Yvon) and Video Sequence 1. These show the dynamics of tetramethylrhodamine-tubulin–labeled microtubules in the periphery of a PtK1 cell. The time-lapse images in the series shown in Video Sequence 1 were acquired at 2-s intervals with an ISIT camera (a SIT camera with an additional intensifier is coupled to it) with 32-frame averaging to increase the signal-to-noise ratio and illumination shuttered between exposures. The field diaphragm was closed down to vignette the area of illumination, reducing both cellular photodamage and background fluorescence. Microtubules can be seen to slowly grow, rapidly shorten, and stochastically switch between growing and shortening, exhibiting the characteristic behavior known as dynamic instability (for example, the one highlighted by the arrow in Figure 1). Because of problems with fluorescence photobleaching, the sequence is relatively short.
Figure 1.
Tetramethylrhodamine-labeled microtubules in the lamella of a PtK1 cell imaged with an ISIT camera. See text for details. Bar, 10 μm. Courtesy of P. Wadsworth and A.M. Yvon.
Video Sequence 2: Video-enhanced Differential Interference Contrast (VE-DIC) Imaging of Microtubule Dynamics in the Lamella of a Newt Lung Epithelial Cell
Around the same time that fluorescent analog cytochemistry techniques were being used to study microtubule dynamics, Salmon and coworkers applied methods for electronic enhancement of transmitted light video images to achieve the first noninvasive, real-time observation of the behavior of individual microtubules in cells (Cassimeris et al., 1988). Although microtubule fluorescent analog cytochemistry was revolutionary, problems with phototoxicty and photobleaching superceded the possibility of continuous recording of microtubule behavior in cells. Thus, it was impossible to accurately measure the parameters of dynamic instability because of long intervals between the acquisition of successive fluorescence images.
The problems of fluorescent analog cytochemistry were overcome by using VE-DIC microscopy on the very thin lamella region of cells. DIC microscopy uses polarized light to produce contrast at regions in a specimen where there is a gradient in optical path, such as at the interface between a protein structure and aqueous environment. This results in brightness or darkness along the edges of the regions of a differing optical path, giving the characteristic “shadow cast” appearance of DIC images (reviewed in Salmon and Tran, 1998). The pioneering work in the early 1980s by Allen et al. (1981) and Inoué (1981) on electronic enhancement of video DIC images allowed the detection of objects far below the theoretical limit of resolution of the DIC microscope (∼0.2 μm using 540-nm illumination) and differing very little in optical path from the surrounding medium. Their developments included contrast enhancement, digital image processing, background subtraction, and frame averaging (reviewed in Allen, 1985; Inoué, 1989). This together with Salmon’s development of methods for computer-assisted tracking of microtubule ends in real-time video images (Walker et al., 1988) allowed accurate determination of microtubule growth and shortening velocities and transition frequencies.
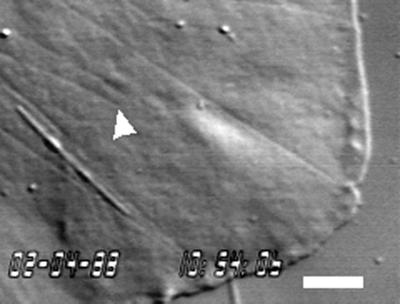
Microtubule dynamics in the lamella of a newt lung epithelial cell using VE-DIC and recorded with a high-resolution Newvicon video camera are shown in Figure 2 (contributed by L. Cassimeris and E.D. Salmon) and Video Sequence 2. The thin filaments pointing toward the leading edge of the cell (for example, the one highlighted by the arrow in Figure 2) were confirmed to be microtubules by correlative immunofluorescent localization of tubulin. In the video, microtubules can be seen to stochastically grow and shorten, exhibiting dynamic instability. The movement of a long, refractile organelle, probably a mitochondria, can also be seen.
Figure 2.
Microtubules in the lamella of a newt lung epithelial cell imaged using VE-DIC microscopy. See text for details. Bar, 5 μm. Courtesy of L. Cassimeris and E.D. Salmon.
Video Sequence 3: Photoactivation of Caged Fluorescein Tubulin Demonstrates Poleward Microtubule flux in the Mitotic Spindle of a PtK2 Cell
Testing the current models of mitosis in the early 1980s were met by yet another technical challenge: direct observation of spindle microtubule dynamics. Fluorescent analog cytochemistry offered beautiful views of individual microtubule dynamics in the periphery of interphase cells where microtubules were sparse. However, in the tissue cell mitotic spindle, there are >1000 microtubules arranged in an antiparallel array, with chromosomes being tethered at their kinetochores to spindle poles by bundles of kinetochore microtubules (reviewed in Hyman and Karsenti, 1998). Problems of uniform labeling of microtubules and high background fluorescence from unincorporated fluorescent tubulin made it impossible visualize individual microtubule dynamics in the mitotic spindle. To monitor spindle microtubule dynamics, fluorescent spindle microtubules in tissue cells were marked by laser photobleaching of DTAF tubulin (Wadsworth and Salmon, 1986). Using this method, kinetochore fiber microtubules were shown to be relatively stable, whereas nonkinetochore spindle microtubules were much more dynamic. Around the same time, forward incorporation studies in fixed cells were performed in which microinjected biotinylated tubulin was shown by electron microscopy to continually incorporate into the plus (kinetochore-attached) ends of kinetochore fibers throughout metaphase (Mitchison et al., 1986). This result predicted that bleached marks on spindle microtubules in living cells should move poleward. However, the laser photobleaching experiments were unable to detect poleward movement of kinetochore microtubules (Wadsworth and Salmon, 1986). Kinetochore microtubules represent a minor fraction of the microtubules in the spindle. As a consequence, recovery of fluorescence of nonkinetochore microtubules in the bleached zone obscured the behavior of the bleached marks on the more stable kinetochore fibers.
Mitchison (1989) solved this problem by developing the method of photoactivation of fluorescence to examine microtubule dynamics in mitosis. Mitchison synthesized a nonfluorescent (“caged”) derivative of carboxyfluorescein that could be converted to a fluorescent form by exposure to 360-nm UV light (“uncaged”). This probe was coupled to tubulin, microinjected into cells, and incorporated into mitotic spindles. The spindle was exposed to a narrow bar of UV light that was produced by a slit in the field plane of the epi-illumination pathway. Spindle microtubules were thus marked by a region of fluorescent subunits. The positions of the marks were then monitored by fluorescence video microscopy.
Photoactivation of fluorescence offered two distinct advantages over photobleaching (Mitchison, 1989). The first was signal to noise; the bright fluorescent marks on stable kinetochore fibers persisted as the fluorescent marks on the nonkinetochore microtubules disappeared as dynamic instability released the fluorescent subunits into the dark cellular background. The second advantage of the photoactivation technique was reduction of fluorescence photodamage and photocrosslinking, artifacts that are possible with the laser bleach method.
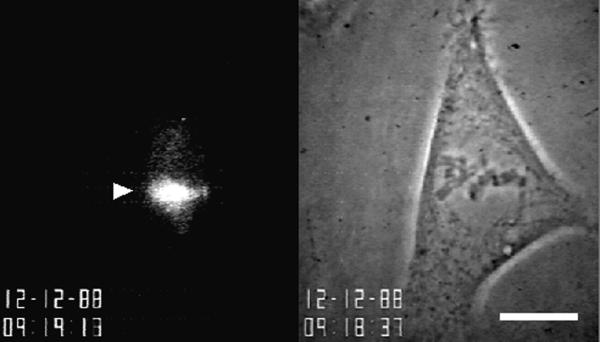
Figure 3 (contributed by T.J. Mitchison) and Video Sequence 3 show an example of a fluorescent photoactivation experiment. On the left is the phase-contrast image of a metaphase PtK2 cell taken just before photoactivation, and on the right is the fluorescence image of photoactivated fluorescein tubulin (arrowhead) in the lower half-spindle. Electronic shutters were used to switch between transmitted and epi-illumination for sequential phase and fluorescence images and to minimize illumination time. In the video sequence (Sequence 3), the slow, steady poleward movement of subunits in the kinetochore microtubules and disassembly at the poles at ∼0.5 μm/min is apparent as the fluorescent region moves downward and disappears at the spindle pole. Intermittent phase-contrast images were taken to demonstrate that the cell did not enter anaphase during the observation period. Mitchison termed this dynamic behavior of kinetochore microtubules “polewards flux.”
Figure 3.
Photoactivation of caged fluorescein microtubule fluorescence in the mitotic spindle. On the left is the phase-contrast image of a metaphase PtK2 cell taken just before photoactivation, and on the right is the fluorescence image of photoactivated fluorescein tubulin (arrowhead) in the lower half-spindle. Bar, 25 μm. Courtesy of T.J. Mitchison.
Video Sequence 4: Microtubule Dynamics in Growth Cones during Axon Elongation Recorded with a Cooled Charge-coupled Device (CCD) Digital Camera and Suppression of Photobleaching
Not long after the characterization of microtubule dynamic instability in vitro, Kirschner and Mitchison (1986) hypothesized that cellular morphogenetic processes may be mediated by selective stabilization of a subset of microtubules. An example of this is the acquisition of an extended, polarized cell shape, such as axonal outgrowth from a neuron. This hypothesis was not testable at the time, because the photobleaching problems associated with fluorescence analog cytochemistry precluded extensive observation periods, and the VE-DIC method was only applicable to certain cell types that were extremely flat and thin.
To examine the role of microtubules in axon outgrowth, Tanaka and Kirschner (1991) designed a special specimen chamber to inhibit photodamage and photobleaching to allow for long-term observation of microtubule dynamics. The photobleaching reaction for most commonly used fluorophores is oxygen dependent and produces a reactive oxygen species that induces cellular damage. Their chamber provided a relatively anoxic environment for observation at high resolution. The specimen was suspended in degassed media under nitrogen with a surrounding well containing chemical oxygen scavengers.
Tanaka and Kirschner (1991) were also the first to use a solid-state, cooled CCD camera for imaging microtubule dynamics. CCDs are made up of arrays of discrete photosensitive areas (pixels) that generate charge in proportion to light exposure (reviewed in Berland et al., 1998). The charges in the array are read out of the CCD by a computer and recombined digitally to form an image. CCD cameras provide linear response and distortion-free images and, when cooled to reduce thermally generated signal, have a remarkable signal-to-noise ratio. This combination of photobleaching suppression and the cooled CCD camera allowed for long-term observation of individual microtubule dynamics at relatively frequent image acquisition intervals during axon outgrowth.
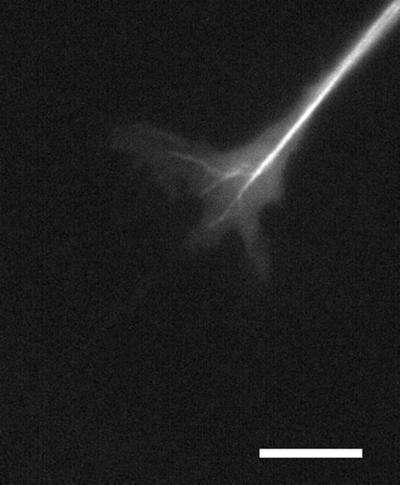
Figure 4 (contributed by E. Tanaka and M. Kirschner) and Video Sequence 4 show an example of tetramethylrhodamine microtubule dynamics in a Xenopus neuronal growth cone. This sequence displays the typical splaying and looping of dynamic microtubules in the growth cone followed by bundling of microtubules as the growth cone advances and the axon extends.
Figure 4.
Rhodamine microtubules in a Xenopus neuronal growth cone imaged under anoxic conditions with a cooled CCD camera. See text for details. Bar, 10 μm. Courtesy of E. Tanaka, D. Odde, and M. Kirschner.
Since this development by Tanaka and Kirschner, simpler enzymatic methods for inhibiting photobleaching (Waterman-Storer et al., 1993; Mikhailov and Gundersen, 1995) have been developed, and cooled CCD cameras have improved in their speed, quantum efficiency, dynamic range, resolution, and signal-to-noise ratio (Berland et al., 1998). This combination of technologies has been exploited recently to study microtubule behavior in cells and has resulted in many new and exciting discoveries about microtubule dynamics in vivo (reviewed in Waterman-Storer and Salmon, 1997).
Video Sequence 5: Interactions between Microtubules and Endoplasmic Reticulum (ER) Membrane Tubules in Living Cells Demonstrated with Multiple-Wavelength Digital Fluorescence Microscopy
Although a clearer picture of microtubule dynamic behavior in living cells was emerging, how microtubules interacted in vivo with other cellular structures and organelles was not well studied. For example, characterization of the movement of ER membrane tubules in living cells by Terasaki and colleagues suggested that movements of ER were powered by microtubule motors (reviewed in Terasaki and Jaffee, 1993). However, work from in vitro studies had suggested several distinct mechanisms for the microtubule-based transport of ER (Waterman-Storer et al., 1995). To determine how ER moved on microtubules in vivo required that the two structures be imaged simultaneously in living cells.
Development by Taylor and colleagues of multiple-wavelength digital fluorescence imaging allowed simultaneous observation of several different cellular structures labeled with spectrally distinct fluorophores (Waggoner et al., 1989). These imaging systems use filter wheels to select the fluorescence excitation wavelength for the specific probe(s) and a filter wheel to select the corresponding dichromatic mirror and emission filter. Alternatively, excitation filter wheels can be used in conjunction with multiple-bandpass dichromatic mirrors and emission filters (Salmon et al., 1998). Computer control of digital camera image acquisition, shutters, and motorization of filter wheels allows for rapid successive imaging of different structures labeled with different fluorophores. The images of each fluorescent structure are then digitally processed, “overlaid” so that the relationship between the structures can be visualized in detail, and positionally and temporally analyzed.
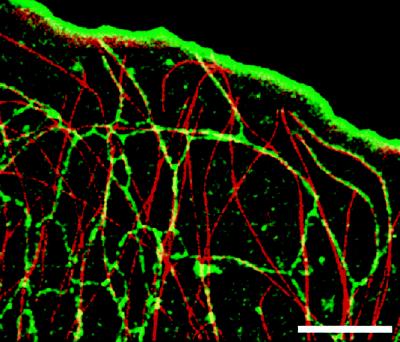
We used multiple-wavelength digital fluorescence microscopy to analyze the interactions between ER membranes and microtubule dynamics (Waterman-Storer and Salmon, 1998a). ER was labeled with the vital dye DiOC6(3) (a method developed by M. Terasaki [Terasaki and Jaffee, 1993]), and microtubules were visualized by microinjection of X-rhodamine–tubulin. Images were collected with a slow-scan cooled CCD camera, and photobleaching was suppressed with the oxygen-scavenging enzyme system Oxyrase (Oxyrase, Ashland, OH) (Waterman-Storer et al., 1993; Mikhailov and Gundersen, 1995). The ER images were digitally processed to enhance their tubular structure and remove background staining of the plasma membrane. Microtubule images were processed to remove background of nonpolymerized labeled tubulin in the cell. The images were then color coded, with ER green and microtubules red, and combined into a single 24-bit red–green–blue (RGB) image (Waterman-Storer et al., 1997). Figure 5 and Video Sequence 5 (C.M. Waterman-Storer and E.D. Salmon) show an example of the this method. The video sequence demonstrates the extension and retraction of ER tubules along dynamic microtubules, the extension of ER tubules by their attachment to growing microtubule plus ends, and the simultaneous retrograde flow of both structures toward the cell center.
Figure 5.
Codistribution of microtubules and ER in the lamella of an epithelial cell imaged using digital multi-wavelength fluorescence microscopy. Images were color coded, with ER green and microtubules red, and combined into a single 24-bit RGB image. Bar, 10 μm.
Video Sequence 6: Relationships between Microtubule Dynamics and Retrograde Flow at the Leading Edge of a Migrating Cell Demonstrated by Multimode Digitally Enhanced DIC and Fluorescence Microscopy
The question of how microtubules became dynamically remodeled during cell migration was next approached using digital multimode microscopy. Migrating cells at their leading edges facing the direction of migration typically exhibit retrograde flow of membrane-associated components on the cell surface and actin filaments within in the cell cortex. To determine how microtubule dynamics and distribution were affected by retrograde flow in migrating cells, we used a digital multimode microscope system developed by E.D. Salmon (Waterman-Storer and Salmon, 1997b, Salmon et al., 1998). This system allows simultaneous visualization of cell surface dynamics by time-lapse digitally enhanced DIC microscopy and microtubule dynamics by fluorescent analog cytochemistry. Our instrument uses an electronic filter wheel containing the DIC analyzer in the aperture plane just in front of the camera. DIC images are collected using transmitted light shuttered between exposures and the DIC analyzer in the light path. To alternate with fluorescence images, the analyzer is rotated out of the light path, a shutter in the epi-illumination pathway is opened, and a fluorescence image is acquired. Shutter and filter wheel timing and position are computer controlled, and images are collected with a wide-dynamic-range, cooled CCD camera. The DIC and fluorescence images are then separately enhanced by digital image processing to increase contrast and reduce background and then combined into a 24-bit RGB image.
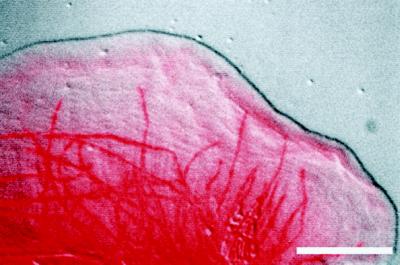
Figure 6 and Video Sequence 6 (Waterman-Storer and Salmon) show microtubules by microinjected X-rhodamine–tubulin in red and the DIC image of the cell surface in gray scale. In the video, the retrograde flow of DIC refractile material at the leading edge is apparent. As microtubules grow into the lamellipodia at the extreme periphery of the cell, they bend and then flow rearward at the same rate as cell surface ridges.
Figure 6.
Microtubules, visualized by microinjected X-rhodamine tubulin microtubules in red and the DIC image of the cell surface in gray scale in the leading edge of a migrating epithelial cell imaged with a digital multimode microscope system. Bar, 10 μm.
Video Sequence 7: Future Applications—Microtubule Dynamics in Thick Regions of Cells Visualized by Fluorescent Speckle Microscopy
We have recently developed a fluorescent “speckle microscopy” method using conventional wide-field fluorescence light microscopy and digital imaging with a low-noise, cooled CCD camera that reveals the assembly dynamics, movement, and turnover of microtubules throughout the image field of view at diffraction-limited resolution (Waterman-Storer et al., 1998, 1999). As noted previously, microtubule fluorescent analog cytochemistry is plagued by problems of high background fluorescence from out-of-focus fluorescence and unincorporated fluorescent tubulin and the inability to detect microtubule movement due to uniform fluorescent labeling of microtubules. Although the photoactivation technique provides information about the movement of microtubules, detection of movement is limited to a very defined cellular region. In contrast, fluorescent speckle microscopy significantly reduces out-of-focus fluorescence and greatly improves visibility of microtubules and their dynamics in thick regions of living cells and also provides fiduciary marks of the microtubule lattice for monitoring microtubule movement throughout the field of view. This technology should greatly aid the study of microtubule dynamics in thick cells, in mitotic spindles, and in tissues.
Fluorescent speckle microscopy requires that the fraction of fluorescently labeled tubulin dimers in the cell be very low (0.01–0.25%) relative to the level of endogenous tubulin. Labeled and unlabeled dimers stochastically coassemble into microtubules, giving a random and sparse distribution of fluorescent subunits with a speckled appearance in high-resolution fluorescence images (Waterman-Storer and Salmon, 1997b, 1998b). The low level of unincorporated fluorescent subunits reduces background fluorescence. Because the speckle pattern is dependent on microtubule growth, it does not change over time in an assembled microtubule and thus serves as a series of fiduciary marks on the microtubule lattice. Movement of the fluorescent speckle pattern indicates microtubule movement, whereas changes in speckle distribution indicate microtubule growth and shortening.
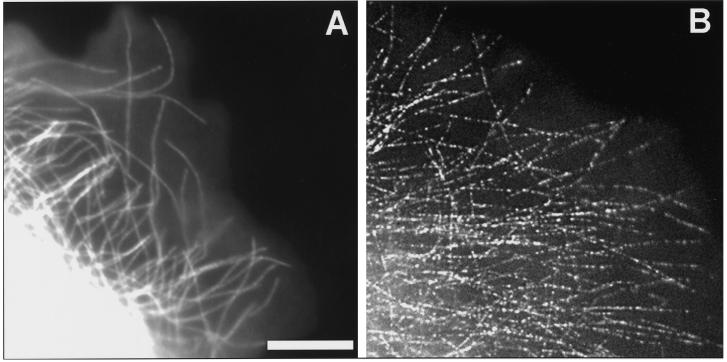
Figure 7 and Video Sequence 7 (Waterman-Storer and Salmon) show an example application of fluorescent speckle microscopy of fluorescent microtubules in the lamella of a cell. Figure 7 compares diffraction-limited conventional (∼10% labeled tubulin) and speckle (∼0.1% labeled tubulin) fluorescent images of microtubules in the lamella of epithelial cells injected with X-rhodamine–labeled tubulin. In the conventional image, individual microtubules are evident at the extreme periphery of the cell but are invisible above the high background fluorescence because of unincorporated labeled tubulin in more proximal regions of the lamella. In the speckle image, the background fluorescence is very low, and there is generally 1–3 μm between the brightest peaks in fluorescence intensity along microtubules, rendering individual microtubules visible in both proximal and distal regions of the lamella. In Video Sequence 7, time-lapse speckle microscopy shows individual microtubules growing and shortening throughout the lamella, seen by appearance and disappearance of linear arrays of fluorescent speckles.
Figure 7.
Comparison of diffraction-limited conventional (left, ∼10% labeled tubulin) and speckle (right, ∼0.25% labeled tubulin) fluorescent images of microtubules in the lamella of an epithelial cell injected with X-rhodamine–labeled tubulin. See text for details. Bar, 10 μm.
Fluorescent speckle microscopy is useful for analyzing many microtubule-related phenomena. We have used fluorescent speckle microscopy to monitor in living cells microtubule “treadmilling,” microtubule translocation (Waterman-Storer and Salmon, 1997b), astral microtubule assembly dynamics in mitotic spindles, and poleward flux of spindle microtubules (Waterman-Storer et al., 1998). We have also found it useful for analyzing the dynamics of microtubules in mitotic spindles assembled in vitro in extracts of Xenopus laevis eggs (Waterman-Storer et al., 1998). We are currently developing speckle microscopy techniques for analyzing in vivo the binding of fluorescently labeled microtubule-associated proteins to microtubules and the turnover of fluorescently labeled actin.
Conclusions
Microscopic analysis of microtubule behavior in living cells has provided great advances in our understanding of this dynamic component of the cytoskeleton. The current trend in computer automation of microscopes, digital imaging, digital manipulation of images via such techniques as deconvolution for removal of out-of-focus fluorescence (reviewed in Wang, 1998), and multiple-photon laser confocal imaging provide exciting tools for solving problems of import in microtubule biology in the future.
Supplementary Material
ACKNOWLEDGMENTS
I thank Pat Wadsworth, Ann Marie Yvon, Lynne Cassimeris, Ted Salmon, Tim Mitchison, Elly Tanaka, and Marc Kirschner for their generous contributions of image series. I thank Dave Odde for providing me with digitized versions of Elly Tanaka’s data and Julie Canman and E.D. Salmon for comments on the manuscript. I am grateful to E.D. Salmon, a great pioneer in this field and an intellectual inspiration to me, who has provided me with the facility to write this paper and to digitize original video data contributions for conversion into QuickTime movies. This work was supported by a fellowship from the Jane Coffin Childs Memorial Fund for Cancer Research. Research by C.M.W.-S. was done in the lab of E.D. Salmon and supported by National Institutes of Health grant GM24364.
Footnotes
REFERENCES
- Allen RD. New observations on cell architecture and dynamics by video-enhanced contrast optical microscopy. Annu Rev Biophys Biophys Chem. 1985;14:265–290. doi: 10.1146/annurev.bb.14.060185.001405. [DOI] [PubMed] [Google Scholar]
- Allen RD, Allen NS, Travis JL. Video-enhanced contrast, differential interference contrast (AVEC-DIC) microscopy: a new method capable of analyzing microtubule-related motility in the reticulopodial network of Allogromia. Cell Motil. 1981;1:291–302. doi: 10.1002/cm.970010303. [DOI] [PubMed] [Google Scholar]
- Berland K, Jacobsen K, French T. Electronic cameras for low light microscopy. Methods Cell Biol. 1998;56:19–44. doi: 10.1016/s0091-679x(08)60419-7. [DOI] [PubMed] [Google Scholar]
- Cassimeris L, Pryer NK, Salmon ED. Real-time observations of microtubule dynamic instability in living cells. J Cell Biol. 1988;107:2223–2231. doi: 10.1083/jcb.107.6.2223. [DOI] [PMC free article] [PubMed] [Google Scholar]
- Desai A, Mitchison TJ. Microtubule polymerization dynamics. Annu Rev Cell Dev Biol. 1997;13:83–117. doi: 10.1146/annurev.cellbio.13.1.83. [DOI] [PubMed] [Google Scholar]
- Hyman, A.T., and Karsenti, E. (1998). J. Cell Sci. [DOI] [PubMed]
- Inoué S. Video image processing greatly enhances contrast, quality, and speed in polarization-based microscopy. J Cell Biol. 1981;89:346–356. doi: 10.1083/jcb.89.2.346. [DOI] [PMC free article] [PubMed] [Google Scholar]
- Inoué S. Video Microscopy. New York: Plenum Press; 1986. [Google Scholar]
- Inoué S. Imaging of unresolved objects, superresolution, and precision of distance measurement with video microscopy. Methods Cell Biol. 1989;30:85–112. doi: 10.1016/s0091-679x(08)60976-0. [DOI] [PubMed] [Google Scholar]
- Inoué S, Oldenbourg R. Microtubule dynamics in mitotic spindle displayed by polarized light microscopy. Mol Biol Cell. 1998;9:1603–1607. doi: 10.1091/mbc.9.7.1603. [DOI] [PMC free article] [PubMed] [Google Scholar]
- Keith CH, Feramisco JR, Shelanski M. Direct visualization of fluorescein-labeled microtubules in vitro and in microinjected fibroblasts. J Cell Biol. 1981;88:234–240. doi: 10.1083/jcb.88.1.234. [DOI] [PMC free article] [PubMed] [Google Scholar]
- Kirschner M, Mitchison T. Beyond self-assembly: from microtubules to morphogenesis. Cell. 1986;45:329–342. doi: 10.1016/0092-8674(86)90318-1. [DOI] [PubMed] [Google Scholar]
- Mikhailov AV, Gundersen GG. Centripetal transport of microtubules in motile cells. Cell Motil Cytoskeleton. 1995;32:173–186. doi: 10.1002/cm.970320303. [DOI] [PubMed] [Google Scholar]
- Mitchison TJ. Polewards microtubule flux in the mitotic spindle: evidence from photoactivation of fluorescence. J Cell Biol. 1989;109:637–652. doi: 10.1083/jcb.109.2.637. [DOI] [PMC free article] [PubMed] [Google Scholar]
- Mitchison T, Evans L, Schulze E, Kirschner M. Sites of microtubule assembly and disassembly in the mitotic spindle. Cell. 1986;45:515–527. doi: 10.1016/0092-8674(86)90283-7. [DOI] [PubMed] [Google Scholar]
- Salmon ED, Leslie RJ, Saxton WM, Karow ML, McIntosh JR. Spindle microtubule dynamics in sea urchin embryos: analysis using a fluorescein-labeled tubulin and measurements of fluorescence redistribution after laser photobleaching. J Cell Biol. 1984a;99:2165–2174. doi: 10.1083/jcb.99.6.2165. [DOI] [PMC free article] [PubMed] [Google Scholar]
- Salmon ED, Saxton WM, Leslie RJ, Karow ML, McIntosh JR. Diffusion coefficient of fluorescein-labeled tubulin in the cytoplasm of embryonic cells of a sea urchin: video image analysis of fluorescence redistribution after photobleaching. J Cell Biol. 1984b;99:2157–2164. doi: 10.1083/jcb.99.6.2157. [DOI] [PMC free article] [PubMed] [Google Scholar]
- Salmon ED, Shaw SL, Waters J, Waterman-Storer CM, Maddox PS, Yeh E, Bloom K. A high resolution multimode microscope system. Methods Cell Biol. 1998;56:185–214. [PMC free article] [PubMed] [Google Scholar]
- Salmon ED, Tran P. High-resolution video-enhanced differential interference contrast (VE-DIC) light microscopy. Methods Cell Biol. 1998;56:153–184. doi: 10.1016/s0091-679x(08)60426-4. [DOI] [PubMed] [Google Scholar]
- Sammak PJ, Borisy GG. Direct observation of microtubule dynamics in living cells. Nature. 1988a;332:724–726. doi: 10.1038/332724a0. [DOI] [PubMed] [Google Scholar]
- Sammak PJ, Borisy GG. Detection of single fluorescent microtubules and methods for determining their dynamics in living cells. Cell Motil Cytoskeleton. 1998b;10:237–245. doi: 10.1002/cm.970100128. [DOI] [PubMed] [Google Scholar]
- Saxton WM, Stemple DL, Leslie RJ, Salmon ED, Zavortink M, McIntosh JR. Tubulin dynamics in cultured mammalian cells. J Cell Biol. 1984;99:2175–2186. doi: 10.1083/jcb.99.6.2175. [DOI] [PMC free article] [PubMed] [Google Scholar]
- Scholey JM, editor. Motility Assays for Motor Proteins. San Diego: Academic Press; 1993. [Google Scholar]
- Shaw SL, Maddox P, Skibbens RV, Yeh E, Salmon ED, Bloom K. Nuclear and spindle dynamics in budding yeast. Mol Biol Cell. 1998;9:1627–1631. doi: 10.1091/mbc.9.7.1627. [DOI] [PMC free article] [PubMed] [Google Scholar]
- Shelden E, Wadsworth P. Observation and quantification of individual microtubule behavior in vivo: microtubule dynamics are cell-type specific. J Cell Biol. 1993;120:935–945. doi: 10.1083/jcb.120.4.935. [DOI] [PMC free article] [PubMed] [Google Scholar]
- Tanaka, E.M., and Kirschner, M.W. Microtubule behavior in the growth cones of living neurons during axon elongation. J. Cell Biol. 115, 345–363. [DOI] [PMC free article] [PubMed]
- Taylor DL, Wang YL. Molecular cytochemistry: incorporation of fluorescently labeled actin into living cells. Proc Natl Acad Sci USA. 1978;75:857–861. doi: 10.1073/pnas.75.2.857. [DOI] [PMC free article] [PubMed] [Google Scholar]
- Taylor DL, Wang YL. Fluorescently labelled molecules as probes of the structure and function of living cells. Nature. 1980;284:405–410. doi: 10.1038/284405a0. [DOI] [PubMed] [Google Scholar]
- Terasaki M, Jaffe LA. Imaging endoplasmic reticulum in living sea urchin eggs. Methods Cell Biol. 1993;38:211–220. doi: 10.1016/s0091-679x(08)61004-3. [DOI] [PubMed] [Google Scholar]
- Wadsworth P, Salmon ED. Analysis of the treadmilling model during metaphase of mitosis using fluorescence redistribution after photobleaching. J Cell Biol. 1986;102:1032–1038. doi: 10.1083/jcb.102.3.1032. [DOI] [PMC free article] [PubMed] [Google Scholar]
- Wadsworth P, Sloboda RD. Microinjection of fluorescent tubulin into dividing sea urchin cells. J Cell Biol. 1983;97:1249–1254. doi: 10.1083/jcb.97.4.1249. [DOI] [PMC free article] [PubMed] [Google Scholar]
- Waggoner A, DeBiasio R, Conrad P, Bright GR, Ernst L, Ryan K, Nederlof M, Taylor DL. Multiple spectral parameter imaging. Methods Cell Biol. 1989;30:449–478. doi: 10.1016/s0091-679x(08)60990-5. [DOI] [PubMed] [Google Scholar]
- Walker RA, O’Brien ET, Pryer NK, Soboeiro MF, Voter WA, Erickson HP, Salmon ED. Dynamic instability of individual microtubules analyzed by video light microscopy: rate constants and transition frequencies. J Cell Biol. 1988;107:1437–1448. doi: 10.1083/jcb.107.4.1437. [DOI] [PMC free article] [PubMed] [Google Scholar]
- Wang YL. Digital deconvolution of fluorescence images for biologists. Methods Cell Biol. 1998;56:305–315. doi: 10.1016/s0091-679x(08)60432-x. [DOI] [PubMed] [Google Scholar]
- Waterman-Storer CM, Desai A, Bulinski JC, Salmon ED. Fluorescent speckle microscopy: visualizing the movement, assembly, and turnover of macromolecular assemblies in living cells. Curr Biol. 1998;8:1227–1230. doi: 10.1016/s0960-9822(07)00515-5. [DOI] [PubMed] [Google Scholar]
- Waterman-Storer CM, Desai A, Salmon ED. Fluorescent speckle microscopy of spindle microtubule assembly and motility in living cells. Methods Cell Biol. 1999;61:155–173. doi: 10.1016/s0091-679x(08)61980-9. [DOI] [PubMed] [Google Scholar]
- Waterman-Storer CM, Gregory J, Parsons SF, Salmon ED. Membrane/microtubule tip attachment complexes (TACs) allow the assembly dynamics of plus ends to push and pull membranes into tubulovesicular networks in interphase Xenopus egg extracts. J Cell Biol. 1995;130:1161–1169. doi: 10.1083/jcb.130.5.1161. [DOI] [PMC free article] [PubMed] [Google Scholar]
- Waterman-Storer CM, Salmon ED. Microtubule dynamics: treadmilling comes around again. Curr Biol. 1997a;7:R369–R372. doi: 10.1016/s0960-9822(06)00177-1. [DOI] [PubMed] [Google Scholar]
- Waterman-Storer CM, Salmon ED. Actomyosin-based retrograde flow of microtubules in the lamella of migrating epithelial cells influences microtubule dynamic instability and turnover and is associated with microtubule breakage and treadmilling. J Cell Biol. 1997b;139:417–434. doi: 10.1083/jcb.139.2.417. [DOI] [PMC free article] [PubMed] [Google Scholar]
- Waterman-Storer CM, Salmon ED. Endoplasmic reticulum membrane tubules are distributed in living cells by three distinct microtubule dependent mechanisms. Curr Biol. 1998a;8:798–806. doi: 10.1016/s0960-9822(98)70321-5. [DOI] [PubMed] [Google Scholar]
- Waterman-Storer CM, Salmon ED. How microtubules get fluorescent speckles. Biophys J. 1998b;75:2059–2069. doi: 10.1016/S0006-3495(98)77648-9. [DOI] [PMC free article] [PubMed] [Google Scholar]
- Waterman-Storer CM, Sanger JW, Sanger JM. Dynamics of organelles in the mitotic spindles of living cells: membrane and microtubule interactions. Cell Motil Cytoskeleton. 1993;26:19–39. doi: 10.1002/cm.970260104. [DOI] [PubMed] [Google Scholar]
- Waterman-Storer CM, Shaw SL, Salmon ED. Production and presentation of digital movies. Trends Cell Biol. 1997;7:503–506. doi: 10.1016/S0962-8924(97)01171-9. [DOI] [PubMed] [Google Scholar]
- Yvon AM, Wadsworth P. Non-centrosomal microtubule formation and measurement of minus end microtubule dynamics in A498 cells. J Cell Sci. 1997;110:2391–2401. doi: 10.1242/jcs.110.19.2391. [DOI] [PubMed] [Google Scholar]
Associated Data
This section collects any data citations, data availability statements, or supplementary materials included in this article.


