

Abstract
Previously it was shown that the volume of forming enamel of molar teeth in biglycan-null mice was greater than in genetically matched wild-type mice. This phenotypic change appeared to result from an increase in amelogenin expression, implying that biglycan directly influences amelogenin synthesis. To determine whether biglycan over-expression resulted in decreased amelogenin expression, we engineered transgenic mice to over-express biglycan in the enamel organ epithelium. Biglycan over-expression did not significantly affect the amelogenin expression in incisor and molar teeth in 3-day transgenic mice. In the transgenic animals we observed that the immature and mature enamel appeared normal. These results suggested that increasing the biglycan expression, in the cells that synthesize the precursor protein matrix for enamel, has a negligible influence on amelogenesis.
Keywords: amelogenesis, biglycan, enamel, protein-protein interaction, tooth formation
Introduction
Biglycan is a member of the class I, Small Leucine Rich Proteoglycans (SLRPs) that contains distinctive domains including: a hydrophobic signal sequence used for cell secretion; a pro-peptide that can be cleaved by bone morphogenetic protein-1 in a tissue specific fashion (Scott et al., 2000), two glycosaminoglycan chains, two cysteine loops, and ten leucine rich repeats (Iozzo, 1999). Biglycan is localized in developing bones and many skeletal regions including articular and epiphyseal cartilage, vascular canals, subchondral regions and the periosteum (Fisher et al., 1983). In non-skeletal tissues, biglycan is localized to specialized cell types such as connective tissue and epithelial cells (Bianco et al., 1990). In new-born mice, biglycan is expressed throughout the cells of the developing tooth germ, including pre-secretory odontoblasts, ameloblasts, dental papilla and stellate reticulum (Matsuura et al., 2001; Goldberg et al., 2003). In dental tissues of 5-day to 2-month old rats, the expression of biglycan remains stable in predentin and in the pulp space. However, the localization of biglycan shifts from within ameloblasts and odontoblasts to the extracellular space (Tenorio et al., 2003).
Biglycan in solution has been shown to function as a hydroxyapatite nucleator and at higher concentration an inhibitor of hydroxyapatite growth (Gafni et al., 1999). Biglycan-null mice have an osteoporosis-like phenotype with a reduced bone mass (Xu et al., 1998). The bones of biglycan-null animals contain less mineral, but the mineral crystals are larger shown by Fourier transform infrared imaging spectroscopy (Boskey et al., 2005). The enamel of 1-day postnatal mandibular molars is 3–5 fold thicker in biglycan-null mice when compared to wild-type control animals; suggesting that biglycan is a potential inhibitor of amelogenesis (Goldberg et al., 2002). The study described here was done because it was reasoned that if the functional ablation of the biglycan gene from the mouse genome resulted in (amongst other phenotypic changes) an enhancement in amelogenesis, then an opposite phenomenon might result if biglycan is overexpressed in the enamel organ. That is, the overexpression of biglycan in the developing enamel organ might be expected to result in enamel hypoplasia. Overexpressing a gene in a tissue-specific manner is an effective method for determining the role of a protein in the context of a developing animal (Paine et al., 2003b). Here, we targeted biglycan overexpression to ameloblasts by generating transgenic mice in which biglycan expression was under the control of ameloblast-specific amelogenin promoter (Snead et al., 1996). Our results suggest that biglycan overexpression in the developing enamel organ has little or no disruptive influence on the distinctive enamel prismatic architecture as phenotypic differences are not noted in mature enamel of the transgenic animals when compared to control animals.
Materials and methods
Biglycan transgene construction
A schema for the engineering of the biglycan transgene is shown in Fig. 1A. First, a 1926 bp DNA fragment of the mouse amelogenin (GenBank accession: AF294397) (Snead et al., 1996) was isolated from a lambda fix II genomic library clone by restriction digestion of Sma I and EcoR I, and the DNA fragment was sub-cloned into the pGEM-7Zf(+/−) vector (Promega) to build the construct pGEM_1.9. Second, the amelogenin intron 1 region was amplified by PCR from this same lambda library clone using the primers SN181 (5′-TGG AGA AAC TTG ACC ATT CAC-3′) and AMELproRev (5′-GGG CCC TCG AGG TAC CGA TAT CTT GAT GGT TCT GAA ATG TAA ATC AAT ACC AAC C-3′). Four restriction enzyme sites (Apa I, Xho I, Kpn I, and EcoR V; underlined) were included in the AMELproRev primer for sub-cloning convenience. The 1706 bp PCR product was cloned into pCR2.1-TOPO vector (Invitrogen, Carlsbad, CA), and sequenced in its entirety. The fragment containing the intron 1 was released by a double digestion of EcoR I and Apa I, and sub-cloned into pGEM_1.9. The resulting plasmid was called pGEM_3.5. Thirdly, the human biglycan (hBGN) cDNA was purchased from Origene (Rockville, MD; catalogue number TC119052). This hBGN cDNA included approximately 150 bp of the 5′ untranslated region and the entire 3′ untranslated region. To ensure an intact Kozak (Kozak, 1984) sequence and poly-adenylation signal, the entire hBGN cDNA was released from pCMV6-XL5 by restriction enzymes EcoR I and Sma I, and cloned into the pSP72 vector (Promega). The hBGN cDNA was subsequently released from the pSP72 with EcoR V-Xho I, and subcloned into pGEM_3.5. The 6.1 kb transgene was released from the pGEM-7Zf(+/−) backbone using Sma I.
Fig. 1. Construction of biglycan transgenic mouse lines.
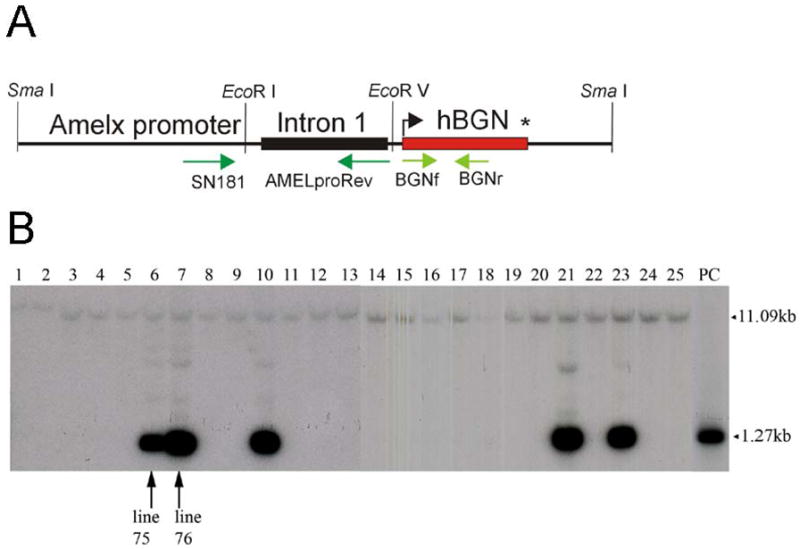
(A) Schematic representation of the biglycan transgene. The human biglycan hBGN cDNA was ligated to the mouse amelogenin promoter region, in which the amelogenin intron 1 is included. The primers for cloning and genotyping are denoted with green arrows. (B) Southern blot analysis of the biglycan transgenic mice. Genomic DNA of the transgenic mice was digested with Hind III, and subject to Southern blot with a 32P-labeled fragment derived from hBGN cDNA. Lanes 1–25 represent different mouse lines. The plasmid containing the transgenic cassette was used as a positive control (PC; far right). The 1.266 kb band correspond to the hBGN transgene, while the 11.09 kb band is presumed to represent the endogenous biglycan locus.
Transgenic animals
The 6.1 kb biglycan transgene prepared as above was microinjected into fertilized eggs as previously described (Snead et al., 1996; Paine et al., 2005). A standard Southern blot analysis was used to screen the transgenic mice. Mouse genomic DNA was prepared using proteinase-K digestion and phenol/chloroform extraction, and was digested with Hind III. The 32P-labeled probe for the Southern blot was synthesized using a 1.266 kb of Hind III fragment of hBGN cDNA as a template and a random primed DNA labeling kit (Roche, Switzerland). Additionally, a PCR method was designed to confirm and genotype mice using primers BGNf (forward; 5′-CTT CAC CTG GAC CAC AAC AAA ATC-3′) and BGNr (reverse; 5′-GGC TCC CAT TCT CAA TCA TCC-3′). The PCR would produce a 261 bp amplicon for wild-type animals, and two fragments of 261 and 118 bp for the DNA of transgenic animals.
Immunohistochemistry
The mandibles of 3-day postnatal mice were fixed with Carnoy’s solution, embedded with paraffin, and cut in 6 μm sections using a microtome. Immunostaining was performed using histostain-SP kit (Zymed, San Francisco, CA). An antibody specifically directed against human biglycan (kindly provided by Dr. Peter J. Roughley) (Roughley et al., 1993), and antibody to mouse amelogenin (Shapiro et al., 2007) were used at 1:500 and 1:100 dilution, respectively.
RT-PCR
BGNf and BGNr primers noted above were used in the RT-PCR reaction. Both murine and human biglycan mRNA produce a 118 bp fragment using this primer combination. The primer set for murine beta actin (forward 5′-CTGGCACCACACCTTCTACAATG-3′ and, reverse 5′-GATGTCACGCACGATTTCCCTC-3′; product 382 bp) was used as control for RT-PCR. Following the RT reaction, PCR conditions were 94°C (1 min), 55°C (1 min) and 72°C (1 min) for 28 cycles with a final extension time of 5 min at 72°C.
Western blot analysis
Three-day postnatal mouse molars were extracted, and the cells were lysed in 2x SDS-PAGE loading buffer (200 μl per mouse) using a tissue homogenizer. The samples were boiled for five minutes and centrifuged to remove residual debris. The protein lysate was resolved to size on 12 % SDS-PAGE (20 μl each) and a Western blot was performed using the Amersham ECL kit (GE Healthcare Bio-Sciences Corporation, Piscataway, NJ). Antibody to mouse amelogenin was used at 1:1000 dilution.
Scanning Electron Microscope (SEM)
Mandibles from 6-week old mice were collected and fixed in 4% formaldehyde overnight. The incisors were dissected from the mandibles and marked at three locations of their lingual sides so that the incisors could be divided into regions that correspond to the zones of amelogenesis; these are the pre-secretory, secretory, maturing and mature segments (Kallenbach, 1968). Using a razor blade, three indentations at the marks were made to manually guide the breaking of the incisors along their cross-section. The incisor fragments were mounted on aluminum stubs with silver paint and coated with gold/palladium before SEM observation as described previously (Paine et al., 2003a; Paine et al., 2003b; Paine et al., 2005).
Computed tomography analysis
Mandibles of one-week old mice were dissected, and dehydrated and preserved in 70% alcohol. The samples were analyzed with Siemens MicroCAT® II at the USC Molecular Imaging Center. The MicroCAT images were acquired with the X-ray source at 80 kVp and 250 μA. The data was collected at a high resolution of 10 μm. The reconstruction was done with COBRA and the voxel size was 10 μm. The acquisition proceeded for 28–29 min (550 rotation steps, 210° rotation). For each sample, 1024 × 1024 slices were taken to cover the entire mandible. The obtained images were further analyzed to calculate selected cross-sectional areas with ImageJ (Rasband, W.S., ImageJ, National Institutes of Health, Bethesda, Maryland, USA, http://rsb.info.nih.gov/ij/).
Results
Establishing transgenic mouse lines for overexpression of biglycan
We have previously used the amelogenin promoter plus intron 1 in a strategy to specifically overexpress ameloblastin (Paine et al., 2003b), dentin sialoprotein, and dentin phosphoprotein (Paine et al., 2005), and engineered amelogenin protein (Paine et al., 2003a; Paine and Snead, 2005) at the same spatiotemporal pattern as the canonical promoter is expressed in the mouse enamel organ (Snead et al., 1996). Here we adopted the same approach to construct the biglycan transgene (Fig. 1A). The human biglycan (hBGN) cDNA containing its original 5′UTR, coding region, and 3′UTR was ligated to the amelogenin promoter (that also included intron 1) DNA fragment. Under the control of the amelogenin promoter the human biglycan protein is specifically expressed in the epithelial cells of the developing enamel organ.
Mouse genomic DNA, from founder animals and their offspring, was digested and subjected to Southern blot analysis for transgene screening (Fig. 1B). The 1.266 kb band correspond to the transgene, while the approximately 11 kb band results from hybridization to the endogenous mouse biglycan DNA Hind III fragment, which has the predicted size of 11.09 kB. As indicated in Fig. 1B, mouse line 75 (lane 6), 76 (lane 7), 79 (lane 10), 90 (lane 21) and 92 (lane 23) correspond to animals containing the biglycan transgene. From these results it appears that mouse line 75 contains less copy numbers of the transgene than any of the other four transgenic mouse lines. In this study, mouse lines 75 and 76 were selected for further analysis.
Biglycan is overexpressed primarily in ameloblasts of transgenic mice
The specific overexpression of biglycan was verified by immunostaining. The incisors from 3-day postnatal mice prepared in sagittal sections were subject to immunohistochemistry analyses using a rabbit polyclonal antibody against human biglycan (Fig. 2A and 2B). In comparison with the control, wild-type or non-transgenic animals (Fig. 2A), transgenic animals from both line 76 (Fig. 2B) and line 75 (data not shown) showed higher biglycan expression levels at various stages of enamel organ differentiation. Mouse line 76 exhibited increased biglycan expression compared to line 75 and this difference in expression may result from the greater transgene copy numbers, as indicated by Southern blot analysis (Fig. 1B). Biglycan was found to be expressed primarily in ameloblasts, and to a lesser extent in the early stage and secretory odontoblasts. A similar transgene expression pattern has been seen previously in various transgenic animals using the same murine amelogenin promoter (Paine et al., 2003b; Paine et al., 2005). In transgenic animals the endogenous murine biglycan could not be distinguished from the transgenically-produced human protein.
Fig. 2. Detection of biglycan in the transgenic mice.
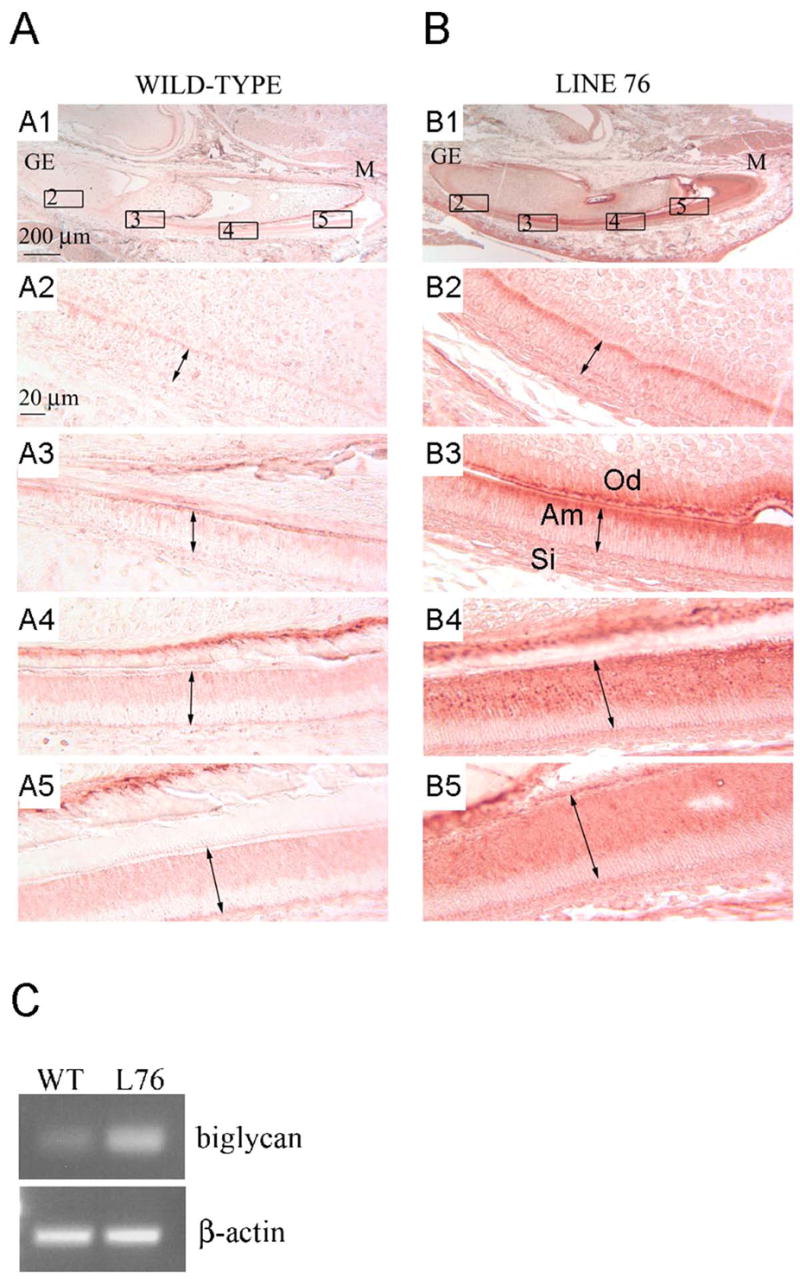
(A and B) Mandibular incisors from 3-day postnatal mice were subject to immunochemistry analysis using a rabbit polyclonal antibody against human biglycan. This biglycan antibody also recognizes mouse biglycan epitopes. Panel A is from a non-transgenic control animal. Panels B is from a biglycan transgenic mice of mouse line 76 (identified in lane 7 in figure 1B). Higher magnification of selected areas within panels A1 (wild-type) and B1 (transgenic), labeled 2–5, are shown in panels A2-5 and B2-5 respectively. The growing end (GE) and mature end (M) of the incisor is identified for both wild-type and transgenic animals. The basal-apical length of the ameloblast cells (Am) are identified with a double-headed arrow. Odontoblasts (Od) and cells of the stratum intermedium (Si) are also identified. A scale bar is included in panels A1 and A2. (C) RT-PCR for biglycan mRNA in wild-type and transgenic mice. Higher biglycan mRNA expression is seen in the transgenic animal when compared to wild-type animal. Beta-actin was used as a control.
The relative levels of biglycan mRNA between wild-type and transgenic animals was also compared using RT-PCR in multiple animals, each time giving similar expression proifiles. Representative data for a single mouse from line 76, compared to a wild-type mouse, is shown (Fig. 2C).
Overexpression of biglycan had no significant effect on the amelogenin protein level
Previously published data on the biglycan-deficient mice showed that amelogenin production increased in secretory ameloblasts and odontoblasts (Goldberg et al., 2005). To determine whether the overexpression of biglycan resulted in reduced amelogenin accumulation in the enamel extracellular matrix, we used immunohistochemistry to examine the amelogenin protein levels from 3-day mouse incisors of the mouse line 76. Comparison of biglycan transgenic animals (Fig. 3B) with their wild-type litter mates (Fig. 3A) did not reveal significant difference in the amelogenin protein expression level at any stage of amelogenesis. To confirm the immunohistochemical data we next analyzed amelogenin levels in the tissue extract of 3-day mouse molars using Western blot technique (Fig. 3C). The amount of amelogenin in either the monomer or in dimer forms is comparable between the transgenic animals and the non-transgenic litter mates from mouse line 76. Taken together, the overexpression of biglycan has little or no effect on amelogenin production in incisors and molars.
Fig. 3. Amelogenin protein level in wild-type and transgenic mouse teeth.
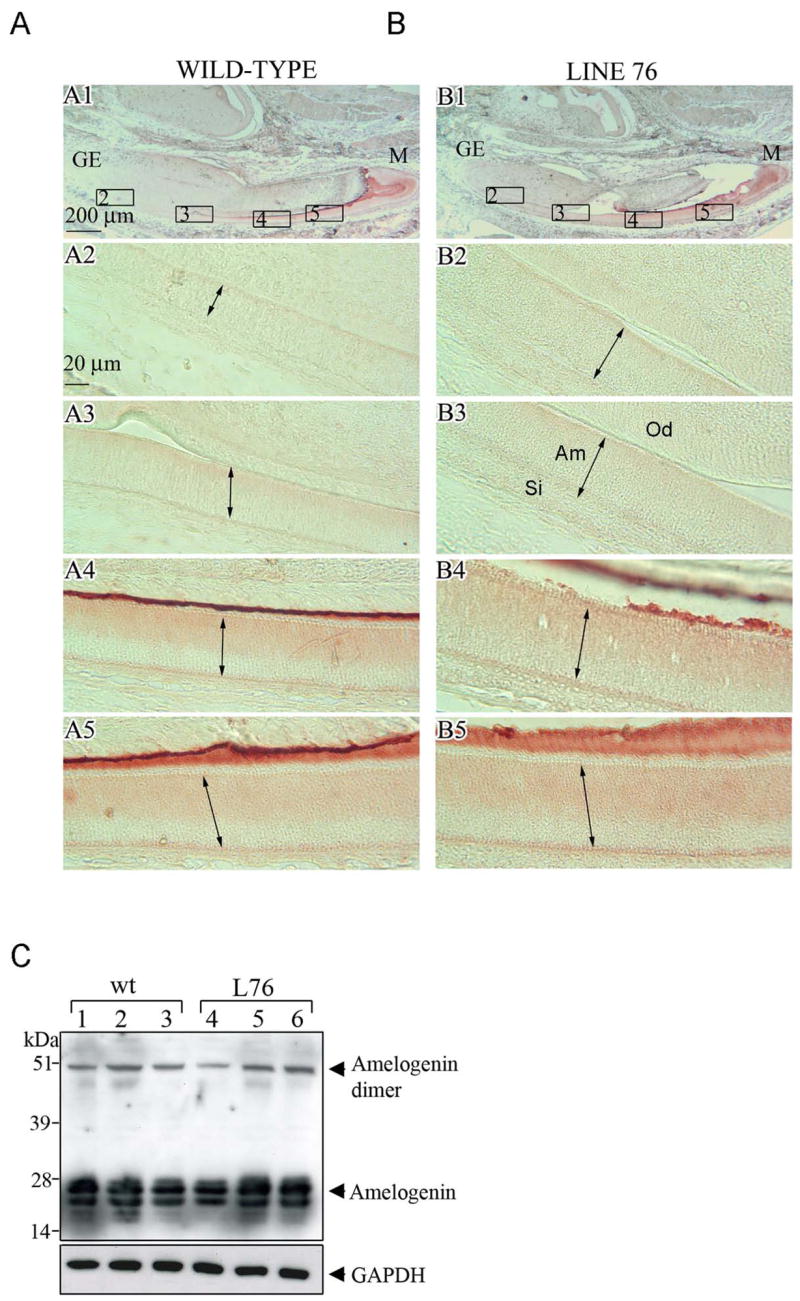
The amelogenin expression was assessed for the non-transgenic (wild-type) control and transgenic animals from mouse line 76. Immunohistochemistry was performed on the sagittal sections of incisors from 3-day post-natal mice. Panel A1 is from a control non-transgenic mouse, and panels A2–A5 are enlarged regions in identified in panel A1. Panel B1 is from a transgenic mouse, and panels B2–B5 are enlarged regions identified in panel B1. The baso-apical length of the ameloblast cells (Am) are identified with a double-headed arrow. Odontoblasts (Od) and cells of the stratum intermedium (Si) are also identified. A scale bar is included in panels A1 and A2. (C) Western blot analysis of amelogenin from control non-transgenic (lanes 1–3) or transgenic (lanes 4–6) molars. Western blot analysis was performed on tissue lysate from molar teeth of 3-day mice taken from line 76.
Scanning Electron Microscopy (SEM) structure of immature and mature enamel in transgenic mice
The enamel prismatic architecture of incisors from the transgenic mouse lines 75 and 76 was examined by SEM. The incisors from 6-week postnatal mice were fractured with mechanical force at locations corresponding to the transition zone (a), the middle maturing zone (b), and the mature zone (c) shown in Fig. 4A. The fracture generated two complimentary cross-sections at each location, and the surfaces closer to the incisal edge (more superior face) were observed and photographed (Fig. 4B). For the majority of sections, when observing the immature enamel, the prismatic architecture appeared normal (Fig. 4B 2a) when compared to enamel at the same developmental stage in non-transgenic litter mates (Fig. 4B 1a and 3a). A disorganized prismatic architecture was only occasionally observed in the immature enamel of transgenic mice (Fig. 4B 4a) when compared to enamel at the same developmental stage in non-transgenic litter mates (Fig. 4B 1a and 3a). There were no apparent differences in enamel organization in the portion of the incisor corresponding to a mixture of secretory and mature enamel (Fig. 4B column 1b–4b), or at the portion of enamel corresponding to the mature end (Fig. 4B column 1c–4c).
Fig. 4. SEM analysis of enamel prism organization.
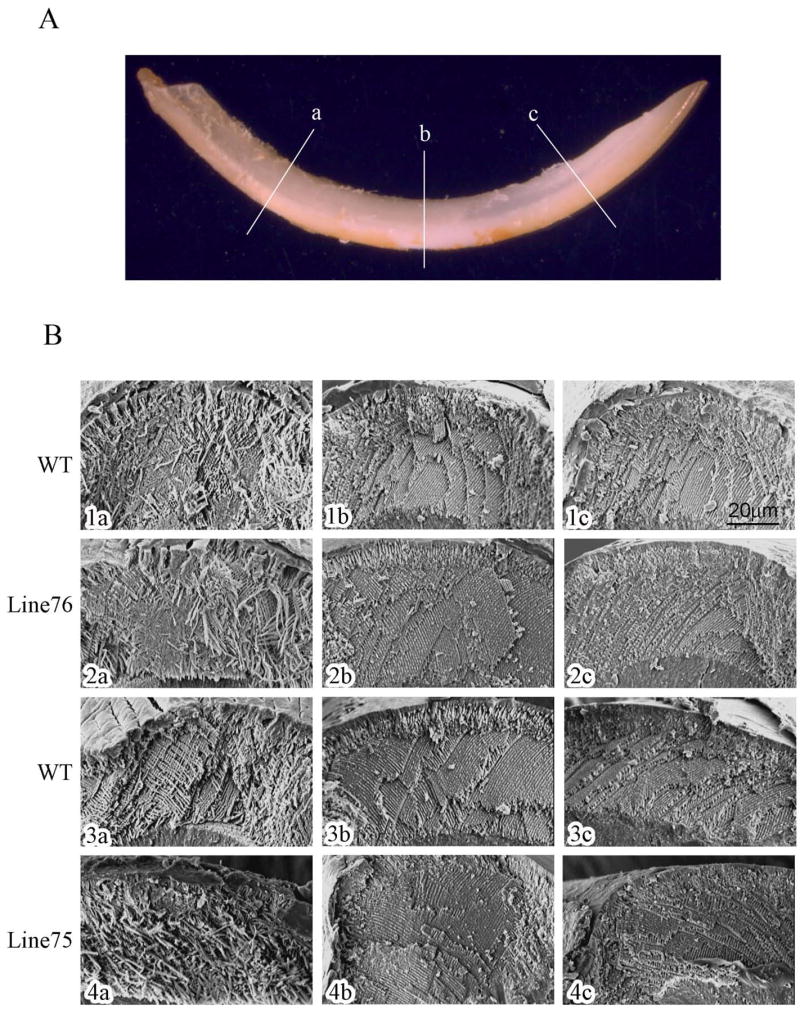
(A) Positions of incisor fracture. Incisors from 6-week postnatal mice were fractured with mechanical force at the position a, b and c. (B) Microphotograph of the fracture surfaces. The fracture surfaces closer to the incisor tip were observed. Panels 1a–1c and 3a–3c are from control non-transgenic animals of mouse lines 76 and 75, respectively. Panels 2a–2c and 4a–4c are from transgenic animals of mouse lines 76 and 75, respectively.
Area of mineralized regions in the developing teeth by computer tomography (CT)
In the biglycan transgenic mice, the biglycan controlled by the amelogenin promoter is expressed primarily in ameloblasts, but also transgene expressed is seen in odontoblasts (Fig. 2B). As the enamel formed by ameloblasts, and the dentin formed by odontoblasts are both highly mineralized, we regarded the mineralized enamel and dentin as a whole for the computed tomography analysis. The entire mandibles of 1-week postnatal mice were scanned by micro-CT producing approximately 800 CT slices for each mandible required to completely cover the incisor, and first and second molars. Enamel tissue was identifiable in the incisors and the first molars from reconstructed, three-dimensional mandibular images (arrowheads, Fig. 5A). One CT slice from the first molar for transgenic or the non-transgenic littermate is shown in Fig. 5B. The linear thickness of mineralized tissue from the dentin side to the enamel side varies from point to point; therefore, the area of mineralized tissue from first molar teeth imaged in a coronal section (identified by the interrupted white line, Fig. 5A2) was used for comparison between the transgenic mice and control non-transgenic littermates (area as illustrated in Fig. 5B3). The areas for the mineralized tissue were calculated using ImageJ software, and the values for the first molars are shown in Fig. 5C. For the values of area corresponding to the mineralized tissue among the transgenic and non-transgenic animals from either mouse line 76 or 75, no significant differences were observed. Furthermore, no significant difference was found for the values of mineralizing tissue area obtained for the incisors and the second molars (data not shown).
Fig. 5. Tomographic analysis of mineralized regions of mouse teeth.

A total 8 animals (identified and labeled as circled numbers) from mouse lines 76 (animals 1-4) and 75 (animals 5-8) were examined. Animals 1, 2, 5 and 6 are control non-transgenic, and 3, 4, 7 and 8 are transgenic mice. (A) Reconstructed three-dimensional projection of mandible. Mice number 2 (control non-trangenic) and mice number 3 (transgenic) are from mouse line 76. The white arrowheads indicate the mineralized enamel for incisor and molar of 1-week mice. (B) A computerized tomographic (CT) image of a 10 μm voxel slice of first molar teeth for each animal is shown. The mineralized region (cross-section) selected for illustration, for each animal, is identified for mouse 2 in panel A. (C) The average area value (pixel2, Y-axis) with standard deviation was calculated from 10 CT slices of the first molar at the coronal section (as outlined and illustrated for mouse 3 in panel B) using ImageJ software. Four control non-trangenic (white bars) and four transgenic (grey bars) mice (animals 1-8, X-axis) from mouse lines 76 and 75 were analyzed.
Discussion
The contribution of the extracellular matrix protein biglycan to enamel formation is poorly understood, and has only been addressed recently in a study of the dentition of biglycan-null animals (Goldberg et al., 2005). Compared to control wild-type animals an increased enamel formation in the mandibular molars of animals null for the biglycan gene was observed, and this resulted from the production of a thicker than normal enamel organic matrix (Goldberg et al., 2002; Goldberg et al., 2005). Once fully mineralized, the enamel of both wild-type and biglycan-null animals appear very similar morphologically (Goldberg et al., 2005). The changes noted during amelogenesis in the biglycan-null animals were molar tooth-specific, and did not impact on the incisor teeth (Goldberg et al., 2005), and could imply that the enamel matrix composition has an indirect regulatory role in amelogenesis. This finally suggests that some genes may play a role in regulating the formation of enamel matrix in a class of teeth (Thomas et al., 1997; Lezot et al., 2000). This has been observed for transcription factors such as Dlx-1 and Dlx-2 when compound oblations were observed to affect maxillary, but not mandibular, molar tooth development (Thomas et al., 1997).
Overexpressing a protein in a specific in vivo tissue microenvironment is an alternative and effective method to explore the protein’s function. To study the effect of biglycan overexpression on tooth enamel formation, we engineered biglycan transgenic mice in which biglycan was specifically overexpressed in the developing enamel organ. Two transgenic mouse lines (75 and 76), which contained different copy numbers of transgenes, were studied. These transgenic animals developed and matured normally, and their teeth appeared normal in comparison with the wild-type animals. The overexpressed biglycan was detected in ameloblasts and odontoblasts in 3-day transgenic mice, and the relative level for protein overexpression was correlated to the transgene copy numbers as indicated by Southern blot analysis. Biglycan overexpression did not significantly affect the accumulation of amelogenin protein expression into the enamel matrix from incisors and molars of 3-day mice.
The micro-CT analysis of the entire mandibles of 1-week transgenic mice suggested that overall mineralization volume of enamel and dentin from incisors, and from first and second molar teeth, each examined at a different stage of enamel and dentin mineralization, were not significantly altered when compared to the non-transgenic litter mates. SEM analysis of incisors of 6-week transgenic mice revealed a disorganized structure (i.e. disruptions to the rod/interrod architecture) of immature enamel in some samples (Fig. 4B 4a), but no disruptions to the enamel prismatic architecture of the mature enamel were observed. Our conclusion is that while biglycan could potentially influence enamel crystallite organization and growth, these changes were compensated for during development and that such compensatory mechanisms likely correct this disruptive influence of biglycan overexpression. Compensation would suggest that there are biological feedback controls in place serving to regulate enamel maturation, coupling cell and matrix interactions to preserve amelogenesis (Zhu et al., 2006).
In addition to the influence biglycan has on hydroxyapatite growth (Gafni et al., 1999), biglycan is potentially involved in cell differentiation and cell-matrix adhesion. Biglycan’s influence on cell differentiation has been previously discussed for osteoblasts (Bianco et al., 1990) and keratinocytes (Bianco et al., 1990; Schaefer et al., 2003). In two different animal models, the influence from both amelogenin (Zhu et al., 2006) and ameloblastin (Fukumoto et al., 2004) on ameloblast differentiation and cell to matrix interactions has been demonstrated. Ameloblastin is essential for ameloblast differentiation as demonstrated by an ameloblastin-null genotype (Fukumoto et al., 2004), while the expression of mutated amelogenins in the enamel matrix impacts the morphology of Tomes’ processes of secretory ameloblasts, and also the distribution of at-least two membrane-bound proteins (α6 integrin and CD63) within Tomes’ processes (Zhu et al., 2006). Our previous data using the yeast 2-hybrid assay showed significant protein-protein interactions between amelogenin-biglycan, and also ameloblastin-biglycan (Wang et al., 2005). Taken together this data suggests that matrix-mediated changes in ameloblast differentiation and behavior may occur through multiple protein-protein interactions among the enamel-matrix proteins, and by means of the interactions between the organic matrix with plasma membrane-bound proteins of ameloblasts. We suggest that with the data presented here, and previously (Goldberg et al., 2002; Goldberg et al., 2005) it is likely that the process of amelogenesis is well-compensated for from large fluctuations of biglycan expression, and that disruptions to enamel formation require significant departure from this homeostasis.
Acknowledgments
The authors would like to thank Dr. Peter J. Roughley for the antibody to human biglycan, HongJun Wang for his assistance with the animal husbandry, and Grace Cham, Archana Tank, Grant Dagliyan and Sam Li of USC Molecular Imaging Center for their assistance in the collection of the micro-CT data. The use of the microCAT II image system at the USC Molecular Imaging Center was made possible by a National Center for Research Resources (NCRR) shared instrumentation grant # 1 S10 RR019253 (Micro Computerized Tomography Imaging System) awarded in May 2004 to Dr. Peter S. Conti. In addition, this work was supported by grants DE006988, DE013045 and DE013404 from the NIH/NIDCR.
References
- Bianco P, Fisher LW, Young MF, Termine JD, Robey PG. Expression and localization of the two small proteoglycans biglycan and decorin in developing human skeletal and non-skeletal tissues. J Histochem Cytochem. 1990;38:1549–1563. doi: 10.1177/38.11.2212616. [DOI] [PubMed] [Google Scholar]
- Boskey AL, Young MF, Kilts T, Verdelis K. Variation in mineral properties in normal and mutant bones and teeth. Cells Tissues Organs. 2005;181:144–153. doi: 10.1159/000091376. [DOI] [PubMed] [Google Scholar]
- Fisher LW, Termine JD, Dejter SWJ, Whitson SW, Yanagishita M, Kimura JH, Hascall VC, Kleinman HK, Hassell JR, Nilsson B. Proteoglycans of developing bone. J Biol Chem. 1983;258:6588–6594. [PubMed] [Google Scholar]
- Fukumoto S, Kiba T, Hall B, Iehara N, Nakamura T, Longenecker G, Krebsbach PH, Nanci A, Kulkarni AB, Yamada Y. Ameloblastin is a cell adhesion molecule required for maintaining the differentiation state of ameloblasts. J Cell Biol. 2004;167:973–983. doi: 10.1083/jcb.200409077. [DOI] [PMC free article] [PubMed] [Google Scholar]
- Gafni G, Septier D, Goldberg M. Effect of chondroitin sulfate and biglycan on the crystallization of hydroxyapatite under physiological conditions. J Cryst Growth. 1999;205:618–623. [Google Scholar]
- Goldberg M, Rapoport O, Septier D, Palmier K, Hall R, Embery G, Young M, Ameye L. Proteoglycans in predentin: The last 15 micrometers before mineralization. Connect Tissue Res. 2003;44:184–188. [PubMed] [Google Scholar]
- Goldberg M, Septier D, Rapoport O, Iozzo RV, Young MF, Ameye LG. Targeted disruption of two small leucine-rich proteoglycans, biglycan and decorin, exerts divergent effects on enamel and dentin formation. Calcif Tissue Int. 2005;77:297–310. doi: 10.1007/s00223-005-0026-7. [DOI] [PubMed] [Google Scholar]
- Goldberg M, Septier D, Rapoport O, Young M, Ameye L. Biglycan is a repressor of amelogenin expression and enamel formation: an emerging hypothesis. J Dent Res. 2002;81:520–524. doi: 10.1177/154405910208100804. [DOI] [PubMed] [Google Scholar]
- Iozzo RV. The biology of the small leucine-rich proteoglycans - Functional network of interactive proteins. J Biol Chem. 1999;274:18843–18846. doi: 10.1074/jbc.274.27.18843. [DOI] [PubMed] [Google Scholar]
- Kallenbach E. Fine structure of rat incisor ameloblasts during enamel maturation. J Ultrastruct Res. 1968;22:90–119. doi: 10.1016/s0022-5320(68)90051-8. [DOI] [PubMed] [Google Scholar]
- Kozak M. Compilation and analysis of sequences upstream from the translation site in eukaryotic mRNAs. Nucleic Acids Res. 1984;12:857–872. doi: 10.1093/nar/12.2.857. [DOI] [PMC free article] [PubMed] [Google Scholar]
- Lezot F, Thomas B, Hotton D, Forest N, Orestes-Cardoso S, Robert B, Sharpe P, Berdal A. Biomineralization, life-time of odontogenic cells and differential expression of the two homeobox genes MSX-1 and DLX-2 in transgenic mice. J Bone Miner Res. 2000;15:430–441. doi: 10.1359/jbmr.2000.15.3.430. [DOI] [PubMed] [Google Scholar]
- Matsuura T, Duarte WR, Cheng H, Uzawa K, Yamauchi M. Differential expression of decorin and biglycan genes during mouse tooth development. Matrix Biol. 2001;20:367–373. doi: 10.1016/s0945-053x(01)00142-1. [DOI] [PubMed] [Google Scholar]
- Paine ML, Luo W, Wang HJ, Bringas P, Ngan AYW, Miklus VG, Zhu DH, MacDougall M, White SN, Snead ML. Dentin sialoprotein and dentin phosphoprotein over-expression during amelogenesis. J Biol Chem. 2005;280:31991–31998. doi: 10.1074/jbc.M502991200. [DOI] [PubMed] [Google Scholar]
- Paine ML, Luo W, Zhu DH, Bringas P, Snead ML. Functional domains for amelogenin revealed by compound genetic defects. J Bone Miner Res. 2003a;18:466–472. doi: 10.1359/jbmr.2003.18.3.466. [DOI] [PubMed] [Google Scholar]
- Paine ML, Snead ML. Tooth developmental biology: Disruptions to enamel-matrix assembly and its impact on biomineralization. Orthodon Craniofac Res. 2005;8:239–251. doi: 10.1111/j.1601-6343.2005.00346.x. [DOI] [PubMed] [Google Scholar]
- Paine ML, Wang HJ, Luo W, Krebsbach PH, Snead ML. A transgenic animal model resembling amelogenesis imperfecta related to ameloblastin over-expression. J Biol Chem. 2003b;278:19447–19452. doi: 10.1074/jbc.M300445200. [DOI] [PubMed] [Google Scholar]
- Roughley PJ, White RJ, Magny MC, Liu J, Pearce RH, Mort JS. Non-proteoglycan forms of biglycan increase with age in human articular cartilage. Biochem J. 1993;295:421–426. doi: 10.1042/bj2950421. [DOI] [PMC free article] [PubMed] [Google Scholar]
- Schaefer L, Beck KF, Raslik I, Walpen S, Mihalik D, Micegova M, Macakova K, Schonherr E, Seidler DG, Varga G, Schaefer RM, Kresse H, Pfeilschifter J. Biglycan, a nitric oxide-regulated gene, affects adhesion, growth, and survival of mesangial cells. J Biol Chem. 2003;278:26227–26237. doi: 10.1074/jbc.M210574200. [DOI] [PubMed] [Google Scholar]
- Scott IC, Imamura Y, Pappano WN, Troedel JM, Recklies AD, Roughley PJ, Greenspan DS. Bone morphogenetic protein-1 processes probiglycan. J Biol Chem. 2000;275:30504–30511. doi: 10.1074/jbc.M004846200. [DOI] [PubMed] [Google Scholar]
- Shapiro JL, Wen X, Okamoto CT, Wang HJ, Lyngstadaas SP, Goldberg M, Snead ML, Paine ML. Cellular uptake of amelogenin, and its localization to CD63, and Lamp1-positive vesicles. Cell Mol Life Sci. 2007;64:244–256. doi: 10.1007/s00018-006-6429-4. [DOI] [PMC free article] [PubMed] [Google Scholar]
- Snead ML, Paine ML, Chen LS, Yoshida B, Luo W, Zhu DH, Lei YP, Liu YH, Maxson REJ. The murine amelogenin promoter: Developmentally regulated expression in transgenic animals. Connect Tissue Res. 1996;35:41–47. doi: 10.3109/03008209609029173. [DOI] [PubMed] [Google Scholar]
- Tenorio DM, Santos MF, Zorn TM. Distribution of biglycan and decorin in rat dental tissue. Braz J Med Biol Res. 2003;36:1061–1065. doi: 10.1590/s0100-879x2003000800012. [DOI] [PubMed] [Google Scholar]
- Thomas BL, Tucker AS, Qui M, Ferguson CA, Hardcastle Z, Rubenstein JL, Sharpe PT. Role of Dlx-1 and Dlx-2 genes in patterning of the murine dentition. Development. 1997;124:4811–4818. doi: 10.1242/dev.124.23.4811. [DOI] [PubMed] [Google Scholar]
- Wang HJ, Tannukit S, Zhu DH, Snead ML, Paine ML. Enamel matrix protein interactions. J Bone Miner Res. 2005;20:1032–1040. doi: 10.1359/JBMR.050111. [DOI] [PubMed] [Google Scholar]
- Xu T, Bianco P, Fisher LW, Longenecker G, Smith E, Goldstein S, Bonadio J, Boskey A, Heegaard AM, Sommer B, Satomura K, Dominguez P, Zhao C, Kulkarni AB, Robey PG, Young MF. Targeted disruption of the biglycan gene leads to an osteoporosis-like phenotype in mice. Nat Genet. 1998;20:78–82. doi: 10.1038/1746. [DOI] [PubMed] [Google Scholar]
- Zhu DH, Paine ML, Luo W, Bringas P, Snead ML. Altering biomineralization by protein design. J Biol Chem. 2006;281:21173–21182. doi: 10.1074/jbc.M510757200. [DOI] [PubMed] [Google Scholar]