

Abstract
Activity-dependent variations in extracellular potassium concentration in the central nervous system may be regulated, in part, by potassium spatial buffering currents in glial cells. The role of spatial buffering in the retina was assessed by measuring light-evoked potassium changes in amphibian eyecups. The amplitude of potassium increases in the vitreous humor was reduced to ~10 percent by 50 micromolar barium, while potassium increases hi the inner plexiform layer were largely unchanged. The decrease in the vitreal potassium response was accurately simulated with a numerical model of potassium current flow through Müller cells, the principal glial cells of the retina. Barium also substantially increased the input resistance of Müller cells and blocked the Müller cell-generated M-wave, indicating that barium blocks the potassium channels of Müller cells. Thus, after a light-evoked potassium increase within the retina, there is a substantial transfer of potassium from the retina to the vitreous humor by potassium current flow through Müller cells.
Orkand, Nicholls, and Kuffler (1) proposed that the extracellular potassium concentration ([K+]o) in the brain is regulated, in part, by K+ spatial buffering by glial cells. They suggested that an increase in [K+]o generated by neuronal activity results in an influx of K+ into glial cells, which are almost exclusively permeable to K+ (2). This K+ influx leads to cell depolarization and results in an efflux of an equal amount of K+ from other cell regions. This cellular K+ current transfers K+ from regions where [K+]o is high to regions where [K+]o is lower. Although this theory has received support (3, 4), a direct demonstration of spatial buffering by glial cells in a normal, in situ preparation has been lacking. Large spatial buffering currents have been predicted to occur in the retina, where the Müller (glial) cell is well suited to transfer K+ from the retina to the vitreous humor (5, 6). We have now tested for K+ spatial buffering by monitoring light-evoked [K+]o changes in the amphibian retina.
Changes in [K+]o were measured with double-barreled K+-selective microelectrodes containing Corning resin 477317 or a valinomycin-based liquid membrane, Fluka 60031. Recordings were made from frog and mudpuppy eyecups stimulated by flashes of white light (either diffuse light or a small spot). Eyecups were superfused with an amphibian Ringer’s solution (7). The location of the K+-selective electrode within the retina was determined by such criteria as electrode depth, the intraretinal electroretinogram (ERG), and resistance landmarks (8).
A characteristic series of light-evoked variations in [K+]o occurs when the retina is stimulated with a light flash (Fig. 1A). In the inner plexiform layer (IPL) an increase in [K+]o is seen at both the “ON” and “OFF” of the stimulus. This [K+]o increase decays slowly over many seconds. As the electrode is withdrawn toward the retinal surface, this [K+]o increase becomes smaller and decays more slowly. In the vitreous humor (20 μm) above the retinal surface) the [K+]o increase is significantly attenuated and decays very slowly (Fig. 1A).
Fig. 1.
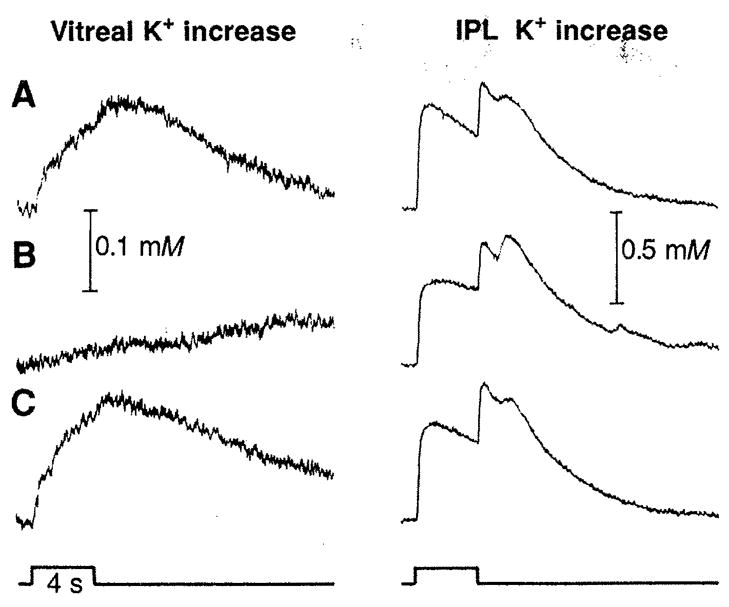
Light-evoked [K+]o changes in the vitreous humor and in the IPL (A) before, (B) approximately 5 min after Ba2+ application (50 μM), and (C) approximately 1 hour after washout of a frog eyecup. The secondary peak in the IPL at light off is the delayed off response (20). Light stimulus (diffuse illumination; intensity, 3.2 lux) is indicated at the bottom. Here and in Fig. 2 the ordinate represents the linear K+ concentration. Resting [K+]o in the IPL, 2.7 mM.
When Ba2+ is added to the superfusate (Fig. 1B), the [K+]o response in the IPL is largely unchanged in amplitude but decays somewhat slower. Similar changes occurred in the ganglion cell layer. However, a large Ba2+-induced change occurs in the vitreous humor, where the [K+]o ON response is decreased to 22% of its control amplitude (in the example shown) and has an extremely slow time course. Similar Ba2+-induced changes in [K+]o responses were recorded in experiments in both frog and mudpuppy eyecups. The vitreal [K+]o response was reduced by Ba2+ to an average of 11% of the control value in frogs and 8% in salamanders (Table 1).
Table 1.
Amplitudes (mean ± SEM) of light-evoked [K+]o increases and intraretinal ERGs from frog (Rana pipiens) and salamander (Necturus tnaculosus) eyecups and Müller cell conductance values from salamander (Ambystotna tigrinum) retinal slices. For frog, Ba2+ concentrations ranging from 40 to 100 μM were used in different experiments; for salamander, 50 μM Ba2+ was used in all experiments. For the computer simulation, [K+]o amplitudes in the IPL were matched to the mean of the experimental results. Percentages indicate amplitude of response in Ba2+ relative to control amplitude.
| Condition | Diffuse illumination
|
Spot, 0.3 mm
|
Müller cell conductance (nS) | |||||
|---|---|---|---|---|---|---|---|---|
| IPL K+ increase (μM) | Simulation | Vitreal K+ increase (μM) | Simulation | IPL K+ increase (μM) | PNR (μV) | M-wave (μV) | ||
| Frog | ||||||||
| Control | 246 ± 23 | 246 | 45 ± 6 | 17.0 | 484 ± 57 | 451 ± 36 | 407 ± 48 | |
| Ba2+ | 211 ± 25 | 211 | 5 ± 2 | 2.6 | 521 ± 71 | 386 ± 33 | 96 ± 23 | |
| 86% (n = 14) | 86% | 11% (n = 11) | 15% | 108% (n = 14) | 86% (n = 13) | 24% (n = 13) | ||
| Salamander | ||||||||
| Control | 201 ± 26 | 34 ± 5 | 346 ±49 | 378 ± 29 | 381 ± 25 | 92 ± 19 | ||
| Ba2+ | 213 ± 23 | 2.8 ± 0.5 | 495 ± 55 | 315 ± 28 | 111 ± 19 | 19.8 ± 3.2 | ||
| 106% (n = 8) | 8% (n = 4) | 143% (n = 8) | 83% (n = 8) | 29% (n = 8) | 22% (n = 17) | |||
Although Ba2+ treatment leads to only small changes in the light-evoked [K+]o responses in the IPL, it causes a dramatic decrease in the [K+]o response in the vitreous humor. This difference can be explained by hypothesizing that a large fraction of the vitreal [K+]o increase comes from a K+ spatial buffering current flowing through Müller cells, rather than from diffusion of K+ through extracellular space. Ba2+ application would attenuate the vitreal [K+]o increase by blocking Müller cell K+ channels and thus interrupting the K+ current.
The validity of this hypothesis is based on three assumptions, (i) Ba2+ does not greatly interfere with the diffusion of K+ through extracellular space. This idea is supported by resistance measurements (4) that indicate that there are no significant changes in extracellular volume fraction or tortuosity (the effective length along which K+ must diffuse) after Ba2+ application, (ii) Ba2+ does not act by blocking an active uptake process that transports K+ to the vitreous humor. This is likely because Ba2+ blocks active K+ uptake in glial cells only in concentrations higher than those that were used in our experiments (9) and because a oua-bain-induced block of K+ transport has little effect on current-evoked K+ fluxes through Müller cells (4). (iii) Ba2+ blocks K+ channels in Müller cells. Although Ba2+ is known to block K+ channels in neurons (10) and in some glial cells (11), the situation in retinal cells is unclear because preliminary reports suggested that Ba2+ does not block K+ channels in Müller cells in situ (12).
We assessed the effect of Ba2+ on Müller cells in situ by measuring cell input resistance before and after Ba2+ application. Intracellular recordings were made from retinal slices of the tiger salamander (6). Cells were penetrated in the soma, and input resistance was measured with depolarizing current pulses.
Müller cell input resistance was 10.9 ± 2.3 megohms (mean ± SEM,n = 17) in control Ringer’s solution, close to the value of 9.7 megohms measured in isolated salamander Müller cells (13). Cell resistance rose to 50.4 ±8.1 megohms in 50 μM Ba2+; that is, conductance decreased to 22% of the control value (Table 1). Müller cells are almost exclusively permeable to K+ (6, 14). Thus, these results demonstrate that Ba2+ blocks most K+ channels of Müller cells in situ.
We obtained additional evidence that Ba2+ blocks most of the Müller cell K+ conductance by monitoring the intraretinal (local) ERG. Within the IPL the local ERG consists of a fast upward deflection, the proximal negative response (PNR), followed by a slower potential, the M-wave (15) (Fig. 2A, field potential). Simultaneous [K+]o recordings (Fig. 2A, IPL K+ increase) show that the time course of the [K+]o increase parallels that of the M-wave. After Ba2+ application (Fig. 2B), the M-wave is almost abolished while the PNR remains nearly unchanged. In this example, the [K+]o increase is augmented slightly after Ba2+ application. Similar results were obtained from frog and mudpuppy (Table 1).
Fig. 2.
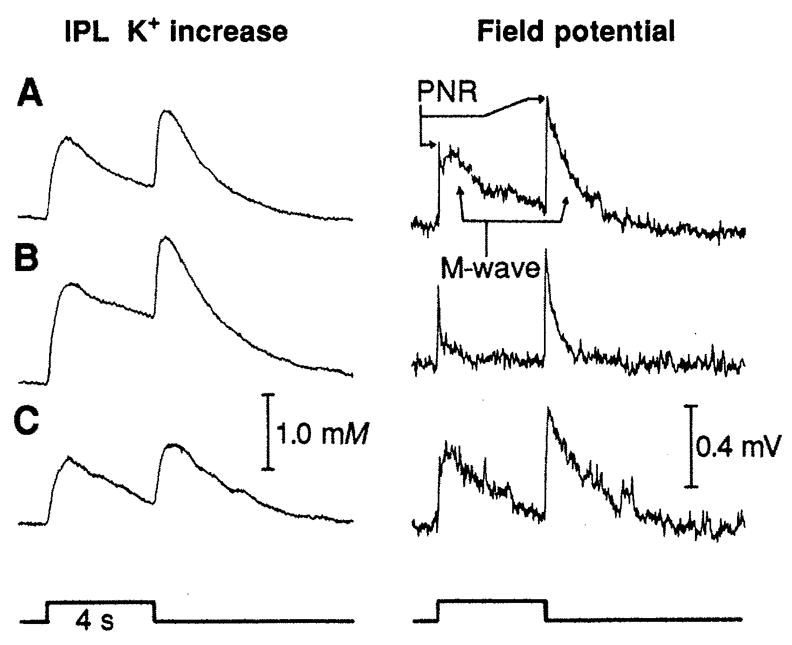
The [K+]o response and the intraretinal ERG (negative upward) recorded simultaneously in the IPL of frog (A) before, (B) approximately 5 min after Ba2+ application (50 μM), and (C) approximately 1 hour after washout. The PNR and the increase in [K+]o were largely unaffected by Ba2+, while the M-wave was greatly reduced. Stimulus, 0.3-mm spot; intensity, 3.2 lux.
Both the PNR and the IPL [K+]o increase are indicators of neural activity in the proximal retina (15). Thus, these results confirm that micromolar Ba2+ does not severely depress neuronal activity. However, the M-wave, which is believed to be generated by an influx of K+ into Müller cells (15, 16), is severely depressed by Ba2+. Thus, this experiment supports the supposition that Ba2+ blocks most Müller cell K+ channels in situ while not seriously compromising neuronal activity.
Our results suggest that after an increase in retinal [K+]o there is substantial K+ current flow through Müller cells from the retina to the vitreous humor. We tested this hypothesis with one additional approach: the modeling of K+ dynamics in the retina. We asked whether our experimental observation of the dominance of spatial buffering over diffusion in transporting K+ to the vitreous humor is reasonable, given our knowledge of Müller cell conductance and retinal tissue geometry. We utilized the numerical model of Odette and Newman (17), with values of tissue parameters obtained from previously published results (18). Only the K+ source and sink in the model were adjusted to produce a [K+]o response in the IPL matching that recorded experimentally. We then simulated Ba2+ in the model by setting the Müller cell conductance equal to zero (a simplifying assumption) and by reducing the amplitude of the K+ source and sink to 79% of the control value (so that simulated and experimental IPL responses in Ba2+ had equal amplitudes).
When we simulated the experiment in Fig. 1 (frog eyecup, diffuse illumination), we obtained a good match with experimental results for both control and Ba2+ conditions (Fig. 3) (19). The simulation of Ba2+ resulted in a reduction of the vitreal [K+]o response to 15% of its control amplitude, close to the 11% value obtained experimentally. In addition, the change in the time course of the simulated vitreal response was similar to that seen experimentally. The time to peak of the simulated vitreal response increased from 7.2 to 9.6 s with Ba2+; corresponding times for the experimental responses averaged 5.9 and 9.8 s. In the IPL, the Ba2+-induced changes in the time course of simulated and experimental [K+]o responses were also similar. In both cases decay of the responses (both ON and OFF components) was slowed. The agreement between simulated and experimental responses lends further support to the hypothesis that K+ spatial buffering current through Müller cells is important in transferring K+ from the retina to the vitreous humor.
Fig. 3.
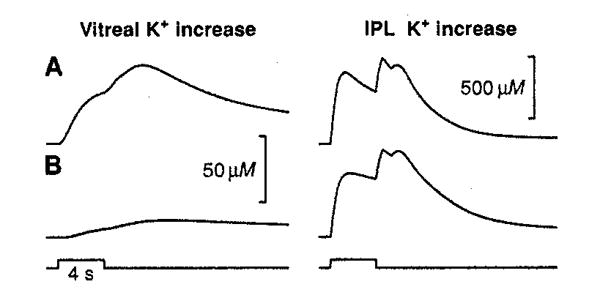
Computer simulation of the experiment in Fig. 1, A and B. Simulated Ba2+ in the model (i) substantially reduced and slowed the [K+]o increase in the vitreous and (ii) slowed the decay of the [K+]o response in the IPL (18).
Our results provide evidence that a large fraction of the light-evoked [K+]o increase in the vitreous humor is generated by K+ current flow through Miiller cells and demonstrates that spatial buffering by glial cells in situ occurs during the course of normal neuronal activity. Glial cells may function in a similar fashion to regulate [K+]o throughout the brain.
REFERENCES AND NOTES
- 1.Orkand RK, Nicholls JG, Kuffler SW. J Neurophysiol. 1966;29:788. doi: 10.1152/jn.1966.29.4.788. [DOI] [PubMed] [Google Scholar]
- 2.Ransom BR, Carlini WG. In: Astrocytes. Fedoroff S, Vernadakis A, editors. Vol. 2. Academic Press; Orlando: 1986. p. 1. [Google Scholar]
- 3.Gardner-Medwin AR, Nicholson C. J Physiol (London) 1983;335:375. doi: 10.1113/jphysiol.1983.sp014540. [DOI] [PMC free article] [PubMed] [Google Scholar]; Dietzel I, Heine-mann U, Hofmeier G, Lux HD. Exp Brain Res. 1980;40:432. doi: 10.1007/BF00236151. [DOI] [PubMed] [Google Scholar]; Gardner-Medwin AR, Coles JA, Tsacopoulos M. Brain Res. 1981;209:452. doi: 10.1016/0006-8993(81)90169-4. [DOI] [PubMed] [Google Scholar]; Coles JA, Orkand RK. J Physiol (London) 1983;340:157. doi: 10.1113/jphysiol.1983.sp014756. [DOI] [PMC free article] [PubMed] [Google Scholar]
- 4.Karwoski CJ. Physiol Bohemoslov. 1988;37:217. [PubMed] [Google Scholar]
- 5.Newman EA, Frambach DA, Odette LL. Science. 1984;225:1174. doi: 10.1126/science.6474173. [DOI] [PMC free article] [PubMed] [Google Scholar]
- 6.Newman EA. J Neurosci. 1985;5:2225. doi: 10.1523/JNEUROSCI.05-08-02225.1985. [DOI] [PMC free article] [PubMed] [Google Scholar]
- 7.Miller SS, Steinberg RH. J Membr Biol. 1977;36:337. doi: 10.1007/BF01868158. [DOI] [PubMed] [Google Scholar]
- 8.Karwoski CJ, Frambach DA, Proenza LM. J Neurophysiol. 1985;54:1607. doi: 10.1152/jn.1985.54.6.1607. [DOI] [PubMed] [Google Scholar]
- 9.Walz W, Shargool M, Hertz L. Neurosdmce. 1984;13:945. doi: 10.1016/0306-4522(84)90108-8. [DOI] [PubMed] [Google Scholar]
- 10.Rudy B. ibid. 1988;25:729. doi: 10.1016/0306-4522(88)90033-4. [DOI] [PubMed] [Google Scholar]
- 11.Astion ML, Coles JA, Orkand RK. Neurosci Lett. 1987;76:47. doi: 10.1016/0304-3940(87)90190-x. [DOI] [PubMed] [Google Scholar]
- 12.Henshel DS, Carras PL, Coleman PA, Miller RF. Invest Ophthalmol Vis Sci. 1985;26:116. [Google Scholar]; Newman EA. Nature. 1985;317:809. doi: 10.1038/317809a0. [DOI] [PMC free article] [PubMed] [Google Scholar]
- 13.Newman EA. J Neuroscio. 1987;7:2423. [Google Scholar]
- 14.Conner JD, Detwiler PB, Sarthy PV. J Physiol (London) 1985;362:79. doi: 10.1113/jphysiol.1985.sp015664. [DOI] [PMC free article] [PubMed] [Google Scholar]
- 15.Karwoski CJ, Proenza LM. J Gen Physiol. 1980;75:141. doi: 10.1085/jgp.75.2.141. [DOI] [PMC free article] [PubMed] [Google Scholar]
- 16.Karwoski CJ, Proenza LM. J Neurophysiol. 1977;40:244. doi: 10.1152/jn.1977.40.2.244. [DOI] [PubMed] [Google Scholar]
- 17.Odette LL, Newman EA. Glia. 1988;1:198. doi: 10.1002/glia.440010305. [DOI] [PubMed] [Google Scholar]
- 18.Values of [K+]o were calculated within the IPL (15 (μm from the ganglion cell-IPL border) and 20 μm into the vitreous humor. Values of retinal layer thickness, extracellular volume fraction (α), and Müller cell conductance (&glia) used in the simulation were as follows. [Format: retinal layer name, layer width (μm), α, &glia (S cm−3)]: vitreous humor, 2750, 1.0, no glial cell; inner limiting membrane— endfoot, 2.5, 1.0, 330; nerve fiber layer, 17.5, 0.041, 6.72; ganglion cell layer, 25, 0.041, 0.504; IPL, 50, 0.182, 0.286; inner nuclear layer, 35, 0.048, 0.196; outer plexiform layer, 10, 0.182, 0.84; outer nuclear layer, 17.5, 0.048, 0.196; rod inner segment layer, 12.5, 0.198, 0.196; subretinal space, 60, 0.198, no glial cell; retinal pigment epithelium, 10, 0.0007, no glial cell. Volume fractions from (8), Müller cell conductance values from (6). Extracellular tortuosity factor, λ, 2.02; passive-uptake space volume fraction, 0.8; passive-uptake rate constant, 0.15 s−1; active-uptake rate constant, 0.05 s−1.
- 19.The simulated control K+ response in the vitreous humor, although similar to the experimental response in time course, was smaller in amplitude (7% of the IPL response compared to 18% in experimental records; frog eyecups, diffuse flashes). This discrepancy may arise because we underestimated Müller cell K+ conductance in the model or because we omitted (for simplicity) a light-evoked K+ source in the ganglion cell layer.
- 20.Karwoski CJ, Newman EA. Vision Res. 1988;28:1095. doi: 10.1016/0042-6989(88)90136-8. [DOI] [PubMed] [Google Scholar]
- 21.We thank B. Oakley II for suggesting the use of Ba2+ to test Müller cell function and L. L. Odette for assistance with the computer simulations. Supported by NIH grant EY 03526 to C.J.K. and grant EY 04077 to E.A.N.