

Abstract
The mammalian pulvinar nucleus (PUL) establishes heavy interconnections with the parietal lobe, but the precise nature of these connections is only partially understood. To examine the distribution of corticopulvinar cells in the cat, we injected the PUL with retrograde tracers. Corticopulvinar cells were located in layers V and VI of a wide variety of cortical areas, with a major concentration of cells in area 7. To examine the morphology and distribution of corticopulvinar terminals, we injected cortical areas 5 or 7 with anterograde tracers. The majority of corticopulvinar axons were thin fibers (type I) with numerous diffuse small boutons. Thicker (type II) axons with fewer, larger boutons were also present. Boutons of type II axons formed clusters within restricted regions of the PUL. We examined corticopulvinar terminals labeled from area 7 at the ultrastructural level in tissue stained for γ-aminobutyric acid (GABA). By correlating the size of the presynaptic and postsynaptic profiles, we were able to quantitatively divide the labeled terminals into two categories: small and large (RS and RL, respectively). The RS terminals predominantly innervated small-caliber non-GABAergic (thalamocortical cell) dendrites, whereas the RL terminals established complex synaptic arrangements with dendrites of both GABAergic interneurons and non-GABAergic cells. Interpretation of these results using Sherman and Guillery’s recent theories of thalamic organization (Sherman and Guillery [1998] Proc Natl Acad Sci U S A 95:7121–7126) suggests that area 7 may both drive and modulate PUL activity.
Indexing terms: cortex, thalamus, visual system, sensorimotor, ultrastructure
The feline pulvinar nucleus (PUL) receives input from a wide array of cortical areas (Raczkowski and Rosenquist, 1983) as well as the pretectum (PT; Berman, 1977; Berson and Graybiel, 1978; Schmidt et al., 2001; Baldauf et al., 2005). However, the contribution of these inputs to the response properties of PUL neurons is unknown. The cells of the PUL have large visual receptive fields that often lack clear boundaries; they respond more robustly to diffuse illumination than to small visual cues (Godfraind et al., 1972; Mason, 1981). They do not appear to code information regarding saccade parameters, but their responses are modulated by saccadic eye movements. Sudkamp and Schmidt (2000) identified three general classes of neurons in the feline PUL: “S” neurons are active during saccadic eye movements, “V” neurons are responsive to visual stimuli and unresponsive to eye movements, and “SV” neurons respond to both stationary ON and OFF stimuli and to sudden stimulus shifts.
These response properties are similar in many respects to those of neurons in the parietal cortex, an area that establishes extensive reciprocal connections with the PUL (de V Clüver and Campos-Ortega, 1969; Heath and Jones, 1971; Robertson and Cunningham, 1981; Niimi et al., 1983; Raczkowski and Rosenquist, 1983; Avendaño et al., 1985; Olson and Lawler, 1987). In the cat, these cortical areas are primarily located within the middle suprasylvian gyrus (MSg) or cytoarchitectonically in areas 5 and 7 (Gurewitsch and Chachaturian, 1928). Neurons located in this region were originally described as polysensory (Amassian, 1954); although later studies indicated that neurons within this region could be categorized primarily based on their responses to visual stimuli, including stationary spots, brisk movements, and oriented edges (Thompson et al., 1963; Dow and Dubner, 1969, 1971; Robertson et al., 1975; Yin and Greenwood, 1992a,b). More recently, visual, saccade, and fixational responses were distinguished within more caudal portions of the MSg (Yin and Greenwood, 1992b).
It has been suggested recently that the cortex may provide the primary or driving input to higher order nuclei, such as the PUL and lateral posterior nucleus (LP; Guillery, 1995; Guillery et al., 2001). This is based on the observation that terminals in the LP originating from layer V of the striate cortex are similar in morphology (RL profiles, denoting large terminals that contain round vesicles) to retinal terminals in the dorsal lateral geniculate nucleus (dLGN; Vidnyánszky et al., 1996; Feig and Harting, 1998). Because RL profiles have been observed in the PUL (Majorossy et al., 1965; Baldauf et al., 2003), the similarities in the response properties of PUL neurons and parietal cortex neurons could be due to a driving influence of cortical projections to the PUL. However, the ultrastructure of parietal cortical projections to the PUL has not been examined previously. The goal of this study was to examine the synaptic arrangements of parietopulvinar terminals, and the laminar distribution of parietopulvinar cells, as a first step toward understanding how cortical inputs may influence the response properties of PUL neurons. In the accompanying paper, we describe the synaptic arrangements and cells of origin of the pretectal input to the PUL (Baldauf et al., 2005).
MATERIALS AND METHODS
Experimental animals
Eight cats, each weighing 3– 4 kg, were used in this study. All procedures were conducted in accordance with National Institute of Health Guidelines for the Care and Use of Laboratory Animals and were approved by either the University of Louisville or the University of Mississippi Medical Center Animal Care and Use Committee. Tracers were placed in area 7 of four cats, in area 5 of two cats, and in the PUL of three cats (Table 1).
TABLE 1.
Summary of the Injections Made in the MSg and PUL1
| Cat | Injection site | Tracer |
|---|---|---|
| 99-10R | Area 7 | BDA |
| 01-13R | Area 7 | FDA |
| 01-18L | Area 7 | FDA |
| 03-07R | Area 5 | FDA |
| 03-08R | Area 5 | FDA |
| 03-08L | Area 7 | RDA |
| 00-01R | PUL | GFM |
| 03-01R | PUL | FDA |
| 03-09R | PUL | WGA-HRP |
FDA, fluorescein conjugated to dextran amine (Molecular Probes, Eugene, OR); GFM, green fluorescent microspheres (Luma Fluor, Naples, FL); RDA, rhodamine conjugated to dextran amine (Molecular Probes); WGA-HRP, wheat germ agglutinin conjugated to horseradish peroxidase (Sigma, St. Louis, MO). For other abbreviations, see list.
Surgery and tracer injections
The cats were initially anesthetized with an intramuscular injection of ketamine hydrochloride (45 mg/kg). The trachea was intubated, and gas anesthesia was maintained with a compound gas of 1–2% halothane and 0.5–1% nitrous oxide mixed in oxygen. The skull and the dura overlying MSg or the PUL were opened. A 1-μl Hamilton syringe was oriented at an angle of 20 degrees from vertical, was lowered into the MSg, and a tracer was injected. In one additional cat, a piece of Gelfoam, which was saturated with a 5% aqueous solution of biotinylated dextran amine (BDA; molecular weight, 10,000; Molecular Probes), was placed on the surface of area 7. Thalamic injections were made in three cats. A 1-μl Hamilton syringe was lowered vertically, and pressure injections were placed in the PUL.
Histological processing
Perfusion and sectioning
After a survival time of 7 days or 1–2 days in the case of wheat germ agglutinin–horseradish peroxidase (WGA-HRP) injections, the cats were deeply anesthetized with an intravenous injection of sodium pentobarbital (30 –50 mg/kg) and transcardially perfused with Tyrode’s solution (Hayat, 1981) followed by 1–2 liters of 2% paraformaldehyde with 1.5–2% glutaraldehyde, or 4% paraformaldehyde in a 0.1 M sodium phosphate buffer (PB; pH 7.4) solution. The brains were removed and immersed overnight at 4°C in the fixative. Thalamic and visual cortical blocks were cut in the coronal plane with a vibratome into 50- to 100-μm-thick sections.
Light level histological processing
Sections processed for light-level observation of BDA were placed in a 1:100 dilution of avidin– biotin– horseradish peroxidase complex (ABC; Elite Vectastain ABC Kit, Vector, Burlingame, CA) containing 1% normal goat serum (NGS) in phosphate buffered saline (PBS; 0.01 M PB, pH 7.4, 0.9% NaCl with 0.05– 0.5% Triton X-100) overnight at 4°C. After washing in PB, the HRP was revealed by reacting with nickel-intensified diaminobenzidine (DAB; Sigma). Sections processed for light level observation, which contained fluorescein conjugated to dextran amine (FDA) or rhodamine conjugated to dextran amine (RDA) were placed in 10% NGS for 30 minutes, and then placed, respectively, into a 1:10,000 dilution of biotinylated goat anti-fluorescein (Vector), or a 1:2,000 dilution of biotinylated goat anti-rhodamine (Vector) overnight at 4°C. After washes in PB, the sections were placed in ABC for 1 hour, and the HRP was reacted with nickel-intensified DAB as described above. Reacted sections were mounted on subbed slides, and cleared and cover-slipped for light microscopic examination.
For cortical sections containing WGA-HRP, processing was performed using a variation of the 3,3′,5,5′ tetramethylbenzidine (TMB) protocol of Olucha et al. (Olucha et al., 1985; see Chen and May, 2002, for details). Briefly, sections were incubated in a 0.005% TMB solution in 0.1 M PB (pH 6.0) with 0.25% ammonium molybdate, 2.5% ethanol, and 0.1% hydrogen peroxide at 4°C for 12 hours. They were then stabilized in 5% ammonium molybdate dissolved in 0.1 M PB (pH 6.0). The sections were rinsed in and mounted out of this same buffer. After drying, they were counterstained with cresyl violet, dehydrated, cleared, and cover-slipped.
Electron microscopic processing
Sections selected for ultrastructural observation were initially treated with 0.3% Triton X-100 for 30 minutes, then put into ABC or the appropriate primary antibody solution, as described above. After the DAB reaction, selected sections were post-fixed in 2% osmium tetroxide solution dissolved in PB, dehydrated in an ascending alcohol series, and embedded in Durcupan ACM epoxy resin. Seventy-nanometer-thick sections were cut with an ultramicrotome, and every fifth section was collected on Formvarcoated nickel slot grids. Every third section in this collection was immunostained for GABA using previously described techniques (Patel and Bickford, 1997), which use Triton X-100 instead of periodates to allow antibody penetration through the resin surface (as recommended by de Zeeuw et al., 1988).
Data collection and analysis
Terminal sampling
For ultrastructural analysis of corticopulvinar terminals, ultrathin sections were cut from blocks of the PUL that contained labeled terminals (99–10R, 01–18L). Using a Philips CM10 electron microscope, we examined labeled cortical terminals in all GABA-stained sections and photographed every labeled terminal that was engaged in a synapse.
Computer-generated figures
The distributions of corticopulvinar cells and terminals were plotted using a MD3 Microscope Digitizer system (AccuStage Co., Shoreview, MN) consisting of a digitizing microscope stage and the MD Plot 4.0 data acquisition software. The computer files generated by this program were converted using Freelance Graphics 2.1 software (Lotus Development Co., Cambridge, MA), then combined and composed using Corel Draw 10 software (Corel Co. Ottawa, ON, Canada). Light microscopic photomicrographs were taken using a microscope and an attached digitizing camera (Spot RT, Diagnostic Instruments, Sterling Heights, MI), and the files were combined and composed using Adobe Photoshop 7.0 software (Adobe Systems, Inc., San Jose, CA) to best match their observed appearance.
Quantification of GABA immunoreactivity
We calculated the density of gold particles overlying labeled corticopulvinar terminals and their postsynaptic targets. We considered the gold density overlying cortical terminals to be an indicator of background staining of a known non-GABAergic projection (Fosse and Fonnum, 1987). By using the mean gold particle density overlying cortical terminals +2 standard deviations (representing approximately 98% of the population) as an upper threshold for GABA-immunonegative profiles, we estimated the number of postsynaptic profiles that were GABAergic and non-GABAergic.
Nomenclature
Several different criteria have been used to define the parietal cortex of the cat (see Fig. 1 of Olson and Lawler, 1987). For this study, we used the original nomenclature of Gurewitsch and Chachaturian (1928) based on the application of Brodmann’s cortical map (Brodmann, 1909) to divide the MSg into an anterior area 5 and a posterior area 7. For subdivisions of the lateral posterior–pulvinar complex (LP-PUL), we have used the nomenclature of Graybiel and Berson (1980).
RESULTS
Distribution of corticopulvinar neurons and pulvinocortical fibers
In three cats, we injected the PUL with tracers to examine the areal and laminar distribution of cortical cells that project to the PUL. As illustrated in Figures 1–4, cells labeled by retrograde transport from the PUL were located in infragranular layers of a wide variety of visual cortical areas. Within parietal cortex, the major concentrations of labeled cells were located in areas 7, 21a, and the medial bank of the posterior lateral suprasylvian sulcus (PMLS; Fig. 2). Labeled cells were also present in the posterior cingulate cortex (PCC) and the splenial visual area (SVA), particularly in case 03-01 (Fig. 4). Labeling in area 5 was also more extensive in this case (Fig. 4). Labeling of cells in area 17 correlated with the extent of tracer spread into the adjacent lateral subdivision of the LP (LPl; most extensive in case 03–09, Fig. 2), as this region receives heavy projections from area 17 (Abramson and Chalupa, 1985).
Fig. 1.

A–C: Corticothalamic cells labeled by retrograde transport after an injection of wheat germ agglutinin– horseradish peroxidase into the PUL (A, case 03–09R) are distributed in layers V and VI of the MSg (B,C). Shown is tissue reacted with stabilized 3,3′,5,5′ tetramethylbenzidine (TMB) with a cresyl violet counterstain. D,E: Layer V corticopulvinar cells (D) are generally larger than layer VI corticopulvinar cells (E). For abbreviations, see list. Scale bars = 1 mm in A (applies to A,B); 250 μm in C; 30 μm in E (applies to D,E).
Fig. 4.

A–I: The distributions of corticothalamic cells (black squares) labeled by retrograde transport and pulvinocortical terminals (black bars) labeled by anterograde transport after an injection of fluorescein conjugated to dextran amine into the PUL (reconstruction of the injection site is shown in the four sections to the right of I; case 03–01) are plotted in cortical sections. The first cortical section (A) corresponds to the Horsley–Clarke coordinate P10.0. The distance between sections is 2.1 mm. For abbreviations, see list. Scale bar = 10 mm for cortical sections; 12.5 mm for thalamic sections.
Fig. 2.


A–L: The distributions of corticothalamic cells (black squares) labeled by retrograde transport after an injection of wheat germ agglutinin– horseradish peroxidase into the PUL (reconstruction of the injection site is shown in the four sections to the right of L; case 03–09) are plotted in cortical sections. The first cortical section (A) corresponds to Horsley–Clarke coordinate P10.0. The distance between sections is 2.1 mm. Cortical sections rostral from the most anterior level (L) shown here did not contain labeled neurons. For abbreviations, see list. Scale bar = 10 mm.
In all extrastriate visual cortical areas, the labeled corticopulvinar neurons were located within both layers V and VI, whereas in the PCC and SVA, they were located very close to the white matter/gray matter border. Within area 7, labeled cells were distributed over a wide region of the cortex, from just ventral to layer IV to just dorsal to the white matter (Fig. 1B,C). As illustrated in Figure 5, by correlating soma size with distance from the cortical surface, area 7 corticopulvinar cells can easily be separated into two groups of neurons: large cells located in layer V and small cells located in layer VI.
Fig. 5.
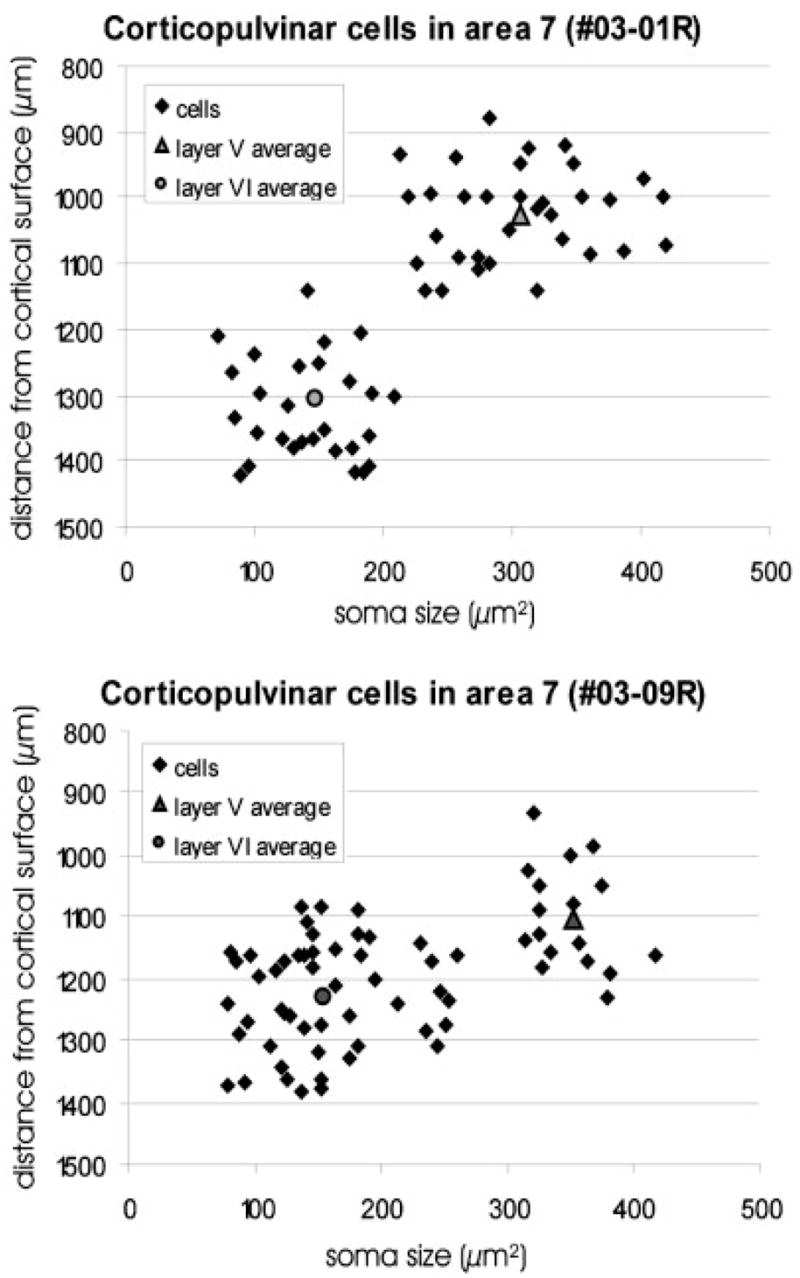
The soma size of corticopulvinar cells within area 7 and their distance from the cortical surface is plotted for the two cases (03–01, 03–09). The layer V cells are larger than the layer VI cells.
In case 03-01, the mean soma area of layer V corticopulvinar cells in area 7 was 306.6 μm2 (SD 58.1) and their average distance from the surface was 1,025 μm (SD 69.5). In contrast, the mean soma area of layer VI corticopulvinar cells in area 7 was 147 μm2 (SD 44), and the mean distance from the surface was 1,306 μm (SD 103). In case 03–09, the mean soma area of layer V corticopulvinar cells in area 7 was 351 μm2 (SD 28) and their average distance from the surface was 1,102 μm (SD 84). The mean soma area of layer VI corticopulvinar cells in area 7 was 155 μm2 (SD 57), and their average distance from the surface was 1,229 μm (SD 87). In case 03-01, an approximately equal number of layer V and VI corticopulvinar cells were labeled in area 7. In case 03–09, there were approximately three times more labeled layer VI corticopulvinar cells in area 7 than labeled layer V corticopulvinar cells.
The labeled neurons were primarily pyramidal in shape (Figs. 1D,E, 3A,C). In rare instances, the apical dendrites of layer V cells labeled by the retrograde transport of FDA (case 03-01) could be seen to extend to the cortical surface (Fig. 3A). In contrast, the apical dendrites of layer IV cells were never observed to extend past layer IV (Fig. 3C).
Fig. 3.

A,C,F: Corticopulvinar cells labeled after an injection of fluorescein conjugated to dextran amine in the PUL (F; case 03–01R), are observed in layer V, with dendrites that extend to layer I (A, cell in area 7) and layer VI, with dendrites that extend to layer IV (C, cell in area 7). B,D,E: Pulvinocortical terminals labeled from the same injection were primarily distributed in layers I and IV (B, terminals in the PCC, D,E, terminals in area 7). For abbreviations, see list. Scale bars = 30 μm in A (applies to A–C), E (applies to D,E); 1 mm in F.
FDA injected into the PUL also labeled pulvinocortical fibers by means of anterograde transport. These labeled axons and terminals were concentrated within layers IV and I (Fig. 3B,D,E). As indicated schematically in Figure 4, labeled pulvinocortical terminal fields were concentrated in area 7, 20a, 21a, SVA, and PCC. Sparser distributions of terminals were observed in areas 19, PMLS, and the lateral bank of the posterior lateral suprasylvian sulcus (PLLS).
Distribution and morphology of corticopulvinar fibers
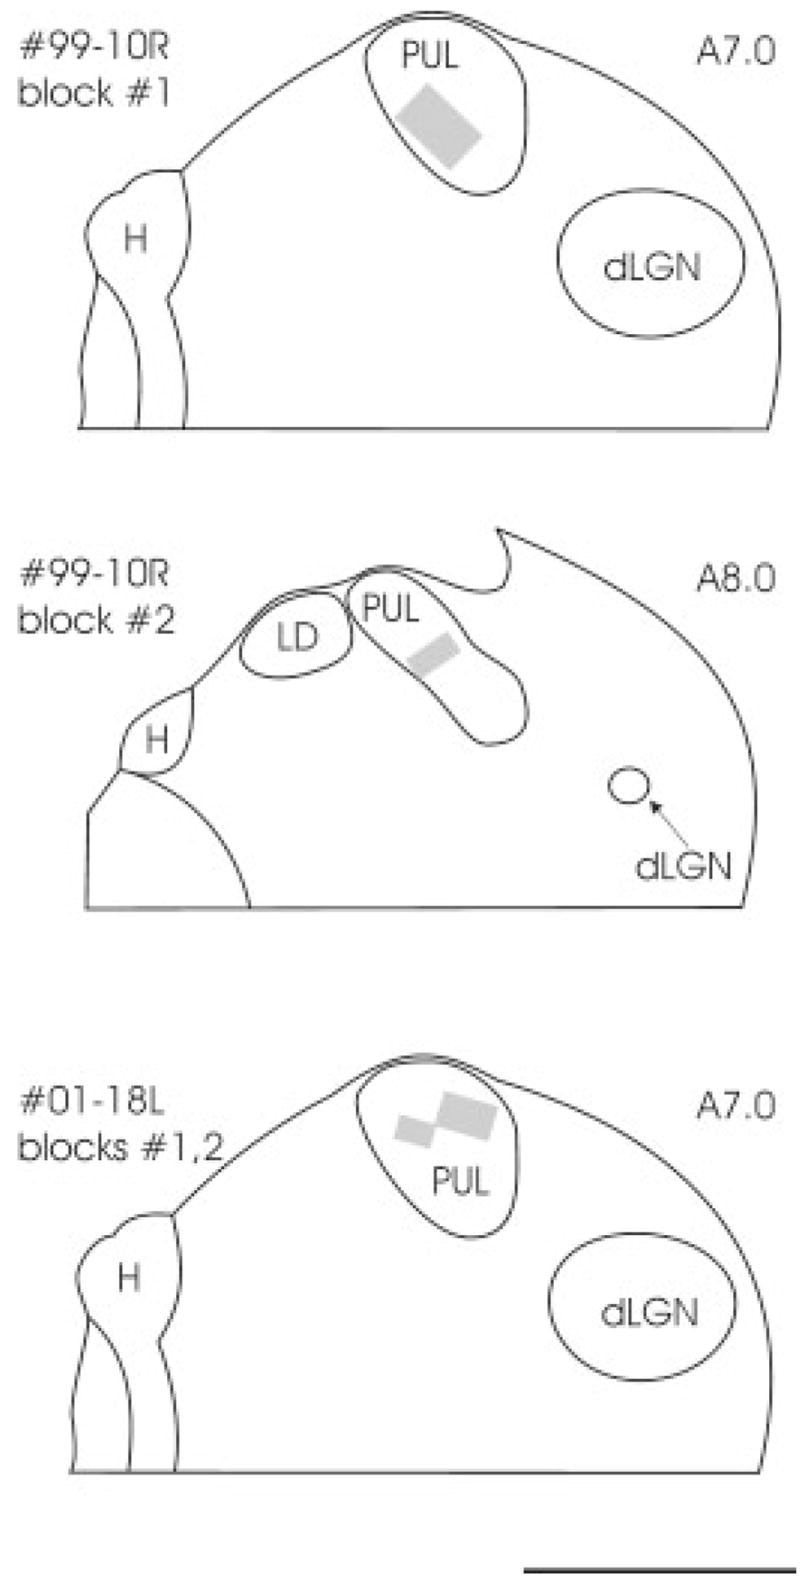
To label corticothalamic terminals, we placed tracer injections into area 7 of four cats and area 5 of two cats. In three of these cases, the injection sites were confined to a limited region of cortical area 7. Dense corticothalamic terminal labeling was restricted to the PUL. When a single injection was placed in area 7, the labeled corticothalamic terminals formed a restricted patch within the PUL (Fig. 6, top). A similar pattern of labeling was seen after restricted injections of area 5 in the more rostral regions of the MSg (Fig. 6, bottom). When multiple injections were placed at several rostrocaudal sites within area 7, the labeled corticothalamic terminals extended in an elongated patch within the PUL that was oriented in the dorsomedial to ventrolateral direction (Figs. 6, middle, 7). In all cases involving injection of area 7, labeled terminals were also present in the nucleus of the optic tract (NOT) of the pretectal nuclear complex.
Fig. 6.

Injection of tracers in area 7 (top; case 99–10R; middle, case 018L) and area 5 (bottom; case 03–07R) are reconstructed on the cortical surface and in a coronal section of the visual cortex (on the left). The resulting distributions of corticothalamic and corticopretectal terminals labeled by anterograde transport are indicated schematically (gray patches) in a series of coronal sections through the diencephalon. Corticothalamic terminals were located primarily in the PUL and corticopretectal terminals were observed in the NOT. The approximate position of each section is indicated by Horsley–Clarke stereotaxic coordinates. For abbreviations, see list. Scale bar = 5 mm for the thalamic sections; 20 mm for the cortical sections.
Fig. 7.

A,B: Injection of fluorescein labeled dextran amine in area 7 (A, case 01–18L) resulted in the labeling of an elongated patch of corticothalamic terminals and occasional thalamocortical cells in the PUL (B). C, D, E: Higher magnification photomicrographs of three zones within this patch are shown (photograph locations indicated in B). For abbreviations, see list. Scale bars = 1 mm in A (applies to A,B); 100 μm in E (applies to C–E).
Large injections, which covered either area 7 or area 5 (Fig. 8), and additionally involved area PMLS or the medial bank of the anterior lateral suprasylvian sulcus (AMLS) respectively, resulted in a much more extensive pattern of label within the thalamus. While major concentrations of corticothalamic terminals were still distributed within the PUL, additional terminal fields were distributed within the LP, laterodorsal (LD) and centrolateral (CL) nuclei in both cases. After the large area 5 injection, terminals were also distributed within the suprageniculate (Sg), and posterior thalamic (PO) nuclei. In addition, whereas limited labeling of thalamocortical cells was observed after our smaller injections (Fig. 6), the large injections labeled thalamocortical cells distributed widely across the thalamus (Fig. 8).
Fig. 8.

Large injections of tracers in area 7 (top; case 03–08L) and area 5 (bottom; case 03–08R) with involvement of the neighboring PMLS (top) and AMLS (bottom), are reconstructed on the cortical surface and in a coronal section of the visual cortex (on the left). The major distributions of terminals labeled by anterograde transport are indicated schematically with gray patches, and the distributions of cells that were most intensely labeled by retrograde transport are indicated by black dots in a series of coronal sections through the diencephalon. The densest distributions of corticothalamic terminals were located in the PUL, the LPl, the LD, the CL, and the Sg. Corticopretectal terminals were located in the NOT. The approximate position of each section is indicated by Horsley–Clarke stereotaxic coordinates. For abbreviations, see list. Scale bar = 5 mm for the thalamic sections (right); 20 mm for the cortical sections (left).
Figures 9 and 10 illustrate the morphology of two types of corticothalamic axons and terminals that were observed in the PUL after tracer injections in area 5 or 7. The majority of labeled fibers were thin axons that ran for long distances. These axons distribute diffuse terminals either as en passant swellings or as single boutons at the end of short side branches (Figs. 9, 10C,D,G). The morphology of these fibers is similar to corticogeniculate fibers, which were originally termed type I by Guillery (1966) in Golgi-stained dLGN tissue. A second type of corticopulvinar fiber was observed less frequently. These axons were thicker, more sinuous, and gave rise to dense grape-like clusters of large terminals (Figs. 9, 10B,F,H, arrows). The morphology of these fibers is similar to those of retinogeniculate fibers, which were originally termed type II by Guillery (1966).
Fig. 9.

Camera lucida drawings of the two morphological types of corticopulvinar axons that were labeled by anterograde transport after injections in area 7 (from case 99–10). The type I axons are thin and give rise to small en passant boutons or bouton termineaux on the end of short side branches. The type II axons are thicker and give rise to grape-like clusters of large boutons. Scale bar = 10 μm.
Fig. 10.

A–J: Corticopulvinar terminals labeled by anterograde transport and pulvinocortical cells labeled by retrograde transport in case 03–08 are illustrated. C,D,G: Type I corticopulvinar axons distribute diffuse terminals either as en passant swellings or as single boutons at the end of short side branches. B,F,H: Type II corticopulvinar axons are thicker and give rise to dense clusters of large terminals (arrows). A,E,F,H–J illustrate the morphology of labeled pulvinocortical cells. Scale bar = 30 μm in A (applies to A–J).
The distribution of type I and II terminals within the PUL was variable. In the regions that contained the densest distribution of terminals, both were observed (Fig. 10H). However, type I corticothalamic terminals were often densely distributed in regions where few or no type II terminals were observed (Fig. 10E,I,J). In addition, isolated clusters of type II terminals were occasionally observed in regions that contained few or no type I terminals (Fig. 10B,F).
Ultrastructure and synaptic targets of corticopulvinar terminals
As illustrated in Figure 11, we examined four blocks of tissue that contained labeled corticopulvinar terminals. Two morphological types of labeled terminals were observed at the electron microscopic level, which correspond to the type I and type II terminals observed at the light microscopic level. As illustrated in Figures 12A (99–10R) and 13A (01–18L), type II corticothalamic terminals are large terminals that contain round vesicles (RL profiles; mean minor diameter; MMD = 1.44 μm; SD 0.58). RL profiles contact both GABA-immunoreactive dendrites of interneurons that contain vesicles (F2 profiles; MMD = 1.47μm; SD 0.56) and GABA-immunonegative dendrites of thalamocortical cells (MMD = 1.41μm; SD 0.51) in complex synaptic arrangements known as glomeruli (Majorossy et al., 1965; Hirata, 1966).
Fig. 11.
The locations of tissue blocks of the PUL prepared for ultrastructural examination are schematically indicated with gray squares. The approximate position of each section is indicated by Horsley–Clarke stereotaxic coordinates. For abbreviations, see list. Scale bar = 2 mm.
Fig. 12.

Electron micrographs illustrate the ultrastructure of corticopulvinar terminals (case 99–10R). A: A large (RL) terminal participates in a glomerulus-like arrangement in which it contacts (arrowheads) a γ-aminobutyric acid (GABA) -immunonegative dendrite (low density of gold particles) and three GABA-immunoreactive profiles (high density of gold particles) that contain vesicles. B: A small (RS) terminal contacts (arrowhead) a GABA-immunoreactive dendrite that contains scattered vesicles. This dendrite is also contacted by an unlabeled RS profile. C: An RS terminal contacts (arrowhead) a small GABA-immunonegative dendrite. Scale bar = 1 μm in A (applies to A–C).
Type I corticothalamic terminals are small profiles that contain round vesicles (RS profiles; nomenclature of Guillery, 1969; MMD = 0.62μm; SD 0.19). RS profiles primarily contact small-caliber GABA-immunonegative dendrites (MMD = 0.83μm; SD 0.24), presumably the distal dendrites of thalamocortical cells (Figs. 12B,C, 13B,C) and less frequently contact GABA-immunoreactive dendrites (Fig. 12B; MMD = 0.79μm; SD 0.26). RS profiles are rarely involved in complex synaptic arrangements. They tend to establish single synaptic contacts with extraglomerular dendrites that are contacted by additional unlabeled RS profiles.
Fig. 13.

Electron micrographs illustrate the ultrastructure of corticopulvinar terminals (case 01–18L). A: A large (RL) terminal participates in a glomerulus-like arrangement in which it contacts (arrowheads) three γ-aminobutyric acid (GABA) -immunoreactive profiles (high density of gold particles) that contain vesicles. B,C: Small (RS) terminals contact (arrowheads) small GABA-immunonegative (low density of gold particles) dendrites. Scale bars = 1 μm A, C (applies to B,C).
We analyzed the GABA immunoreactivity of a total of 264 profiles postsynaptic to labeled cortical terminals originating from area 7 in two cases (Fig. 14). By using a visual (qualitative) assessment to divide the labeled terminals into RS and RL categories, we found that RL profiles terminated on approximately equal numbers of GABAergic (53 of 107) and non-GABAergic profiles (54 of 107), while RS profiles tended to contact mostly non-GABAergic dendrites (35 of 40). However, because our categorization of the terminal types could be biased by the nature of the postsynaptic profiles, we tested whether a more quantitative method could be used to divide the presynaptic profiles into two groups for subsequent analysis of their postsynaptic targets.
Fig. 14.
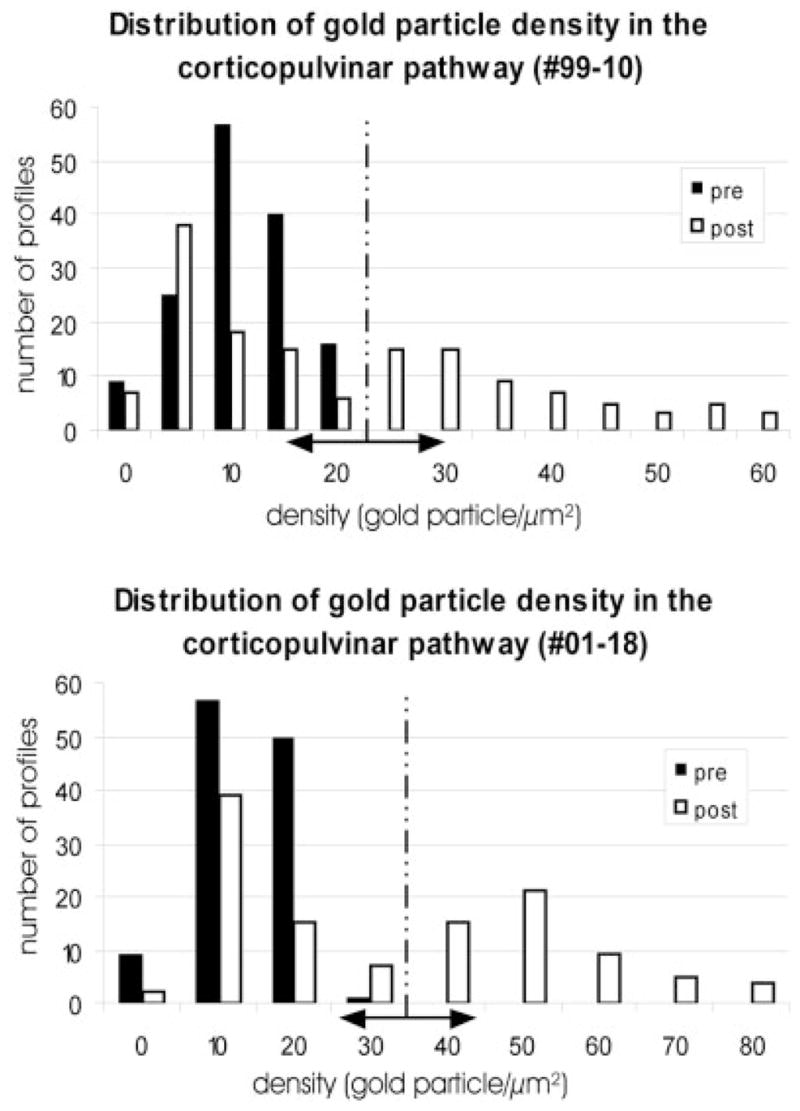
The histograms illustrate the quantification of γ-aminobutyric acid (GABA) immunolabeling of labeled area 7 corticopulvinar terminals (pre) and their postsynaptic profiles (post) in the two cases examined (99–10R and 01–18L). Using the mean gold particle density overlying cortical terminals +2 standard deviations as an upper threshold for GABA-immunonegative profiles (vertical dashed line), we estimated the number of GABAergic and non-GABAergic profiles that were postsynaptic to labeled corticopulvinar terminals.
Therefore, we tested whether two quantitative parameters could be used to divide the corticothalamic terminals into RS and RL profiles. We plotted the minor diameters of cortical profiles as a function of the minor diameters of their postsynaptic targets (Fig. 15). By using the presynaptic minor diameter and the postsynaptic minor diameter as coordinate values of a vector attributed to each synapse, we summed all these vectors to obtain a single summed vector (Fig. 15, top panels). Next, the distances (calculated as absolute values |x|) of each data point from the summed vector were divided into two sets (RS and RL) that differed most significantly from each other as determined by a student t test. The cutoff point between the data sets is shown on the summed vector, and a line perpendicular to the summed vector illustrates the division of the data points into RS and RL categories (Fig. 15).
Fig. 15.

Scatter plots of the minor diameter of labeled corticopulvinar terminals as a function of the minor diameter of their postsynaptic targets (top left: 99–10R; top right: 01–18L) illustrate the correlation between the size of presynaptic and postsynaptic partners. The bisector (solid line) represents the summed vector of all the data points, and the normal (dotted line) represents the point that divides the two populations with the most significant difference. Using this method to divide the terminals into small terminal (RS) and large terminal (RL) profiles, the number of γ-aminobutyric acid (GABA) -ergic and non-GABAergic postsynaptic profiles was calculated and is illustrated in the bottom histograms.
By using this quantitative method to divide the terminals, we then conducted a more detailed analysis of the postsynaptic targets of RS and RL profiles (Fig. 15, bottom panels). Combining data from both cases, we determined that 60 of 87 RS terminals (69%) contacted GABA-immunonegative profiles, whereas only 27 (31%) contacted GABA-immunoreactive profiles. In contrast, 82 of 177 RL terminals (46.3%) contacted GABA-immunonegative profiles, whereas 95 (53.7%) made connections with GABA-immunoreactive ones (Fig. 15). Nearly all GABA-positive postsynaptic profiles contained vesicles (121 of 122).
As illustrated in Figure 16, our quantitative method, using two variables, resulted in estimates of RS and RL numbers that were very close to our qualitative assessments. In contrast, if only the minor diameter of the presynaptic profile was used to divide the terminals (one variable), the estimates of numbers of RS and RL profiles were quite different from either our qualitative assessment of terminal type or our quantitative assessment using two variables.
Fig. 16.
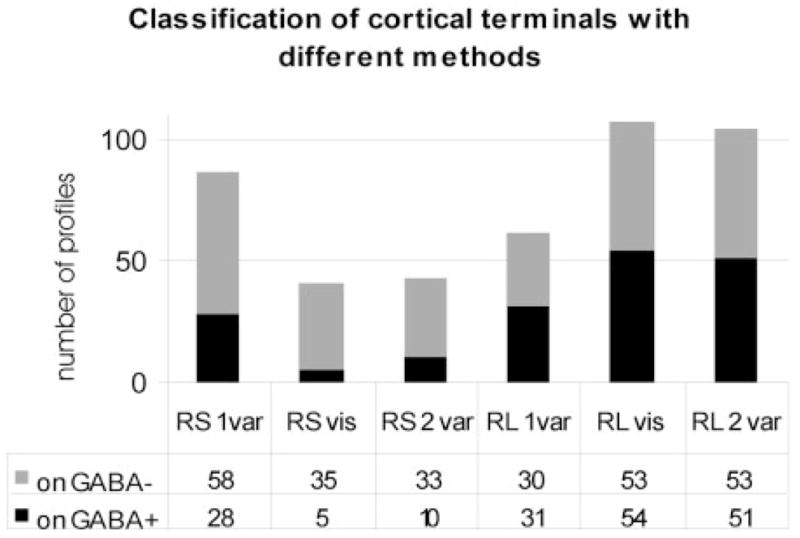
The histogram compares the results of different methods of classification of cortical terminals (in case 99–10R). Using terminal size alone (1 var), the proportion of small terminal (RS) and large terminal (RL) profiles was different than when using terminal and postsynaptic profile size (2 var) or qualitative visual assessment (vis) to categorize the terminal types. The result of quantitative categorization using two variables was similar to the result using qualitative visual assessment. GABA, γ-aminobutyric acid.
Finally, it should be noted that, to obtain an adequate sample of type I and type II terminals for our ultrastructural analysis, we purposely chose blocks that contained several clusters of type II terminals. Because each RL terminal makes multiple synaptic contacts, our overall sample contained a larger number of profiles that were postsynaptic to RL terminals than profiles postsynaptic to RS terminals (case 99–10: 43 profiles postsynaptic to RS profiles or 29.2%, 104 profiles postsynaptic to RL profiles or 70.8%; case 01–18: 44 profiles postsynaptic to RS profiles or 37.6%, 73 profiles postsynaptic to RL terminals or 62.4%). This distribution of terminal types does not reflect the overall distribution of type I and type II terminals observed at the light microscopic level, and should not be taken as representative of the overall distribution of RS and RL corticothalamic terminals in the PUL.
DISCUSSION
Figure 17 summarizes the present findings and those of previous studies. Confirming earlier studies (Waller and Barris, 1937; Raczkowski and Rosenquist, 1983; Olson and Lawler, 1987; Paré and Smith, 1996), we found that the MSg (cortical areas 5 and 7) projects to the PUL. After our larger injections, we observed additional projections to the LP, LD, and CL. However, when our injections were confined to the crown of the MSg, with no spread into the adjacent cortex, or the underlying white matter, corticothalamic terminals were essentially confined to the PUL. These results suggest that the primary thalamic target of the MSg is the PUL.
Fig. 17.
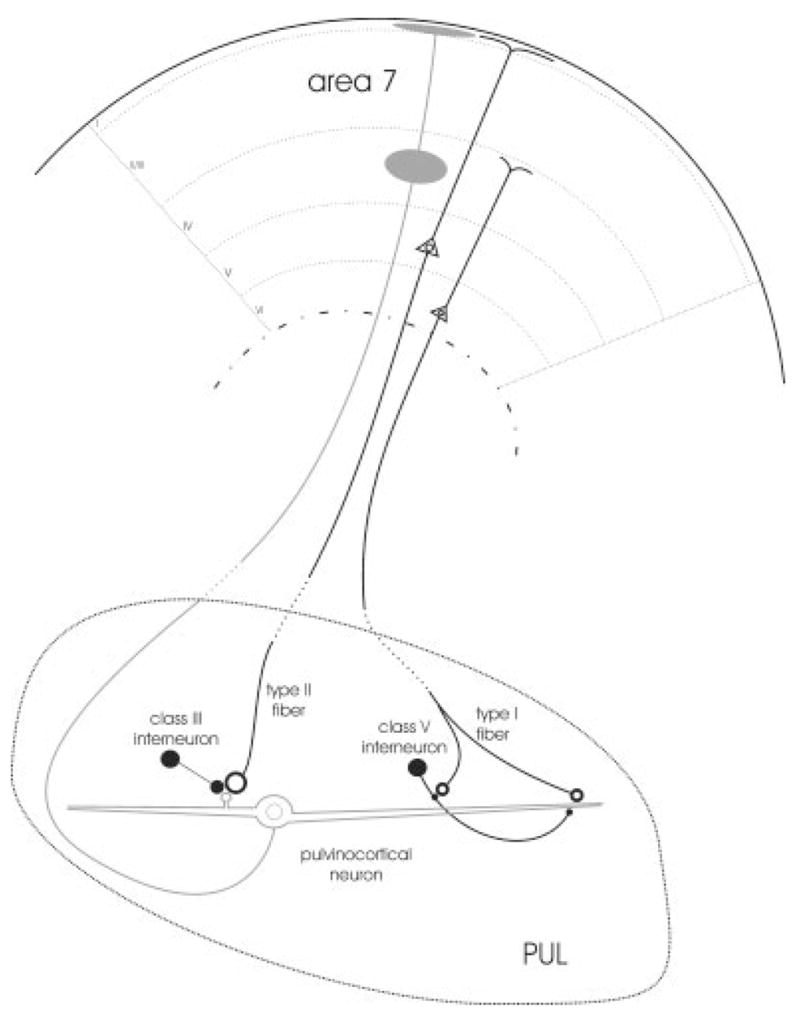
The schematic diagram summarizes the reciprocal connections between the PUL and cortical area 7. Neurons in both layers V and VI of area 7 project to the PUL and presumably give rise type II and I axons, respectively. Type I axons primarily innervate the distal dendrites of pulvinocortical cells. Occasionally, small terminal profiles contact the dendrites of interneurons, presumably those of class V interneurons (Carden and Bickford, 2002). Type II axons gives rise to large terminals that innervate glomeruli where they contact approximately equal proportions of pulvinocortical cell dendrites and the dendritic terminals of interneurons (presumably those of class III interneurons). Pulvinocortical projections to area 7 terminate primarily in layers I and IV, where the apical dendrites of layer V and layer VI corticopulvinar cells arborize, respectively. For abbreviation, see list.
Within the MSg, we found that corticopulvinar cells were located in both layers V and VI. Correspondingly, anterograde labeling from area 5 or 7 resulted in two types of terminals in the PUL. Thin axons (type I, presumably arising from layer VI cells) distributed numerous widespread RS boutons in the PUL. Thicker axons (type II, presumably arising from layer V cells) distributed less frequent RL boutons, which ended in clusters within more restricted regions of the PUL. The tendency for RS profiles to innervate small-caliber dendrites and of RL profiles to innervate larger-caliber dendrites enabled us to quantitatively differentiate between RS and RL terminals and examine their synaptic arrangements separately. RS profiles primarily contacted thalamocortical cells (69%) and less frequently interneurons (31%). Both types of RS contacts occurred extraglomerularly. In contrast, RL profiles contacted approximately equal numbers of thalamocortical cells (54%) and interneurons (46%) within glomeruli.
Two types of corticopulvinar cells and fibers and their relation to pulvinar circuitry
Previous studies have indicated that there are at least two different types of corticothalamic cells (Ojima, 1996; Deschênes et al., 1994; Bourassa et al., 1995). In the cat striate cortex, corticogeniculate neurons are restricted to layer VI (Gilbert and Kelly, 1975), and innervate the dLGN with thin (type I) axons and RS terminals that primarily make simple axodendritic synaptic contacts on the distal dendrites of thalamocortical cells (Vidnyánszky and Hámori, 1994; Paré and Smith, 1996; Eriºir et al., 1997). In contrast, striate cortico-LP cells are confined to layer V (Abramson and Chalupa, 1985) and innervate the LPl with thick (type II) axons and RL terminals that participate in complex glomerular synaptic arrangements in which they contact approximately equal numbers of thalamocortical cell and interneuron dendrites (Parê and Smith, 1996; Vidnyánszky et al., 1996; Feig and Harting, 1998; Baldauf et al., 2003; Kelly et al., 2003).
Because the synaptic arrangements of RL corticothalamic terminals resemble those of retinogeniculate terminals (Robson and Mason, 1979; Rapisardi and Miles, 1984; Wilson et al., 1984; Hamos et al., 1987; Li et al., 2003b), it has been suggested that their function may be similar. That is, type II corticothalamic terminals may provide a primary or driving input to higher-order nuclei (i.e., thalamic nuclei that receive layer V corticothalamic input; Guillery, 1995; Sherman and Guillery, 1998). In support of this idea, recent in vitro studies of the rat LP have revealed that the excitatory postsynaptic responses of LP thalamocortical cells to electrical stimulation of type I and type II corticothalamic terminals are very similar to the responses of geniculocortical cells to stimulation of corticogeniculate and retinogeniculate terminals, respectively (Li et al., 2003a).
Our results, in combination with previous studies, suggest that corticothalamic terminals fall into two basic categories in all higher-order nuclei and that the synaptic arrangements of these two types of terminals are fairly similar across nuclei. However, the overall proportions of RS and RL profiles that are present may vary between thalamic nuclei (Ralston and Herman, 1969; Hajdu et al., 1976; Madarász et al., 1981; Tömböl et al., 1983; van Horn et al., 2000; Wang et al., 2002). Correspondingly, the proportions of layer V and layer VI corticothalamic cells also vary with cortical area and thalamic target (Abramson and Chalupa, 1985). Our retrograde tracing experiments indicate that all cortical regions that innervate the PUL contain a blend of corticothalamic cells in both layer V and layer VI.
Our previous studies suggest that layer V and layer VI cortical inputs target different types of interneurons in the PUL. Class III interneurons are primarily contacted by RL profiles and, in turn, target appendages and large-caliber dendrites of thalamocortical cells. Class V inter-neurons are primarily contacted by RS profiles and, in turn, contact small-caliber dendrites of thalamocortical cells by means of widespread dendritic arbors (Bickford et al., 1999; Carden and Bickford, 2002). Our present results confirm that RS and RL profiles originating from area 7 both contact interneurons; presumably class V and class III interneurons, respectively (Fig. 17). Thus, they may participate in distinct circuitries within the PUL.
It is likely that individual thalamocortical cells integrate both RS and RL cortical terminals by means of contacts on their distal and proximal dendrites, respectively. Furthermore, it is likely that multiple RS cortical inputs converge on individual thalamocortical cells, as small-caliber dendrites in the PUL are often studded with multiple RS profiles (Wang et al., 2002). As observed at the light microscopic level, the boutons of an individual type I cortical axon are not closely spaced but are instead distributed over widespread areas. In contrast, type II cortical axons appear to innervate more restricted areas of the PUL, and we did not observe dendrites that were contacted by both labeled and unlabeled RL profiles. In summary, these qualitative observations support the idea that each layer V cortical axon targets a small number of thalamocortical cells and associated class III interneurons. These contacts could provide a driver-like input to selected neurons, whereas multiple layer VI axons could provide a more widespread modulation of pulvinar activity: directly, by means of their diffuse distribution and multiple converging contacts, and indirectly, by means of the dispersed dendritic arbors of class V interneurons.
Pulvinocortical projections
Our results show that the PUL projects to both cortical layers I and IV of multiple cortical areas: areas 5, 7 19, 20a, 21a, PCC, retrosplenial area (RSA), and SVA, which is in good agreement with earlier findings (Symonds et al., 1981). A laminar pattern of projections was observed previously for the projections of the LP but not of the PUL (Abramson and Chalupa, 1985). Whether the axons of pulvinar neurons branch to innervate both layers I and IV or whether separate cell populations innervate these layers is not known. However, Avendaño et al. (1990) found that the soma sizes of pulvinar cells labeled by retrograde transport from layer I were smaller than those labeled by tracer injections placed in deeper cortical layers. We also observed variety in the soma sizes and dendritic morphology of pulvinar cells labeled by retrograde transport from area 7 projections. Therefore, it is possible that several types of thalamoparietal neurons may populate the PUL, and their morphology could relate to distinct cortical projection patterns.
The laminar distribution of pulvinocortical projections is of interest in relation to the distribution of the apical dendrites of layer V and layer VI corticopulvinar neurons. The apical dendrites of layer V cells can reach layer I forming an extensive tuft (Valverde, 1971; Deschênes et al., 1994). In turn, thalamocortical projections to layer I have been shown to be very effective in activating layer V cells in the rat (Zhu and Zhu, 2004). However, layer IV inputs can also activate layer V cells by means of contacts on their apical dendrites and it has been proposed that layer V cells could act to detect the coincidence of thalamocortical activation arriving in layers IV and I (Zhu and Zhu, 2004). Alternatively, layer IV pulvinocortical inputs may primarily target the apical dendritic tufts of layer VI corticothalamic cells (Tömböl et al., 1975; Bourassa et al., 1995). Although the details of these connections remain uncertain, the distributions of pulvinocortical axons and the dendrites of corticopulvinar cells suggest several possible circuits that could link or synchronize cortical and pulvinar activities.
Possible function of the pulvinar nucleus
Lesions of the primate PUL produced abnormal saccadic eye movements. Although the monkeys could perform a visual discrimination task as easily as normal animals, their fixation times were longer and they were described as “visually captured” by the stimuli (Ungerleider and Christensen, 1977). Furthermore, injecting GABA agonists to the primate PUL caused a slower reaction time when monkeys were trained to switch their attention from the ipsilateral to the contralateral hemifield by moving their eyes. Conversely, injection of GABA antagonists into the PUL facilitated this switch in the focus of attention (Petersen et al., 1987). Given the close relationship between the control of visual attention and the control of eye movements (reviewed in Grieve et al., 2000), circuitry designed to integrate visual and eye movement signals are likely needed to mediate attention shifts. Converging inputs from the cortex and pretectum may interact with the extensive GABAergic and cholinergic circuitry within the PUL to permit shifts in fixation and attention.
Several recent theories have proposed that the PUL may promote or direct shifts in visual attention by routing information to and from the cortex (Michael et al., 2001). Such corticothalamocortical loops have been acknowledged as an alternative vista for communication between cortical areas (Guillery, 1995), and the thalamus has been suggested to serve as an “active blackboard” for cortical calculations (Mumford, 1991). In addition, recent physiological studies indicate that LP neurons can respond to the composite motion of two superimposed drifting gratings that differ in orientation. These properties were recorded previously only in the cortex. Thus, it has been proposed that the LP-PUL can participate in complex pattern motion analysis in concert with the visual cortices (Merabet et al., 1998). Several authors have suggested that such complex computations require the synchronous activity of multiple cortical areas and have further proposed a role for the LP-PUL in orchestrating this synchronization (Singer, 1994; Steriade, 1997; Shumikhina and Molotchnikoff, 1999). Our results regarding the corticopulvinocortical connections may provide an anatomical basis for such a role for the PUL.
Acknowledgments
We thank Martin J. Boyce; Cathie G. Caple; Jennifer Mahaney Cotton; Michael A. Eisenback, MS; and Olga Golanov, MD, for their help in histological processing; and Janice Ditslear and Nancy Hughes of the University of Louisville Research Resources Facility for excellent animal care and surgical assistance. The first author thanks to Lívia B. Baldauf, MD, for the helpful discussions and proofreading.
Grant sponsor: National Institute of Neurological Disorders and Stroke; Grant number: NS35377; Grant sponsor: National Science Foundation; Grant number: IBN0130954; Grant sponsor: Fight for Sight, Inc.; Grant number: PD03055 (to Z.B.B.).
Abbreviations
- ACC
anterior cingulate cortex
- AMLS
medial bank of the anterior lateral suprasylvian sulcus
- ALLS
lateral bank of the anterior lateral suprasylvian sulcus
- CC
crus cerebri
- CG
central gray
- CL
centrolateral nucleus
- CM
corpus mamillare
- dLGN
dorsal lateral geniculate nucleus
- DLS
dorsal lateral suprasylvian area
- H
habenula
- L
lateral sulcus
- LD
laterodorsal nucleus
- LGN
lateral geniculate nucleus
- LP
lateral posterior nucleus
- LPl
lateral subdivision of the lateral posterior nucleus
- LPm
medial subdivision of the lateral posterior nucleus
- LP-PUL
lateral posterior–pulvinar complex
- LS
lateral suprasylvian sulcus
- MD
mediodorsal nucleus
- MGN
medial geniculate nucleus
- MSg
middle suprasylvian gyrus
- NOT
nucleus of the optic tract
- NR
nucleus rubber
- OT
optic tract
- PCC
posterior cingulate cortex
- PMLS
medial bank of the posterior lateral suprasylvian sulcus
- PLLS
lateral bank of the posterior lateral suprasylvian sulcus
- PO
posterior thalamic nucleus
- PT
pretectum
- PUL
pulvinar nucleus (feline)
- RSA
retrosplenial area
- Sg
suprageniculate nucleus
- SS
suprasylvian sulcus
- SVA
splenial visual area
- VLS
ventral lateral suprasylvian area
- VPM
ventroposterior medial nucleus
LITERATURE CITED
- Abramson BP, Chalupa LM. The laminar distribution of cortical connections with the tecto- and cortico-recipient zones in the cat’s lateral posterior nucleus. Neuroscience. 1985;15:81–95. doi: 10.1016/0306-4522(85)90125-3. [DOI] [PubMed] [Google Scholar]
- Amassian VE. Studies on organization of a somesthetic association area including a single unit analysis. J Neurophysiol. 1954;17:39–58. doi: 10.1152/jn.1954.17.1.39. [DOI] [PubMed] [Google Scholar]
- Avendaño C, Rausell E, Reinoso-Suárez F. Thalamic projections to areas 5a and 5b of the parietal cortex in the cat: a retrograde horse-radish peroxidase study. J Neurosci. 1985;5:1446–1470. doi: 10.1523/JNEUROSCI.05-06-01446.1985. [DOI] [PMC free article] [PubMed] [Google Scholar]
- Avendaño C, Stepniewska I, Rausell E, Reinoso-Suárez F. Segregation and heterogeneity of thalamic cell populations projecting to superficial layers of posterior parietal cortex: a retrograde tracer study in cat and monkey. Neuroscience. 1990;39:547–559. doi: 10.1016/0306-4522(90)90242-v. [DOI] [PubMed] [Google Scholar]
- Baldauf ZB, Muly EC, Bickford ME. Comparison of posterior cingulate cortex projections to the pulvinar and laterodorsal nuclei. Soc Neurosci Abstr. 2003;68.1 [Google Scholar]
- Baldauf ZB, Wang S, Chomsung RD, May PJ, Bickford ME. Ultra-structural analysis of projections to the pulvinar nucleus of the cat. II: pretectum. J Comp Neurol. 2005;485:108–126. doi: 10.1002/cne.20487. [DOI] [PMC free article] [PubMed] [Google Scholar]
- Berman N. Connections of the pretectum in the cat. J Comp Neurol. 1977;174:227–254. doi: 10.1002/cne.901740204. [DOI] [PubMed] [Google Scholar]
- Berson DM, Graybiel AM. Parallel thalamic zones in the LP-pulvinar complex of the cat identified by their afferent and efferent connections. Brain Res. 1978;147:139–148. doi: 10.1016/0006-8993(78)90778-3. [DOI] [PubMed] [Google Scholar]
- Bickford ME, Carden WB, Patel NC. Two types of interneurons in the cat visual thalamus are distinguished by morphology, synaptic connections, and nitric oxide synthase content. J Comp Neurol. 1999;413:83–100. [PubMed] [Google Scholar]
- Bourassa J, Pinault D, Deschênes M. Corticothalamic projections from the cortical barrel field to the somatosensory thalamus in rats: a single-fibre study using biocytin as an anterograde tracer. Eur J Neurosci. 1995;7:19–30. doi: 10.1111/j.1460-9568.1995.tb01016.x. [DOI] [PubMed] [Google Scholar]
- Brodmann K. Vergleichende Lokalisationslehre der Grosshirnrinde in ihre Prinzipien dargestellt auf Grund des Zellenbaues. Leipzig: Barth; 1909. [Google Scholar]
- Carden WB, Bickford ME. Synaptic inputs of class III and class V interneurons in the cat pulvinar nucleus: differential integration of RS and RL inputs. Vis Neurosci. 2002;19:51–59. doi: 10.1017/s0952523801191054. [DOI] [PubMed] [Google Scholar]
- Casanova C. The visual functions of the pulvinar. In: Chalupa LM, Werner JS, editors. The visual neurosciences. Cambridge, London: MIT Press; 2003. pp. 592–608. [Google Scholar]
- Chen B, May PJ. Premotor circuits controlling eyelid movements in conjunction with vertical saccades in the cat: I. The rostral interstitial nucleus of the medial longitudinal fasciculus. J Comp Neurol. 2002;450:183–202. doi: 10.1002/cne.10313. [DOI] [PubMed] [Google Scholar]
- de V Clüver PF, Campos-Ortega JA. The cortical projection of the pulvinar in the cat. J Comp Neurol. 1969;137:295–308. doi: 10.1002/cne.901370304. [DOI] [PubMed] [Google Scholar]
- de Zeeuw CI, Holstege JC, Calkoen F, Ruigrok TJ, Voogd J. A new combination of WGA-HRP anterograde tracing and GABA immunocytochemistry applied to afferents of the cat inferior olive at the ultra-structural level. Brain Res. 1988;447:369–375. doi: 10.1016/0006-8993(88)91142-0. [DOI] [PubMed] [Google Scholar]
- Deschênes M, Bourassa J, Pinault D. Corticothalamic projections from layer V cells in rat are collaterals of long-range corticofugal axons. Brain Res. 1994;664:215–219. doi: 10.1016/0006-8993(94)91974-7. [DOI] [PubMed] [Google Scholar]
- Dow BM, Dubner R. Visual receptive fields and responses to movement in an association area of cat cerebral cortex. J Neurophysiol. 1969;32:773–784. doi: 10.1152/jn.1969.32.5.773. [DOI] [PubMed] [Google Scholar]
- Dow BM, Dubner R. Single-unit responses to moving visual stimuli in middle suprasylvian gyrus of the cat. J Neurophysiol. 1971;34:47–55. doi: 10.1152/jn.1971.34.1.47. [DOI] [PubMed] [Google Scholar]
- Eriºir A, van Horn SC, Bickford ME, Sherman SM. Immunocyto-chemistry and distribution of parabrachial terminals in the lateral geniculate nucleus of the cat: a comparison with corticogeniculate terminals. J Comp Neurol. 1997;377:535–549. [PubMed] [Google Scholar]
- Feig S, Harting JK. Corticocortical communication via the thalamus: ultrastructural studies of corticothalamic projections from area 17 to the lateral posterior nucleus of the cat and inferior pulvinar nucleus of the owl monkey. J Comp Neurol. 1998;395:281–295. doi: 10.1002/(sici)1096-9861(19980808)395:3<281::aid-cne2>3.0.co;2-z. [DOI] [PubMed] [Google Scholar]
- Fosse VM, Fonnum F. Biochemical evidence for glutamate and/or aspartate as neurotransmitters in fibers from the visual cortex to the lateral posterior thalamic nucleus (pulvinar) in rats. Brain Res. 1987;400:219–224. doi: 10.1016/0006-8993(87)90620-2. [DOI] [PubMed] [Google Scholar]
- Gilbert CD, Kelly JP. The projections of cells in different layers of the cat’s visual cortex. J Comp Neurol. 1975;163:81–105. doi: 10.1002/cne.901630106. [DOI] [PubMed] [Google Scholar]
- Godfraind JM, Meulders M, Veraart C. Visual properties of neurons in pulvinar, nucleus lateralis posterior and nucleus suprageniculatus thalami in the cat. I. Qualitative investigation. Brain Res. 1972;44:503–526. doi: 10.1016/0006-8993(72)90316-2. [DOI] [PubMed] [Google Scholar]
- Graybiel AM, Berson DM. Histochemical identification and afferent connections of subdivisions in the lateralis posterior-pulvinar complex and related thalamic nuclei in the cat. Neuroscience. 1980;5:1175–1238. doi: 10.1016/0306-4522(80)90196-7. [DOI] [PubMed] [Google Scholar]
- Grieve KL, Acuna C, Cudeiro J. The primate pulvinar nuclei: vision and action. Trends Neurosci. 2000;23:35–39. doi: 10.1016/s0166-2236(99)01482-4. [DOI] [PubMed] [Google Scholar]
- Guillery RW. A study of Golgi preparations from the dorsal lateral geniculate nucleus of the adult cat. J Comp Neurol. 1966;128:21–50. doi: 10.1002/cne.901280104. [DOI] [PubMed] [Google Scholar]
- Guillery RW. The organization of synaptic interconnections in the laminae of the dorsal lateral geniculate nucleus of the cat. Z Zellforsch Mikrosk Anat. 1969;96:1–38. doi: 10.1007/BF00321474. [DOI] [PubMed] [Google Scholar]
- Guillery RW. Anatomical evidence concerning the role of the thalamus in corticocortical communication: a brief review. J Anat. 1995;187:583–592. [PMC free article] [PubMed] [Google Scholar]
- Guillery RW, Feig SL, Van Lieshout DP. Connections of higher order visual relays in the thalamus: a study of corticothalamic pathways in cats. J Comp Neurol. 2001;438:66–85. doi: 10.1002/cne.1302. [DOI] [PubMed] [Google Scholar]
- Gurewitsch M, Chachaturian A. Zur Cytoarchitektonik der Groβhirnrinde der Feliden. Z Anat Entwicklg. 1928;87:100–138. [Google Scholar]
- Hajdu F, Babosa M, Somogyi Gy, Tömböl T. Experimental quantitative electron microscopical studies on the nucleus lateralis posterior-pulvinar complex of the thalamus in the cat. Z Mikrosk Anat Forsch. 1976;90:565–570. [PubMed] [Google Scholar]
- Hamos JE, van Horn SC, Raczkowski D, Sherman SM. Synaptic circuits involving an individual retinogeniculate axon in the cat. J Comp Neurol. 1987;259:165–192. doi: 10.1002/cne.902590202. [DOI] [PubMed] [Google Scholar]
- Hayat MA. Fixation for electron microscopy. San Diego: Academic Press; 1981. [Google Scholar]
- Heath CJ, Jones EG. The anatomical organization of the suprasylvian gyrus of the cat. Ergeb Anat Entwicklungsgesch. 1971;45:3–64. [PubMed] [Google Scholar]
- Hirata Y. Synaptic organization of the lateral pulvinar nucleus in the cats. Arch Histol Jpn. 1966;27:373–386. doi: 10.1679/aohc1950.27.373. [DOI] [PubMed] [Google Scholar]
- Kelly LR, Li J, Carden WB, Bickford ME. Ultrastructure and synaptic targets of tectothalamic terminals in the cat lateral posterior nucleus. J Comp Neurol. 2003;464:472–486. doi: 10.1002/cne.10800. [DOI] [PubMed] [Google Scholar]
- Li J, Guido W, Bickford ME. Two distinct types of corticothalamic EPSPs and their contribution to short-term synaptic plasticity. J Neurophysiol. 2003a;90:3429–3440. doi: 10.1152/jn.00456.2003. [DOI] [PubMed] [Google Scholar]
- Li J, Wang S, Bickford ME. Comparison of the ultrastructure of cortical and retinal terminals in the rat dorsal lateral geniculate and lateral posterior nuclei. J Comp Neurol. 2003b;460:394–409. doi: 10.1002/cne.10646. [DOI] [PubMed] [Google Scholar]
- Madarász M, Tömböl T, Hajdu F, Somogyi Gy. Some comparative quantitative data on the different (relay and associative) thalamic nuclei in the cat. A quantitative EM study. Anat Embryol (Berl) 1981;162:363–378. doi: 10.1007/BF00299979. [DOI] [PubMed] [Google Scholar]
- Majorossy K, Réthelyi M, Szentágothai J. The large glomerular synapse of the pulvinar. J Hirnforschung. 1965;7:415–432. [PubMed] [Google Scholar]
- Mason R. Differential responsiveness of cells in the visual zones of the cat’s LP-pulvinar complex to visual stimuli. Exp Brain Res. 1981;43:25–33. doi: 10.1007/BF00238806. [DOI] [PubMed] [Google Scholar]
- Merabet L, Desautels A, Minville K, Casanova C. Motion integration in a thalamic visual nucleus. Nature. 1998;396:265–268. doi: 10.1038/24382. [DOI] [PubMed] [Google Scholar]
- Michael GA, Boucart M, Degreef JF, Godefroy O. The thalamus interrupts top-down attentional control for permitting exploratory shiftings to sensory signals. Neuroreport. 2001;12:2041–2048. doi: 10.1097/00001756-200107030-00050. [DOI] [PubMed] [Google Scholar]
- Mumford D. On the computational architecture of the neocortex. I. The role of the thalamocortical loop. Biol Cybern. 1991;65:135–145. doi: 10.1007/BF00202389. [DOI] [PubMed] [Google Scholar]
- Niimi K, Matsuoka H, Yamazaki Y, Katayama T. Thalamic afferents to the anterior and middle suprasylvian gyri in the cat traced with horseradish peroxidase. J Hirnforsch. 1983;24:173–187. [PubMed] [Google Scholar]
- Ojima H, Murakami K, Kishi K. Dual termination modes of corticothalamic fibers originating from pyramids of layers 5 and 6 in cat visual cortical area 17. Neurosci Lett. 1996;208:57–60. doi: 10.1016/0304-3940(96)12538-6. [DOI] [PubMed] [Google Scholar]
- Olson CR, Lawler K. Cortical and subcortical afferent connections of a posterior division of feline area 7 (area 7p) J Comp Neurol. 1987;259:13–30. doi: 10.1002/cne.902590103. [DOI] [PubMed] [Google Scholar]
- Olucha F, Martinez-Garcia F, Lopez-Garcia C. A new stabilizing agent for the tetramethyl benzidine (TMB) reaction product in the histochemical detection of horseradish peroxidase (HRP) J Neurosci Methods. 1985;13:131–138. doi: 10.1016/0165-0270(85)90025-1. [DOI] [PubMed] [Google Scholar]
- Paré D, Smith Y. Thalamic collaterals of corticostriatal axons: their termination field and synaptic targets in cats. J Comp Neurol. 1996;372:551–567. doi: 10.1002/(SICI)1096-9861(19960902)372:4<551::AID-CNE5>3.0.CO;2-3. [DOI] [PubMed] [Google Scholar]
- Patel NC, Bickford ME. Synaptic targets of cholinergic terminals in the pulvinar nucleus of the cat. J Comp Neurol. 1997;387:266–278. [PubMed] [Google Scholar]
- Petersen SE, Robinson DL, Morris JD. Contributions of the pulvinar to visual spatial Contributions of the pulvinar to visual spatial attention. Neuropsychologia. 1987;25:97–105. doi: 10.1016/0028-3932(87)90046-7. [DOI] [PubMed] [Google Scholar]
- Raczkowski D, Rosenquist AC. Connections of the multiple visual cortical areas with the lateral posterior-pulvinar complex and adjacent thalamic nuclei in the cat. J Neurosci. 1983;3:1912–1942. doi: 10.1523/JNEUROSCI.03-10-01912.1983. [DOI] [PMC free article] [PubMed] [Google Scholar]
- Ralston HJ, III, Herman MM. The fine structure of neurons and synapses in ventrobasal thalamus of the cat. Brain Res. 1969;14:77–97. doi: 10.1016/0006-8993(69)90032-8. [DOI] [PubMed] [Google Scholar]
- Rapisardi SC, Miles TP. Synaptology of retinal terminals in the dorsal lateral geniculate nucleus of the cat. J Comp Neurol. 1984;223:515–534. doi: 10.1002/cne.902230405. [DOI] [PubMed] [Google Scholar]
- Robertson RT, Cunningham TJ. Organization of corticothalamic projections from parietal cortex in cat. J Comp Neurol. 1981;199:569–585. doi: 10.1002/cne.901990409. [DOI] [PubMed] [Google Scholar]
- Robertson RT, Mayers KS, Teyler TJ, Bettinger LA, Birch H, Davis JL, Phillips DS, Thompson RF. Unit activity in posterior association cortex of cat. J Neurophysiol. 1975;38:780–794. doi: 10.1152/jn.1975.38.4.780. [DOI] [PubMed] [Google Scholar]
- Robson JA, Mason CA. The synaptic organization of terminals traced from individual labeled retino-geniculate axons in the cat. Neuroscience. 1979;4:99–111. doi: 10.1016/0306-4522(79)90220-3. [DOI] [PubMed] [Google Scholar]
- Schmidt M, Sudkamp S, Wahle P. Characterization of pretectal-nuclear-complex afferents to the pulvinar in the cat. Exp Brain Res. 2001;138:509–519. doi: 10.1007/s002210100738. [DOI] [PubMed] [Google Scholar]
- Sherman SM, Guillery RW. On the actions that one nerve cell can have on another: distinguishing “drivers” from “modulators”. Proc Natl Acad Sci U S A. 1998;95:7121–7126. doi: 10.1073/pnas.95.12.7121. [DOI] [PMC free article] [PubMed] [Google Scholar]
- Shumikhina S, Molotchnikoff S. Pulvinar participates in synchronizing neural assemblies in the visual cortex, in cats. Neurosci Lett. 1999;272:135–139. doi: 10.1016/s0304-3940(99)00497-8. [DOI] [PubMed] [Google Scholar]
- Singer W. A new job for the thalamus. Nature. 1994;369:444–445. doi: 10.1038/369444a0. [DOI] [PubMed] [Google Scholar]
- Steriade M. Synchronized activities of coupled oscillators in the cerebral cortex and thalamus at different levels of vigilance. Cereb Cortex. 1997;7:583–604. doi: 10.1093/cercor/7.6.583. [DOI] [PubMed] [Google Scholar]
- Sudkamp S, Schmidt M. Response characteristics of neurons in the pulvinar of awake cats to saccades and to visual stimulation. Exp Brain Res. 2000;133:209–218. doi: 10.1007/s002210000374. [DOI] [PubMed] [Google Scholar]
- Symonds LL, Rosenquist AC, Edwards SB, Palmer LA. Projections of the pulvinar-lateralis posterior complex to visual cortical areas in the cat. Neuroscience. 1981;6:1995–2020. doi: 10.1016/0306-4522(81)90039-7. [DOI] [PubMed] [Google Scholar]
- Thompson RF, Johnson RH, Hoopes JJ. Organization of auditory, somatic sensory, and visual projection to association fields of cerebral cortex in the cat. J Neurophysiol. 1963;26:343–364. doi: 10.1152/jn.1963.26.3.343. [DOI] [PubMed] [Google Scholar]
- Tömböl T, Hajdu F, Somogyi Gy. Identification of the Golgi picture of the layer VI cortico-geniculate projection neurons. Exp Brain Res. 1975;24:107–110. doi: 10.1007/BF00236022. [DOI] [PubMed] [Google Scholar]
- Tömböl T, Madarász M, Martos J. Quantitative aspects in the analysis of the synaptic architecture of thalamic sensory relay nuclei. Acta Biol Hung. 1983;34:275–301. [PubMed] [Google Scholar]
- Ungerleider LG, Christensen CA. Pulvinar lesions in monkeys produce abnormal eye movements during visual discrimination training. Brain Res. 1977;136:189–196. doi: 10.1016/0006-8993(77)90146-9. [DOI] [PubMed] [Google Scholar]
- Valverde F. Short axon neuronal subsystems in the visual cortex of the monkey. Int J Neurosci. 1971;1:181–197. doi: 10.3109/00207457109146970. [DOI] [PubMed] [Google Scholar]
- van Horn SC, Eriºir A, Sherman SM. Relative distribution of synapses in the A-laminae of the lateral geniculate nucleus of the cat. J Comp Neurol. 2000;416:509–520. [PubMed] [Google Scholar]
- Vidnyánszky Z, Hámori J. Quantitative electron microscopic analysis of synaptic input from cortical areas 17 and 18 to the dorsal lateral geniculate nucleus in cats. J Comp Neurol. 1994;349:259–268. doi: 10.1002/cne.903490208. [DOI] [PubMed] [Google Scholar]
- Vidnyánszky Z, Borostyánköi ZB, Görcs TJ, Hámori J. Light and electron microscopic analysis of synaptic input from cortical area 17 to the lateral posterior nucleus in cats. Exp Brain Res. 1996;109:63–70. doi: 10.1007/BF00228627. [DOI] [PubMed] [Google Scholar]
- Waller WH, Barris RW. Relationships of thalamic nuclei to the cerebral cortex in the cat. J Comp Neurol. 1937;67:317–341. [Google Scholar]
- Wang S, Eisenback MA, Bickford ME. Relative distribution of synapses in the pulvinar nucleus of the cat: implications regarding the “driver/modulator” theory of thalamic function. J Comp Neurol. 2002;454:482–494. doi: 10.1002/cne.10453. [DOI] [PubMed] [Google Scholar]
- Wilson JR, Friedlander MJ, Sherman SM. Fine structural morphology of identified X- and Y-cells in the cat’s lateral geniculate nucleus. Proc R Soc Lond B Biol Sci. 1984;221:411–436. doi: 10.1098/rspb.1984.0042. [DOI] [PubMed] [Google Scholar]
- Yin TC, Greenwood M. Visual response properties of neurons in the middle and lateral suprasylvian cortices of the behaving cat. Exp Brain Res. 1992a;88:1–14. doi: 10.1007/BF02259124. [DOI] [PubMed] [Google Scholar]
- Yin TC, Greenwood M. Visuomotor interactions in responses of neurons in the middle and lateral suprasylvian cortices of the behaving cat. Exp Brain Res. 1992b;88:15–32. doi: 10.1007/BF02259125. [DOI] [PubMed] [Google Scholar]
- Zhu Y, Zhu JJ. Rapid arrival and integration of ascending sensory information in layer 1 nonpyramidal neurons and tuft dendrites of layer 5 pyramidal neurons of the neocortex. J Neurosci. 2004;24:1272–1279. doi: 10.1523/JNEUROSCI.4805-03.2004. [DOI] [PMC free article] [PubMed] [Google Scholar]