Abstract
Background and Aim
Alcoholic liver disease is associated with nutritional deficiency and it may aggravate within the context of fatty liver. We investigated the relationship between alcohol intake (whiskey binge drinking) and a choline-deficient diet (CD) and assessed whether stellate cells could contribute to liver injury in this model.
Results
Rats fed the CD diet plus whiskey showed increased liver damage compared to rats fed the CD diet, as demonstrated by H&E staining, elevated transaminases, steatosis, TNF-α levels, enhanced CYP2E1 activity, impaired antioxidant defense, elevated lipid peroxidation, and protein carbonyls. The combined treatment triggered an apoptotic response as determined by elevated Bax, caspase-3 activity, cytochrome-c release, and decreased Bcl-2 and Bcl-XL. Stellate cells were activated as increased expression of α-Sma was observed over that by the CD diet alone. The combined treatment shifted extracellular matrix remodeling towards a pro-fibrogenic response due to up-regulation of collagen I, TIMP1, and Hsp47 proteins, along with down-regulation of MMP13, MMP2, and MMP9 expression, proteases which degrade collagen I. These events were accompanied by increased phosphorylation of p38, a kinase that elevates collagen I.
Conclusion
Repeated alcohol binges in the context of mild steatosis may promote activation of stellate cells and contribute to liver injury.
Keywords: oxidative stress, choline-deficient diet, hepatic stellate cells, whiskey binges
INTRODUCTION
Non-alcoholic steatohepatitis triggers a fibrogenic response that may result in collagen I deposition. Many patients with steatohepatitis develop some degree of fibrosis within the first years of follow-up (1-3). The pathogenesis of non-alcoholic fatty liver disease remains unclear. It is suggested that an aberration in fatty acid and triglyceride metabolism leads to hepatic triglyceride accumulation (4, 5). Although the dynamics behind the progression of steatohepatitis is not well understood, it modifies the response of hepatic stellate cells (HSC) to injury enhancing the expression of type I collagen genes (6).
Fatty livers are particularly vulnerable when challenged by insults such as alcohol (7, 8) as seen in the intragastric infusion model of alcohol-induced liver injury in which liver damage occurs with diets containing polyunsaturated but not saturated fatty acids (9). Repeated alcohol binges disturb microcirculation in fatty grafts after liver transplantation, and oxidative stress is considered to play an important role, although the mechanism remains unclear (10). In mice, ethanol binge drinking induces hepatic oxidative stress, elevates levels of CYP2E1, and causes transient hepatic mitochondrial DNA depletion followed by increased mitochondrial DNA synthesis (11, 12).
Previous work from our laboratory showed that a single episode of 4 g/kg of body weight of ethanol every 12 h for 3 days sufficed to promote liver injury and apoptosis in Zucker rats by a mechanism involving oxidative and nitrosative damage (13). These observations suggest that individuals with fatty liver are predisposed to increased liver injury by chronic binge alcohol drinking, and that HSC may participate in such injury.
To test this hypothesis we investigated the fibrogenic effects of whiskey binge drinking on rats receiving a choline-deficient diet (CD) that produces mild steatosis. We then assessed the contribution of HSC to liver injury, oxidative stress, and fibrosis. We chose this model, based on repeated administration of whiskey, as it appears that less attention has been paid to binge alcohol administration, even though binge drinking is more common than chronic alcoholism, especially among young people. Rats were administered either repeated doses of saline solution or commercial whiskey by gavage for three months. Binge drinking was found to trigger steatosis, a fibrogenic response, and apoptosis in rats fed the CD diet by a mechanism which appeared to be associated with increased oxidant stress, elevated phosphorylation of p38, and down-regulation of matrix degrading enzymes.
MATERIAL AND METHODS
Animal Study Design
Four groups (n=8) of 12-wk old male Lewis rats (∼100 g) were purchased from Charles River Breeding Laboratories (Wilmington, MA). Rats received humane care and all protocols were in compliance with the guidelines of the National Institutes of Health and the Animal Care Committee of Albert Einstein College of Medicine. Rats were fed either a standard chow diet or a CD diet (MP Biomedicals Cat. No. 960034, Irvine, CA). A detailed analysis of the composition of this diet can be found in table 1. Half of the rats were gavaged for three months with 1.5 ml/100 g body wt of whiskey (Johnnie Walker® Red Label) three times per wk as described (11, 14), and the other half were gavaged with saline solution using a 12-gauge gavage needle. Whiskey was chosen, rather than pure alcohol, to simulate human drinking even knowing that a potential pitfall of our study was the presence of low percentage of impurities in commercial whiskey. Calorie intake was monitored to be equal in all four groups. Adjustments were made considering the calories given as alcohol in the whiskey-treated groups. The last whiskey binge was given 72 h before rats were sacrificed under pentobarbital anesthesia. Blood was collected from the abdominal aorta and serum was separated to assay for TNFα, leptin, and ALT/AST levels. Each liver was excised into several fragments to be used for biochemical assays and tissue stainings. Liver samples were fixed overnight in 10% buffered formalin and embedded in paraffin. H&E, TUNEL, and the Fast green/Sirius red staining and quantification of collagenous proteins were carried out as described previously (15).
Table 1.
Composition of the Choline-Deficient Diet Expressed in % of Weight.
| Ingredient | Percentage |
|---|---|
| Vitamin Free Casein | 10 |
| α-Protein | 10 |
| Sucrose | 56 |
| Lard | 20 |
| Wesson Salt Mixture: | 4 |
| Calcium Carbonate | 21 |
| Copper Sulfate·5H2O | 0.039 |
| Ferric Phosphate | 1.470 |
| Manganese Sulfate·H2O | 0.020 |
| Magnesium Sulfate·7H2O | 9 |
| Potassium Aluminum Sulfate | 0.009 |
| Potassium Chloride | 12 |
| Potassium Phosphate Monobasic | 31 |
| Potassium Iodide | 0.005 |
| Sodium Chloride | 10.5 |
| Sodium Fluoride | 0.057 |
| Tricalcium Phosphate | 14.9 |
The diet also contains the MP vitamin diet fortification Cat. No. 904654 (MP Biomedicals, Irvine, CA).
Antioxidant defense
Liver homogenates were prepared in 10 volumes of ice-cold pH 7.4, 50 mM/L Tris-HCl/sodium phosphate buffer and 1.15% KCl with 1 mM/L EDTA. For total GSH, 50 μg of liver were homogenized in 5% trichloroacetic acid at a ratio of 1:10 (w:v) and centrifuged for 5 min at 8000 rpm and 4°C. GSH levels were determined in the protein free extract by the recycling method of Tietze (16). Glutathione reductase (GR), glutathione transferase (GT), total glutathione peroxidase (GPX), catalase, and total superoxide dismutase (SOD) activities were measured according to the methods of Calberg and Mannervik (17), Habig et. al. (18), Flohé and Günzler (19), Claiborne (20), and Paoletti and Mocali (21), respectively.
General Procedures
Serum TNFα was determined by ELISA (Biosource, Camarillo, CA). Plasma leptin concentration was measured using a kit from Linco Research (St. Charles, MO). Levels of malondialdehyde were evaluated in liver homogenates using a lipid peroxidation colorimetric assay kit (Calbiochem, La Jolla, CA). To detect protein carbonyls, the method of Reznick and Packer was followed (22). Liver non-sterified fatty acids were analyzed using a kit from Wako Chemicals (Richmond, VA), and hepatic triglycerides were assayed using an enzymatic colorimetric kit from Roche Diagnostics (Basel, Switzerland). Rat liver microsomes and mitochondria were prepared by differential centrifugation, and the catalytic activity of CYP2E1 was determined as described by Reinke and Moyer (23).
RNA and quantitative real-time PCR analysis
Liver RNA was extracted using the RNeasy Mini kit (Qiagen, Chatsworth, CA). All RNA was treated with DNase (Qiagen). 1 μg of RNA was reverse-transcribed using first-strand cDNA synthesis with random primers (Promega, Madison, WI). Quantitative real-time PCR was done using the following PCR primers on an ABI PRISM 7900HT sequence detection system (Applied Biosystems, Foster City, CA): COL1A1 forward, 5′-CCT CAA GGT TTC CAA GGA CC-3′; and COL1A1 reverse, 5′-CAA TCC ATC CAG ACC GTT GTG-3′; Leptin forward, 5’-TAT CTG TCC TAT GTT CAA GC-3’, and Leptin reverse, 5’-GGG AAT GAA GTC CAA ACC GG-3’. All values were normalized to GAPDH.
Western Blot Analysis
Western Blot Analysis was carried out in liver homogenates (11). Anti-CYP2E1 antibody was a gift from Dr. Lasker (Hackensack Biomedical Research Institute, Hackensack, NJ). Anti-Collagen type I antibody (1/5,000) was provided by Dr. Schuppan (Harvard Medical School, Boston, MA). Anti-α-Sma and anti-β-tubulin were from Sigma. Antibodies for Hsp-47, Bcl-2, Bax, Bcl-XL, leptin, p38, phosphorylated p38, phosphorylated ERK1/2, and phosphorylated Akt were from Santa Cruz Biotechnologies (Santa Cruz, CA). All other antibodies (TIMP1, MMP2, MMP9, and MMP13) were from Chemicon International (Temecula, CA). All primary antibodies were used at a dilution of 1/2000. Goat anti rabbit IgG and goat anti-mouse IgG (Chemicon) (both at 1/5000) were used as secondary antibodies.
Caspase-3 and Caspase-8 Activity
Caspase-3-like and caspase-8 activity were determined by measuring proteolytic cleavage of the specific substrates N-acetyl-Asp-Glu-Val-Asp-7-amino-4-trifluoromethyl coumarin (Ac-DEVD-AFC) and benzyloxycarbonyl-Ile-Glu-Thr-Asp-7-amino-4-trifluoromethylcoumarin (bz-IETD-AFC), respectively (Biomol, Plymouth Meeting, PA) as described (24).
Cytochrome-c Release
Samples of livers were homogenized in pH 7.4, 500 mM pipes-KOH buffer, 5 mM EDTA, 2 mM MgCl2, 1mM dithiothreitol, 1 mM phenylmethyl sulfonyl fluoride, 10 mM cytochalasin B and a cocktail of protease inhibitors (Roche Applied Science). Samples were centrifuged at 14,000 x g for 15 min and the supernatant collected for the cytochrome-c immunoblot analysis on a 12 % SDS-PAGE using an antibody from Pharmingen (San Diego, CA).
Statistical analysis
Data were analyzed by a two-factor ANOVA with replication as suggested by the Department of Statistics at Mount Sinai School of Medicine. Values are expressed as means ± SEM (n=8).
RESULTS
To determine the relationship between alcohol intake and liver fibrogenesis on a background of fatty liver, rats were maintained either on a choline-deficient diet (CD) (25) or on a regular chow diet with or without intragastric infusion of commercial whiskey to mimic binge drinking episodes as observed in man.
The CD Diet Promotes Moderate Liver Injury
The average body weight was 355±22 g and 347±18 g for rats fed chow diet and CD diet, respectively; and the corresponding average liver size was 11±0.8 g and 10.1±0.9 g. H&E staining (Figure 1A) did not reveal significant hepatocyte damage in the CD diet-fed rats and this was further validated by ALT and AST activities (Figure 1B). However there was mild marginal steatosis in rats fed the CD diet (Figure 1A) and this was accompanied by increased levels of non-sterified fatty acids (2.7±0.1 vs. 1.7±0.2 mEq/mg of protein in control rats, p<0.01, Figure 2A) and triglycerides (59±1 vs. 20±1 μg/mg in controls p<0.01, Figure 2B). The CD diet causes microvesicular steatosis as opposed to the MCD diet which usually induces macrovesicular steatosis due, in part, to low hepatic GSH (26). The CD diet-fed rats also showed a minor fibrogenic response as quantitation of collagens by Sirius red/fast green (27) was increased (7.9±0.2 vs. 6.3±0.2 μg of collagenous proteins/mg protein, p<0.05, Figure 3A). Similarly, Western blot analysis revealed increase expression of type I collagen in the CD diet-fed rats (3.1±0.4 vs. 1±0.0, p<0.001; Figure 3B) which also correlated with changes in mRNA levels as determined by qRT-PCR (Figure 3A). This increased deposition of collagen I in the CD diet-fed rats was accompanied by a significant increase in TIMP1 expression (2.5±0.3 vs. 1±0.0, p<0.001), and a decrease in MMP13 (0.4±0.1 vs. 1±0.0, p<0.05), MMP2 (0.5±0.0 vs. 1±0.0, p<0.01) and proMMP9 (0.6±0.0 vs. 1±0.0, p<0.05) (Figure 3B). Leptin, a cytokine which up-regulates collagen I expression in HSC (28) and known to be increased in cirrhosis (29), was found elevated in the CD diet-fed rats (2.7±0.5 vs. 1±0.3, p<0.001, and 4.2±0.1 vs. 1±0.1, p<0.001 by Western and qRT-PCR analysis, respectively; Figure 2C-2D) and values for plasma leptin were 7.4±0.2 vs. 2.9±0.2, p<0.001, Figure 2E). Collagen deposition was accompanied by a significant increase in α-Sma expression, a bona fide marker for HSC activation (Figure 3B). Thus, although alterations in rats fed the CD diet were mild, yet there was some level of HSC activation, and the ratio between fibrogenic and fibrolytic activities was shifted towards the former with the subsequent increase in collagen I deposition.
Figure 1.
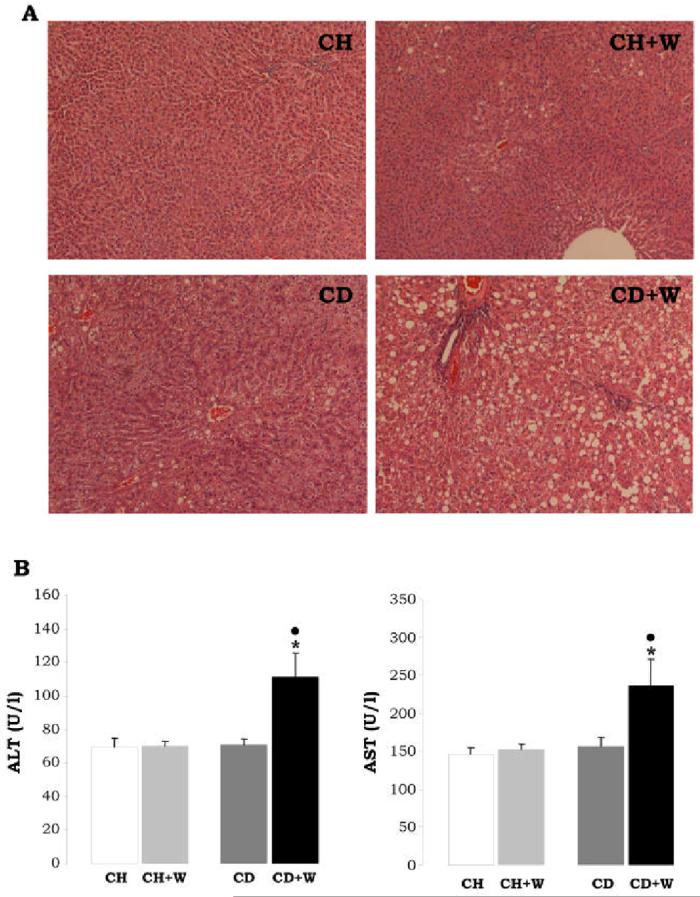
H&E staining (A). Rats fed the chow diet and given repeated alcohol binges showed minimal steatosis, while rats fed the CD diet and given repeated whiskey binges showed periportal and pericentral microvesicular steatosis (original magnification=200x). ALT and AST (B). The activity of ALT and AST are presented in U/l as means±S.E.M. (n=8). *p<0.05 for CD+W vs. CH+W, •p<0.05 for CD+W vs. CD. CH: chow diet, CD: choline-deficient diet, W: whiskey.
Figure 2.
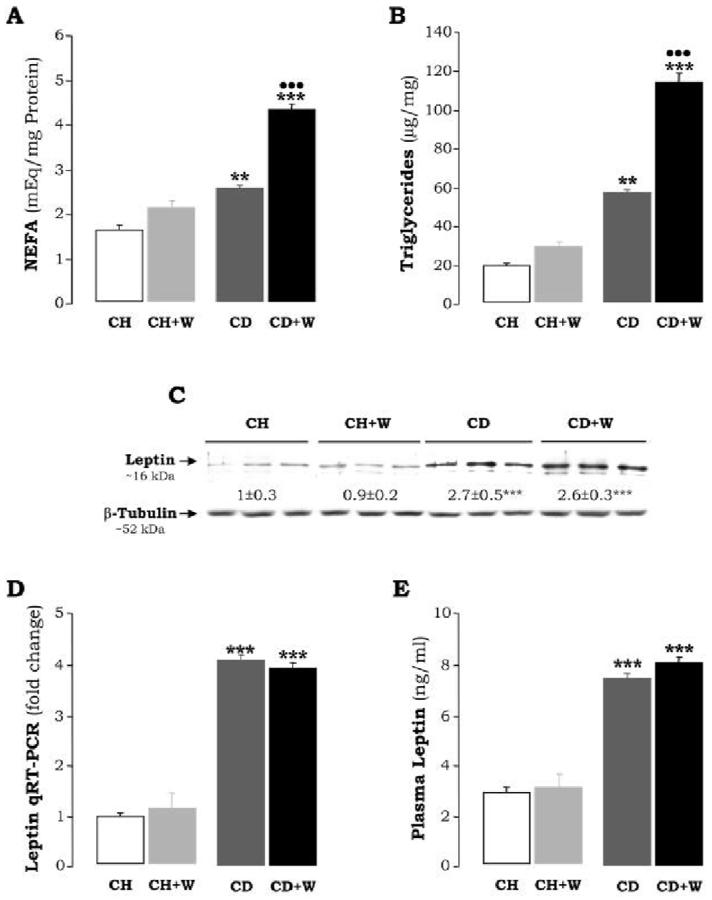
Hepatic Non-Sterified Fatty Acids (A) are expressed as mEq/mg protein and refer to means±S.E.M. (n=8). **p<0.01 for CD vs. CH, ***p<0.001 for CD+W vs. CH+W; •••p<0.001 for CD+W vs. CD. Hepatic Triglycerides (B) are expressed as μg/mg and refer to means±S.E.M. (n=8), **p<0.01 for CD vs. CH, ***p<0.001 for CD+W vs. CH+W; •••p<0.001 for CD+W vs. CD. Leptin Expression (C) was evaluated by Western blot analysis. Results are expressed as AU of densitometry under the blots and are average values of n=3 per group. Leptin expression in rats fed the CH diet was assigned a value of 1. ***p<0.001 for CD vs. CH or CD+W vs. CH+W. Hepatic Leptin Expression (D) was assessed by qRT-PCR. Results are expressed as fold-induction over the CH diet which was assigned a value of 1. ***p<0.001 for CD vs. CH or CD+W vs. CH+W. Plasma Leptin Levels (E) are expressed as ng/ml. ***p<0.001 for CD vs. CH or CD+W vs. CH+W. CH: chow diet, CD: choline-deficient diet, W: whiskey.
Figure 3.
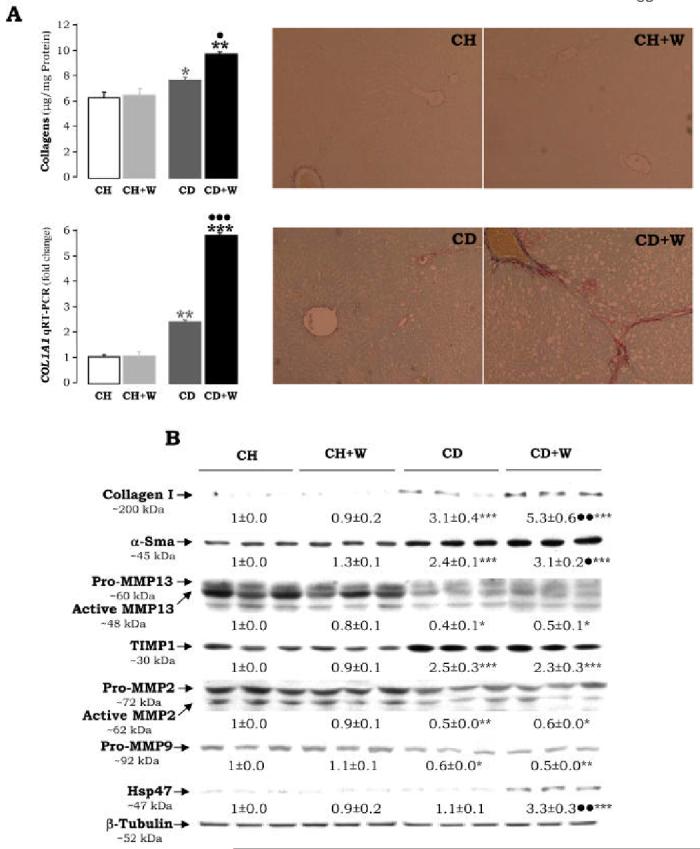
Extracellular Matrix Proteins. Liver tissue was stained (right panels) and quantified (upper left panel) for collagenous proteins using the Sirius red/fast green method (A). Results are given as average values±S.E.M. (n=8) and are expressed in μg of collagenous protein per mg of total protein; *p<0.05 for CD vs. CH and **p<0.01 for CD+W vs. CH+W, •p<0.05 for CD+W vs. CD. The expression of COL1A1 mRNA was assessed by qRT-PCR and is expressed as fold change over the CH group which was assigned a value of 1. **p<0.01 for CD vs. CH, ***p<0.001 for CD+W vs. CH+W, and •••p<0.001 for CD+W vs. CD. Western Blot Analysis (B) was carried out for collagen I, α-smooth muscle actin (α-Sma), MMP13, TIMP1, MMP2, MMP9, Hsp47, and β-tubulin. Results are expressed as means±S.E.M (n=3) and are given in AU of densitometry. The expression of the indicated protein in the CH group was assigned a value of 1. *p<0.05, **p<0.01, ***p<0.001 for CD vs. CH and for CD+W vs. CH+W; •p<0.05, ••p<0.01 for CD+W vs. CD. CH: chow diet, CD: choline-deficient diet, W: whiskey.
Serum TNFα levels, an acute phase cytokine involved in hepatocyte regeneration (30), was decreased to about 50% from that found in the controls (Figure 4). As shown in Figure 5A-5B, the CD diet did not induce CYP2E1 expression or activity. However, the possibility that other non analyzed P450s may be up-regulated could not be ruled out. Since oxidative stress plays a key role in alcohol-induced liver damage (31, 32), the antioxidant defense was analyzed. Overall, values for GSH, SOD, CAT, and GR were unchanged in rats fed the CD diet (Table 2). However, there was a significant reduction in GT (158.3±8.65 vs. 183.7±9.24 U/mg of protein; p<0.05) and GPX (15.8±1.57 vs. 34.1±1.65 U/mg of protein, p<0.001) (Table 2). Lipid peroxidation end-products and protein carbonyls remained similar (Figure 6).
Figure 4.
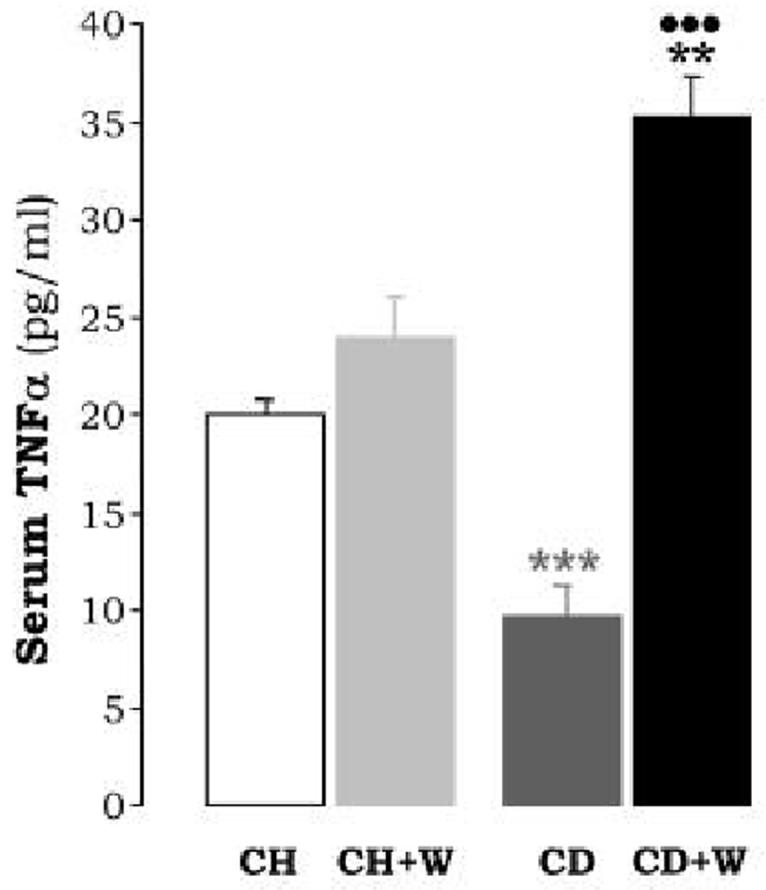
Serum TNFα Levels are average values of n=8 per group and are expressed as pg/ml. ***p<0.001 for CD vs. CH, **p<0.01 for CD+W vs. CH+W; •••p<0.001 for CD+W vs. CD. CH: chow diet, CD: choline-deficient diet, W: whiskey.
Figure 5.

CYP2E1 Activity and Expression. The catalytic activity of CYP2E1 was assessed by assaying the rate of oxidation of p-nitrophenol to p-nitrocatechol (A). Results are expressed as pmol/min/mg of microsomal protein and are average values±S.E.M. (n=8). **p<0.01 for CD+W vs. CH+W; ••p<0.01 for CD+W vs. CD. Western blot analysis showing the expression of CYP2E1 in liver microsomes (B). Results are expressed as AU of densitometry under the blots and are average values of n=3 per group. CYP2E1 expression in rats fed with the CH diet was assigned a value of 1. *p<0.05 for CD+W vs. CH+W; •p<0.01 for CD+W vs. CD. CH: chow diet, CD: choline-deficient diet, W: whiskey.
Table 2.
Antioxidant Defense in Liver
| Antioxidant | CH | CH+W | CD | CD+W |
|---|---|---|---|---|
| GSH | 3.13±0.29 | 2.91±0.11 | 3.22±0.06 | 2.87±0.48 |
| SOD | 26.4±21.19 | 23.8±1.84 | 24.9±1.76 | 22.7±1.64 |
| CAT | 1.3±0.09 | 1.3±0.05 | 1.3±0.11 | 0.9±0.02**• |
| GT | 183.7±9.24 | 170.7±12.99 | 158.3±8.65* | 143.7±6.69* |
| GR | 42.3±2.94 | 39.6±1.59 | 39.5±3.47 | 41.5±1.52 |
| GPX | 34.1±1.65 | 36.8±1.03 | 15.8±1.57*** | 15.7±0.27*** |
Rats were fed either a standard chow diet or a CD diet in the presence or absence of saline or chronic whiskey gavage for 12 weeks. Levels of GSH were measured and expressed as pmol/mg of protein. The activities of catalase, glutathione transferase (GT), glutathione reductase (GR), total glutathione peroxidase (GPX), and total superoxide dismutase (SOD) were measured and expressed as U/mg of protein. Results are means ± S. E. M (n=8). GT
p<0.05 for CD vs. CH and for CD+W vs. CH+W; CAT
p<0.01 for CD+W vs. CH+W
p<0.05 for CD+W vs. CD; GPX
p<0.001 for CD vs. CH and CD+W vs. CH+W.
CH: chow diet
W: whiskey.
Figure 6.
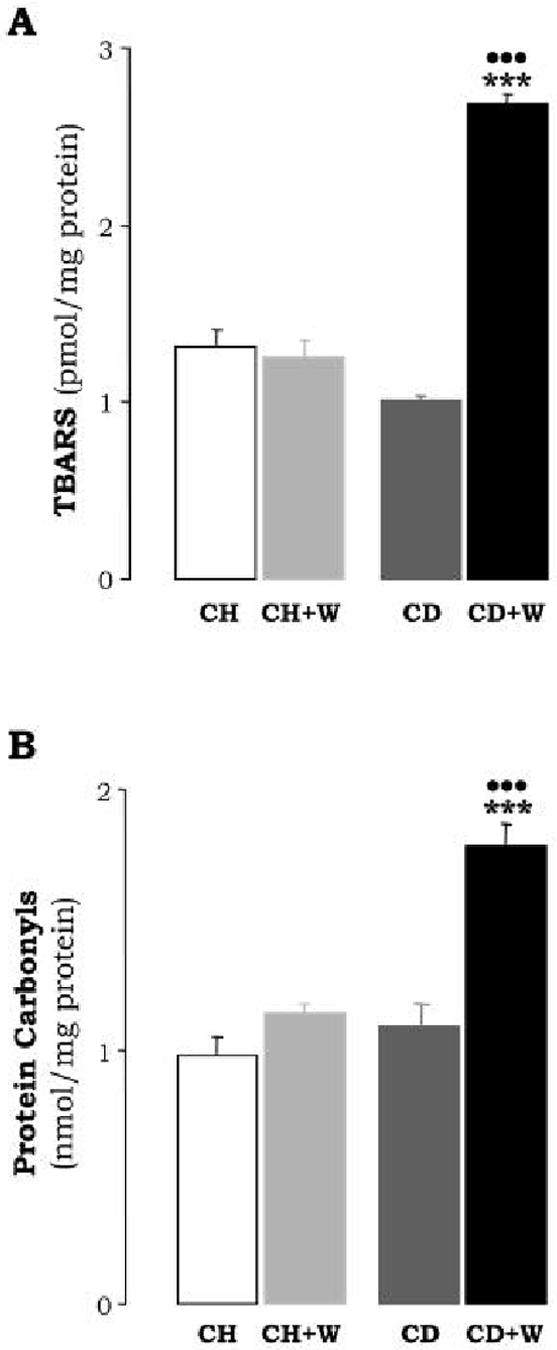
Lipid Peroxidation (A). Lipid peroxidation by-products in the liver were estimated from the malondialdehyde levels (TBARS). Results are expressed as pmol per mg of protein and are means±S.E.M. (n=8). ***p<0.001 for CD+W vs. the CH+W; •••p<0.001 for CD+W vs. CD. Protein Carbonyls (B) are expressed as nmol per mg of protein and are means±S.E.M. (n=8). ***p<0.001 for CD+W vs. CH+W; •••p<0.001 for CD+W vs. CD. CH: chow diet, CD: choline-deficient diet, W: whiskey.
Although no overt liver damage was detected by the CD diet, we analyzed the possibility of an apoptotic response. The expression of pro-apoptotic genes Bax, Bak, and Bad as well as those considered to prevent apoptosis such as Bcl-2 and Bcl-XL was evaluated. Western blot analysis showed that the expression of Bcl-2 and Bcl-XL was lowered (0.2±0 vs. 1±0.1, p<0.001; and 0.2±0 vs. 1±0.1, p<0.001, respectively) while that of Bax was elevated (1.9±0.1 vs. 1±0.0, p<0.001) (Figure 7A). Caspase-3 and 8-activity were increased as compared to rats fed the chow diet (2.2±0.1 vs. 0.4±0.1 AUF/mg protein, p<0.01 for caspase-3; and 3.6 ± 0.1 vs. 1.1 ± 0.1 AUF/mg protein, p<0.01 for caspase-8, Figure 7B-7C); and some apoptotic figures were observed by TUNEL staining (1.4±0.05 vs. 0.25±0.0, p<0.01, Figure 7D). Likewise, there was an increase in cytochrome-c release from the mitochondria into the cytosol (Figure 7A) indicating some degree of mitochondrial damage. Taken together these results suggest that the CD diet moderately increases the susceptibility to undergo apoptosis.
Figure 7.
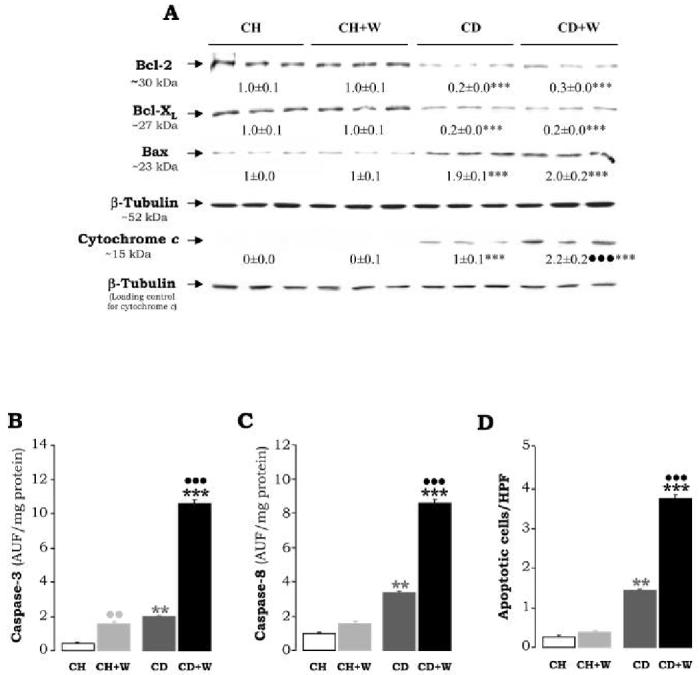
Western Blot Analysis for Bcl-2, Bax, Bcl-XL and Cytochrome c Release (A). 50 μg of liver protein were electrophoresed in either 10% or 12% SDS-PAGE and immunoblotted for Bcl-2, Bax, and Bcl-XL. Twenty-five μg of cytosolic fraction were electrophoresed in a 12% SDS-PAGE and immunoblotted for cytochrome-c. AU of densitometry corrected for β-tubulin expression are indicated under the blots and refer to means±S.E.M. (n=3). ***p<0.001 for CD vs. CH and for CD+W vs. CH+W; •••p<0.001 for CD+W vs. CD. Caspase-3 (B) and Caspase-8 Activity (C). In (B) and (C) the cleaved AFC product was determined by fluorimetry and results are expressed as AU of fluorescence/mg protein and are means±S.E.M. (n=8). **p<0.01 for CD vs. CH and ***p<0.001 for CD+W vs. CH+W; ••p<0.01 for CH+W vs. CH and •••p<0.001 for CD+W vs. CD. The Number of Apoptotic Cells (D) per high power field were determined by TUNEL staining, **p<0.01 for CD vs. CH, ***p<0.001 for CD+W vs. CH+W, and •••p<0.001 for CD+W vs. CD. CH: chow diet, CD: choline-deficient diet, W: whiskey.
Analysis of some signal transduction pathways in the CD diet-fed rats revealed activation of p38 MAPK as shown by Western blot analysis of phosphorylated p38 (2.6±0.3 vs. 1±0.0, p<0.01, Figure 8), while no differences were observed for other kinases such as ERK1/2, JNK (not shown), or Akt.
Figure 8.
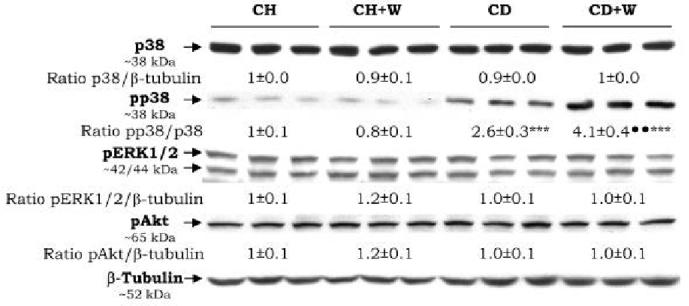
Protein Kinases. The expression of p38 and phosphorylated p38, ERK1/2, and Akt were analyzed by Western blot. Results are expressed as means±S.E.M (n=3) and are given as AU of densitometry. The expression of the indicated kinase in the CH group was assigned a value of 1. ***p<0.001 for CD vs. CH, ***p<0.001 for CD+W vs. CH+W; ••p<0.01 for CD+W vs. CD. CH: chow diet, CD: choline-deficient diet, W: whiskey.
Repeated Whiskey Binges Induce Liver Injury Enhancing Steatosis and Fibrosis in Rats Fed the CD Diet
Chronic whiskey binges caused a body and liver weight loss of ∼10% regardless of the diet; however, liver weight increased ∼5% in rats fed the chow diet and ∼25% in rats fed the CD diet. Plasma Alcohol concentration measured at the end-point of the experiment and after 72 h from the last dose of whiskey was similar in both groups of rats given whiskey (∼27 mmol/l). The CD diet plus repeated whiskey binges induced periportal and pericentral microvesicular steatosis and hepatotoxicity as assessed by H&E staining (Figure 1A) and elevation of transaminases (112±22 vs. 72±3 U/l, p<0.05 for ALT, and 235±25 vs. 160±4 U/l, p<0.05 for AST, Figure 1B), as well as by NEFA levels which increased above those found with the CD diet (4.4±0.1 vs. 2.6±0.06 mEq/mg protein, p<0.001, Figure 2A) and by triglycerides (116±7 vs. 59±1, p<0.001, Figure 2B).
Recurring whiskey binges in rats fed the CD diet triggered a fibrogenic response over that found in rats fed the CD diet alone. Sirius red/fast green staining revealed a further increase in periportal collagen (Figure 3A) and total liver collagen was further increased (10.1±0.2 vs. 7.9±0.2 μg of collagenous proteins/mg protein, p<0.01; Figure 3A). qRT-PCR analysis for COL1A1 mRNA (5.8±0.1 vs. 2.4±0.1, p<0.001, Figure 3A), and Western analysis for collagen I protein (5.3±0.6 vs. 3.1±0.4, p<0.01, Figure 3B), further support the pro-fibrogenic effect of whiskey binge drinking. No additional down-regulation of MMPs expression over that found in rats fed the CD diet was detected (Figure 3B). α-Sma was further elevated (3.1±0.2 vs. 2.4±0.1, p<0.05, Figure 3B) suggesting either greater proliferation of myofibroblasts and/or more activation of HSC. A significant increase in Hsp47, a chaperon protein involved in traversing the endoplasmic reticulum with procollagen into pre-Golgi intermediate vesicles for its secretion to the space of Disse, was detected (3.3±0.3 vs. 1.1±0.1, p<0.01, Figure 3B).
Leptin remained similar to that of rats fed the CD diet (Figure 2C-E) in the absence of whiskey binges. We have previously shown that in the acute phase response elevated TNFα levels contribute to the development of liver cirrhosis in CCl4-treated rats (11, 14). Serum TNF-α was found modestly elevated in rats fed the chow diet plus repeated whiskey binges (23.9±2.6 vs. 20±1.5 pg/ml, p<0.01) and were further increased in rats fed the CD diet plus frequent whiskey binges (36±3 vs. 10±2.5 pg/ml, p<0.001, Figure 4).
Binge Drinking Promoted Additional Oxidant Damage in Rats Fed the CD Diet
CAT and GT were significantly lower in rats fed the CD diet plus whiskey when compared to rats fed either the CD diet alone or the chow diet plus whiskey (Table 2). The combined treatment up-regulated CYP2E1 activity (1769±89 vs. 1185±177 pmol/min/mg protein, p<0.01) (Figure 5A). In order to evaluate whether whiskey binge drinking induced oxidative injury, lipid peroxidation-end products and protein carbonyls were determined. There was an increase in malondialdehyde, (2.7±0.06 vs. 1±0.01 pmol/mg protein, p<0.001, Figure 6A), and in protein carbonyls (1.75±0.15 vs. 1.1±0.15 nmol/mg protein, p<0.01, Figure 6B) in rats under the combined treatment.
Critical signaling cascades sensitive to oxidant stress were analyzed. An increase in the phosphorylation of p38 was observed when whiskey binges were given in combination with the CD diet, and when compared to rats fed the CD diet alone (4.1±0.4 vs. 2.6±0.3, p<0.01, Figure 8) while phosphorylation of other stress sensitive kinases e.g. ERK1/2, Akt, or JNK (the later not shown) was not induced.
Recurrent Whiskey Binges Further Induced Apoptosis
The CD diet by itself increased the apoptotic response in the liver which was further elevated by whiskey binge drinking. Caspase-3 and -8 activities showed an additional increase of 4- and 2.5-fold, respectively, when compared to values in rats fed the CD diet alone (Figure 7B-7C). TUNEL staining showed an increase in apoptotic figures by the CD diet combined with repeated whiskey binges (3.8±0.1 vs. 1.5±0.05, p<0.001, Figure 7D). Translocation of cytochrome-c from the mitochondria to the cytosol was elevated about 2.2-fold (Figure 7A). All other parameters, namely Bcl-2, Bcl-XL, and Bax remained similar to those observed in the CD-treated rats (Figure 7A). Repeated whiskey binges in rats fed chow diet did not modify the expression of pro-apoptotic and/or anti-apoptotic proteins (Figure 7A).
DISCUSSION
In the present study we used an episodic feeding regimen in an attempt to emulate “binges” that characterize the pattern of ethanol intake in many alcoholic subjects and particularly among young people. Individuals with fatty liver are predisposed to increased liver injury by chronic binge alcohol drinking. The CD diet promotes mild steatosis which could contribute to alcohol-induced hepatic damage and therefore this model could be a useful tool to understand the synergism between potential “hits” in alcohol-induced liver injury. Studies on alcoholic fatty liver have shown that the severity of fat correlates with the degree of HSC activation (33). Rats fed the CD diet developed some degree of steatosis with increased free fatty acids further elevated by repeated whiskey binges. Evidence in the literature supports a role for oxidative stress as an essential ‘second hit’ that leads to inflammation and fibrosis (21). Oxygen radicals modify proteins leading to their inactivation and rapid degradation (21). Among the various oxidative modifications of aminoacids, carbonyl formation may be an early marker for protein oxidation (34). Oxidative stress occurred especially in rats fed the CD diet plus repeated whiskey binges. The antioxidant defense mechanisms were altered by increased accumulation of products derived from oxidative damage such as malondialdehyde and protein carbonyls and a significant decrease in some critical hepatic antioxidants such as GSH, catalase, and GT. Multiple possible sources of oxidant stress may constitute a ‘second hit’ for liver injury in this model such as cytochrome P450, peroxisomal β-oxidation, and mitochondrial electron leak. Although other P450s were not evaluated, only rats fed the CD diet plus repeated whiskey binges showed elevated CYP2E1 activity. CYP2E1, apart from playing a critical role in ethanol metabolism and being stabilized by ethanol itself, is a major microsomal source of H2O2 and NADPH-dependent lipid peroxidation. CYP2E1 is also capable of reducing O2 to O2.- and H2O2 due to its uncoupled turnover (35, 36). Thus, it may contribute to oxidant stress in rats fed the CD diet plus whiskey. Indeed, increased levels of ALT and AST, the presence of steatosis, HSC activation, as determined by increased expression α-Sma, and excess collagen I deposition, reflect the oxidative stress and fibrogenesis induced by the CD diet and whisky binge drinking. In addition as previously shown (29, 37), elevated serum TNFα, a key cytokine induced during the acute phase response and liver regeneration (30), may contribute and/or enhance the fibrogenic process.
The imbalance between extracellular matrix production and the enzymes involved in tissue repair and their inhibitors could determine the extent of collagen deposition in injured liver (38). Collagen accumulation in this model was likely due to activation and/or proliferation of HSC, to increased expression of TIMP-1, an inhibitor of matrix metalloproteinases that may act as a survival factor for HSC (39, 40), and to decreased expression of MMP13 and MMP2, two metalloproteases that specifically degrade collagen I.
Oxidant stress may alter the phosphorylation/dephosphorylation status of signaling kinases that may participate in modulating the expression of hepatic extracellular matrix proteins (e.g. collagen I, MMPs, TIMP1) elicited by the CD diet plus repeated whiskey binges. A possible link between oxidative stress and collagen I accumulation are the stress activated kinases. The CD diet increased phosphorylation of p38, which was further elevated by repeated whiskey binges. Similar results have been obtained in vitro using non-treated primary HSC and in vivo models (27, 41, 42). Further experiments are needed to test the ability of siRNAs to specifically inhibit p38 expression and prevent collagen I accumulation in rats fed the CD diet given repeated whiskey binges.
Recent literature suggests that an increase in leptin levels, the metabolic hormone involved in controlling fat accumulation and energy expenditure, may enhance oxidative stress, lower the antioxidant defense, modify cytokines production leading to hepatic inflammation, and alter extracellular matrix remodeling in alcoholic liver disease (43). Leptin is a candidate hormone involved in the development of liver fibrosis but its source is still not clear. One hypothesis suggests that Kupffer cells or sinusoidal endothelial cells possess leptin receptors capable of signaling, and releasing in turn, cytokines to ameliorate the effect of leptin on activated HSC (44). Other hypothesis postulates that leptin acts directly on HSC affecting collagen expression signalling via Stat3 to activate a critical component of the AP-1 transcription factor (27). Given that activated HSC, the major regulator of hepatic fibrosis, express Ob-Rb, it is conceivable that leptin may be necessary to achieve an optimal fibrotic response. Leptin, has been shown to elevate H2O2, which signals through p38 and ERK1/2 pathways, stimulating TIMP1 production (27). Our data indicated an increase in leptin expression in rats fed the CD diet with no further elevation by whiskey, and as described by others (45), more phosphorylation of p38 and greater expression of TIMP1 were also present. In the current study, we did not demonstrate whether activated HSC were responsible for the increased leptin expression as it was analyzed in total liver and not in isolated HSC. Whether leptin, produced or not in HSC, primes the liver as a ‘second hit’ or for ‘a second hit’ such as alcohol to cause liver injury still remains to be determined.
Other cytokines are also candidates for the ‘second hit’ for reasons similar to those outlined for ROS and lipid peroxidation. In view of its inhibitory effect on the flow of electrons along the respiratory chain (46), any cause of increased hepatic TNFα in conditions of steatosis will lead to increased mitochondrial ROS production. High CYP2E1 activity coupled with lower antioxidant defense in CD rats given repeated whiskey binges may have promoted the increased TNFα levels (47). The elevated delivery of free fatty acids and TNFα to the liver is able of producing the ‘second hit’ required for the development of liver disease, mainly oxidative stress.
As part of this study, whether the CD diet plus whiskey binge drinking could promote the activation of the apoptosis cascade was also investigated. Indeed, the data suggest release of cytochrome-c from the mitochondria, activation of caspase 3, a key molecule in the chain of events leading to apoptosis (48), and the decreased expression of Bcl-2 and Bcl-XL with elevation of Bax, suggesting increased susceptibility to undergo apoptosis.
Taken together, the data suggest that in rats fed the CD diet, oxidative stress induced by chronic whiskey binges may contribute to exacerbation of liver injury.
ACKNOWLEDGEMENTS
This study was supported by USPHS Grants DK 069286 from the National Institute of Diabetes and Digestive and Kidney Diseases (to NN) and by AA 10541 from the National Institute on Alcohol Abuse and Alcoholism (to MR).
The authors are very grateful to Dr. Luis Fontana and Dr. Jose A. Dominguez-Rosales for their generous help in the initial stages of this work.
Footnotes
Publisher's Disclaimer: This is a PDF file of an unedited manuscript that has been accepted for publication. As a service to our customers we are providing this early version of the manuscript. The manuscript will undergo copyediting, typesetting, and review of the resulting proof before it is published in its final citable form. Please note that during the production process errors may be discovered which could affect the content, and all legal disclaimers that apply to the journal pertain.
REFERENCES
- 1.Powell E, Cooksley WG, Hanson R, Searle J, Halliday JW, Powell LW. The natural history of nonalcoholic steatohepatitis: a follow-up study of forty-two patients for up to 21 years. Hepatology. 1990;11:74–80. doi: 10.1002/hep.1840110114. [DOI] [PubMed] [Google Scholar]
- 2.Pares A, Caballeria J, Bruguera M, Torres M, Rodes J. Histological course of alcoholic hepatitis. Influence of abstinence, sex and extent of hepatic damage. J Hepatol. 1986;2:33–42. doi: 10.1016/s0168-8278(86)80006-x. [DOI] [PubMed] [Google Scholar]
- 3.Lombardi B, Ugazio G, Raick AN. Choline-deficiency fatty liver: relation of plasma phospholipids to liver triglycerides. Am J Physiol. 1966;210:31–36. doi: 10.1152/ajplegacy.1966.210.1.31. [DOI] [PubMed] [Google Scholar]
- 4.Brenner D, O’Hara M, Angel P, Chojkier M, Karin M. Prolonged activation of jun and collagenase genes by tumour necrosis factor-alpha. Nature. 1989;337:661–663. doi: 10.1038/337661a0. [DOI] [PubMed] [Google Scholar]
- 5.Houglum K, Brenner DA, Chojkier M. d-alpha-tocopherol inhibits collagen alpha 1(I) gene expression in cultured human fibroblasts. Modulation of constitutive collagen gene expression by lipid peroxidation. J Clin Invest. 1991;87:2230–2235. doi: 10.1172/JCI115258. [DOI] [PMC free article] [PubMed] [Google Scholar]
- 6.Lin H, Yang SQ, Zeldin G, Diehl AM. Chronic ethanol consumption induces the production of tumor necrosis factor-alpha and related cytokines in liver and adipose tissue. Alcohol Clin Exp Res. 1998;22:231S–237S. doi: 10.1097/00000374-199805001-00004. [DOI] [PubMed] [Google Scholar]
- 7.Tsukamoto H, Lu SC. Current concepts in the pathogenesis of alcoholic liver injury. FASEB J. 2001;15:1335–1349. doi: 10.1096/fj.00-0650rev. [DOI] [PubMed] [Google Scholar]
- 8.Nanji A, Zhao S, Sadrzadeh SM, Dannenberg AJ, Tahan SR, Waxman DJ. Markedly enhanced cytochrome P450 2E1 induction and lipid peroxidation is associated with severe liver injury in fish oil-ethanol-fed rats. Alcohol Clin Exp Res. 1994;18:1280–1285. doi: 10.1111/j.1530-0277.1994.tb00119.x. [DOI] [PubMed] [Google Scholar]
- 9.Zhong Z, Arteel GE, Connor HD, Schemmer P, Chou SC, Raleigh JA, Mason RP, Lemasters JJ, Thurman RG. Binge drinking disturbs hepatic microcirculation after transplantation: prevention with free radical scavengers. J Pharmacol Exp Ther. 1999;290:611–620. [PubMed] [Google Scholar]
- 10.Demeilliers C, Maisonneuve C, Grodet A, Mansouri A, Nguyen R, Tinel M, Letteron P, Degott C, Feldmann G, Pessayre D, Fromenty B. Impaired adaptive resynthesis and prolonged depletion of hepatic mitochondrial DNA after repeated alcohol binges in mice. Gastroenterology. 2002;123:1278–1290. doi: 10.1053/gast.2002.35952. [DOI] [PubMed] [Google Scholar]
- 11.Carmiel-Haggai M, Cederbaum AI, Nieto N. Binge ethanol exposure increases liver injury in obese rats. Gastroenterology. 2003;125:1818–1833. doi: 10.1053/j.gastro.2003.09.019. [DOI] [PubMed] [Google Scholar]
- 12.Aebersold R, Gygi SP, Griffin TJ, Han DKM, Yelle M. The isotope coded affinity tag reagent method for quantitative proteomics. American Genomic Proteomic Technology. 2001:22–27. [Google Scholar]
- 13.Ghoshal AKFE. Choline deficiency, lipotrope deficiency and the development of liver disease including liver cancer: a new perspective. Lab Invest. 1993;68:255–260. [PubMed] [Google Scholar]
- 14.Carmiel-Haggai MCA, Nieto N. A high fat diet leads to the progression of non-alcoholic fatty liver disease in obese rats. FASEB J. 2004 doi: 10.1096/fj.04-2291fje. [DOI] [PubMed] [Google Scholar]
- 15.Tietze F. Enzymic method for quantitative determination of nanogram amounts of total and oxidized glutathione: applications to mammalian blood and other tissues. Anal Biochem. 1969;27:502–522. doi: 10.1016/0003-2697(69)90064-5. [DOI] [PubMed] [Google Scholar]
- 16.Carlberg I, Mannervik B. Glutathione reductase. Methods Enzymol. 1985;113:484–490. doi: 10.1016/s0076-6879(85)13062-4. [DOI] [PubMed] [Google Scholar]
- 17.Habig WHPM, Jakoby WB. Glutathione S-transferases. The first enzymatic step in mercapturic acid formation. J Biol Chem. 1974;249:7130–7139. [PubMed] [Google Scholar]
- 18.Flohe L, Gunzler WA. Assays of glutathione peroxidase. Methods Enzymol. 1984;105:114–121. doi: 10.1016/s0076-6879(84)05015-1. [DOI] [PubMed] [Google Scholar]
- 19.Claiborne A, Fridovich I. Purification of the o-dianisidine peroxidase from Escherichia coli B. Physicochemical characterization and analysis of its dual catalatic and peroxidatic activities. J Biol Chem. 1979;254:4245–4252. [PubMed] [Google Scholar]
- 20.Paoletti F, Mocali A. Determination of superoxide dismutase activity by purely chemical system based on NAD(P)H oxidation. Methods Enzymol. 1990;186:209–220. doi: 10.1016/0076-6879(90)86110-h. [DOI] [PubMed] [Google Scholar]
- 21.Reznick AZ, Packer L. Oxidative damage to proteins: spectrophotometric method for carbonyl assay. Methods Enzymol. 1994;233:357–363. doi: 10.1016/s0076-6879(94)33041-7. [DOI] [PubMed] [Google Scholar]
- 22.Reinke LA, Moyer MJ. p-Nitrophenol hydroxylation. A microsomal oxidation which is highly inducible by ethanol. Drug Metab Dispos. 1985;13:548–552. [PubMed] [Google Scholar]
- 23.Nieto N, Friedman SL, Greenwel P, Cederbaum AI. CYP2E1-mediated oxidative stress induces collagen type I expression in rat hepatic stellate cells. Hepatology. 1999;30:987–996. doi: 10.1002/hep.510300433. [DOI] [PubMed] [Google Scholar]
- 24.Amore ACR, Roccatello D, Piccoli G, Mazzucco G, Gomez-Chiarri M, Lamm ME, Emancipator SN. Experimental IgA nephropathy secondary to hepatocellular injury induced by dietary deficiencies and heavy alcohol intake. Lab Invest. 1994;70:68–77. [PubMed] [Google Scholar]
- 25.Baskin-Bey ES, Canbay A, Bronk SF, Werneburg N, Guicciardi ME, Nyberg SL, Gores GJ. Cathepsin B inactivation attenuates hepatocyte apoptosis and liver damage in steatotic livers after cold ischemia-warm reperfusion injury. Am J Physiol Gastrointest Liver Physiol. 2005;288:G396–402. doi: 10.1152/ajpgi.00316.2004. [DOI] [PubMed] [Google Scholar]
- 26.Lopez-De Leon A, Rojkind M. A simple micromethod for collagen and total protein determination in formalin-fixed paraffin-embedded sections. J Histochem Cytochem. 1985;33:737–743. doi: 10.1177/33.8.2410480. [DOI] [PubMed] [Google Scholar]
- 27.Cao Q, Mak KM, Ren C, Lieber CS. Leptin stimulates tissue inhibitor of metalloproteinase-1 in human hepatic stellate cells: respective roles of the JAK/STAT and JAK-mediated H2O2-dependant MAPK pathways. J Biol Chem. 2004;279:4292–4304. doi: 10.1074/jbc.M308351200. [DOI] [PubMed] [Google Scholar]
- 28.Otte C, Otte JM, Strodthoff D, Bornstein SR, Folsch UR, Monig H, Kloehn S. Expression of leptin and leptin receptor during the development of liver fibrosis and cirrhosis. Exp Clin Endocrinol Diabetes. 2004;112:10–17. doi: 10.1055/s-2004-815720. [DOI] [PubMed] [Google Scholar]
- 29.Nieto N, Dominguez-Rosales JA, Fontana L, Salazar A, Armendariz-Borunda J, Greenwel P, Rojkind M. Rat hepatic stellate cells contribute to the acute-phase response with increased expression of alpha1(I) and alpha1(IV) collagens, tissue inhibitor of metalloproteinase-1, and matrix-metalloproteinase-2 messenger RNAs. Hepatology. 2001;33:597–607. doi: 10.1053/jhep.2001.22520. [DOI] [PubMed] [Google Scholar]
- 30.Lee FY, Li Y, Zhu H, Yang S, Lin HZ, Trush M, Diehl AM. Tumor necrosis factor increases mitochondrial oxidant production and induces expression of uncoupling protein-2 in the regenerating mice [correction of rat] liver. Hepatology. 1999;29:677–687. doi: 10.1002/hep.510290320. [DOI] [PubMed] [Google Scholar]
- 31.Greenwel P, Dominguez-Rosales JA, Mavi G, Rivas-Estilla AM, Rojkind M. Hydrogen peroxide: a link between acetaldehyde-elicited alpha1(I) collagen gene up-regulation and oxidative stress in mouse hepatic stellate cells. Hepatology. 2000;31:109–116. doi: 10.1002/hep.510310118. [DOI] [PubMed] [Google Scholar]
- 32.Nieto N, Friedman SL, Cederbaum AI. Cytochrome P450 2E1-derived reactive oxygen species mediate paracrine stimulation of collagen I protein synthesis by hepatic stellate cells. J Biol Chem. 2002;277:9853–9864. doi: 10.1074/jbc.M110506200. [DOI] [PubMed] [Google Scholar]
- 33.Day C, James OF. Hepatic steatosis: innocent bystander or guilty party? Hepatology. 1998;27:1463–1466. doi: 10.1002/hep.510270601. [DOI] [PubMed] [Google Scholar]
- 34.Dierks E, Davis SC, Ortiz de Montellano PR. Glu-320 and Asp-323 are determinants of the CYP4A1 hydroxylation regiospecificity and resistance to inactivation by 1-aminobenzotriazole. Biochemistry. 1998;37:1839–1847. doi: 10.1021/bi972458s. [DOI] [PubMed] [Google Scholar]
- 35.Varela-Rey MM-DC, Oses-Prieto JA, Lopez-Zabalza MJ, Jaffrezou JP, Rojkind M, Iraburu MJ. p38 MAPK mediates the regulation of alpha1(I) procollagen mRNA levels by TNF-alpha and TGF-beta in a cell line of rat hepatic stellate cells(1) FEBS Lett. 2002;528:133–138. doi: 10.1016/s0014-5793(02)03276-3. [DOI] [PubMed] [Google Scholar]
- 36.Schnabl B, Bradham CA, Bennett BL, Manning AM, Stefanovic B, Brenner DA. TAK1/JNK and p38 have opposite effects on rat hepatic stellate cells. Hepatology. 2001;34:953–963. doi: 10.1053/jhep.2001.28790. [DOI] [PubMed] [Google Scholar]
- 37.Greenwel P, Rojkind M. Accelerated development of liver fibrosis in CCl4-treated rats by the weekly induction of acute phase response episodes: upregulation of alpha1(I) procollagen and tissue inhibitor of metalloproteinase-1 mRNAs. Biochim Biophys Acta. 1997;1361:177–184. doi: 10.1016/s0925-4439(97)00028-8. [DOI] [PubMed] [Google Scholar]
- 38.Rojkind M. From regeneration to scar formation: the collagen way. Lab Invest. 1991;64:131–134. [PubMed] [Google Scholar]
- 39.Iredale JP. Tissue inhibitors of metalloproteinases in liver fibrosis. Int J Biochem Cell Biol. 1997;29:43–54. doi: 10.1016/s1357-2725(96)00118-5. [DOI] [PubMed] [Google Scholar]
- 40.Iredale JP, Benyon RC, Arthur MJ, Ferris WF, Alcolado R, Winwood PJ, Clark N, et al. Tissue inhibitor of metalloproteinase-1 messenger RNA expression is enhanced relative to interstitial collagenase messenger RNA in experimental liver injury and fibrosis. Hepatology. 1996;24:176–184. doi: 10.1002/hep.510240129. [DOI] [PubMed] [Google Scholar]
- 41.Comlekci AAH, Yesil S, Okan I, Ellidokuz E, Okan A, Ersoz G, Tankurt E, Batur Y. Serum leptin levels in patients with liver cirrhosis and chronic viral hepatitis. Scand J Gastroenterol. 2003;38:779–786. doi: 10.1080/00365520310003877. [DOI] [PubMed] [Google Scholar]
- 42.Balasubramaniyan VKSJ, Nalini N. Role of leptin on alcohol-induced oxidative stress in Swiss mice. Pharmacol Res. 2003;47:211–216. doi: 10.1016/s1043-6618(02)00317-1. [DOI] [PubMed] [Google Scholar]
- 43.Ikejima K, Takei Y, Honda H, Hirose M, Yoshikawa M, Zhang YJ, Lang T, Fukuda T, Yamashina S, Kitamura T, Sato N. Leptin receptor-mediated signaling regulates hepatic fibrogenesis and remodeling of extracellular matrix in the rat. Gastroenterology. 2002;122:1399–1410. doi: 10.1053/gast.2002.32995. [DOI] [PubMed] [Google Scholar]
- 44.Saxena N, Saliba G, Floyd JJ, Anania FA. Leptin induces increased alpha2(I) collagen gene expression in cultured rat hepatic stellate cells. J Cell Biochem. 2003;89:311–320. doi: 10.1002/jcb.10494. [DOI] [PMC free article] [PubMed] [Google Scholar]
- 45.Lancaster JJ, Laster SM, Gooding LR. Inhibition of target cell mitochondrial electron transfer by tumor necrosis factor. FEBS Lett. 1989;248:169–174. doi: 10.1016/0014-5793(89)80454-5. [DOI] [PubMed] [Google Scholar]
- 46.Diehl A. Cytokine regulation of liver injury and repair. Immunol Rev. 2000;174:160–171. doi: 10.1034/j.1600-0528.2002.017411.x. [DOI] [PubMed] [Google Scholar]
- 47.Deaciuc II, D’Souza NB, Fortunato F, Hill DB, Sarphie TG, McClain CJ. Alcohol-induced sinusoidal endothelial cell dysfunction in the mouse is associated with exacerbated liver apoptosis and can be reversed by caspase inhibition. Hepatol Res. 2001;19:85–97. doi: 10.1016/s1386-6346(00)00087-5. [DOI] [PubMed] [Google Scholar]
- 48.Cohen G. Caspases: the executioners of apoptosis. Biochem J. 1997;326:1–16. doi: 10.1042/bj3260001. [DOI] [PMC free article] [PubMed] [Google Scholar]


