

Abstract
We studied patients with Familial Adenomatous Polyposis (FAP), because they are virtually certain to develop colon cancer, and because much is known about the causative APC gene. We hypothesized that the inherited heterozygous mutation itself leads to changes in the proteome of morphologically normal crypts and the proteins that changed may represent targets for preventive and therapeutic agents. We determined the differential protein expression of morphologically normal colon crypts of FAP patients versus those of individuals without the mutation, using two-dimensional gel electrophoresis, mass spectrometry and validation by 2D gel Western blotting. Approximately 13% of 1,695 identified proteins were abnormally expressed in the morphologically normal crypts of APC mutation carriers, indicating that a colon crypt cell under the one-hit state is already abnormal. Many of the expression changes affect pathways consistent with the function of the APC protein, including apoptosis, cell adhesion, cell motility, cytoskeletal organization and biogenesis, mitosis, transcription and oxidative stress response. Thus, heterozygosity for a mutant APC tumor suppressor gene alters the proteome of normal-appearing crypt cells in a gene-specific manner, consistent with a detectable one-hit event. These changes may represent the earliest biomarkers of colorectal cancer development, potentially leading to the identification of molecular targets for cancer prevention.
Keywords: Familial Adenomatous Polyposis, APC, Tumor suppressor, colon crypts, proteomics
Introduction
Colorectal cancer represents the second leading cause of cancer-related death in the United States (1). Its development is due to the accumulation of mutations of a number of tumor suppressor genes and oncogenes, as well as DNA repair genes controlling genomic stability (2). Patients with Familial Adenomatous Polyposis (FAP), a hereditary disease characterized by the presence of multiple polyps in the colon, carry germline mutations in one allele of the adenomatous polyposis coli (APC) tumor suppressor gene. Colon cancer in FAP patients requires at least one additional somatic genetic event at the other APC allele in such individuals, consistent with the “two-hit” hypothesis for cancer arising from defective tumor suppressor genes that are recessive at the cellular level (3). The APC gene is also mutated in most cases of sporadic colorectal cancer.
Alterations in the gene expression pattern associated with single-hit mutations of the APC tumor suppressor gene are likely to represent the earliest molecular changes during colon carcinogenesis. The idea that there might be “one-hit” effects of APC mutation in heterozygous cells was supported years ago by Kopelovich et al. (4, 5) who observed profound genetic alterations in morphologically normal skin fibroblasts that were derived from FAP patients, including increased sensitivity to transformation by the KiMSV and SV40 viruses, altered cytoskeletal actin distribution and increased expression of p53. Danes et al. reported increased tetraploidy in morphologically normal colonic epithelial cells derived from FAP patients of the Gardner syndrome variant (6). Both of these reports indicated “one-hit” effects. These observations have recently been extended using RNA expression profiles in morphologically normal renal epithelial cells that were derived from patients affected with tuberous sclerosis complex and von Hippel-Lindau syndrome (7). Some or all of these early changes may have a direct bearing on subsequent tumor induction, since similar expression profiles have been identified in the corresponding cancer cells (4-7). Thus, even a small growth advantage could increase the number of one-hit cells available for conversion to two-hit tumor cells that represent the paradigm for adenoma formation providing some selective advantage during colorectal cancer development.
Proteomics provides a direct approach to study thousands of proteins in a given tissue at the same time, facilitating the determination of critical pathways during cancer development. We have chosen to study the colonic crypt proteome by two-dimensional (2D) gel electrophoresis, since this approach also provides global quantitative protein isoform information (8). We demonstrated that, compared with the proteome profile of morphologically normal crypts sampled at about 10 to 20 cm from the tumor of sporadic colorectal cancer patients (9), the morphologically normal FAP colonic crypts exhibit an altered proteome in a gene-specific manner, consistent with detectable single-hit effect associated with heterozygosity for a mutant APC tumor suppressor gene. These protein aberrations appear to be directly related to cancer and may represent some of the earliest known biomarkers during colorectal cancer development, potentially leading to the identification of molecular targets and agents that might inhibit or delay adenoma-carcinoma transition.
Materials and Methods
Sample acquisition
Subjects were recruited for this research following approval by the respective Institutional Review Boards of Fox Chase Cancer Center (protocol number: 00−852) and Thomas Jefferson University (protocol number: 00−0023). Morphologically normal mucosa was obtained from eligible men and women who were previously diagnosed with FAP and whose corresponding APC gene mutations had been documented by DNA sequencing of circulating white cells (Table 1), including four male and three female FAP patients with a mean age of 30 years (range 17 to 48 years). No correlation was observed between the location of the APC mutation and severity of the FAP phenotype. In view of the logistical difficulty in obtaining colon specimens from unaffected normal controls, morphologically normal mucosa was obtained from patients undergoing surgery for colorectal cancer who, however, had no family or personal history of colon cancer, or any other cancer and were therefore classified as patients with sporadic colorectal cancer. The mucosal samples were obtained 10 to 20 cm away from the primary lesion in the descending colon and referred to, in this report, as control crypts (9). The morphologically normal colonic mucosa from sporadic colorectal cancer patients was used as a surrogate for the normal colonic mucosa of cancer-free individuals. The control patients included five male and two female patients aged 41−58, with a mean age of 51.1 years (Table 1). Since a FAP patient often undergoes colectomy at an early age, it was not entirely possible to age-match the FAP cases with sporadic cancer patients (see below).
Table 1.
Patient samples used in the comparison of the colon crypt proteomes of FAP patients and controls (distal mucosa from sporadic cancer cases).
| Patient code | Pathology diagnosis | Gender | Age | APC Mutation |
|---|---|---|---|---|
| CP129 | Sporadic, rectal cancer | M | 47 | Not determined |
| CP203 | Sporadic, rectal cancer | M | 49 | Not determined |
| CP70 | Sporadic, rectal cancer | M | 54 | Not determined |
| CP144 | Sporadic, rectal cancer | M | 58 | Not determined |
| CP206 | Sporadic, rectal cancer | F | 41 | Not determined |
| CP73 | Sporadic, sigmoid cancer | F | 56 | Not determined |
| SID514 | FAP, no cancer | F | 17 | codon 1148 APC3443delCT |
| SID516 | FAP, no cancer | F | 39 | codon 178 (Genetically attenuated) |
| SID601 | FAP | M | 48 | IVS4+1>A |
| SID602 | FAP | M | 42 | APC3714delT |
| SID608 | FAP | M | 24 | APC3927del5 |
| SID618 | FAP, no cancer | F | 35 | codon 1148 APC3443delCT |
| SID622 | FAP, no cancer | M | 26 | APC3183del5 |
2D gel electrophoresis
We adhered strictly to our established Standard Operating Procedures (SOP) for 2D gel electrophoresis and their analyses (9, 10). Patient samples were randomized during the gel runs to avoid systematic artifacts. The FAP and control samples were analyzed concurrently. Our procedure for colonic crypts preparation from morphologically normal colon was previously described in detail (9, 10). The first-dimension isoelectric focusing (IEF) was performed using in-gel rehydration method for linear pH 4−7 and pH 5−8 IPG strips (ReadyStrip; 0.5 × 3 × 170 mm, Bio-Rad, Hercules, CA), while cup-loading method was used for linear pH 6−11 IPG strips (Immobiline DryStrip; 0.5 × 3 × 180 mm, Amersham Pharmacia Biotech, Uppsala, Sweden). For both IEF methods, 100 μg of protein sample diluted in 2D sample buffer (7 M urea, 2 M thiourea, 4% (w/v) CHAPS, 1.6% (w/v) DTT, 2% (v/v) biolytes, and 1.2% (v/v) DeStreak reagent) was included for each IPG strip. After IEF, protein reduction was performed by equilibration of IPG strip in 0.4% (w/v) DTT for 15 minutes followed by protein alkylation in 4% (w/v) iodoacetamide for 15 minutes. The second dimension was performed using 12% polyacrylamide gel (acrylamide/bisacrylamide 37.5:1, 2.6% cross-linker; gel dimension, 20 cm × 20 cm × 1 mm). 2D gels were fixed for 1 hour (25% ethyl alcohol, 7% acetic acid) and stained overnight with the Sypro Ruby protein gel stain (Bio-Rad, Hercules, CA).
Data analysis
2D gel Images (16 bits) were recorded by ProXPRESS Proteomic Imaging System and analyzed using the Progenesis Discovery Workstation Software v2004 (Nonlinear Dynamics Inc., UK). For each colonic crypt sample, we obtained at least three 2D gels per pH range, of which two gels were used for further image analysis. Total of 12 images in control group and 12 images in FAP group were used for each pH range image analysis. Five FAP patients each provided enough samples for all three pH ranges. However, the sixth patient for each pH range came from one of two additional FAP patients, giving a total of seven FAP patients in this report.
The Progenesis output files for spot intensities of gel replicates were averaged for corresponding protein spots so that each patient was represented by one file. We rejected any spot that was missing in more than four of the 24 gels in each pH range unless all but two of the spots absent were found in the same class of patients. The data were transformed into log base 2 space, median-centered and normalized for each patient, and then median-centered and normalized for each protein. The results were subjected to analysis by Hierarchical Clustering (Cluster 3.0 (11) visualized with Java TreeView software) and Genesis 1.6.0 software (Institute for Genomics and Bioinformatics, Graz University of Technology (12)). The results are provided at our web site 1 as Genesis project files accessible through the Genesis software that can be downloaded 2. Principal Component Analysis (PCA) (13, 14) was performed using Genesis 1.6.0 software.
Protein identification
Robotic cutting of protein spots, trypsin digestion, automated MALDI-TOF mass spectrometry, and protein identification from Swiss-Prot database were previously described in detail (9, 10). The identity and function of the genes separating FAP from control were explored at the gene ontology databases FatiGO+ (15) and Database for Annotation, Visualization and Integrated Discovery (DAVID) 3.
Western blots
100 μg of protein of each sample was resolved on a 1D or a 2D gel. Blotting was performed at 200mA for 2 hours in 5% Non-fat Dry milk/TBS. Primary antibodies shown were Anti-ECHS1 (#11305−1-AP rabbit polyclonal antibody, 1:1000 dilution, Proteintech Group, Inc.) and anti-SOD2 (#ab13533 rabbit polyclonal antibody, 1:5000 dilution, Abcam Inc., CA). Secondary antibody was Goat Anti rabbit IgG (#62−6120 Zymed Inc.), 1:2000 dilution. Imaging was obtained on Kodak BioMax film which was developed with Bio-Rad ECL reagent. The films were scanned by the ProXPRESS scanner and quantified by Progenesis image analysis software.
Results
Clinical specimens
The crypts prepared in this study (Figure 1A) were epithelial cell-type specific that avoided the high contamination of blood and stromal cells found in ordinary colon mucosa preparations (16). The heterozygous nature of the APC mutations in FAP colonic crypt cells were confirmed directly by resequencing the mutation sites of the genomic DNA from crypt cells of four FAP individuals studied in this report (Supplemental Data 1-3, Supplemental Data 4,Table 1). The purity of the crypts enabled a meaningful proteomic analysis, particularly of the lower abundance proteins, a subset that may include many potential biomarkers. Both control and FAP samples were initially used to construct a protein and isoform database for the colon crypts (9) (Figure 1B). About 1,695 unique protein spots, representing about 808 non-redundant protein entries and approximately 900 of their isoforms were identified with less than 2% false discovery rate as determined by a database search to which was appended a decoy copy of the same database wherein the amino acid sequences of each protein entry had been randomized (9). Size and isoelectric point information on each spot allowed the detection and classification of post-translational modifications.
Figure 1. FAP colonic crypt and its 2D gel proteome.

A. A crypt isolated from the morphologically normal colonic mucosa of a FAP patient. B. Three overlapping pH range 2D gels across pI 4−11 resolve >4000 unique protein spots of FAP crypt proteome. 297 protein spots that changed with P < 0.01 are identified by their unique gel spot number in the Supplemental Data 5-7 and at our web site. These maps are searchable and hyperlink-enabled to gene ontology databases.
The files for three searchable point-and-click proteome maps of the human colon crypts representing the 214 proteins that separate FAP from control with P < 0.01, complete with hyperlinks to gene ontology web sites, are provided in the Supplemental Data 5-7 and at our web site. This proteomic report complies with the recommendations for the analysis and documentation of peptide and protein identification (17).
Statistical analyses
Although some inter-individual variability in the colonic proteome of patients was apparent, the group differences among FAP crypts and the non-affected crypts of sporadic colon cancer patients were highly significant. Initially, “unsupervised hierarchical clustering” was performed with each gel as an independent sample. Invariably, gel replicates clustered together correctly (data not shown). The conclusions in Figure 2 are supported by the comparison of 7 FAP and 7 control patients for each of which we used the average of multiple gel replicates for statistical analysis. The samples from FAP cases, with no exception, were properly separated from controls for each of the three pH ranges (Figure 2A-C), indicating that the phenotypic differences of FAP versus control crypts are the major factors distinguishing these two classes of patients.
Figure 2.
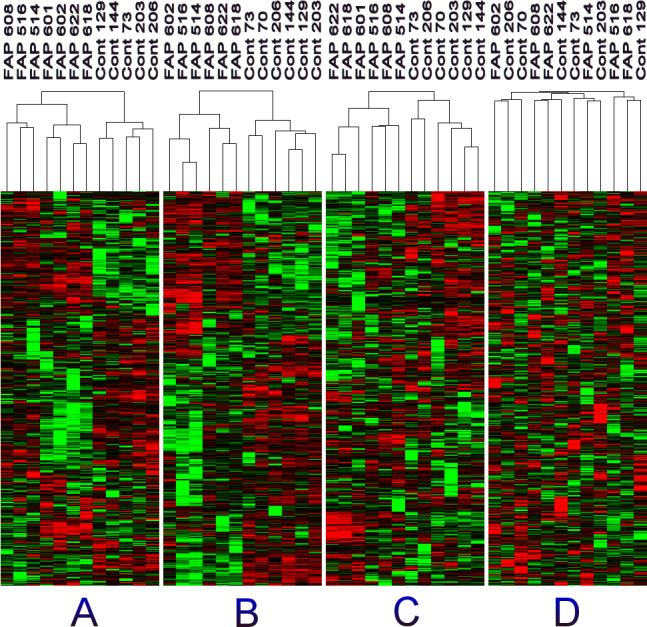
Hierarchical Clustering analysis of the proteomes of FAP crypts versus control crypts. Data from 2D gels of the following pH ranges: A. pH 4−7, B. pH 5−8, C. pH 6−11, D. pH 5−8 with the protein intensities in each column randomized. Red = FAP > Control, Green = FAP < Control, Black = no change. There are 5 shades of red and 5 shades of green. The sample identification numbers are listed with each sample.
The validity of this “unsupervised hierarchical clustering” was tested in Figure 2D. Here, the spots of each patient of the pH 5−8 range in Figure 2B were scrambled by randomizing the data matrix one column at a time, unlinking the relationship of each protein name to its spot intensity in each gel. The result of the unsupervised hierarchical clustering of this randomized matrix was a disordered display of spot intensities, with consequent lack of separation between FAP and control crypt, thus validating that the order observed in Figure 2B could not have arisen from statistical chance and bias. Accordingly, the first three components of a Principal Component Analyses (PCA) cleanly separated FAP and control samples (Figure 3).
Figure 3.

3D display of Principal Component Analysis of the first three components of the pH 4−11 proteomes of FAP crypts (on the right) versus control crypts (on the left). The larger white squares denote the samples and the smaller squares are individual proteins in the Principal Component space; gender is indicated as M and F. 335 proteins that distinguish FAP from control with P < 0.01 from two-tailed t-test are shown in red squares.
The Genesis one-way ANOVA tool was used to calculate the two-tailed t-test P value for each protein in terms of its significance in separating FAP samples from control samples (Supplemental Data 8 Table 2). With this approach, 122, 207, and 65 proteins, total 394, with P values of < 0.01 were obtained for pH 4−7, 5−8, and 6−11 range, respectively. 214 of these protein spots have been identified by mass spectrometry.
For the purpose of demonstrating that proteins over the complete range of isoelectric points can separate FAP from non-FAP patients, we selected five FAP samples and five control samples for which 2D gels of all three pH ranges were available and mapped the protein spots of P < 0.01 (Supplemental Data 9, 214 proteins with P < 0.01 and fold change greater than 0.5.xls) back onto the PCA analysis to test their agreement. The raw data and analyses are provided at our web site (Supplemental data 10, Genesis file 1 pH 4−11 project.txt and Supplemental data 11, Genesis file 2 pH 4−11 project.xml). With the provision that some of the protein spots in the overlapping regions of two pH ranges may have been counted more than once in this analysis, out of a total of 2556 protein spots included in the analysis, 394 proteins (15%) provided P < 0.01 as being differentially expressed in FAP versus control. These 394 spots were mapped into the PCA analysis in Figure 3 as small squares in red color. The clear separation of FAP versus control and the lack of outlier red spots indicate that the two statistical methods are congruent.
False Discovery Rate (FDR)
The foregoing lists of P < 0.01 significant proteins were again used to perform PCA (Supplemental Data 12) and hierarchical cluster analysis (Supplemental Data 13) to illustrate the successful grouping of important proteins that distinguish these phenotypes. The PCA analysis in Supplemental Data 12 is the result of coupling two statistical evaluations, t-test of individual proteins and PCA of all the significant proteins. The spot distribution in PCA confirms that the t-test results were correct. This congruency would not be automatically true had the t-test P < 0.01 list been short relative to the list that can be produced from random chance. For example, when the randomized data file used in Figure 2D was used in the t-test, the number of proteins showing P < 0.01 was only 7 (data not shown), which equals a FDR of 3.4%. Thus, the low FDR of our dataset was due to the high percentage of significant protein expression shifts detectable in our proteomic analysis.
The list of proteins that were up or down regulated as a result of the heterozygous APC mutation obtained by Progenesis image analysis and the fold changes in expression in combination with the P values of the t-test performed by Genesis are shown in Supplemental Data 8 Table 2. Congruent conclusion of 214 proteomic changes, including 148 non-redundant protein entries and 66 protein isoforms by these two software analyses plus PCA provides confidence that the assignments were statistically significant.
Validation of 2D gel fluorescence staining by 2D gel Western blots
It is likely that the differential protein expression seen for 172 out of the 214 biomarker proteins that distinguish FAP crypt from control crypt with p <0.01 involved not the total protein of each biomarker, but one or more isoforms of each protein, a situation that can arise from shifting in post-translational modifications. We therefore chose to further validate several biomarker proteins by 2D gel Western blotting experiments. Examples shown are for ECHS1 (Figure 4) and SOD2 (Figure 5). Although 2D gel Western blotting experiments are less quantitative than 2D gels stained with the fluorescent dye Sypro Ruby, they do validate that the protein identification for each isoform was correct and proportional to the changes observed with fluorescence staining presented in Supplemental Data 8 Table 2.
Figure 4.

2D gel Western blotting validation of ECHS1 differential expression in FAP versus control crypts, using antibodies to ECHS1. The immuno-detection was obtained by chemiluminescence on film and scanned for densitometry integration of the spots by the Progenesis image analysis software. Spot 1 in control and spot 2 in FAP correspond to the protein spot found by proteomics to be more than two fold elevated in FAP patients.
Figure 5.

2D gel Western blotting validation of SOD2 differential expression in FAP versus control crypts, using antibodies to SOD2. The immuno detection was obtained by chemiluminescence on film and scanned for densitometry integration of the spots by the Progenesis image analysis software. Spot 2 in control and spot 6 in FAP correspond to a protein spot found by proteomics to be more than two fold elevated in FAP patients.
Effect of gender or age
The influence of patient gender on the separation of two patient groups was ascertained by performing a two-tailed t-test of male samples versus female samples for the 2556 protein spots as performed above for FAP versus control, using the Genesis software. A P value of < 0.01 was used to obtain a list of protein names that significantly separated male from female. This list was compared with the above list of proteins that separated FAP from control with P < 0.01. With the division of the patients according to gender, only 24 identified proteins separated the two groups. Of these 24 proteins, none were in common with the 214 identified proteins that separated FAP from control group (Supplemental Data 9).
The difference between the mean ages of the FAP group versus the control group may be a confounding factor. A test of the effects of age was performed by exchanging two samples of the same gender and similar age: CP206 (female, age 41) from the control group with SID516 (female, age 39) from the FAP group. The resultant table of 2556 protein spots for pH 4−11 used in the above FAP versus control analysis was employed to calculate the P values separating group 1 from group 2 using the two-tailed t-test of each protein. With the exchange of these two patients, only 36 identified proteins separated the two groups; of these 36 proteins, only 9 proteins were in common with the 214 identified proteins that separated FAP from control (Supplemental Data 9).
Characterization of FAP versus controls
Apoptosis-related proteins
One of the proteomic changes with the greatest magnitude was the major isoform of ETHE1 protein (spot 2470 pH 5−8), elevated about 27 fold in FAP crypts from non-gene-carriers (Supplemental Data 8 Table 2). We also observed a 4.3 fold increase of Baculoviral IAP repeat-containing protein 8 (Inhibitor of apoptosis-like protein 2, spot 367 pH 5−8, 1.3 fold decrease and 1.8 fold increase for isoform spot 2399 pH 4−7 and spot 1847 pH 5−8, respectively) in FAP crypts, a 5.2 fold decrease in the Programmed cell death 6-interacting protein (PDCD6-interacting protein, isoform spot 633 pH 5−8), a 0.5 fold decrease in the 14−3−3 protein sigma (Stratifin, spot 2110 pH 4−7), a 1.7 fold decrease of nucleophosmin (NPM, nuclear phosphoprotein B23, spot 1823 pH 5−8), and a 4.5 fold decrease of an isoform of Annexin A11 (Calcyclin-associated annexin 50, spot 1161 pH 5−8) (Supplemental Data 8 Table 2).
Proteins relevant to oxidative stress
Another significant FAP-specific phenotype is several-fold elevation in the isoforms of 18 mitochondrial enzymes in FAP crypts, including many enzymes of the tricarboxylic acid (TCA) cycle, concomitant with a decrease in a number of glycolytic enzymes (Supplemental Data 8 Table 2).
Four additional proteins that are presumably associated with oxidative stress were observed in this study to be elevated in FAP crypts, as follows:
Superoxide dismutase [Mn]
This mitochondria-specific SOD2 (18), was observed as having four isoforms. Spots 2612 (pH 5−8 gel) and 2380 (pH 4−7 gel) were unchanged. Spots 2623 and 2628 were one-fold and five-fold higher, respectively, in FAP than in controls (Supplemental Data 8 Table 2).
Catalase
Two isoforms of catalase were detected (Supplemental Data 8 Table 2). Spots 1033 and 1024 showed opposing changes in expression in the same pH range gel in FAP vs. control crypts, suggesting perhaps that regulation may have occurred by post-translational modification.
Protein disulfide-isomerase A3
Three isoforms of protein disulfide isomerase A3, found in the endoplasmic reticulum, were observed to be elevated in the FAP patient samples (Supplemental Data 8 Table 2).
Oncogene DJ-1 (PARK7)
Oncogene DJ-1 isoform spot 2319 increased in FAP samples (Supplemental Data 8 Table 2).
Changes in apoptosis, cell proliferation and migration may require significant alteration of the cytoskeleton. For example, several cytokeratins known to be expressed in colonic mucosa are down-regulated in FAP crypts compared to control crypts (Supplemental Data 8, Tables 2).
Other significant protein changes, notably FK506-binding protein 4, and Carbonic Anhydrase 1 (up to 10-fold increase in FAP), among others are shown in Supplemental Data 8, Table 2.
Discussion
Characterization of FAP versus controls
APC plays a dominant role in the etiology of colorectal cancer. Although colorectal adenocarcinomas represent a primary clinical outcome in FAP patients, stromal involvement and stromalepithelial cell interactions are also impacted (4-7). The latter is clearly manifested clinically in the Gardner syndrome variant of FAP where, in addition to colon cancer, desmoid tumors are prevalent (19). It is of interest, however, that in the present study APC mutations that occur within discrete functional domains of the gene product do not necessarily conform to a clinical phenotype that has been ascribed to these functional domains (20-22). APC mutations are also present in about 20% of hereditary non-polyposis colorectal cancer (HNPCC) and they are highly prevalent in sporadic forms of colorectal cancers, suggesting the involvement of similar and divergent pathways in the etiology of colorectal cancer (23). For example, while fibroblasts from FAP patients show significant deformities in cytoskeletal actin (24), fibroblasts from HNPCC patients appeared normal for cytoskeletal actin (4, 25), pointing to a gene-specific effect in single-hit cells by APC which is not seen in mismatch repair-deficient cells. This result further supports the value of biomarkers, whether by phenotype, RNA expression arrays, or proteomics, in elucidating mechanisms of cancer progression using morphologically normal tissue from patients at varying genetic risk for cancer. Accordingly, a significant observation in this study is that the morphologically normal FAP and the non-FAP control colon crypt proteomes are substantially different, providing biomarkers that can potentially be used to reveal the pathogenesis and pathophysiology underlying the FAP condition. Importantly, this report has demonstrated that the colonic crypt cells from the morphologically normal mucosa in adult FAP patients are one-hit.
With regard to the observed changes in the isoforms of cytokeratins, there has been substantial interest in using TPS (determining fragments of cytokeratin 18) and CYFRA 21.1 (determining fragments of cytokeratin 19) as serum markers of cancer, although recent studies appear inconclusive (26, 27). Based on the current studies of the cytokeratins and other examples, vide infra, it would appear that it is important to consider both quantitative and post-translational modification changes in order to accurately evaluate the FAP phenotype. For example, neuroblastoma patients form autoantibodies against specific truncated isoforms I and III of β-tubulin that do not react with the β-tubulin isoforms I and III from non-cancer patients (28). One of the two alternate spliced isoform of Pantothenate kinase (PanK), a rate-determining enzyme in coenzyme A biosynthesis, confers feedback inhibition on the enzyme, leading to regulation of the enzyme activity and the level of acetyl-coA in the cell (29).
Two phenotypes of FAP crypts suggested by this study are the attenuation of apoptosis and the elevation of oxidative stress. ETHE1 (HSCO) increase was recently shown to down-regulate p53-dependent apoptosis (30) and its elevation may lead to attenuation of apoptosis during the aging of the crypt cells. ETHE1 specifically associates with histone deacetylase 1 (HDAC1) independently of Mdm2 and facilitates deacetylation of p53 at Lys373/382 by HDAC1 (31). By increasing ubiquitination and degradation of p53, ETHE1 reduces p53 protein levels. Consistent with this hypothesis of attenuation of apoptosis in FAP crypts were the observed changes in Baculoviral IAP repeat-containing protein 8, the Programmed cell death 6-interacting protein, the 14−3−3 sigma protein, and Annexin A11.
The oxidative stress damage caused by a high level of oxidative phosphorylation in FAP crypts may be attenuated by SOD2, catalase, protein disulfide isomerase and DJ-1. SOD2, elevated in FAP crypts, catalyzes the dismutation of O −2 superoxide into oxygen and hydrogen peroxide. Elevated SOD2 expression in colon cancer cell lines is also correlated with enhanced survival after cytotoxic exposures (32), consistent with the anti-apoptosis effect vide ante from elevated ETHE1. Catalase catalyzes the decomposition of hydrogen peroxide to water and oxygen. Y231 and Y386 residues in human catalase can be phosphorylated by c-Abl and Arg non-receptor tyrosine kinases to regulate the catalase activity (33). Oxidative stress causes oxidation of disulfide bonds in proteins which must be restored by protein disulfide isomerases (34). Another effect of oxidative damage is the oxidation of oncogene DJ-1 at cys106 which results in pI change to more acidic range, consistent with the observed DJ-1 isoform spot 2319 increase in FAP samples. Only this oxidized form of DJ-1 appears to have significant anti-aggregation properties against alpha-synuclein (35) and protection against oxidative damage in neurons (36). This potential role for DJ-1 in the FAP crypt may be distinct from another role for DJ-1 as a regulator of the androgen receptor (37).
In the current report, we found the FAP crypt proteome to be significantly different from control crypts isolated from morphologically normal mucosa of patients with non-hereditary cancer. The proteomic alterations observed in the FAP syndrome encompassed many proteins in diverse pathways that are also seen in the corresponding tumors themselves, suggesting that, in general, the phenotypic effects of a heterozygous tumor suppressor gene mutation on the path to cancer involves similar proteome-wide changes; i.e., there is a “one-hit” phenotype effect of germline mutations in this tumor suppressor gene. Collectively, these alterations in the gene expression repertoire associated with single-hit mutations of tumor suppressor genes are likely to represent the earliest molecular changes during tumorigenesis. Furthermore, there may well be a further clarification of optimal targets at the two-hit stage of tumorigenesis in that those revealed in one-hit lesions would not include confounding secondary tumor effects. Thus, over 60% of the most significant protein differences in the morphologically normal FAP crypts compared with control crypts are consistent with known or proposed physiology of colorectal cancer development. Moreover, because 172 out of 214 significant FAP related proteome changes involved proteins that had at least one more isoform identified in these gels, the FAP phenotype may involve critical change in one or more post-translational modification systems that produced these pleotrophic proteome changes. In this regard, a notable, albeit a meaningful “exception”, is the presumed lack of a “Warburg effect” and the dominant role of mitochondrial proteins in FAP crypts. The elevation of mitochondrial marker proteins and oxidative stress response proteins suggests that oxidative stress response may be an important early event that is associated with a one-hit mutation of the APC gene during the very early stages of carcinogenesis. Also, p53 in the morphologically normal fibroblasts from FAP patients, although abnormally stable, was not mutated in these cells (5), again pointing to subtle but significant occurrences very early in cancer development. Thus there are many opportunities for the discovery of biomarkers for cancer intervention and prevention by studying the morphologically normal crypts of patients with varying risk for colon cancer. These one-hit cells might, therefore, be an important experimental system for chemoprevention studies.
Supplementary Material
Acknowledgment
The authors are grateful to Drs. David Weinberg, Lisa Henske, Avram Hershko, and Joseph Testa for critical readings of this manuscript. We gratefully acknowledge the physicians who enrolled the majority of FAP and control cases: Dr. Jonathan Terdiman, University of California at San Francisco, Dr. Daniel Chung, Massachusetts General Hospital, and Dr. James Church, Cleveland Clinic. The authors are grateful to Dr. Margie Clapper of Fox Chase Cancer Center for her assistance in the recruitment of FAP research participants.
Financial support: Supported by the National Cancer Institute, Contracts No. NO1-CN-15103 (A.K) and N01-CN-43309, Grant DK063014 (B.B), Institutional Core Grant P30CA06927, CA119242 and the Ewing Trust (A.Y), the Fannie E. Rippel Foundation, The Shöller Foundation, Tobacco Settlement Funds from the Commonwealth of Pennsylvania, the Pew Charitable Trust, and the Kresge Foundation.
Footnotes
References
- 1.Leading Sites of New Cancer Cases and Deaths 2006 Estimates. 2007. [cited March 29, 2007]4
- 2.Fearon ER, Vogelstein B. A genetic model for colorectal tumorigenesis. Cell. 1990;61:759–67. doi: 10.1016/0092-8674(90)90186-i. [DOI] [PubMed] [Google Scholar]
- 3.Knudson AG. Two genetic hits (more or less) to cancer. Nat Rev Cancer. 2001;1(2):157–62. doi: 10.1038/35101031. [DOI] [PubMed] [Google Scholar]
- 4.Kopelovich L. Phenotypic markers in human skin fibroblasts as possible diagnostic indices of hereditary adenomatosis of the colon and rectum. Cancer. 1977;40:2534–41. doi: 10.1002/1097-0142(197711)40:5+<2534::aid-cncr2820400921>3.0.co;2-f. [DOI] [PubMed] [Google Scholar]
- 5.Kopelovich L. Heritable colorectal cancer and cancer genes: systemic expressions. Mol Carcinog. 1993;8(1):3–6. doi: 10.1002/mc.2940080104. [DOI] [PubMed] [Google Scholar]
- 6.Danes BS. Increased in vitro tetraploidy: tissue specific within the heritable colorectal cancer syndromes with polyposis coli. Cancer. 1978;41:2330–4. doi: 10.1002/1097-0142(197806)41:6<2330::aid-cncr2820410635>3.0.co;2-x. [DOI] [PubMed] [Google Scholar]
- 7.Stoyanova R, Clapper ML, Bellacosa A, et al. Altered Gene Expression in Phenotypically Normal Renal Cells from Carriers of Tumor Suppressor Gene Mutations. Cancer Biol Ther. 2004;3(12) doi: 10.4161/cbt.3.12.1459. [DOI] [PubMed] [Google Scholar]
- 8.Carrette O, Burkhard PR, Sanchez JC, Hochstrasser DF. State-of-the-art two-dimensional gel electrophoresis: a key tool of proteomics research. Nature protocols. 2006;1(2):812–23. doi: 10.1038/nprot.2006.104. [DOI] [PubMed] [Google Scholar]
- 9.Patel BB, Li XM, Dixon MP, et al. Searchable high-resolution 2D gel proteome of the human colon crypt. J Proteome Res. 2007;6(6):2232–8. doi: 10.1021/pr060641e. [DOI] [PubMed] [Google Scholar]
- 10.Li XM, Patel BB, Blagoi EL, et al. Analyzing alkaline proteins in human colon crypt proteome. J Proteome Res. 2004;3(4):821–33. doi: 10.1021/pr049942j. [DOI] [PubMed] [Google Scholar]
- 11.Eisen MB, Spellman PT, Brown PO, Botstein D. Cluster analysis and display of genome-wide expression patterns. Proc Natl Acad Sci USA. 1998;95(25):14863–8. doi: 10.1073/pnas.95.25.14863. [DOI] [PMC free article] [PubMed] [Google Scholar]
- 12.Sturn A, Quackenbush J, Trajanoski Z. Genesis: cluster analysis of microarray data. Bioinformatics. 2002;18(1):207–8. doi: 10.1093/bioinformatics/18.1.207. [DOI] [PubMed] [Google Scholar]
- 13.Misra J, Schmitt W, Hwang D, Hsiao LL, Gullans S, Stephanopoulos G. Interactive exploration of microarray gene expression patterns in a reduced dimensional space. Genome Res. 2002;12(7):1112–20. doi: 10.1101/gr.225302. [DOI] [PMC free article] [PubMed] [Google Scholar]
- 14.Peterson LE. Partitioning large-sample microarray-based gene expression profiles using principal components analysis. Comput Methods Programs Biomed. 2003;70(2):107–19. doi: 10.1016/s0169-2607(02)00009-3. [DOI] [PubMed] [Google Scholar]
- 15.Al-Shahrour F, Diaz-Uriarte R, Dopazo J. FatiGO: a web tool for finding significant associations of Gene Ontology terms with groups of genes. Bioinformatics. 2004;20(4):578–80. doi: 10.1093/bioinformatics/btg455. [DOI] [PubMed] [Google Scholar]
- 16.Wildrick DM, Lointier P, Nichols DH, Roll R, Quintanilla B, Boman BM. Isolation of normal human colonic mucosa: comparison of methods. In Vitro Cell Dev Biol Anim. 1997;33(1):18–27. doi: 10.1007/s11626-997-0017-2. [DOI] [PubMed] [Google Scholar]
- 17.Carr S, Aebersold R, Baldwin M, Burlingame A, Clauser K, Nesvizhskii A. The need for guidelines in publication of peptide and protein identification data: Working Group on Publication Guidelines for Peptide and Protein Identification Data. Mol Cell Proteomics. 2004;3(6):531–3. doi: 10.1074/mcp.T400006-MCP200. [DOI] [PubMed] [Google Scholar]
- 18.Fridovich I. Superoxide radical and superoxide dismutases. Annu Rev Biochem. 1995;64:97–112. doi: 10.1146/annurev.bi.64.070195.000525. [DOI] [PubMed] [Google Scholar]
- 19.Simpson RD, Harrison EG, Jr., Mayo CW. Mesenteric Fibromatosis in Familial Polyposis. A Variant of Gardner's Syndrome. Cancer. 1964;17:526–34. doi: 10.1002/1097-0142(196404)17:4<526::aid-cncr2820170414>3.0.co;2-q. [DOI] [PubMed] [Google Scholar]
- 20.Qian J, Steigerwald K, Combs KA, Barton MC, Groden J. Caspase cleavage of the APC tumor suppressor and release of an amino-terminal domain is required for the transcription-independent function of APC in apoptosis. Oncogene. 2007;26(33):4872–6. doi: 10.1038/sj.onc.1210265. [DOI] [PubMed] [Google Scholar]
- 21.Moseley JB, Bartolini F, Okada K, Wen Y, Gundersen GG, Goode BL. Regulated binding of adenomatous polyposis coli protein to actin. J Biol Chem. 2007;282(17):12661–8. doi: 10.1074/jbc.M610615200. [DOI] [PubMed] [Google Scholar]
- 22.Mimori-Kiyosue Y, Matsui C, Sasaki H, Tsukita S. Adenomatous polyposis coli (APC) protein regulates epithelial cell migration and morphogenesis via PDZ domain-based interactions with plasma membranes. Genes Cells. 2007;12(2):219–33. doi: 10.1111/j.1365-2443.2007.01045.x. [DOI] [PubMed] [Google Scholar]
- 23.Perucho M. Cancer of the microsatellite mutator phenotype. Biological chemistry. 1996;377(11):675–84. [PubMed] [Google Scholar]
- 24.Kopelovich L, Conlon S, Pollack R. Defective organization of actin in cultured skin fibroblasts from patients with inherited adenocarcinoma. Proc Natl Acad Sci U S A. 1977;74(7):3019–22. doi: 10.1073/pnas.74.7.3019. [DOI] [PMC free article] [PubMed] [Google Scholar]
- 25.Kopelovich L, Lipkin M, Blattner WA, Fraumeni JF., Jr. Organization of actin-containing cables in cultured skin fibroblasts from individuals at high risk of colon cancer. Int J Cancer. 1980;26(3):301–7. doi: 10.1002/ijc.2910260308. [DOI] [PubMed] [Google Scholar]
- 26.Gonzalez-Quintela A, Garcia J, Campos J, et al. Serum cytokeratins in alcoholic liver disease: contrasting levels of cytokeratin-18 and cytokeratin-19. Alcohol. 2006;38(1):45–9. doi: 10.1016/j.alcohol.2006.01.003. [DOI] [PubMed] [Google Scholar]
- 27.Barak V, Goike H, Panaretakis KW, Einarsson R. Clinical utility of cytokeratins as tumor markers. Clin Biochem. 2004;37(7):529–40. doi: 10.1016/j.clinbiochem.2004.05.009. [DOI] [PubMed] [Google Scholar]
- 28.Prasannan L, Misek DE, Hinderer R, Michon J, Geiger JD, Hanash SM. Identification of beta-tubulin isoforms as tumor antigens in neuroblastoma. Clin Cancer Res. 2000;6(10):3949–56. [PubMed] [Google Scholar]
- 29.Rock CO, Karim MA, Zhang YM, Jackowski S. The murine pantothenate kinase (Pank1) gene encodes two differentially regulated pantothenate kinase isozymes. Gene. 2002;291(1−2):35–43. doi: 10.1016/s0378-1119(02)00564-4. [DOI] [PubMed] [Google Scholar]
- 30.Higashitsuji H, Higashitsuji H, Nagao T, et al. A novel protein overexpressed in hepatoma accelerates export of NF-kappa B from the nucleus and inhibits p53-dependent apoptosis. Cancer Cell. 2002;2(4):335–46. doi: 10.1016/s1535-6108(02)00152-6. [DOI] [PubMed] [Google Scholar]
- 31.Higashitsuji H, Higashitsuji H, Masuda T, Liu Y, Itoh K, Fujita J. Enhanced deacetylation of p53 by the anti-apoptotic protein HSCO in association with histone deacetylase 1. J Biol Chem. 2007;282(18):13716–25. doi: 10.1074/jbc.M609751200. [DOI] [PubMed] [Google Scholar]
- 32.Kuninaka S, Ichinose Y, Koja K, Toh Y. Suppression of manganese superoxide dismutase augments sensitivity to radiation, hyperthermia and doxorubicin in colon cancer cell lines by inducing apoptosis. Br J Cancer. 2000;83(7):928–34. doi: 10.1054/bjoc.2000.1367. [DOI] [PMC free article] [PubMed] [Google Scholar]
- 33.Cao C, Leng Y, Kufe D. Catalase activity is regulated by c-Abl and Arg in the oxidative stress response. J Biol Chem. 2003;278(32):29667–75. doi: 10.1074/jbc.M301292200. [DOI] [PubMed] [Google Scholar]
- 34.Tu BP, Weissman JS. Oxidative protein folding in eukaryotes: mechanisms and consequences. J Cell Biol. 2004;164(3):341–6. doi: 10.1083/jcb.200311055. [DOI] [PMC free article] [PubMed] [Google Scholar]
- 35.Zhou W, Zhu M, Wilson MA, Petsko GA, Fink AL. The oxidation state of DJ-1 regulates its chaperone activity toward alpha-synuclein. J Mol Biol. 2006;356(4):1036–48. doi: 10.1016/j.jmb.2005.12.030. [DOI] [PubMed] [Google Scholar]
- 36.Martinat C, Shendelman S, Jonason A, et al. Sensitivity to oxidative stress in DJ-1-deficient dopamine neurons: an ES- derived cell model of primary Parkinsonism. PLoS Biol. 2004;2(11):e327. doi: 10.1371/journal.pbio.0020327. [DOI] [PMC free article] [PubMed] [Google Scholar]
- 37.Takahashi K, Taira T, Niki T, Seino C, Iguchi-Ariga SM, Ariga H. DJ-1 positively regulates the androgen receptor by impairing the binding of PIASx alpha to the receptor. J Biol Chem. 2001;276(40):37556–63. doi: 10.1074/jbc.M101730200. [DOI] [PubMed] [Google Scholar]
Associated Data
This section collects any data citations, data availability statements, or supplementary materials included in this article.