

Abstract
Voltage-gated sodium channels (VGSC) are critical membrane components that participate in the electrical activity of excitable cells. The type one VGSC family includes the tetrodotoxin insensitive sodium channel, Nav1.8, encoded by the Scn10a gene. Nav1.8 expression is restricted to small and medium diameter nociceptive sensory neurons of the dorsal root (DRG) and cranial sensory ganglia. In order to understand the stringent transcriptional regulation of the Scn10a gene, the sensory neuron specific promoter was functionally identified. While identifying the mRNA 5’ end, alternative splicing within the 5’ UTR was observed to create heterogeneity in the RNA transcript. Four kilobases of upstream genomic DNA was cloned and the presence of tissue specific promoter activity was tested by microinjection and adenoviral infection of fluorescent protein reporter constructs into primary mouse and rat neurons, and cell lines. The region contained many putative transcription factor binding sites and strong homology with the predicted rat ortholog. Homology to the predicted human ortholog was limited to the proximal end and several conserved cis elements were noted. Two regulatory modules were identified by microinjection of reporter constructs into DRG and superior cervical ganglia neurons: a neuron specific proximal promoter region between −1.6 and −0.2kb of the transcription start site cluster, and a distal sensory neuron switch region beyond −1.6kb that restricted fluorescent protein expression to a subset of primary sensory neurons.
Keywords: tetrodotoxin-resistant sodium channel, pain, promoter, sensory neuron
Introduction
Voltage gated sodium channels (VGSC) are responsible for much of the electrical activity of excitable cells. The VGSC structure is comprised of a large, pore containing alpha subunit, capable of gating and conducting, and up to two auxiliary beta subunits that modify the channel properties. The alpha subunit proteins are approximately 250kDa and contain 4 domains composed of 6 transmembrane helices each (Catterall, 2000). Nine members of the mammalian alpha subunit (Nav1.1–1.9) and 4 members of the mammalian beta subunit (β1–4) families have been cloned.
The genes encoding the VGSC alpha subunits are complex, for example, the mouse scn10A gene encoding tetrodotoxin resistant (TTX-r) Nav1.8 contains at least 27 exons, spans over 90kb and is located on mouse chromosome 9 (Souslova et al. 1997) between genes encoding TTX-r sodium channels Nav1.5 and Nav1.9 (Dib-Hajj et al. 1999a). Expression patterns of the alpha subunit family members are also complex and often overlap, although some family members such as Nav1.8 express exclusively in discrete locations (see Goldin, 2002). Tissue specific gene promoters have been identified and characterized for several alpha family members such as Nav1.2 (Schade and Brown, 2000; Maue et al. 1990), Nav1.5 (Shang and Dudley, 2005; Yang et al. 2004), Nav1.6 (Drews et al. 2005, 2007), and Nav1.4 (Kraner et al. 1998, 1999).
The focus of this study, the Scn10a gene, is tightly regulated at the level of transcription and the gene product, Nav1.8, is expressed exclusively in a subpopulation of primary afferent neurons found in the trigeminal, nodose and dorsal root ganglia (DRG) (Akopian et al. 1996; Sangamaswaran et al. 1996). These sensory ganglia contain a heterogeneous population of neurons responsible for detecting stimuli from light touch to thermally, chemically, and mechanically induced pain. Nav1.8 is expressed primarily in small to medium diameter neurons and appears to be an important component of nociception (Akopian et al. 1996; Djouhri et al. 2003). In addition to a role in useful pain perception and acute inflammation, dysregulation of Nav1.8 expression accompanies chronic inflammation and neuropathic injury and may contribute to hyperalgesia and allodynia (Porreca et al. 1999; Baker and Wood, 2001). Transcriptional dysregulation may result from perturbation of typical peripheral levels of signaling molecules such as NGF (Lai et al. 2004). An Nav1.8 transcriptional channelopathy also occurs in multiple sclerosis when the channel expresses ectopically in demyelinated cerebellar Purkinje cells (Waxman, 2001).
The physiological significance of the Nav1.8 channel makes it an obvious therapeutic target and a selective blocker has recently been shown to attenuate both inflammatory and neuropathic pain in rats (Jarvis et al. 2007). The elucidation of the transcriptional control elements guiding the exclusive tissue distribution may yield additional pharmacological targets for disease or pain management. Furthermore, Scn10a promoter reporters may facilitate the identification of Nav1.8 expressing neurons within the heterogeneous sensory ganglia thereby facilitating nociceptor study. Despite the importance and utility, the promoter has remained a mystery. The lack of information on transcriptional control results from the fact that what makes it interesting (extreme tissue specificity) also makes it elusive. The strict tissue distribution makes gene promoter analysis via conventional techniques involving cell line expression challenging. Hence, we have employed methods capable of monitoring gene expression from tissue specific promoters in neurons, such as microinjection and adenoviral infection of reporter constructs. In the present study, we have identified several putative transcription start sites, observed alternative splicing in the 5’UTR, and functionally identified a region of the mouse genome flanking the Scn10a gene capable of directing appropriate expression of reporter cassettes i.e. sensory neuron specific expression. Using a series of deletion constructs of the putative promoter with this neural approach, we have identified a region we call the SNSRE that may contain the switch for the restricted sensory neuron expression of the Nav1.8 gene product.
Materials and Methods
Molecular Biology
Oligonucleotide primers were purchased from Integrated DNA Technologies Inc. (Coralville, IA, USA). Restriction enzymes and DNA modification enzymes were purchased from New England Biolabs (Ipswich, MA, USA) unless noted otherwise. All experiments involving animal use were approved by the Institutional Animal Care and use Committee. All clones were sequenced on a Beckman-Coulter CEQ8000 Genetic Analyzer (Fullerton, CA, USA). Sequence analysis was performed using either Sequencher (GeneCodes, Ann Arbor, MI, USA) or MacVector (Accelrys, San Diego, CA, USA) software packages. BLAST analyses were performed via the NCBI website (http://www.ncbi.nlm.nih.gov). BLAT analyses were performed through the UCSC Genome Bioinformatics site (University of California, Santa Cruz http://genome.ucsc.edu) (Kent 2002). Transcription Factor binding site searches were performed using either MacVector software or the Match™ program with the TRANSFAC 6.0 – Public database (BIOBASE – GmbH - http://www.gene-regulation.com).
5’ Rapid amplification of cDNA ends
5’RACE was performed three times on pools of RNA isolated from mouse dorsal root ganglia. Total RNA was isolated by the RNeasy® kit (Qiagen, Valencia, CA, USA) from acutely isolated adult Swiss Webster mouse DRG neurons. Total RNA was reverse transcribed and 5’RACE was performed using the SMART® RACE kit (Clontech, Mountain View, CA, USA). RACE primers were designed to amplify upstream from the first coding exon based on sequence identified by Souslova et al. (1997) (GenBank accession #Y09108). The following 5’ RACE primers were used: 5’-GAACCTGGGCAGCTGGTTACAGG-3’; 5’-CAGCGATCTGCTTCTCGATCTCTGC-3’; 5’-CATCTTCTCATTCTTCTTGGGGAAGG-3’. These primers were used in separate experiments on pooled DRG total RNA and nested reactions were not necessary. Amplification products from the primary reactions were cloned into the pGEM-5Z vector using the pGEM-Teasy® TA cloning kit (Promega, Madison, WI, USA) prior to sequencing.
Reverse transcription - polymerase chain reaction
RT-PCR was performed on total RNA isolated as above from mouse DRGs or N1E-115 neuroblastoma cells using the Qiagen one-step RT-PCR kit. The following primers were used and products were cloned and sequenced as above: (Exon1 (GSP) out) 5’-GGCTTCTCACTCTTGTCCTTCTGTC-3’; (A) 5’-CTTCTCGGTAAAGAACTCCTAAGG-3’; (B) 5’-CACGCTTTGGTGAGTGCGAGTG-3’; (C) 5’-GAGTCTGTCATGGCTGCCAGACG-3’; (D) 5’-CATCTAATCACACATAAGCCTCTCC-3’; (E) 5’-ATGACGGGAAATGGGAACGG-3’; (F) 5’-GTGACGGACGGGTGAGGTTTCC-3’; (G) 5’-TCTGCTAATGCTACCCCAGGC-3’. Reaction products were visualized on a 1.5% agarose gel and imaged on a Kodak DC290 gel documentation system (Kodak, New Haven, CT, USA). Reaction products were cloned and sequenced as above.
Ligation Mediated - polymerase chain reaction
Two rounds of the LM-PCR were performed using the mouse GenomeWalker® kit with Advantage 2® polymerase (Clontech). The following primers were designed to amplify genomic DNA upstream from the noncoding 5’UTR exon identified via 5’RACE: Primary reaction, 5’-GCTCAGCATTCGCGCATGGCAGG-3’; nested reaction, 5’CTCCATCTGCCATCTGTTCTCCGTC-3’. A second round of LMPCR was performed off of the end of the first round product using the following primers: Primary reaction, 5’-GTGTGTCACGTGGAGAAAGGCAAGCC -3’; nested reaction, 5’-CAGTACCCTGATCACTAATGGCACC-3’. Amplification products were cloned using the pGEM-Teasy TA® cloning kit and sequenced. The combined (~4.0kb) product of the two rounds of LMPCR was amplified and cloned from a BAC clone identified via a PCR screen of a mouse 129/SvJ/RW4ES library (Incyte Genomics, Palo Alto, CA, USA) for the first coding exon of the Scn10a gene based on the above mentioned #Y09108 derived sequence. The combined LMPCR fragment was cloned using the pGEM-Teasy TA® cloning kit prior to sequencing.
Reporter constructs for microinjection and transfection assays
Reporter constructs for microinjection and transfection were built in the promoterless EGFP-1 vector (Clontech). Deletions of the original 4.0kb fragment were constructed using a modification (Geiser et al. 2001) of the QuickChange protocol (Stratagene, La Jolla, CA, USA). Primers used to generate the deleted reporter constructs are summarized in Table 1 of the supplemental data. Initial studies with control or empty vector revealed modest expression of the EGFP protein as monitored via epifluorescence. To alleviate this problem a synthetic transcription pause site (TPS) from the pGL3 vector series (Promega) was inserted before the multiple cloning site of the pEGFP-1 vector. This TPS site eliminated the spurious reporter expression. GFP reporter constructs are summarized in figure 4.
Figure 4.
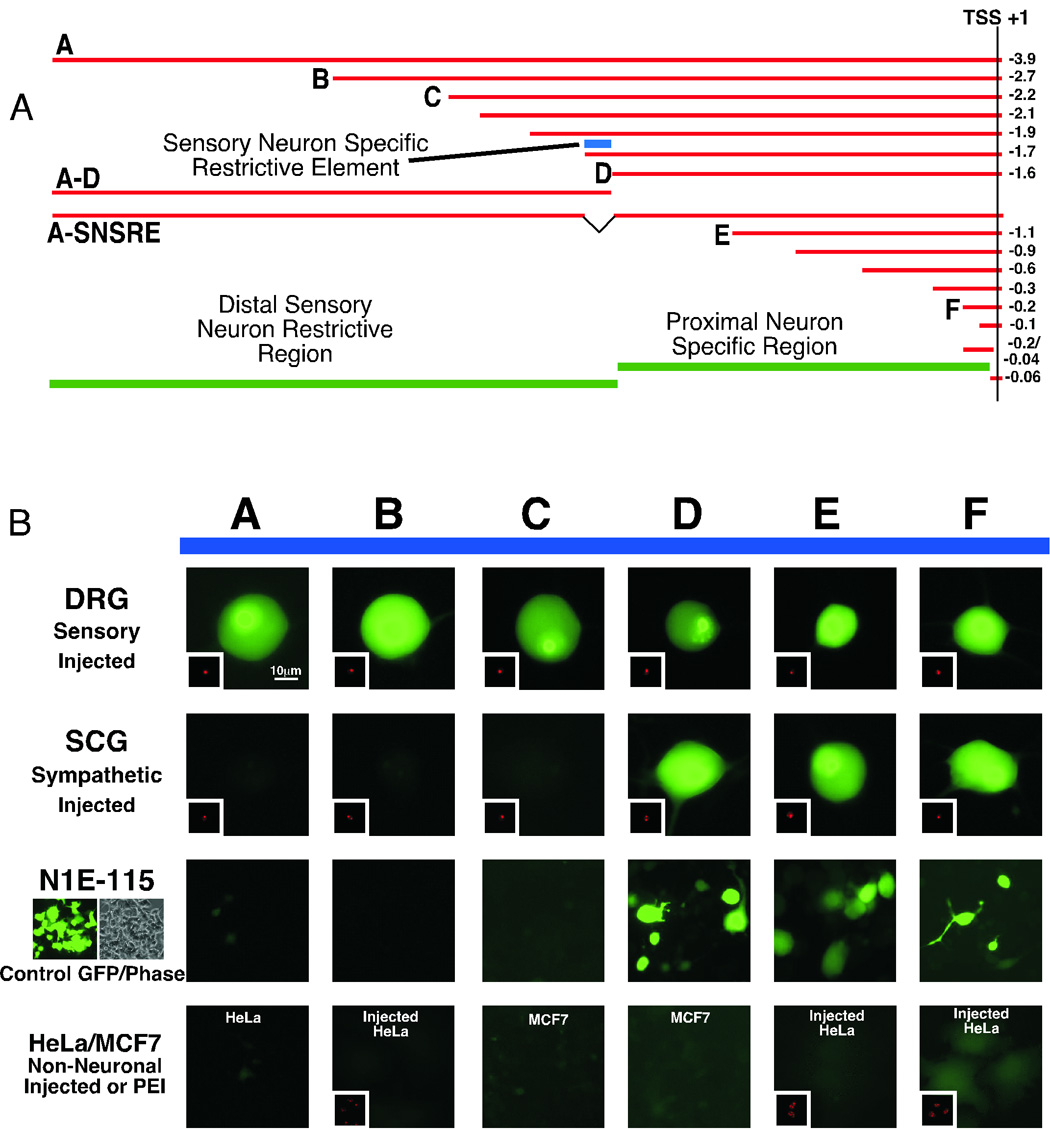
Microinjection and transfection of EGFP reporter constructs reveals a sensory neuron restrictive region and proximal neuron specific promoter. Panel A shows the positions of fragments used to construct EGFP reporter constructs for delivery into primary neurons and cell lines. Green bars indicate the positions of proximal and distal regions capable of directing neuron specific expression and limiting this expression to a subset of sensory neurons, respectively. The blue bar labeled “Sensory Neuron Specific Restrictive Element” was identified through end deletion experiments. Panel B contains representative images of coinjected (EGFP reporter and CMVdsREDnuc) sensory (DRG) and sympathetic (SCG) neurons as well as the transfected neuroblastoma line N1E115 and transfected and coinjected non-neuronal lines. Letters correspond to the fragments at the top. A change occurred in the ability of mouse genomic fragments to limit expression to sensory neurons between constructs “C” (−2.2kb) and “D” (−1.6kb).
Adenoviral reporter construction
Adenoviral reporter vectors were constructed in the ADeasy vector pShuttle provided as a gift from Dr. T.-C. He (Johns Hopkins University). The promoter fragment cassette including the 2.7kb Scn10a promoter fragment with the EGFP open reading frame and SV40 Poly A signal was moved to the shuttle vector by restriction cutting and cloning as follows: the 2.7kb containing pEGFP-1 constructs was cut with AflII and the overhangs were filled with the Klenow fragment of DNA polymerase I. The fragment was removed by digestion with XhoI, gel purified using the Qiaex II kit (Qiagen) and cloned into the XhoI and EcoRV sites of the pShuttle vector. The dual cassette reporter was constructed by adding a dsRED expression cassette from the dsRED2nuc vector (Clontech). The dsREDnuc expression cassette including the CMV promoter and SV40 PolyA signal was amplified with Pfu polymerase (Stratagene), phosphorylated with T4 polynucleotide kinase and cloned into the Klenow blunted BglII site of the Shuttle vector.
Cell culture
Single dorsal root ganglion (DRG) neurons were isolated from adult male Swiss Webster mice. Briefly, after dissection, ganglia isolated from all spinal levels were combined and incubated with 0.7 mg/ml collagenase type D (Roche Molecular Biochemicals, Indianapolis, IN), 0.1 mg/ml trypsin (Worthington Biochemical Corp., Lakewood, NJ), and 0.1 mg/ml DNase 1, type IV, (Sigma Chemical Co., St. Louis, MO) in minimal essential medium (MEM) saturated with 5% CO2/95% O2 at 37 °C for 1 h. Thereafter, cells were dissociated by vigorous shaking of the flask. After washing and centrifugation twice at 50xg, the dispersed neurons were resuspended in MEM containing 10% fetal bovine serum, 1% glutamine, and 1% penicillin-streptomycin solution (all from Invitrogen, Casbad, CA). Media was supplemented with 5ng/mL NGF and 5ng/mL GDNF. Neurons were then plated into polystyrene tissue culture dishes coated with poly-l-lysine and stored in a humidified atmosphere containing 5% CO2 in air at 37 °C. Single superior cervical ganglion (SCG) neurons were isolated from 10–14 week-old male Wistar rats as previously described (Ikeda, 2004) using essentially the same procedure except that ganglia were desheathed and cut into small pieces, also, the trypsin concentration was increased to 0.4 mg/ml. Hippocampal and cortical neurons isolated from newborn Sprague-Dawley rats were cultured essentially as previously described (Chen and Lambert, 2000). HEK293, MCF7, SK-N-SH, N1E-115 and HeLa cell lines were cultured in growth media as recommended by the provider (ATCC, Manassas, VA).
Intranuclear injection, transfection and adenoviral infection of primary neurons and cell lines
cDNA constructs (50–100 ng/µl in 10 mM TRIS, pH 8) were injected into the nuclei of a cell line or DRG or SCG neurons 4–6 hours following cell isolation (or 12–16 h after replating for cell lines) with an Eppendorf (Brinkmann Instruments, Westbury, NY, USA) FemtoJet microinjector and 5171 micromanipulator (Ikeda, 2004). Cells were co-injected with dsRED2nuc (5 ng/µl)(Clontech) to allow identification of successfully injected cells. Cell lines were transfected with the above constructs (1µg/3wells) using either ExGen500 (Fermentas, Glen Burnie, MD, USA) as per the product instructions, or deacylated PEI (Thomas et al. 2005) at a 5:1 nitrogen to phosphate ratio.
DRG, SCG, nodose, cortical and hippocampal neurons were infected 6–12 h following isolation by adding 1–5 × 10⁶ infectious units (diluted in MEM) of recombinant adenoviruses to each 35 mm dish followed by replacement of the culture medium after 12–24 h. Mammalian cell lines were infected 12–16 h following plating by adding 2 × 10⁶ infectious units (diluted in MEM) of recombinant adenoviruses to each well of a 24 well plate followed by replacement of the culture medium after 12–24 h.
Results
Cloning of the 5’ UTR of the Scn10a gene by rapid amplification of cDNA ends revealed an upstream exon and alternative splicing
Identification and cloning of the upstream regulatory region of the Scn10a gene required knowledge of the 5’ end of the transcript, i.e. the transcription start site (TSS), since the most likely location of promoter elements will be in the vicinity of the TSS. The 5’rapid amplification of cDNA ends (RACE) was performed because very little starting material is required in comparison to RNase protection and primer extension. Also, the presence of additional exons yielding 5’UTR sequence was likely given the predicted 5’UTR contained in the rat cDNA sequence X92184 (Akopian et al. 1996). Hence, we performed 5’ RACE from the 5’ coding exon established by Souslova et al. (1997) on DRG total RNA. Figure 1A shows a summary of four distinct RACE products generated using the primers listed in the methods section. The three primary primers were used in separate experiments on pooled DRG total RNA. Nested reactions were not necessary with any primer used. The 5’ends of the transcripts are denoted with the numbers +42bp, +1bp, −76bp and −122bp. The +1 site is the reference point used throughout this paper and was the longest product identified by size, but not distance, from the translational start site due to alternative splicing within the Scn10a 5’UTR as illustrated in figure 1A. Alternative splicing to a donor site within the first exon was observed in the two RACE products with upstream initiation sites (−122bp and −76bp). Approximately 200bp (shown in red in fig1A) was removed from noncoding exon 1 via splicing to an alternative donor site. The region containing the +42 initiation site was lost in this splicing event. Alignment of the RACE products with the NCBI mouse genomic database revealed a 24kb noncoding intron (see figure 1C). The splice acceptor site identified in this study was located 36bp upstream from the translational start site and agreed with the site designated by Souslova et al. (1997). The sequence summary in figure 3 includes the 5’ RACE ends (numbered green bars −122/−76/+1/+42) and illustrates the conservation between rat and mouse near the putative transcription start site cluster. The sequences of the 5’ RACE products are provided in supplemental figure 1 (Genbank ACC# DQ497422, DQ497423, DQ497424, DQ497425). The presence of multiple start sites appears consistent with the lack of either CCAAT or TATA elements in this region and resembles initiation site regions from other VGSC promoters such as hNav1.2 (Schade and Brown, 2000), the distal promoter of mNav1.5 (Shang and Dudley, 2005), hNav1.5 (Yang et al. 2004), human and mouse Nav1.6 (Drews et al. 2005), and rNav1.4 (Kraner et al. 1998).
Figure 1.
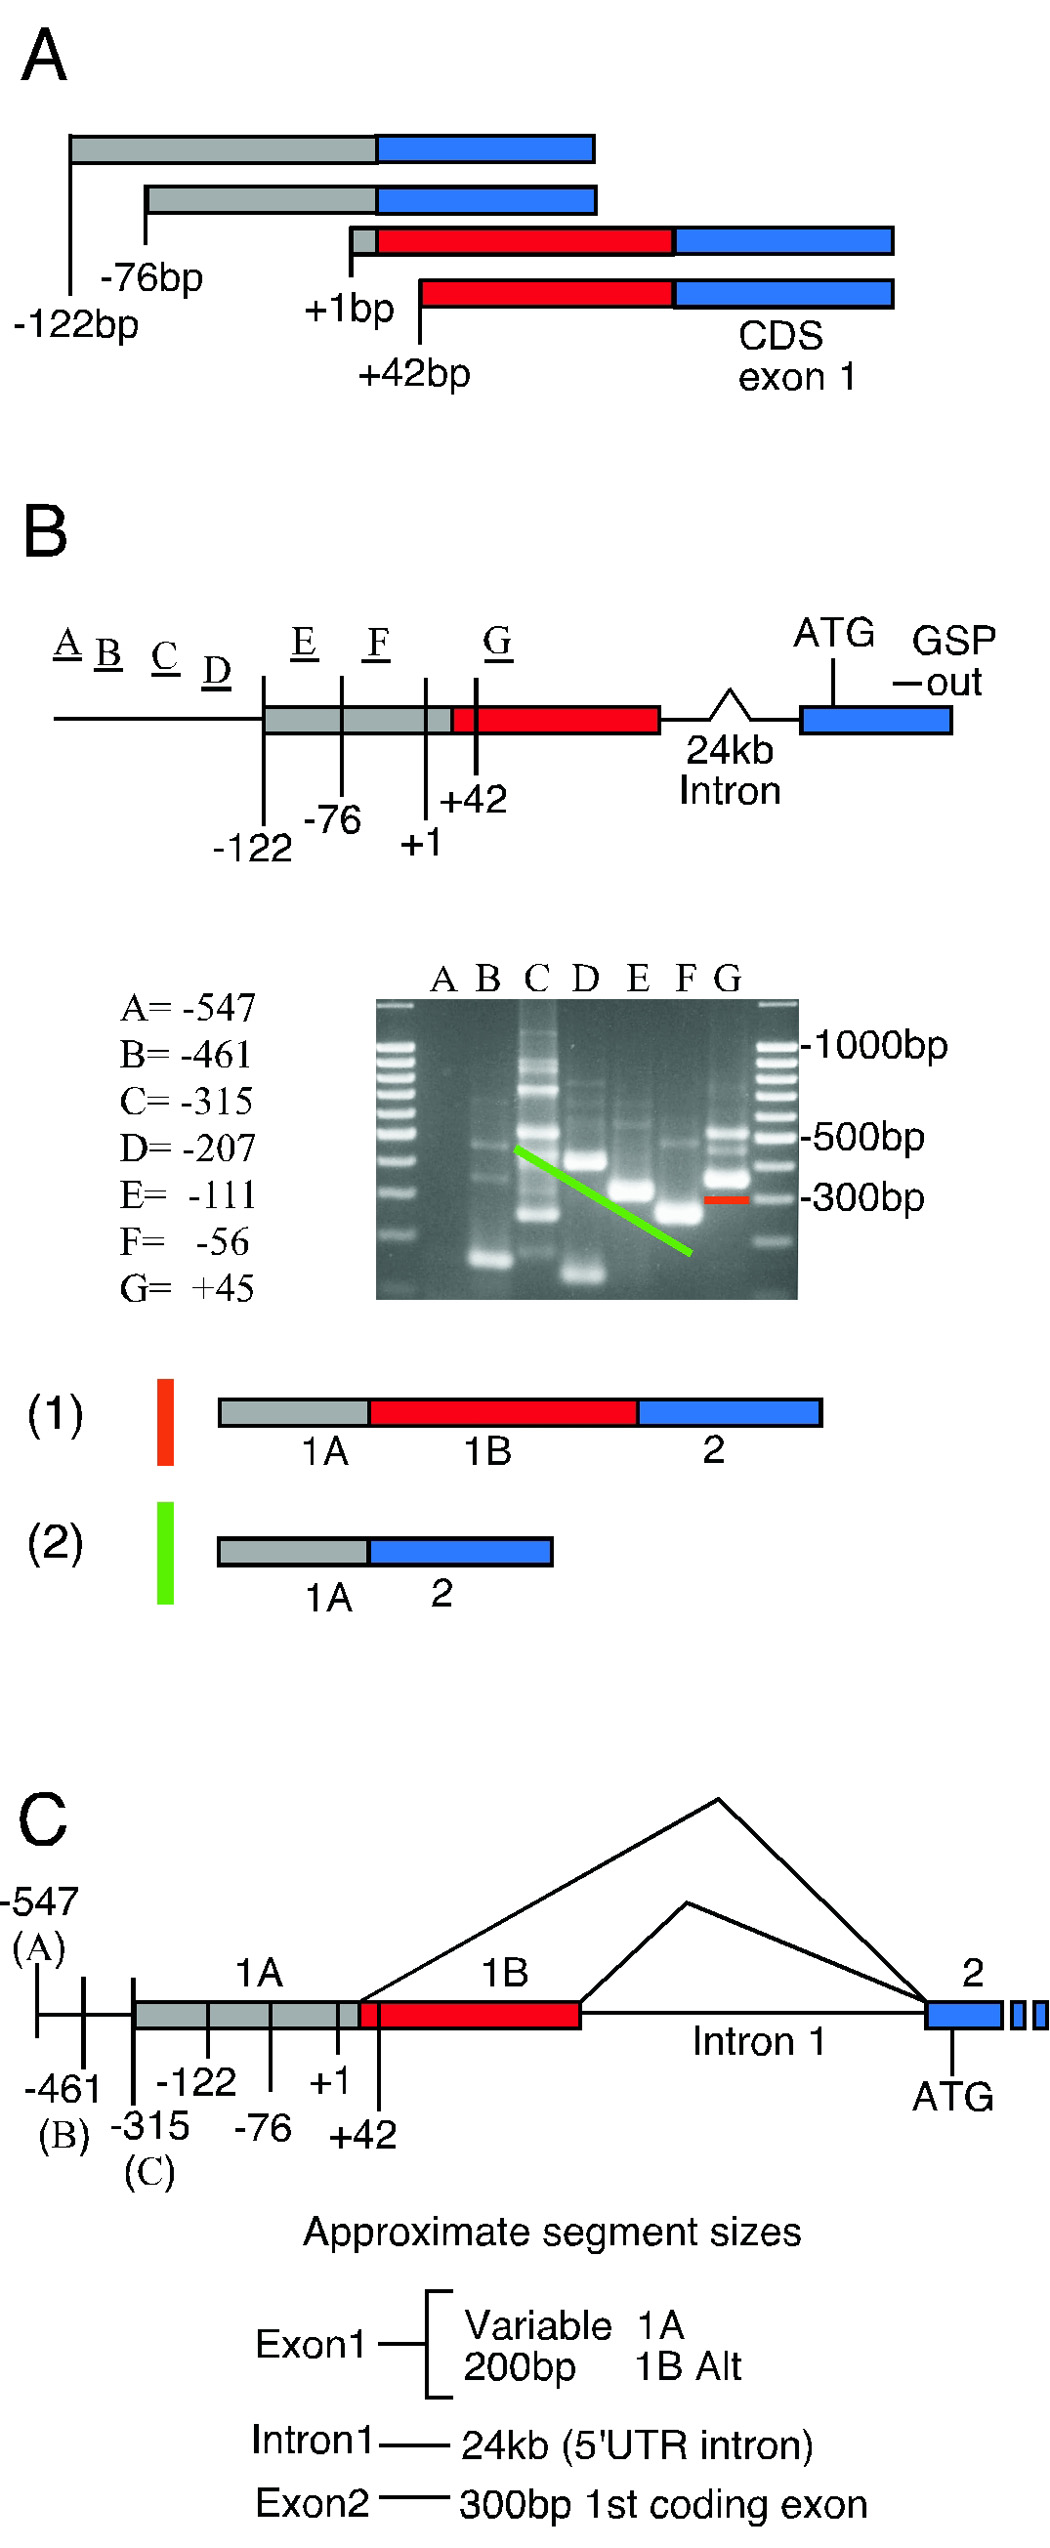
5’RACE and RT-PCR predict an upstream exon and alternative splicing in the 5’UTR of the Scn10a transcript. Panel A illustrates the four 5’UTR structures obtained with 5’RACE. The gray bar represents the outermost transcribed segment with three of four transcription start sites (numbered −122bp, −76bp, and +1bp). The red bar represents an alternatively spliced portion (~200bp) of exon 1 and contains the +42 start site. The blue bar represents the first exon containing coding sequence. Panel B shows the primer positions used for RT-PCR verification of transcript ends. The presence of the 5’UTR intron (24kb) is also indicated. The GSP out primer anchors approximately 190bp inside the first coding exon. Other primers are listed based on relative position to the +1 transcription start site. Sequences of primers used are listed in the materials and methods and can be found in figure 3 also. A representative gel image shows the complex banding pattern obtained from RT-PCR with mouse DRG RNA. The orange and green lines indicate the fragments producing the structures at the bottom (i.e. structure 1 is predicted to migrate above the orange bar on the gel, while structure 2 would migrate above the green bar based on size). Panel C summarizes the predicted genomic organization and segment sizes of the 5’ end of the mouse Scn10a gene based on 5’RACE and RT-PCR. The variable segment 1A depends on transcription start site selection and may extend beyond −315bp based on RT-PCR results.
Figure 3.
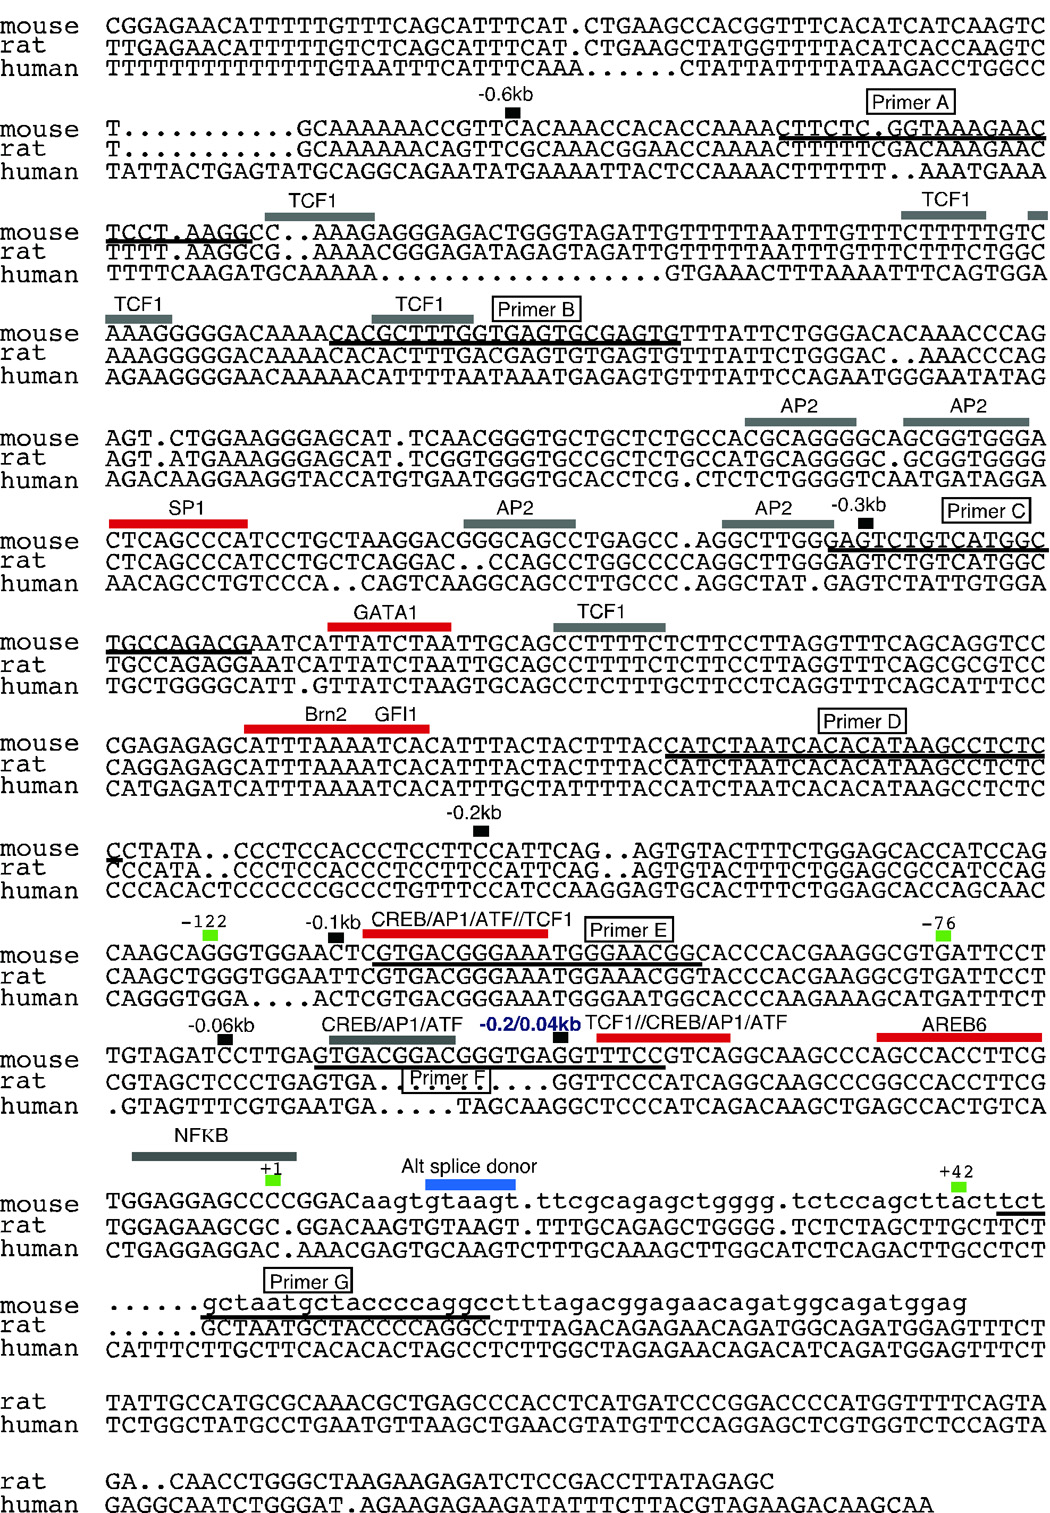
Sequence alignment of the proximal Scn10a promoter shows homology between mouse, rat and human orthologs. Sequences were assigned and aligned as described in the materials and methods. Well-conserved (red bars) and partially conserved (gray bars) transcription factor binding sites are indicated. Primer positions used for the RT-PCR experiments in figure 1 are underlined and labeled (boxes). The blue bar indicates the alternative splice donor site from figure 1a and 5’RACE predicted transcription start sites are noted with small green bars. The small numbered black bars indicate the positions of the deletion construct 5’ ends. The lower case sequence in the mouse segment (+7 on) is sequence not included in the reporter constructs. (NOTE: This sequence is continued in supplemental figure 2)
RT-PCR analysis confirmed the 5’RACE assigned transcript end region and supported alternative splicing in the 5’UTR
The assignment of the transcript ends and potential 5’UTR splicing was tested using an RT-0050CR primer walk from beyond the 5’RACE derived transcription start sites and across the intronic junction. The RT-PCR primer strategy is illustrated in figure 1B. The primers −547(A), −461(B), −316(C), −205(D), −111(E), and −56(F) were used to confirm the transcript end by walking out from the RACE assigned transcription start sites (−122, −76, +1 and +42). The primer at position +45(G) was designed to anchor to the alternate end of exon 1 predicted by 5’RACE. Primer positions are indicated in figure 3 except for the primer anchoring within the first coding exon. This primer was designed to amplify approximately 190bp of the exon shown in blue in figure 1A. Figure 1B shows a representative gel image of one RT-PCR experiment using the A through G set and structures identified by subcloning of the dominant bands. RT-PCR amplification produced predictable bands in reactions containing the C, D, E, F and G primers based on our results from the 5’RACE experiment. Cloned fragment from reactions C, D and F corresponding to the size of the major band (above the green bar) produced a sequence consistent with structure (2) in figure 1B. This structure includes the same splicing pattern as the −76 and −122 RACE products. Several fragments were cloned from reaction C however only the product mentioned above was specific to the Scn10a transcript. A faint band in lane B indicated the potential for additional transcript extension however we were unable to confirm this by cloning. These results with primers A through F support the approximate location of the transcript end region derived from the 5’RACE results. However, these data may suggest the presence of a population of longer transcripts (100–140 bases) than predicted by 5’ RACE or that the SMART 5’ RACE methodology results in truncated products as full length or capped mRNA is not selected for.
Primer G was designed to detect the alternative splicing found with the +1 and +42 RACE products. Lane G of the gel image in figure 1B shows multiple bands from the mouse DRG cDNA with a major product at about 350bp (above the orange bar). The transition above the green line in lanes C–F is interrupted between primers F and G because primer G is anchored in the alternatively spliced region and reveals only the pattern including this piece. Sequencing of fragments of sizes corresponding to the major bands in lanes F (green bar) and G (orange bar) agree with this assignment and correspond to structures (2) and (1) in figure 1B, respectively. Faint bands in lanes from primers D through F may correspond to the continued elongation of the same spliced species as generated with primer G (i.e. retention of fragment 1B of figure 1B), although these fragment were not cloned for verification. Interestingly, the rat cDNA sequence in Genbank entry X92184 is very similar to mouse structure (1) and is therefore consistent with the splicing observed in the +1 and +42 5’RACE products. Figure 1C summarizes the genomic organization of the 5’ end of the Scn10a gene with the exon and intron structures and approximate sizes indicated.
Supplemental figure 1 contains more details on these structures including the sequences of the +1 and −122 5’RACE product clones from which the 5’UTR structures were derived. Alternative splicing in the 5’UTR of the Scn10a gene had the effect of shuttling a number of upstream AUG and stop elements into the 5’UTR (also shown in supplemental figure 1). Inclusion of additional upstream AUG triplets can cause aberrant translational initiation (Kozak, 1984) and has been shown to negatively affect translational efficacy (Ren and Stiles, 1994). We made no attempt to quantify the abundance of these spliced fragments and the complexity of the gel image in figure 1B indicates the presence of additional splicing. Based on the above results we have assigned the approximate end of the Scn10a transcript. The additional splicing is under investigation and a detailed analysis of splicing is off topic for the aim of the current experiment, as our primary goal was to identify the transcription start sites from which we could anchor our walk into the 5’flanking region of the gene.
Cloning of the 5’ flanking region of the Scn10a gene
Having identified the putative end of the Scn10a transcript, we proceeded to clone genomic DNA upstream from this region in an attempt to find the elements conferring the tightly regulated tissue specificity of Nav1.8 expression. The genomic region flanking the 5’ end of the Scn10a transcript was amplified from mouse genomic DNA by LM-PCR. Two rounds of genome walking produced a 2.5 and 1.7kb fragment, respectively, including a 200bp overlap between products. The cumulative product of approximately 4.0kb was BLASTed against both the NCBI and Celera mouse genome databases and found to align between the Scn11a and Scn10a genes as illustrated in figure 2. The figure shows a 400kb segment of mouse chromosome 9 with the exons of Scn11a, Scn10a and Scn5a represented by the discontinuous vertical lines beneath the labeled segments. The 4kb putative promoter for Scn10a is indicated and matches sequence approximately midway within the intergenic region between Scn11a and Scn10a in the Nav1.9 - Nav1.8 - Nav1.5 gene cluster on mouse chromosome 9 (Dib-Hajj et al. 1999a), likely the same region used in recent nociceptor specific knockout mice (Nassar et al. 2005). The BLAST results also placed the fragment contiguous with our RACE derived 5’ mRNA ends (upstream noncoding exon). The 4.0kb fragment (DQ497421) was amplified from a mouse bacterial artificial chromosome clone, obtained from Research Genetics following a PCR screen with primers directed against the first coding exon of an assembled mouse genomic clone (#Y09108). Three positive clones were obtained, screened by end sequencing and blasted against the NCBI mouse genome. The structure of the longest BAC clone is summarized in figure 2B. This clone spanned approximately 200kb of mouse chromosome 9 including the entire Scn10a gene and much of Scn11a. This BAC derived 4.0kb fragment was used for the subsequent reporter construction described below.
Figure 2.

Mouse chromosome 9 contains a cluster of three tetrodotoxin resistant sodium channel genes. Panel A illustrates a BLAST analysis of the mouse genome (NCBI) aligning the 4.0kb fragment identified by genome walking via LMPCR and amplified from a BAC clone approximately midway between Scn10a and Scn11a on mouse chromosome 9 contiguous with the predicted 5’UTR. The series of vertical lines represent alignments of the exons of sodium channels (labeled at the top) with a 400kb segment of mouse chromosome 9. The vertical line representing the 4kb portion of the Scn10a promoter is indicated with an arrow. Panel B shows a schematic of the structure of the ~200kb BAC clone indicated a BAC region in panel A and used as a PCR template to generate the 4kb promoter fragment.
Comparison of the mouse genomic flanking region with rat and human
We compared our mouse genomic data with the genomic data from rat and human in an attempt to locate regions of homology that may harbor conserved transcriptional control elements. The previously submitted full-length cDNA sequence (X92184) from the rat scn10a gene contained a 170bp portion of the upstream 5’UTR exon. This exon was used to locate the genomic regions flanking the putative transcript end of this orthologous gene via (NCBI) BLAST and (UCSC) BLAT searches. A 25kb intron was found between regions of homology representing the first and second exons in rat. The human sequence was identified by first locating the genomic region between scn11a (AF188679) and scn10a (AF117907) on 500kb of the genomic contig GAX54KREABJFW. This sequence was aligned with mouse exon 2 (exon containing the translational start) and the combined mouse exon 1 plus flanking region isolated as described above. Similar to the mouse and rat intronic structure, an intron of approximately 22kb was identified between the regions of homology. The rat and human sequences were aligned manually with the mouse genomic region through the AssemblyLIGN® program accompanying the MacVector® software. The results shown in figure 3 include only the proximal region of homology between all three orthologs. Figure 3 also indicates the putative mouse RACE derived TSS and the RACE derived alternative splice donor site within the first exon. The rat sequence continues to share considerable homology throughout the span of the 4kb mouse sequence while the human sequence loses homology and attempts to locate upstream homology were unsuccessful. The continuation of the rat to mouse alignment can be found in supplemental figure 2.
Transcription factor binding site analysis
The 4kb mouse genomic fragment was believed to be in position to contain promoter elements for the Scn10a gene. We searched the TRANSFAC 6.0 database using the program MATCH to identify putative transcription factor binding sites. The results were overwhelming, but not unexpected, given the vast array of such documented binding sites. We took advantage of our alignment between mouse, rat and human “genomic orthologs” to find conserved binding sites within the plethora of putative sites. Figure 3 indicates some of the highly conserved sites (red bars) including several overlapping CREB/ATF and ELK1 sites as well as an Sp1, AREB6, Brn2 and a GATA1. Less conserved (between mouse, rat and human) putative transcription factor-binding sites are indicated with gray bars and include many TCF-1 and AP2 elements. The entire mouse 4kb sequence was subjected to a search of variable stringency for putative tissue restrictive silencing elements including those responsible for the control of neuron expression of M4 muscarinic receptor (Mieda et al. 1997), dopamine beta hydroxylase (Ishiguro et al. 1995), Synapsin, SCG10, Nav1.2 (Schoenherr et al. 1996) and human tyrosine hydroxylase (Kim et al. 2006). The individual NRSE sequences used in the search including a consensus NRSE are shown in supplemental figure 3. Additionally, a muscle restrictive element consensus site was also included from rat Nav1.5 (SkM2)(Sheng et al. 1994). Although several very weak hits were identified, the homology was quite low and we have not yet pursued any one in particular (see supplemental data figure 2 for examples of several putative restrictive silencing elements and additional transcription factor binding sites).
The promoter for the mouse Scn10a gene contains a regulatory switch for sensory and nonsensory neuron expression in primary cultured neurons
The assignment of a gene promoter region requires recapitulation of native gene expression in a controlled environment through some type of reporter assay. In light of this necessity and lacking any cell line capable of expressing this channel natively, we chose a process of nuclear microinjection of primary DRG neurons with a series of reporter constructs created in a pEGFP-1 backbone. As a negative control, we also injected primary cultured sympathetic SCG neurons, known not to express this sodium channel (Schofield and Ikeda, 1988), with many of the same fluorescent reporter constructs. Early experiments with injection of the empty control constructs showed a clear leak in the expression of the EGFP from the pEGFP-1 backbone. The leak was obliterated with the inclusion of a synthetic transcriptional pause or termination signal just before the MCS region of the pEGFP-1 vector. The series of reporter constructs investigated by this method are illustrated in figure 4A. Their positions are shown in figure 3 and figure supp fig 2 and listed in fig 4A with respect to distance from the +1 TSS described above. Injected neurons were tracked by coinjection of a nuclear-targeted dsRED construct. Figure 4B shows some representative images of the injected primary neurons used in this study. The results are summarized in figures 5A and 5B. In figure 5A, cells were imaged using a 40x (0.6 NA) objective mounted on a Nikon TE-2000U inverted fluorescence microscope with an 8bit SPOT™ (Diagnostic Instruments Inc., MI) CCD camera. Images were collected with SPOT™ software and images were analyzed with ImageJ software. The intensity of fluorescence, based on the dynamic range of the 8bit CCD camera was used to differentiate expressing (green bars figure 5A) and non-expressing neurons. The scale of 0 to 255 was divided into thirds, with the upper two thirds considered expressing (86–255) and the lower third considered background (0–85). The percentages of expressing and non-expressing neurons from each construct are shown and indicate that all but the smallest construct (−60bp) tested expressed EGFP well in DRG neurons. It should be noted there is a moderate percentage of nonexpressing neurons with the larger fragments, which diminishes near the 0.9kb deletion and returns near the 0.2kb fragment. The nonexpressing neurons may illustrate the heterogeneous expression pattern typical of the Scn10a gene within sensory ganglia. However, there is considerable overlap in the 95% confidence intervals (CI) with these constructs and, therefore, inferring additional regulatory elements from these data would be inappropriate. Even differences between the −0.9kb construct (100% positive, with a CI of 65–100%) and its neighboring −1.1kb and −0.6kb constructs (CIs of 44–86% and 51–96%, respectively) are not significant.
Figure 5.
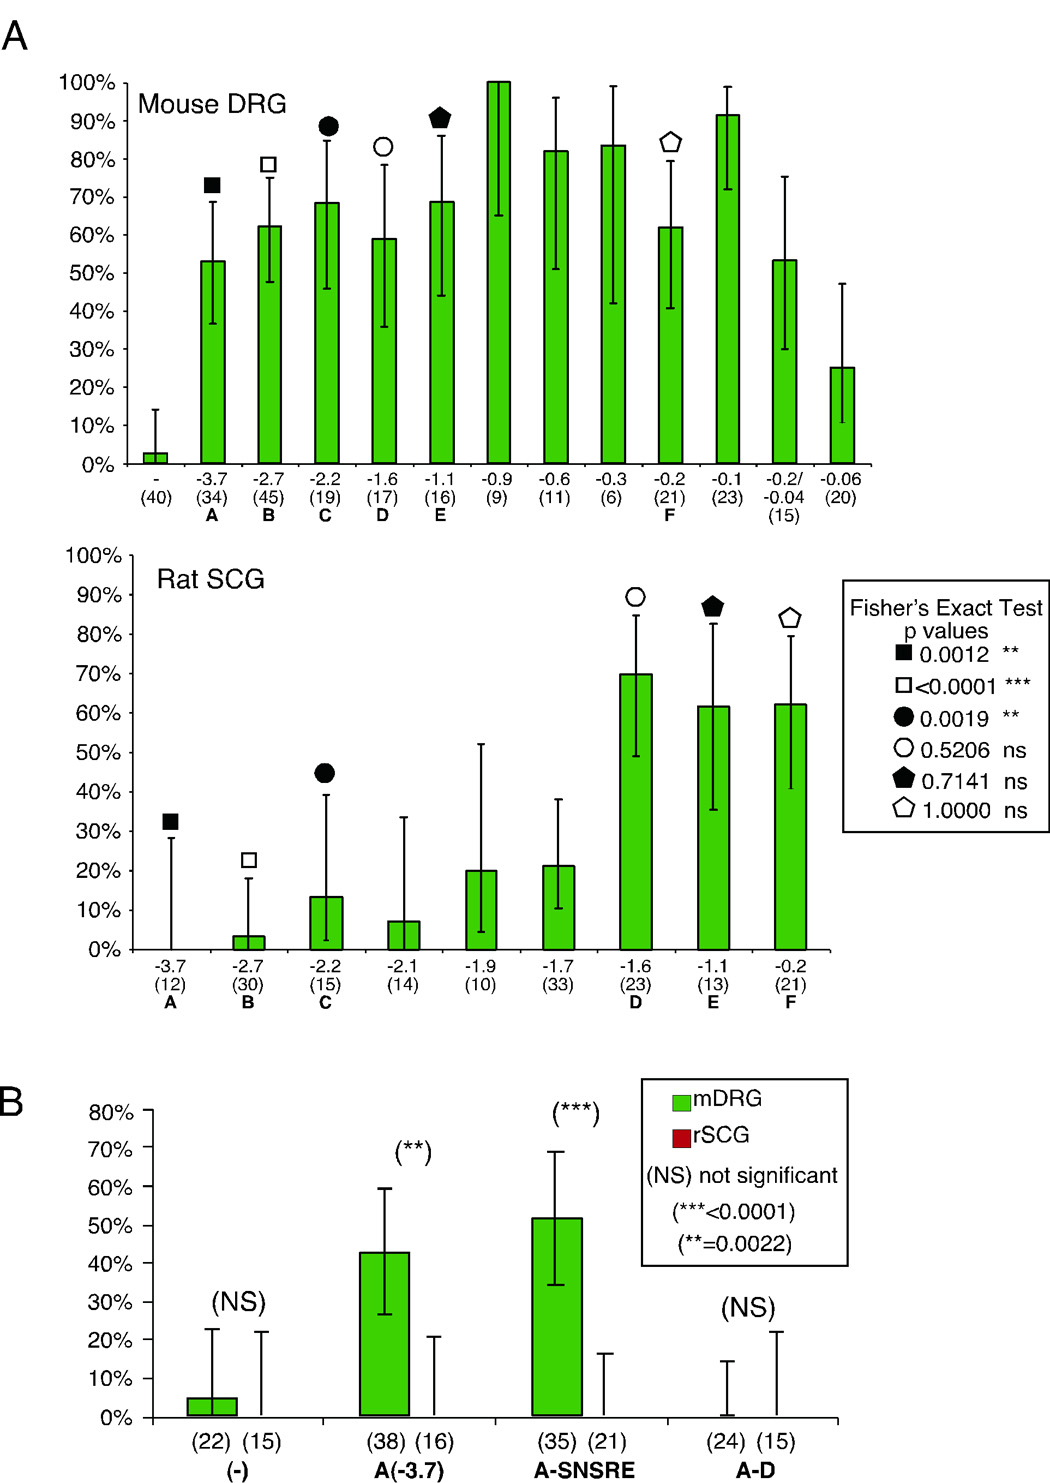
The proximal neuron specific promoter region is necessary for expression and end removal but not internal deletion of a 100bp region of the mouse Scn10a promoter relieves sensory neuron specific restricted expression. Panel A summarizes the results of the injection experiments with primary neurons and the constructs illustrated in figure 4A as the percentage of total cells (in parentheses) injected producing EGFP. EGFP expression drastically appears in the SCG plot at −1.6kb. Both SCG and DRG neurons show expression down to approximately 200bp 5’ of the +1 transcription start site (DRG neurons to 100bp). Error bars indicate 95% confidence intervals and significance was calculated between like constructs in SCG and DRG using the Fisher’s exact test via Graphpad Prism 4 software. Significance is indicated between like constructs in SCG and DRG plots by comparing bars with like symbols to the figure inset. Panel B summarizes the results of a second experiment performed as in panel A, but with the constructs A-D and A-SNSRE (figure 4A). The results with the A–D construct indicate the proximal promoter is necessary for expression and the distal promoter cannot direct expression in these neurons. Results with the A-SNSRE construct indicate that internal removal of the putative SNSRE is not sufficient to relieve repression in the sympathetic SCG neurons. Error bars indicate 95% confidence intervals and significance was calculated between like constructs in SCG and DRG as above.
In contrast to the DRG neurons, the sympathetic neurons of the SCG failed to express EGFP well in promoter fragments larger than 1.6kb upstream of the +1 TSS site (fragment labeled D). The −1.9 and −1.7kb fragments could direct some expression but only in ~20% of successfully injected SCG neurons (20% CI of 5–52% and 21% CI of 10–38%, respectively). In contrast, the −1.6kb construct expressed EGFP in about 70% (CI of 49–85%) of injected SCG neurons, approximately the same as the DRG injection results with the same construct (59% CI of 36–78%). Although the confidence interval of the −1.6kb construct in SCG (49–85%) shows some overlap with the −1.9kb interval (5–52%), the −1.7 (10–38%) and −1.6 intervals do not overlap. Also, the results from the −3.7, −2.7 and −2.2 constructs, injected into SCG, are significantly different from the same constructs in DRG neurons as determined by the Fisher’s exact test (see figure inset). The shorter constructs (−1.6, −1.1 and −0.2) lose this significance between neuronal types. This significant sharp change indicates a loss of sensory neuron specificity within 1.6kb of the putative TSS and localized a putative switch region to about 100bp between −1.7 and −1.6kb from the +1 TSS (blue line in figure 4A).
The existence of a novel sensory neuron specific repressor or enhancer within this 100bp region is an explanation for this observation, as removal of the region via end deletion allowed a broader expression pattern that appears more consistent with a specific repressor mechanism. A transcription factor search provided little insight into what may account for this switch. Low stringency searches of the mouse sequence showed a weak possibility for the presence of Neuron Restrictive Silencing Elements (NRSE) within this region as well as a stronger potential for GFI1 binding (2 sites, also indicated in figure 2 of the supplemental data). GFI1 is a repressor protein with a broad distribution (Duan and Horwitz, 2003).
In order to further assess this switch region and the distal portion of the Scn10a promoter, additional focused deletion constructs were prepared and injected into rat SCG and mouse DRG neurons. This set of experiments is presented separately as our imaging system was modified from the experiments presented in figure 5A. Cells were imaged using a 40x (0.6 NA) objective mounted on a Nikon TE-2000U inverted fluorescence microscope, a 12-bit cooled CCD camera (Orca-ER, Hamamatsu, Japan) and Volocity 4 software (Improvision Inc., Lexington, MA). Images were analyzed using ImageJ software and the cutoff used to assign expressing and nonexpressing cells was adjusted to 200 due to the greater dynamic range of this camera (0-4096). Figure 5B shows the results from injections of test and control constructs into both SCG and DRG neurons. The control constructs (−), near 0% in DRG and SCG, and −3.7(A), 42%, CI of 26–59% in DRG and 0%, CI of 0–21% in SCG, expressed as previously observed in 5A, near 0% for (−) construct in both neuron types, and 53%, CI of 37–69% in DRG and 0%, CI of 0–28% in SCG, for the (A) construct. We next tested a 3’ deletion construct (A–D) generated by removing the proximal (from the 3’ end to −1.6kb) neuron specific promoter region (see figure 4A). Figure 5B shows no expression following injection into SCG or DRG neurons, indicating that the proximal region is necessary for expression. A second construct tested the expression of an internal deletion of the 100bp region believed to contain a sensory neuron restrictive element between −1.7 and −1.6 (A-SNSRE). Figure 5B shows this construct produced no change with respect to the full promoter (−3.7) in DRG neurons (A-SNSRE=51%, CI of 34–69%; A=42%, CI of 26–59%). The same held for this construct in SCG neurons (0% expression), as there was no relief from repression by simply removing this putative switch region. Differences between the DRG and SCG neurons with this construct were determined to be significant by Fisher’s exact test. Therefore, removal of the SNSRE or switch-containing region was sufficient to relieve repression by end deletion but not via internal deletion.
This apparent contradiction between experiments in figure 5A and 5B suggests additional elements are important for the control of this promoter and additional elements capable of compensating for the end deletion identified mouse SNSRE element may be located in the vicinity. As shown in supplemental figure 2 (yellow highlight), the putative switch region is absent in rat. We have PCR amplified and cloned this sequence from rat genomic DNA and confirmed this absence (Acc# EU514790). Supplemental figure 2 also shows the presence of additional upstream NRSE-like sites in the rat and mouse sequences, bordering the switch region. The absence of the region in rat (around the mouse SNSRE) places these sequences within the same proximity as the NRSEs found in the mouse switch region. These sites may allow repression in rat and a compensatory arrangement in the internal deletion experiment summarized in figure 5B.
A mouse neuroblastoma line expresses EGFP reporter from the proximal promoter region of the Scn10a gene
Several cell lines were included in the fluorescent reporter experiment to determine the specificity of the mouse Scn10a promoter. We believed the abnormal nature of these immortal lines would reveal any weakness in the exclusivity of the putative promoter. Additionally, any reporter activity in cell lines with shorter deletion fragments could allow for cell line based assays, such as luciferase assays, to investigate promoter control. The cell lines shown in figure 4B include the mouse neurobastoma line N1E115 and the non-neuronal lines MCF7 and HeLa. We also included HEK293 and the human neuroblastoma SK-N-SH line (data not shown) in the testing of several of the constructs listed. All non-neuronal and SK-N-SH lines were negative for the constructs tested. Positive control transfections with pEGFP-N1 were successful and similar to the positive control shown to the left of the N1E row of images. Interestingly, the PEI mediated transfection of the N1E115 line with the indicated series of constructs produced some expression not seen in the other lines tested. Expression was observed with reporter constructs that recapitulated the pattern obtained by injection of SCG neurons. The similarity between the N1E115 and SCG cells was modest, since despite transfection efficiencies of N1E115 cells of only 30–50% under our experimental conditions (using PEI and as shown in the control panels to the left in figure 4B), the percentage of transfected N1E115 cells expressing from constructs within 1.6kb of the +1 TSS were not on the order of the 70% of −1.6kb construct injected SCG neurons producing visible reporter gene product. Regardless, constructs within 1.6kb of the assigned TSS produced the marked appearance of EGFP in SCG neurons and N1E115 cells, indicating the −1.6kb region had lost its sensory neuron selectivity and yet failed to express in all non-neuronal cell lines (or SK-N-SH cells). The loss of sensory neuron specificity with a retention of neuron specificity was observed in constructs containing just 200bp of 5’ flanking DNA (construct F).
Adenoviral infection of primary neurons and control cell lines with a dual reporter construct shows native tissue specificity of the mouse Scn10a promoter
Adenoviral delivery of reporter constructs to central, sympathetic and sensory neurons was used to corroborate results obtained with the microinjection experiments noted above. Infection of cell lines and non-expressing primary neurons served as negative controls for the delivery process. Viral delivery was monitored by a dual reporter adenoviral construct, shown in figure 6, including an independent CMV driven nuclear-targeted dsRED control cassette along with the EGFP cassette driven by an Scn10a promoter fragment. The fragment used to drive the sensory neuron expression of EGFP was the −2.7kb fragment labeled “B” in figure 4A. Infection was monitored by the detection of nuclear dsRED expression by epifluorescence. Representative images are shown in figure 6. EGFP expression was visible only in neurons from the sensory nodose and dorsal root ganglia. No EGFP expression was observed in neuronal preps from the cerebral cortex or hippocampus. Cell lines including HeLa, SK-N-SH and N1E115 were also infected to test for the ectopic expression of EGFP from the Scn10a driven cassette. While some very weak expression was observed in the N1E115 line (see supplemental figure 4), all other lines failed to produce detectable EGFP indicating a lack of transcriptional activity in these lines.
Figure 6.
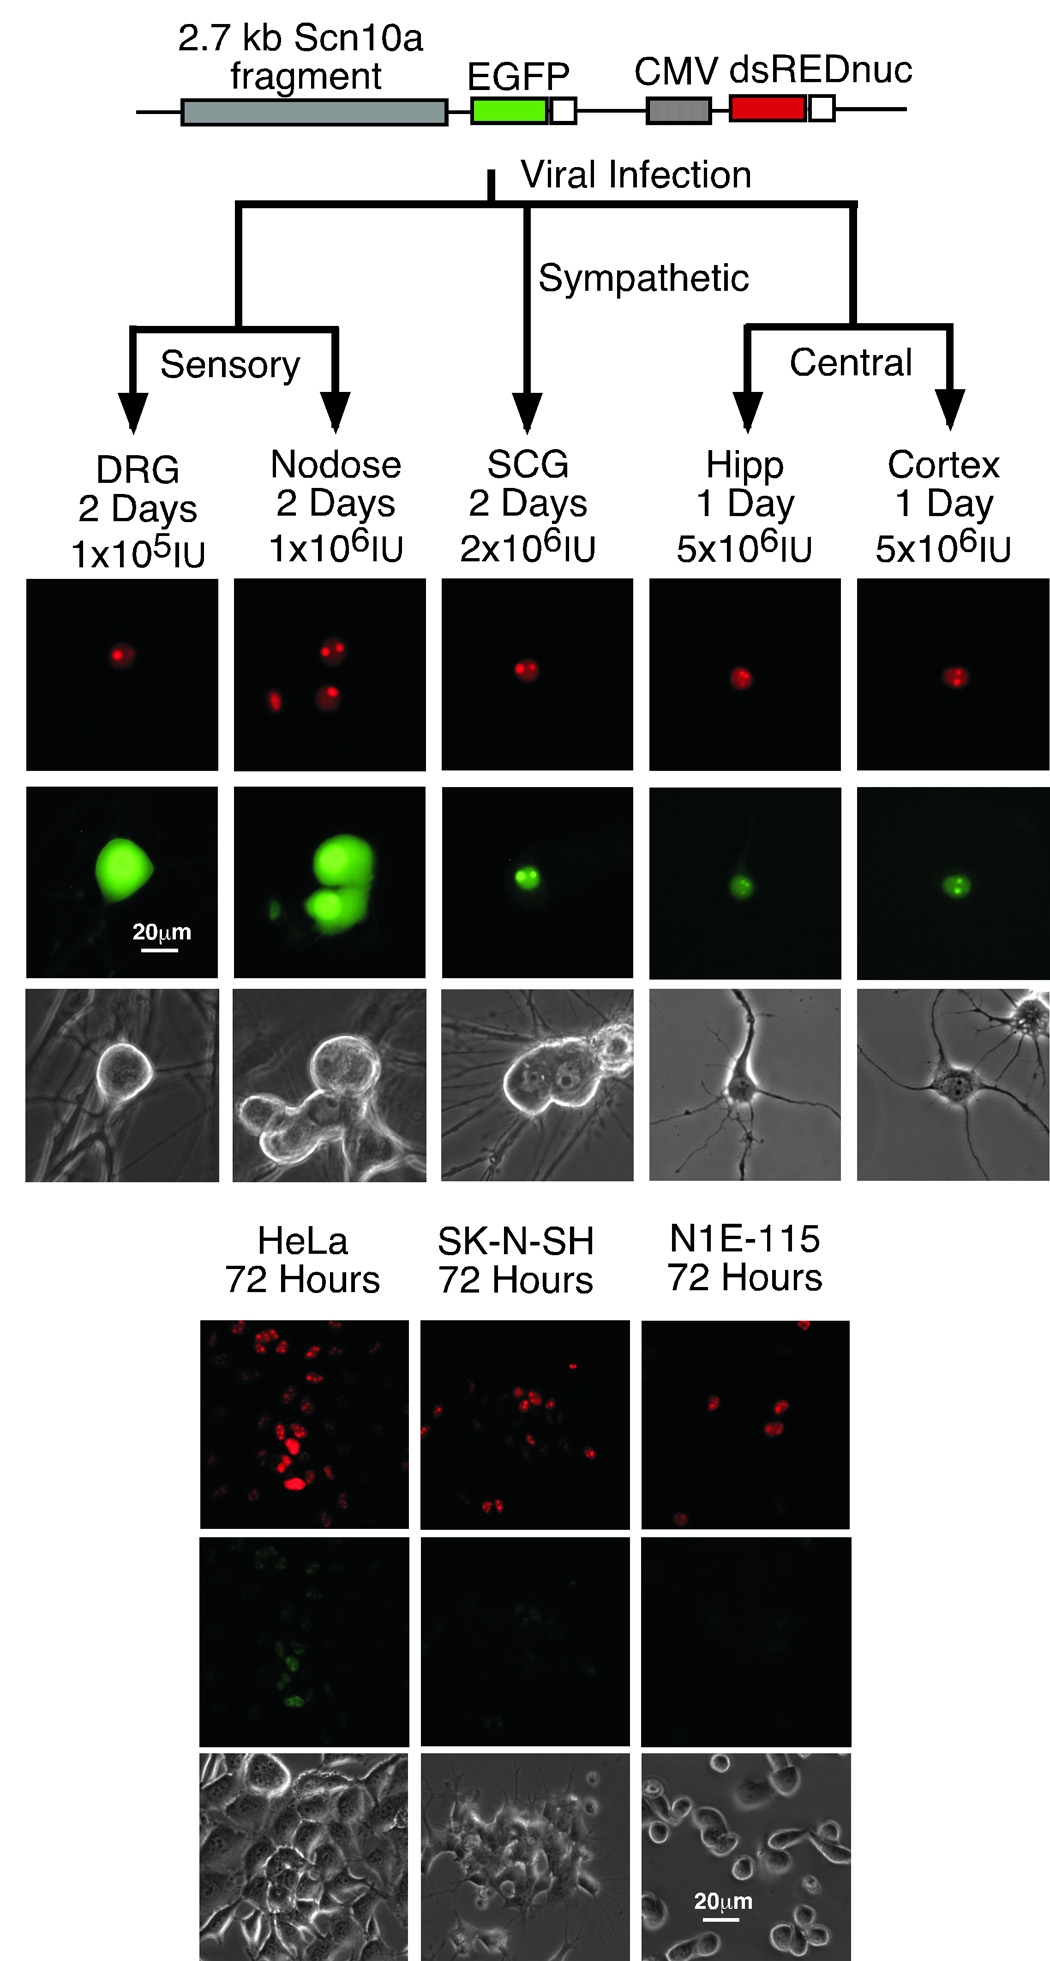
Adenoviral infection of primary neurons and cell lines with a dual reporter construct confirmed sensory neuron specificity. Panel A shows representative images of an Scn10a promoter reporter cassette using the −2.7kb fragment (“B” in figure 4) drove EGFP expression in sensory nodose and DRG neurons but not in sympathetic SCG or central hippocampal or cortical neurons (shown in green). Bright field images are included for reference. The second cassette (CMV-dsREDnuc) was added to ensure infection was successful (shown in red). Panel B shows a series of cell lines 72 hours post infection with the dual cassette construct. Although some bleedover of signal from the dsRED into the green channel was observed in all infections (nuclear retained), expression of EGFP appeared restricted.
It should be noted that, while the N1E115 line did corroborate the fluorescent protein reporter expression patterns of the SCG neurons tested in the injection and transfection experiments (figure 4 and figure 5A), this cell line did not completely reproduce the SCG neuron results or other control samples following adenoviral infection (figure 6). We did see a number of green cells in the infected N1E115 dishes (or transfection with the adenoviral shuttle vector: supplementary figure 4) indicating some leak of the promoter in these cells from the −2.7kb containing adenoviral reporter. In agreement with the N1E115 adenoviral infection results, some green cells did appear in the SCG EGFP injection experiments with the −2.7kb fragment (the images shown are representative; see green bar percentages in figure 5A), and as noted, the numbers increased dramatically following end deletion of what we have assigned as the SNSRE in SCG neurons and N1E115 cells in EGFP reporter experiments.
Discussion
The Scn10a gene product, Nav1.8, is expressed in small and medium diameter nociceptive neurons (Akopian et al. 1996, Djouhri et al. 2003) and participates in normal nociception by contributing to the electrogenesis of action potentials within these select neurons (Renganathan et al. 2001). Changes in expression levels occur under certain disease and chronic pain states, e.g. Scn10a gene expression is upregulated in chronic inflammation (Black et al. 2004) and in human multiple sclerosis and a mouse model of demylenating disease (Black et al. 2000). In contrast, Scn10a gene expression is attenuated in experimental models of nerve injury such as chronic constriction (Dib-Hajj et al. 1999b; Okuse et al. 1997), axotomy (Dib-Hajj et al. 1996; Sleeper et al. 2000), or disease related injury such as diabetic neuropathy (Craner et al. 2002). Despite recent studies showing near normal neuropathic pain levels following disruption of both Nav1.7 and Nav1.8 expression (Nassar et al. 2005), knockdown experiments support a role for Nav1.8 in both neuropathic (Lai et al. 2002) and inflammatory nociception (Porreca et al. 1999), while other knockout experiments support a role in mechanical and/or inflammatory nociception (Akopian et al. 1999; Laird et al. 2002; Roza et al. 2003). Also, a selective Nav1.8 channel blocker has recently been shown to reduce both neuropathic and inflammatory pain in a rat model (Jarvis et al. 2007). The present study has functionally identified the exquisitely specific promoter of the Scn10a gene. In order to examine or assign such a tissue specific promoter an environment capable of producing native expression was required. However, in the case of the Scn10a gene promoter, an expressing cell line is unavailable. Hence, nuclear microinjection of an extensive series of reporter constructs into primary neurons was used to identify a potentially novel distal regulatory element termed “SNSRE” and a proximal neuron specific promoter. An additional test of specificity using a large reporter construct and adenoviral delivery supported to the location of the tissue specific promoter and may represent a way to efficiently label nociceptive neurons in culture.
While identifying the 5’ end of the Scn10a transcript, we found a number of alternate donor sites within the first exon, as well as the incorporation of an additional exon, from within the first intron, between exons 1 and 2 (the first coding exon). Although there are examples of alternative splicing within the coding regions of VGSC alpha subunit genes (Sarao et al. 1991; Gustafson et al. 1993; Belcher et al. 1995; Plummer et al. 1997; Oh and Waxman 1998; Dib-Hajj et al. 2002; Kerr et al. 2004; Raymond et al. 2004), the splicing observed for Scn10a appears unique, since we were unable to find documented examples of splicing in the 5’UTRs of other VGSC genes. Interestingly, other sodium channel genes such as Scn8a (Drews et al. 2005) and Scn5a (Shang et al. 2005) appear to use a different mechanism, i.e. alternate initiation, sometimes through different promoters, to yield diversity via alternate 5’ UTR exons. Scn11a may share this feature as well, since a comparison of 5’UTR sequences from mouse Scn11a shows the presence of alternate upstream exons separated by approximately 1.7kb (AB031389 (Ogata et al. 2000) vs AF118044 (Dib-Hajj et al. 1999a and in agreement with unpublished 5’RACE results generated in our lab ACC# DQ516972, DQ516973).
Promoter sequence homology was extensive between mouse and the putative rat promoter but limited to a very proximal portion of the flanking region in what may be the human scn10a control region (fig3). This proximal region was important for reporter expression in the neurons and N1E115 cell line (fig4) and may represent an NGF sensitive module. N1E115 cells are not NGF responsive (Shiokawa and Tanuma 2004), however we are currently investigating the effect of NGF on this proximal region with additional lines such as PC-12, as it contains potential transcription factor-binding sites including conserved CREB and Elk1 binding sites that can be important for the control of gene expression by NGF (Xing et al. 1998; Groot et al. 2000). Although Scn10a expression may not require NGF, proper Scn10a expression does require a precise balance of NGF levels similar to other NGF sensitive genes including Scn2a (Mandel et al. 1988) and Scn9a (D’Arcangelo et al. 1993). In fact, NGF and GDNF can correct changes in Nav1.8 expression caused by neuropathic events (Black et al. 1997; Dib-Hajj et al. 1998; Boucher et al. 2000; Cummins et al. 2000). TRPV1 transcription is sensitive to NGF and although widely expressed, overlaps with Nav1.8 expression (Amaya et al. 2004; Hong and Wiley 2005). In contrast to Scn10a, however, the TRPV1 gene was recently shown to contain dual NGF sensitive promoters (Xue et al. 2007) both lacking CREB binding sites yet containing GC rich Sp1 binding elements. Whether there are similarities with promoters of other neurotrophic sensitive genes with overlapping expression patterns, such as Scn11a (Cummins et al. 2000), will be interesting.
Based on our injection studies of primary neurons shown in figure 4 and figure 5, we believe the sensory neuron specific switch region or “SNSRE” contains a repressive element. Our most striking finding was that a 100bp region eliminated much of the expression at all but the most specific locations in our end deletion experiments summarized in figure 5A. A simple mechanism involving a tissue specific enhancer would not exhibit enhanced general neuron expression upon its removal from the promoter. The presence of NRSE like repression was considered here since functional and putative sites were found in the regulatory regions of the rat Scn2a gene (Kraner et al. 1992), the rat Scn5a gene (Sheng et al. 1994) and mouse and human Scn8a (Drews et al. 2005, 2007). Also the proximity, as illustrated in figure 2, of Scn10a to other sodium channel genes like Scn5a and the sensory neuron specific Scn11a, could lead one to hypothesize the presence of a locus control region (Lunyak et al. 2002). The lack of strong sequence support for a known element in our gene control region disputes this possibility, however the presence of several elements of weak homology is encouraging. Three putative sites were identified in or near the SNSRE (see supplemental data figure 2) the best bearing weak homology with a DNRE sequence identified in the dopamine beta hydroxylase gene that appeared to bind REST (Ishiguro et al. 1995). This SNSRE also contained two putative binding sites for the repressor protein Gfi1 involved in hematopoiesis (Doan et al. 2004). The possibility also remains that a very unique element may confer the novel function (i.e. the strong tissue specificity) found in the SNSRE and therefore eluded our canonical sequence analysis.
The presence of additional and important elements beyond the 100bp SNSRE is likely since removal of this SNSRE or switch-containing region was sufficient to relieve repression by end deletion but not via internal deletion. This apparent contradiction between experiments in figure 5A and 5B suggests additional elements are important for the control of this promoter and these elements are capable of compensating for the loss of the 100bp SNSRE element when internally deleted. Interestingly, there is an absence of homology between mouse genomic DNA and rat genomic DNA in this region. Most strikingly, and as shown in supplemental figure 2, the putative 100bp switch region is absent in rat. We have confirmed this by sequencing the putative promoter region from rat genomic DNA (Acc# EU514790). However, the presence of additional upstream NRSE-like sites in the rat sequence, bordering the switch region, places these sequences within the same proximity as the putative NRSEs found in the mouse switch region. Therefore complete removal may relieve repression, as all functional repressive sites are removed, however, internal deletion may remove one or two of several, and additional upstream elements will continue to repress expression. These results suggest the functional repressive module is larger than the 100bp SNSRE and, while it is sufficient to repress expression in our system, it may not be the only region necessary to do so. Additional deletion experiments will be needed to further investigate this important and complex region in both mouse and rat genes.
Adenoviral infection of a variety of cell types, shown in figure 6, confirmed the presence of tissue specificity of the −2.7kb portion of the Scn10a promoter. Expression in infected DRG and nodose neurons with no expression in infected SCG or central neurons and most cell lines support the previous finding obtained via injection and transfection. The anomalous expression (or leak) from the adenoviral construct in N1E115 cells (see results and supplemental figure 4), or any of the longer constructs in the SCG injection experiments, could be due to a lack of proper context of this promoter fragment. For example, the −2.7kb fragment used in these studies may not contain all elements necessary to produce complete restriction of expression of these reporters, either through removal (deletion of −3.7 to −2.7kb), or lack of additional elements beyond even the intact 4kb region. In the N1E115 line this leak could be amplified due to constitutively active signaling cascades in these cells. Lack of necessary elements outside the 4kb promoter fragment studied here could also account for anomalous expression with any of the longer constructs in the SCG injection experiments summarized in figure 5A. Hence, we cannot rule out the possibility of elements further upstream or downstream participating in the exquisite control of the intact and endogenous Scn10a promoter.
Since this is a unique example of the cloning of such a restricted promoter, there is little for direct comparison. Dividing the promoter into regulatory “modules”, allows for the comparison of the Scn10a promoter to characterized promoters including some from the VGSC family. The “module” concept (see Voss et al. 1986) is the basis for many attempts to find tissue specific genes via sequence analysis (i.e. Thompson et al. 2004), and based on our results, it is possible that the Scn10a gene regulatory region contains a bipartite structure with a proximal neuron specific module and an upstream (−1.7 to −1.6kb) sensory neuron specific “SNSRE” module. Comparing these Scn10a regions to those characterized for other genes one can envision a building block mechanism yielding exquisite specificity. One example of a proximal neuron specific promoter is the TATA-less 5HT3 promoter (Bedford et al. 1998). Neuronal specific 5HT3 expression was directed by a 600bp “module” upstream from the transcription start site, containing enhancer-binding elements including Sp1 and NF1 sites. Specificity was provided by a neuron specific factor binding to the common NF1 binding site, and no NRSE was found. Such a neuron specific region may be the expression backbone of the Scn10a gene with the addition of a restrictive “module” that we termed the SNSRE region providing further exclusivity, perhaps as the µ opioid receptor promoter utilizes an NRSE to specify the subtype of neuron in which the gene will express (Kim et al. 2004).
A comparison of the Scn10a gene to other VGSC genes is possible using this modular approach. For example, the mouse Scn5a gene contains multiple promoters, each proposed to have a clustering of common and tissue specific binding sites adopting a modular structure with positive and negative elements (Shang et al. 2005). The structure of the human Scn2a promoter (Lu et al. 1999;Schade and Brown, 2000) is proposed to contain a proximal neuron specific module with both constitutive and inducible transcription factor-binding sites including CRE, GRE, AP1 and POU sites. No additional upstream NRSE site is proposed as is found in the rat promoter (Maue et al. 1990), in fact, unlike the human ortholog, the rat proximal promoter appears to be rather nonspecific and requires the participation of a module of several upstream repressive elements including an NRSE to achieve neuron specificity (Maue et al. 1990; Kraner et al. 1992). Hence, considering our results, perhaps mouse Scn10a and rat Scn2a are comparable. Rat Scn4a, in contrast, contains a proximal constitutive promoter and both upstream and downstream muscle specific modules that must cooperate to achieve true specificity (Kraner et al. 1998, 1999). Finally, the tissue specific gene promoter for the NAG channel (Poiraud et al.1999) is somewhat similar to the Scn10a promoter. Although the NAG gene product has a broader tissue distribution, including heart, lung and adrenal medulla, as well as CNS and PNS neurons, the NAG gene regulatory region, like that of Scn10a, has a proximal or minimal neuron specific promoter composed of common cis but no TATA elements. Unlike Scn10a this region contains a portion of the first exon. Additionally, an endogenous expression profile required approximately 6.5kb of 5’ flanking DNA and the first exon and different distal regions or modules produced enhanced specificity in the lungs or within subtypes of neurons. In fact, and perhaps like Scn10a, enhanced neuronal specificity was dependent on a distal NRSE-like element that functioned but not via REST. Taken together one can envision the evolution of a higher order control region to direct further specificity via combinations of modular gene regulatory structures such as the examples mentioned above.
Nociceptors represent one functional subset of neurons found in peripheral sensory ganglia. These ganglia contain the soma of a heterogeneous population of cells with respect to size and function and one does not predict the other. Nociceptors are likely limited to some small and intermediate size cells from which C and Aδ fibers project (see Julius and Basbaum 2001). Markers used to identify functional subsets of sensory neurons (e.g. c-ret (IB4) and TrkA) are very useful but do not completely correlate with Nav1.8 expressing nociceptors (Benn et al. 2001 and Fang et al. 2005). It is possible from our results that the reporter constructs used in this study may provide a way to detect the population of live neurons expressing Nav1.8 within, or acutely dissociated from, these complex ganglia. We hope that with additional confirmation of the coexpression of Nav1.8 with our reporter, we will facilitate the functional characterization of that subset. Future experiments will test this possibility and may validate the potential use of these constructs in the production of transgenic animals.
In conclusion we have located the gene regulatory region of the mouse Scn10a gene encoding the Nav1.8 alpha subunit of the VGSC family that contains the information to confer tissue specific expression in primary cultures of sensory neurons. The region contains a proximal basal neuron specific promoter module as well as a distal sensory neuron restrictive module that limits expression to a subset of neurons within sensory ganglia. The basal promoter contains significant homology with rat and to a lesser extent human DNA from the same genomic area. We noted the presence of multiple conserved putative transcription factor binding sites that may participate in the neuron specific expression and may account for the sensitivity of this gene to NGF. We have observed alternative splicing in the 5’UTR of the transcript that could potentially influence expression at the translational level. The identification of a gene regulatory region from such a tightly regulated gene encoding such a physiologically important gene product makes this characterization unique and could facilitate the identification of nociceptive neurons and perhaps uncover new avenues for the discovery of therapeutic targets for the treatment of chronic pain and multiple sclerosis.
Supplementary Material
SFig1: Sequences of the 5’RACE products used to determine 5’UTR structure of the Scn10a transcript. Numbers correspond to structures from figure 1B. Start (yellow) and stop (red) codons are indicated (gray are overlaps). Green ATG is translation start of the Nav1.8 protein and sequences are presented in frame with that codon. Vertical black lines indicate exon boundaries and black bars above sequence indicate transcription start sites in RACE derived sequences. Underlined sequence represents exon 1 extension in (1)(red bar in figure 1. Panel B shows a cartoon of the structures in panel A with frames of start and stop codons indicated. Numbers correspond to structures in Figure 1B and numerous upstream in frame and out of frame start codons and small open reading frames are apparent and variable due to splicing.
SFig2: Homology between rat and mouse Scn10a promoter is extensive (continuation of Figure 3 main text). Alignment of flanking regions from approximately −0.85kb to −3.7kb with respect to the mouse sequence is shown. Some putative transcription factor binding sites are noted out to about −1.1kb and a few in the SNSRE EGFP assigned region (yellow). Numbered black bars indicate the positions of deletion fragments used in the reporter experiments. Potential NRSEs are boldface and italicized. Upper case indicates homology with the NRSE listed below the site (homology is again indicated next to the site name and “m”= mouse, “r”= rat) and red bars above a site indicates a negative orientation. NRSE sites and alignments used for this comparison are listed in SuppFig3.
SFig3: Panel A: Sequences of tissue specific elements used in low stringency searches of promoter region and indicated in SFig2 (M4 muscarinic receptor (Mieda et al. 1997); dopamine beta hydroxylase (Ishiguro et al. 1995); Synapsin, SCG10, Scn2a (Schoenherr et al. 1996); human tyrosine hydroxylase (Kim et al. 2006)). A consensus NRSE from the subsequence list of MacVector® was also used. Panel B: Shows the alignment of each putative restrictive element from SFig2 with the most homologous element(s). Matching bases are shown in upper case. The Scn10a element at −2.10 matches 13/21 positions of two elements from panel A. Bold bases indicate differences in alignments between the Scn10a and the hSYN and M4 elements.
SFig4: Expression of EGFP in N1E115 cells following transfection of dual cassette viral shuttle vector. As noted in the text some weak expression of EGFP was apparent upon infection of N1E115 cells with a dual reporter construct. The transfection shown was intended to mimic infection of N1E115 cells. Cell at bottom left illustrates a leak of dsRED from nucleus and bleedover to green channel. Cell in center does not appear to leak from nucleus yet shows detectable green in cytoplasm. Cells were imaged using a 60x (1.4 NA) oil-immersion objective mounted on a Nikon TE-2000U inverted fluorescence microscope, a 12-bit cooled CCD camera (Orca-ER, Hamamatsu, Japan) and Volocity 4 software (Improvision Inc., Lexington, MA).
Acknowledgements
We are grateful to Dr. Margaret Davis for many helpful discussions, Dr. Huanmian Chen for help in preparing adenovirus and Dr. T.-C. He (Johns Hopkins University) for providing the Ad-easy system. We are grateful to Drs. Geoffrey Schofield (Tulane University Medical School, New Orleans, LA) and Ruquia Ahmed-Schofield (Xavier University, New Orleans, LA) for supplying fully deacylated PEI. Some of this work was supported by funds from the Department of Defense DAMD17-00-1-0516. This work was also supported by funds from the intramural program of the NIH, National Institute on Alcohol Abuse and Alcoholism.
References
- Akopian AN, Sivilotti L, Wood JN. A tetrodotoxin-resistant voltage-gated sodium channel expressed by sensory neurons. Nature. 1996;379:257–262. doi: 10.1038/379257a0. [DOI] [PubMed] [Google Scholar]
- Akopian AN, Souslova V, England S, Okuse K, Ogata N, Ure J, Smith A, Kerr BJ, McMahon SB, Boyce S, Hill R, Stanfa LC, Dickenson AH, Wood JN. The tetrodotoxin-resistant sodium channel SNS has a specialized function in pain pathways. Nat. Neurosci. 1999;2:541–548. doi: 10.1038/9195. [DOI] [PubMed] [Google Scholar]
- Amaya F, Shimosato G, Nagano M, Ueda M, Hashimoto S, Tanaka Y, Suzuki H, Tanaka M. NGF and GDNF differentially regulate TRPV1 expression that contributes to development of inflammatory thermal hyperalgesia. Eur. J. Neurosci. 2004;20:2303–2310. doi: 10.1111/j.1460-9568.2004.03701.x. [DOI] [PubMed] [Google Scholar]
- Baker MD, Wood JN. Involvement of Na+ channels in pain pathways. Trends Pharmacol. Sci. 2001;22:27–31. doi: 10.1016/s0165-6147(00)01585-6. [DOI] [PubMed] [Google Scholar]
- Bedford FK, Julius D, Ingraham HA. Neuronal expression of the 5HT3 serotonin receptor gene requires Nuclear Factor 1 complexes. J. Neurosci. 1998;18:6186–6194. doi: 10.1523/JNEUROSCI.18-16-06186.1998. [DOI] [PMC free article] [PubMed] [Google Scholar]
- Belcher SM, Zerillo CA, Levenson R, Ritchie JM, Howe JR. Cloning of a sodium channel alpha subunit from rabbit Schwann cells. Proc. Natl. Acad. Sci. USA. 1995;92:11034–11038. doi: 10.1073/pnas.92.24.11034. [DOI] [PMC free article] [PubMed] [Google Scholar]
- Benn SC, Costigan M, Tate S, Fitzgerald M, Woolf CJ. Developmental expression of the TTX-resistant voltage-gated sodium channels Nav1.8 (SNS) and Nav1.9 (SNS2) in primary sensory neurons. J. Neurosci. 2001;21:6077–6085. doi: 10.1523/JNEUROSCI.21-16-06077.2001. [DOI] [PMC free article] [PubMed] [Google Scholar]
- Black JA, Langworthy K, Hinson AW, Dib-Hajj SD, Waxman SG. NGF has opposing effects on Na+ channel III and SNS gene expression in spinal sensory neurons. Neuroreport. 1997;8:2331–2335. doi: 10.1097/00001756-199707070-00046. [DOI] [PubMed] [Google Scholar]
- Black JA, Dib-Hajj SD, Baker D, Newcombe J, Cuzner ML, Waxman SG. Sensory neuron-specific sodium channel SNS is abnormally expressed in the brains of mice with experimental allergic encephalomyelitis and humans with multiple sclerosis. Proc. Natl. Acad. Sci. USA. 2000;97:11598–11602. doi: 10.1073/pnas.97.21.11598. [DOI] [PMC free article] [PubMed] [Google Scholar]
- Black JA, Liu S, Tanaka M, Cummins TR, Waxman SG. Changes in the expression of tetrodotoxin-sensitive sodium channels within dorsal root ganglia neurons in inflammatory pain. Pain. 2004;108:237–247. doi: 10.1016/j.pain.2003.12.035. [DOI] [PubMed] [Google Scholar]
- Boucher TJ, Okuse K, Bennett DL, Munson JB, Wood JN, McMahon SB. Potent analgesic effects of GDNF in neuropathic pain states. Science. 2000;290:124–127. doi: 10.1126/science.290.5489.124. [DOI] [PubMed] [Google Scholar]
- Catterall WA. From ionic currents to molecular mechanisms: the structure and function of voltage-gated sodium channels. Neuron. 2000;26:13–25. doi: 10.1016/s0896-6273(00)81133-2. [DOI] [PubMed] [Google Scholar]
- Chen H, Lambert NA. Endogenous regulators of G protein signaling proteins regulate presynaptic inhibition at rat hippocampal synapses. Proc. Natl. Acad. Sci. USA. 2000;97:12810–12815. doi: 10.1073/pnas.230260397. [DOI] [PMC free article] [PubMed] [Google Scholar]
- Craner MJ, Klein JP, Renganathan M, Black JA, Waxman SG. Changes of sodium channel expression in experimental painful diabetic neuropathy. Ann. Neurol. 2002;52:786–792. doi: 10.1002/ana.10364. [DOI] [PubMed] [Google Scholar]
- Cummins TR, Black JA, Dib-Hajj SD, Waxman SG. Glial-derived neurotrophic factor upregulates expression of functional SNS and NaN sodium channels and their currents in axotomized dorsal root ganglion neurons. J. Neurosci. 2000;20:8754–8761. doi: 10.1523/JNEUROSCI.20-23-08754.2000. [DOI] [PMC free article] [PubMed] [Google Scholar]
- D’Arcangelo G, Paradiso K, Shepherd D, Brehm P, Halegoua S, Mandel G. Neuronal growth factor regulation of two different sodium channel types through distinct signal transduction pathways. J. Cell Biol. 1993;122:915–921. doi: 10.1083/jcb.122.4.915. [DOI] [PMC free article] [PubMed] [Google Scholar]
- Dib-Hajj SD, Black JA, Felts P, Waxman SG. Down-regulation of transcripts for Na channel alpha-SNS in spinal sensory neurons following axotomy. Proc. Natl. Acad. Sci. USA. 1996;93:14950–14954. doi: 10.1073/pnas.93.25.14950. [DOI] [PMC free article] [PubMed] [Google Scholar]
- Dib-Hajj SD, Black JA, Cummins TR, Kenney AM, Kocsis JD, Waxman SG. Rescue of alpha-SNS sodium channel expression in small dorsal root ganglion neurons after axotomy by nerve growth factor in vivo. J. Neurophysiol. 1998;79:2668–2676. doi: 10.1152/jn.1998.79.5.2668. [DOI] [PubMed] [Google Scholar]
- Dib-Hajj SD, Tyrrell L, Escayg A, Wood PM, Meisler MH, Waxman SG. Coding sequence, genomic organization, and conserved chromosomal localization of the mouse gene Scn11a encoding the sodium channel NaN. Genomics. 1999a;59:309–318. doi: 10.1006/geno.1999.5890. [DOI] [PubMed] [Google Scholar]
- Dib-Hajj SD, Fjell J, Cummins TR, Zheng Z, Fried K, LaMotte R, Black JA, Waxman SG. Plasticity of sodium channel expression in DRG neurons in the chronic constriction injury model of neuropathic pain. Pain. 1999b;83:591–600. doi: 10.1016/S0304-3959(99)00169-4. [DOI] [PubMed] [Google Scholar]
- Dib-Hajj SD, Tyrrell L, Waxman SG. Structure of the sodium channel gene SCN11A: evidence for intron-to-exon conversion model and implications for gene evolution. Mol. Neurobiol. 2002;26:235–250. doi: 10.1385/MN:26:2-3:235. [DOI] [PubMed] [Google Scholar]
- Djouhri L, Fang X, Okuse K, Wood JN, Berry CM, Lawson SN. The TTX-resistant sodium channel Nav1.8 (SNS/PN3): expression and correlation with membrane properties in rat nociceptive primary afferent neurons. J. Physiol. 2003;550:739–752. doi: 10.1113/jphysiol.2003.042127. [DOI] [PMC free article] [PubMed] [Google Scholar]
- Doan LL, Porter SD, Duan Z, Flubacher MM, Montoya D, Tsichlis PN, Horwitz M, Gilks CB, Grimes HL. Targeted transcriptional repression of Gfi1 by GFI1 and GFI1B in lymphoid cells. Nucleic Acids Res. 2004;32:2508–2519. doi: 10.1093/nar/gkh570. [DOI] [PMC free article] [PubMed] [Google Scholar]
- Drews VL, Lieberman AP, Meisler MH. Multiple transcripts of sodium channel SCN8A (Na(V)1.6) with alternative 5′- and 3′-untranslated regions and initial characterization of the SCN8A promoter. Genomics. 2005;85:245–257. doi: 10.1016/j.ygeno.2004.09.002. [DOI] [PubMed] [Google Scholar]
- Drews VL, Shi K, de Haan G, Meisler MH. Identification of evolutionarily conserved, functional noncoding elements in the promoter region of the sodium channel gene SCN8A. Mamm. Genome. 2007;18:723–731. doi: 10.1007/s00335-007-9059-8. [DOI] [PMC free article] [PubMed] [Google Scholar]
- Duan Z, Horwitz M. Targets of the transcriptional repressor oncoprotein Gfi-1. Proc. Natl. Acad. Sci. USA. 2003;100:5932–5937. doi: 10.1073/pnas.1031694100. [DOI] [PMC free article] [PubMed] [Google Scholar]
- Fang X, Djouhri L, McMullan S, Berry C, Okuse K, Waxman SG, Lawson SN. trkA is expressed in nociceptive neurons and influences electrophysiological properties via NaV1.8 expression in rapidly conducting nociceptors. J. Neurosci. 2005;25:4868–4878. doi: 10.1523/JNEUROSCI.0249-05.2005. [DOI] [PMC free article] [PubMed] [Google Scholar]
- Geiser M, Cebe R, Drewello D, Schmitz R. Integration of PCR fragments at any specific site within cloning vectors without the use of restriction enzymes and DNA ligase. Biotechniques. 2001;31:88–90. 92. doi: 10.2144/01311st05. [DOI] [PubMed] [Google Scholar]
- Goldin AL. Evolution of voltage-gated Na(+) channels. J. Exp. Biol. 2002;205:575–584. doi: 10.1242/jeb.205.5.575. [DOI] [PubMed] [Google Scholar]
- Groot M, Boxer LM, Thiel G. Nerve growth factor- and epidermal growth factor-regulated gene transcription in PC12 pheochromocytoma and INS-1 insulinoma cells. Eur. J. Cell Biol. 2000;79:924–935. doi: 10.1078/0171-9335-00126. [DOI] [PubMed] [Google Scholar]
- Gustafson TA, Clevinger EC, O'Neill TJ, Yarowsky PJ, Krueger BK. Mutually exclusive exon splicing of type III brain sodium channel alpha subunit RNA generates developmentally regulated isoforms in rat brain. J. Biol. Chem. 1993;268:18648–18653. [PubMed] [Google Scholar]
- Hong S, Wiley JW. Early painful diabetic neuropathy is associated with differential changes in the expression and function of vanilloid receptor 1. J. Biol. Chem. 2005;280:618–627. doi: 10.1074/jbc.M408500200. [DOI] [PubMed] [Google Scholar]
- Ikeda SR. Expression of G-protein signaling components in adult mammalian neurons by microinjection. Methods Mol. Biol. 2004;259:167–181. doi: 10.1385/1-59259-754-8:167. [DOI] [PubMed] [Google Scholar]
- Ishiguro H, Kim KS, Joh TH. Identification of a negative regulatory element in the 5′-flanking region of the human dopamine beta-hydroxylase gene. Brain Res. Mol. Brain Res. 1995;34:251–261. doi: 10.1016/0169-328x(95)00170-w. [DOI] [PubMed] [Google Scholar]
- Jarvis MF, Honore P, Shieh CC, Chapman M, Joshi S, Zhang XF, Kort M, Carroll W, Marron B, Atkinson R, Thomas J, Liu D, Krambis M, Liu Y, McGaraughty S, Chu K, Roeloffs R, Zhong C, Mikusa JP, Hernandez G, Gauvin D, Wade C, Zhu C, Pai M, Scanio M, Shi L, Drizin I, Gregg R, Matulenko M, Hakeem A, Gross M, Johnson M, Marsh K, Wagoner PK, Sullivan JP, Faltynek CR, Krafte DS. A-803467, a potent and selective Nav1.8 sodium channel blocker, attenuates neuropathic and inflammatory pain in the rat. Proc Natl Acad Sci USA. 2007;104:8520–8526. doi: 10.1073/pnas.0611364104. [DOI] [PMC free article] [PubMed] [Google Scholar]
- Julius D, Basbaum AI. Molecular mechanisms of nociception. Nature. 2001;413:203–210. doi: 10.1038/35093019. [DOI] [PubMed] [Google Scholar]
- Kent WJ. BLAT--the BLAST-like alignment tool. Genome Res. 2002;12:656–664. doi: 10.1101/gr.229202. [DOI] [PMC free article] [PubMed] [Google Scholar]
- Kerr NC, Holmes FE, Wynick D. Novel isoforms of the sodium channels Nav1.8 and Nav1.5 are produced by a conserved mechanism in mouse and rat. J. Biol. Chem. 2004;279:24826–24833. doi: 10.1074/jbc.M401281200. [DOI] [PMC free article] [PubMed] [Google Scholar]
- Kim CS, Hwang CK, Choi HS, Song KY, Law PY, Wei LN, Loh HH. Neuron-restrictive silencer factor (NRSF) functions as a repressor in neuronal cells to regulate the mu opioid receptor gene. J. Biol. Chem. 2004;279:46464–46473. doi: 10.1074/jbc.M403633200. [DOI] [PubMed] [Google Scholar]
- Kim SM, Yang JW, Park MJ, Lee J-K, Kim SU, Lee YS, Lee MA. Regulation of human tyrosine hydroxylase gene by neuron-restrictive silencer factor. Biochem. Biophys. Res. Commun. 2006;346:426–435. doi: 10.1016/j.bbrc.2006.05.142. [DOI] [PubMed] [Google Scholar]
- Kozak M. Selection of initiation sites by eucaryotic ribosomes: effect of inserting AUG triplets upstream from the coding sequence for preproinsulin. Nucleic Acids Res. 1984;12:3873–3893. doi: 10.1093/nar/12.9.3873. [DOI] [PMC free article] [PubMed] [Google Scholar]
- Kraner SD, Chong JA, Tsay HJ, Mandel G. Silencing the type II sodium channel gene: a model for neural-specific gene regulation. Neuron. 1992;9:37–44. doi: 10.1016/0896-6273(92)90218-3. [DOI] [PubMed] [Google Scholar]
- Kraner SD, Rich MM, Kallen RG, Barchi RL. Two E-boxes are the focal point of muscle-specific skeletal muscle type 1 Na+ channel gene expression. J. Biol. Chem. 1998;273:11327–11334. doi: 10.1074/jbc.273.18.11327. [DOI] [PubMed] [Google Scholar]
- Kraner SD, Rich MM, Sholl MA, Zhou H, Zorc CS, Kallen RG, Barchi RL. Interaction between the skeletal muscle type 1 Na+ channel promoter E-box and an upstream repressor element. Release of repression by myogenin. J. Biol. Chem. 1999;274:8129–8136. doi: 10.1074/jbc.274.12.8129. [DOI] [PubMed] [Google Scholar]
- Lai J, Gold MS, Kim CS, Bian D, Ossipov MH, Hunter JC, Porreca F. Inhibition of neuropathic pain by decreased expression of the tetrodotoxin-resistant sodium channel, Nav1.8. Pain. 2002;95:143–152. doi: 10.1016/s0304-3959(01)00391-8. [DOI] [PubMed] [Google Scholar]
- Lai J, Porreca F, Hunter JC, Gold MS. Voltage-gated sodium channels and hyperalgesia. Annu. Rev. Pharmacol. Toxicol. 2004;44:371–397. doi: 10.1146/annurev.pharmtox.44.101802.121627. [DOI] [PubMed] [Google Scholar]
- Laird JM, Souslova V, Wood JN, Cervero F. Deficits in visceral pain and referred hyperalgesia in Nav1.8 (SNS/PN3)-null mice. J. Neurosci. 2002;22:8352–8356. doi: 10.1523/JNEUROSCI.22-19-08352.2002. [DOI] [PMC free article] [PubMed] [Google Scholar]
- Lu CM, Eichelberger JS, Beckman ML, Schade SD, Brown GB. Isolation of the 5′-flanking region for human brain sodium channel subtype II alpha-subunit. J. Mol. Neurosci. 1998;11:179–182. doi: 10.1385/JMN:11:3:179. [DOI] [PubMed] [Google Scholar]
- Lunyak VV, Burgess R, Prefontaine GG, Nelson C, Sze SH, Chenoweth J, Schwartz P, Pevzner PA, Glass C, Mandel G, Rosenfeld MG. Corepressor-dependent silencing of chromosomal regions encoding neuronal genes. Science. 2002;298:1747–1752. doi: 10.1126/science.1076469. [DOI] [PubMed] [Google Scholar]
- Mandel G, Cooperman SS, Maue RA, Goodman RH, Brehm P. Selective induction of brain type II Na+ channels by nerve growth factor. Proc. Natl. Acad. Sci. USA. 1988;85:924–928. doi: 10.1073/pnas.85.3.924. [DOI] [PMC free article] [PubMed] [Google Scholar]
- Maue RA, Kraner SD, Goodman RH, Mandel G. Neuron-specific expression of the rat brain type II sodium channel gene is directed by upstream regulatory elements. Neuron. 1990;4:223–231. doi: 10.1016/0896-6273(90)90097-y. [DOI] [PubMed] [Google Scholar]
- Mieda M, Haga T, Saffen DW. Expression of the rat m4 muscarinic acetylcholine receptor gene is regulated by the neuron-restrictive silencer element/repressor element 1. J. Biol. Chem. 1997;272:5854–5860. doi: 10.1074/jbc.272.9.5854. [DOI] [PubMed] [Google Scholar]
- Nassar MA, Levato A, Stirling LC, Wood JN. Neuropathic pain develops normally in mice lacking both Nav1.7 and Nav1.8. Mol. Pain. 2005;1:24. doi: 10.1186/1744-8069-1-24. [DOI] [PMC free article] [PubMed] [Google Scholar]
- Ogata K, Jeong SY, Murakami H, Hashida H, Suzuki T, Masuda N, Hirai M, Isahara K, Uchiyama Y, Goto J, Kanazawa I. Cloning and expression study of the mouse tetrodotoxin-resistant voltage-gated sodium channel alpha subunit NaT/Scn11a. Biochem. Biophys. Res. Commun. 2000;267:271–277. doi: 10.1006/bbrc.1999.1858. [DOI] [PubMed] [Google Scholar]
- Oh Y, Waxman SG. Novel splice variants of the voltage-sensitive sodium channel alpha subunit. Neuroreport. 1998;9:1267–1272. doi: 10.1097/00001756-199805110-00002. [DOI] [PubMed] [Google Scholar]
- Okuse K, Chaplan SR, McMahon SB, Luo ZD, Calcutt NA, Scott BP, Akopian AN, Wood JN. Regulation of expression of the sensory neuron-specific sodium channel SNS in inflammatory and neuropathic pain. Mol. Cell. Neurosci. 1997;10:196–207. doi: 10.1006/mcne.1997.0657. [DOI] [PubMed] [Google Scholar]
- Plummer NW, McBurney MW, Meisler MH. Alternative splicing of the sodium channel SCN8A predicts a truncated two-domain protein in fetal brain and non-neuronal cells. J. Biol. Chem. 1997;272:24008–24015. doi: 10.1074/jbc.272.38.24008. [DOI] [PubMed] [Google Scholar]
- Poiraud E, Gruszczynski C, Porteu A, Cambier H, Escurat M, Koulakoff A, Kahn A, Berwald-Netter Y, Gautron S. The Na-G ion channel is transcribed from a single promoter controlled by distinct neuron- and Schwann cell-specific DNA elements. J. Neurochem. 1999;73:2575–2585. doi: 10.1046/j.1471-4159.1999.0732575.x. [DOI] [PubMed] [Google Scholar]
- Porreca F, Lai J, Bian D, Wegert S, Ossipov MH, Eglen RM, Kassotakis L, Novakovic S, Rabert DK, Sangameswaran L, Hunter JC. A comparison of the potential role of the tetrodotoxin-insensitive sodium channels, PN3/SNS and NaN/SNS2, in rat models of chronic pain. Proc. Natl. Acad. Sci. USA. 1999;96:7640–7644. doi: 10.1073/pnas.96.14.7640. [DOI] [PMC free article] [PubMed] [Google Scholar]
- Raymond CK, Castle J, Garret-Engele P, Armour CD, Kan Z, Tsinoremas N, Johnson JM. Expression of alternatively spliced sodium channel α-subunit genes. J. Biol. Chem. 2004;279:46234–26241. doi: 10.1074/jbc.M406387200. [DOI] [PubMed] [Google Scholar]
- Ren H, Stiles GL. Posttranscriptional mRNA processing as a mechanism for regulation of human A1 adenosine receptor expression. Proc. Natl. Acad. Sci. USA. 1994;91:4864–4866. doi: 10.1073/pnas.91.11.4864. [DOI] [PMC free article] [PubMed] [Google Scholar]
- Renganathan M, Cummins TR, Waxman SG. Contribution of Nav1.8 sodium channels to action potential electrogenesis in DRG neurons. J. Neurophysiol. 2001;86:629–640. doi: 10.1152/jn.2001.86.2.629. [DOI] [PubMed] [Google Scholar]
- Roza C, Laird JM, Souslova V, Wood JN, Cervero F. The tetrodotoxin-resistant Na+ channel Nav1.8 is essential for the expression of spontaneous activity in damaged sensory axons of mice. J. Physiol. 2003;550(Pt 3):921–926. doi: 10.1113/jphysiol.2003.046110. [DOI] [PMC free article] [PubMed] [Google Scholar]
- Sangamaswaren L, Delgado SG, Fish LM, Koch RD, Jakeman LB, Stewart GR, Sze P, Hunter JC, Eglen RM, Herman RC. Structure and function of a novel voltage-gated tetrodotoxin-resistant sodium channel specific to sensory neurons. J. Biol. Chem. 1996;271:5953–5956. doi: 10.1074/jbc.271.11.5953. [DOI] [PubMed] [Google Scholar]
- Sarao R, Gupta SK, Auld VJ, Dunn RJ. Developmentally regulated alternative RNA splicing of rat brain sodium channel mRNAs. Nucleic Acids Res. 1991;19:5673–5679. doi: 10.1093/nar/19.20.5673. [DOI] [PMC free article] [PubMed] [Google Scholar]
- Schade SD, Brown GB. Identifying the promoter region of the human brain sodium channel subtype II gene (SCN2A) Brain Res. Mol. Brain Res. 2000;81:187–190. doi: 10.1016/s0169-328x(00)00145-5. [DOI] [PubMed] [Google Scholar]
- Schoenherr CJ, Paquette AJ, Anderson DJ. Identification of potential target genes for the neuron-restrictive silencer factor. Proc. Natl. Acad. Sci. USA. 1996;93:9881–9886. doi: 10.1073/pnas.93.18.9881. [DOI] [PMC free article] [PubMed] [Google Scholar]
- Schofield GG, Ikeda SR. Sodium and calcium currents of acutely isolated adult rat superior cervical ganglion neurons. Pflugers Arch. 1988;411:481–490. doi: 10.1007/BF00582368. [DOI] [PubMed] [Google Scholar]
- Shang LL, Dudley SC., Jr Tandem promoters and developmentally regulated 5′- and 3′-mRNA untranslated regions of the mouse Scn5a cardiac sodium channel. J. Biol. Chem. 2005;280:933–940. doi: 10.1074/jbc.M409977200. [DOI] [PubMed] [Google Scholar]
- Sheng ZH, Zhang H, Barchi RL, Kallen RG. Molecular cloning and functional analysis of the promoter of rat skeletal muscle voltage-sensitive sodium channel subtype 2 (rSkM2): evidence for muscle-specific nuclear protein binding to the core promoter. DNA Cell Biol. 1994;13:9–23. doi: 10.1089/dna.1994.13.9. [DOI] [PubMed] [Google Scholar]
- Shiokawa D, Tanuma S. Differential DNases are selectively used in neuronal apoptosis depending on the differentiation state. Cell Death Diff. 2004;11:1112–1120. doi: 10.1038/sj.cdd.4401454. [DOI] [PubMed] [Google Scholar]
- Sleeper AA, Cummins TR, Dib-Hajj SD, Hormuzdiar W, Tyrrell L, Waxman SG, Black JA. Changes in expression of two tetrodotoxin-resistant sodium channels and their currents in dorsal root ganglion neurons after sciatic nerve injury but not rhizotomy. J. Neurosci. 2000;20:7279–7289. doi: 10.1523/JNEUROSCI.20-19-07279.2000. [DOI] [PMC free article] [PubMed] [Google Scholar]
- Souslova VA, Fox M, Wood JN, Akopian AN. Cloning and characterization of a mouse sensory neuron tetrodotoxin-resistant voltage-gated sodium channel gene, Scn10a. Genomics. 1997;41:201–209. doi: 10.1006/geno.1997.4669. [DOI] [PubMed] [Google Scholar]
- Thomas M, Lu JJ, Ge Q, Zhang C, Chen J, Klibanov AM. Full deacylation of polyethylenimine dramatically boosts its gene delivery efficiency and specificity to mouse lung. Proc. Natl. Acad. Sci. 2005;102:5679–5684. doi: 10.1073/pnas.0502067102. [DOI] [PMC free article] [PubMed] [Google Scholar]
- Thompson W, Palumbo MJ, Wasserman WW, Liu JS, Lawrence CE. Decoding human regulatory circuits. Genome Res. 2004;14:1967–1974. doi: 10.1101/gr.2589004. [DOI] [PMC free article] [PubMed] [Google Scholar]
- Voss SD, Schlokat U, Gruss P. The role of enhancers in the regulation of cell-type-specific transcriptional control. Trends Biochem. Sci. 1986;11:287–289. [Google Scholar]
- Waxman SG. Transcriptional channelopathies: an emerging class of disorders. Nat. Rev. Neurosci. 2001;2:652–659. doi: 10.1038/35090026. [DOI] [PubMed] [Google Scholar]
- Xing J, Kornhauser JM, Xia Z, Thiele EA, Greenberg ME. Nerve growth factor activates extracellular signal-regulated kinase and p38 mitogen-activated protein kinase pathways to stimulate CREB serine 133 phosphorylation. Mol. Cell. Biol. 1998;18:1946–1955. doi: 10.1128/mcb.18.4.1946. [DOI] [PMC free article] [PubMed] [Google Scholar]
- Xue Q, Jong B, Chen T, Schumacher MA. Transcription of rat TRPV1 utilizes a dual promoter system that is positively regulated by nerve growth factor. J. Neurochem. 2007;101:212–222. doi: 10.1111/j.1471-4159.2006.04363.x. [DOI] [PubMed] [Google Scholar]
- Yang P, Kupershmidt S, Roden DM. Cloning and initial characterization of the human cardiac sodium channel (SCN5A) promoter. Cardiovasc. Res. 2004;61:56–65. doi: 10.1016/j.cardiores.2003.09.030. [DOI] [PubMed] [Google Scholar]
Associated Data
This section collects any data citations, data availability statements, or supplementary materials included in this article.
Supplementary Materials
SFig1: Sequences of the 5’RACE products used to determine 5’UTR structure of the Scn10a transcript. Numbers correspond to structures from figure 1B. Start (yellow) and stop (red) codons are indicated (gray are overlaps). Green ATG is translation start of the Nav1.8 protein and sequences are presented in frame with that codon. Vertical black lines indicate exon boundaries and black bars above sequence indicate transcription start sites in RACE derived sequences. Underlined sequence represents exon 1 extension in (1)(red bar in figure 1. Panel B shows a cartoon of the structures in panel A with frames of start and stop codons indicated. Numbers correspond to structures in Figure 1B and numerous upstream in frame and out of frame start codons and small open reading frames are apparent and variable due to splicing.
SFig2: Homology between rat and mouse Scn10a promoter is extensive (continuation of Figure 3 main text). Alignment of flanking regions from approximately −0.85kb to −3.7kb with respect to the mouse sequence is shown. Some putative transcription factor binding sites are noted out to about −1.1kb and a few in the SNSRE EGFP assigned region (yellow). Numbered black bars indicate the positions of deletion fragments used in the reporter experiments. Potential NRSEs are boldface and italicized. Upper case indicates homology with the NRSE listed below the site (homology is again indicated next to the site name and “m”= mouse, “r”= rat) and red bars above a site indicates a negative orientation. NRSE sites and alignments used for this comparison are listed in SuppFig3.
SFig3: Panel A: Sequences of tissue specific elements used in low stringency searches of promoter region and indicated in SFig2 (M4 muscarinic receptor (Mieda et al. 1997); dopamine beta hydroxylase (Ishiguro et al. 1995); Synapsin, SCG10, Scn2a (Schoenherr et al. 1996); human tyrosine hydroxylase (Kim et al. 2006)). A consensus NRSE from the subsequence list of MacVector® was also used. Panel B: Shows the alignment of each putative restrictive element from SFig2 with the most homologous element(s). Matching bases are shown in upper case. The Scn10a element at −2.10 matches 13/21 positions of two elements from panel A. Bold bases indicate differences in alignments between the Scn10a and the hSYN and M4 elements.
SFig4: Expression of EGFP in N1E115 cells following transfection of dual cassette viral shuttle vector. As noted in the text some weak expression of EGFP was apparent upon infection of N1E115 cells with a dual reporter construct. The transfection shown was intended to mimic infection of N1E115 cells. Cell at bottom left illustrates a leak of dsRED from nucleus and bleedover to green channel. Cell in center does not appear to leak from nucleus yet shows detectable green in cytoplasm. Cells were imaged using a 60x (1.4 NA) oil-immersion objective mounted on a Nikon TE-2000U inverted fluorescence microscope, a 12-bit cooled CCD camera (Orca-ER, Hamamatsu, Japan) and Volocity 4 software (Improvision Inc., Lexington, MA).